~ issues in the delivery of ~ commonwealthsocial support...
TRANSCRIPT

CommonwealthSocial SupportProgramstoFarmFamilies
~ Issues in the del ivery of ~
AuthorsJayne Garnaut
Judith Robinson
Milly Lubulwa
ABARE RESEARCH REPORT 97.7

© Commonwealth of Australia 1997
This work is copyright. The Copyright Act 1968 permits fair dealing forstudy, research, news reporting, criticism or review. Selected passages,tables or diagrams may be reproduced for such purposes providedacknowledgment of the source is included. Major extracts or the entiredocument may not be reproduced by any process without the writtenpermission of the Executive Director, ABARE.
ISSN 1037-8286ISBN 0 642 26612 3
Garnaut, J., Robinson, J. and Lubulwa, M. 1997, Issues in the Delivery ofCommonwealth Social Support Programs to Farm Families, ABAREResearch Report 97.7, Canberra.
Australian Bureau of Agricultural and Resource EconomicsGPO Box 1563 Canberra 2601
Telephone +61 2 6272 2000 Facsimile +61 2 6272 2001Internet www.abare.gov.au
ABARE is a professionally independent government economic researchagency.
ABARE projects 1256, 1326

Foreword
Low commodity prices in the early 1990s, combined with widespreaddrought in 1993-94, continued the long term downward trend in the net valueof farm production and income in Australia of the past four decades. Thisaccentuated the need of farm families for fair and equitable access to socialsupport programs provided by the Commonwealth government.
Anecdotal evidence has suggested that farm families have a poor level ofunderstanding of Commonwealth social support programs, indicating a needfor research into farmers’ knowledge and use of these programs. TheCommonwealth government commissioned ABARE to conduct a two stagestudy into the social and financial circumstances of farm families and theirinvolvement (or lack of involvement) with government social supportprograms. A special survey provided information on the demography andfinancial situation of farm families, along with what they know aboutexisting Commonwealth social support and related programs and how theyuse such programs. Statistical analysis was used to predict the likely outcomefor certain groups of farm families if they had applied for governmentsupport. In this report, living standards are examined through qualitative andquantitative analysis.
The second stage involved designing in-depth interviews to draw out issuesin the design and delivery of Commonwealth social support programs tofarm families. These interviews with twelve farm families chosen from thesurvey sample provided insights into issues highlighted by the telephonesurvey. They allowed farm families’ knowledge of, use of, and access toCommonwealth support programs to be examined in a manner not possiblein a large scale survey.
The analysis presented will enable more rigorous examination of issues offarm family welfare and government policy options.
STEPHEN C. BEARE
Acting Executive Director
October 1997
iii

Acknowledgments
The project was undertaken for the Rural Division of the Department ofPrimary Industries and Energy, which acted as secretariat for a SteeringCommittee which included Fiona Smart (Department of Social Security);Eileen Newmarch, Joe Caldwell and Rickman Lilienthal (Department ofEmployment, Education, Training and Youth Affairs); Onko Kingma andBernard Scott (Rural Division of the Department of Primary Industries andEnergy); Matthew Taylor and Tim Andrie (Department of Finance);Michelle Withers (Attorney-General’s Department); and Bill Curran, VinceO’Donnell and Jayne Garnaut (ABARE).
Nationally, over 3500 farm householders cooperated with ABARE’s teamof interviewers to provide the telephone survey information contained in thisreport. The twelve farm families interviewed at their farms were generouswith their time and information. The case studies would not have beenpossible without their cooperation and assistance. Information for preparingthe in-depth interviews was sought from counsellors in rural areas who workwith farmers facing financial difficulties: Clive Sefton (Rural Counsellor,Castlereagh Advisory Centre, Gilgandra), Kathy Sims (Rural Counsellor,Macquarie Rural Advisory Service, Dubbo) and Noel Parkes (Director,Lifeline, Darling Downs and South West Queensland) advised on the currentneeds of farmers from their perspective as counsellors.
The telephone survey questionnaire was developed with advice frommembers of the Steering Committee. A large number of ABARE officersalso made important contributions to the project, including Steve Beare, KenColbert, Catherine Cook-Wass, Caroline Corder, Bill Curran, CarolynDoyle, Jane Gooday, Phil Kokic, Ray Lindsay, Theresa Muller, VinceO’Donnell, Bhamathy Parameswaran, Paul Phillips, Craig Pollard, JudithRobinson and Vern Rudwick.
The authors are also grateful to Ian Williams (Australian Valuation Office)for providing aggregate data on the valuations of farm properties.
iv ABARE research report 97.7

Contents
Summary 1
1 Introduction 10
2 Government programs during the survey period 14Programs 14Assets and income assessment 18
3 Economic conditions in the survey period 21
4 Demographic and locational profile 24Number of farms and household size 24Age and gender distribution 27Employment and education status 28Rural, remote and metropolitan locations 30
5 Assets and income profiles and assets valuation 32Household assets and income 32Modified household assets and income 34Assets valuation 34
6 Awareness and use of programs 38Target households 38Awareness of programs 39Awareness of hardship tests 39Awareness and location 41Sources of information about programs 45Use of programs 46
7 Reasons for nonapplication 51
8 Reasons for rejection of application 53
vSocial support programs

9 Potential eligibility 55Predictive analysis 57Location of selected household groups 59Potential eligibility – another approach 60
10 Quality of service 62Ratings 62In-depth interviews 63
11 Material wellbeing and health 64Wellbeing scale 64Wellbeing, assets and income 65Wellbeing of selected household groups 66Qualitative responses from survey 68Health 73In-depth interviews 75
12 Young people and education 76
13 Major findings and discussion 81Awareness of programs 81Take-up and rejection rates 82Nonapplicants who were potentially eligible 83Householders likely to need support 85Assets testing 86Financial management 88Knowledge or understanding of programs 88Service delivery 90Location 91Education participation and achievement 92Utility of the prediction model and the wellbeing scale 92
14 Conclusion 94
AppendixesA Terms of reference 96B Survey method 98C Eligibility for program assistance 115
vi ABARE research report 97.7
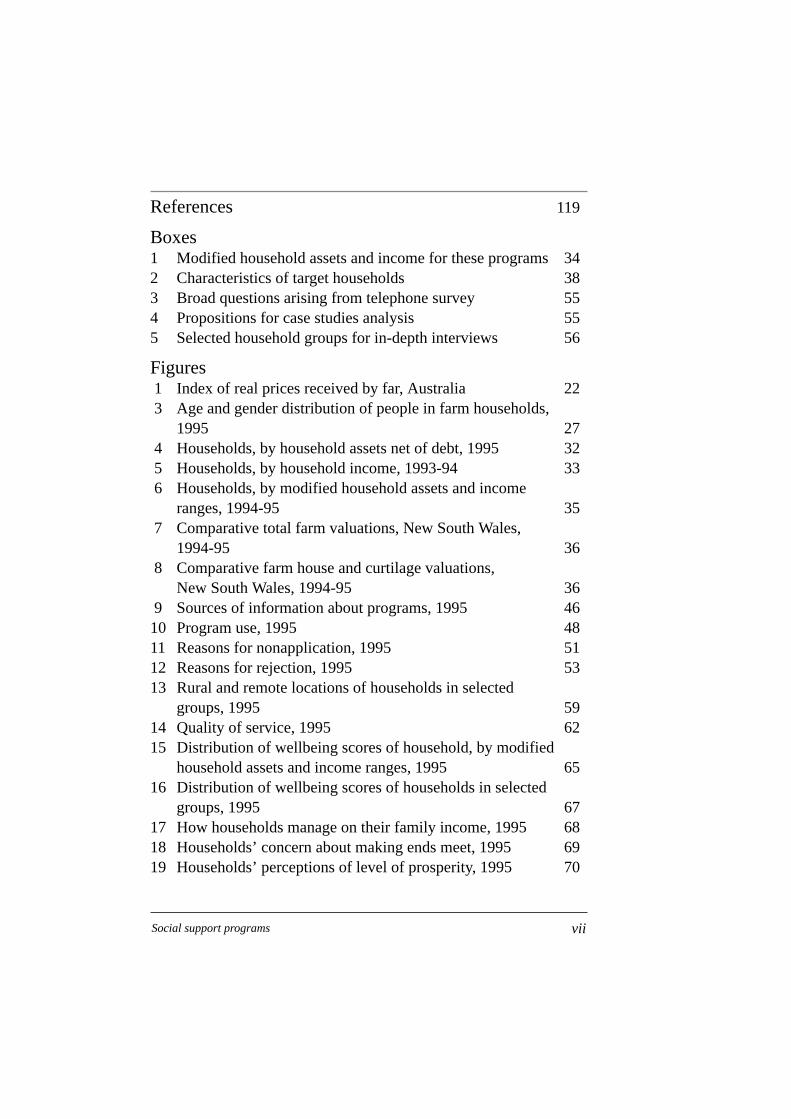
References 119
Boxes1 Modified household assets and income for these programs 342 Characteristics of target households 383 Broad questions arising from telephone survey 554 Propositions for case studies analysis 555 Selected household groups for in-depth interviews 56
Figures1 Index of real prices received by far, Australia 223 Age and gender distribution of people in farm households,
1995 274 Households, by household assets net of debt, 1995 325 Households, by household income, 1993-94 336 Households, by modified household assets and income
ranges, 1994-95 357 Comparative total farm valuations, New South Wales,
1994-95 368 Comparative farm house and curtilage valuations,
New South Wales, 1994-95 369 Sources of information about programs, 1995 4610 Program use, 1995 4811 Reasons for nonapplication, 1995 5112 Reasons for rejection, 1995 5313 Rural and remote locations of households in selected
groups, 1995 5914 Quality of service, 1995 6215 Distribution of wellbeing scores of household, by modified
household assets and income ranges, 1995 6516 Distribution of wellbeing scores of households in selected
groups, 1995 6717 How households manage on their family income, 1995 6818 Households’ concern about making ends meet, 1995 6919 Households’ perceptions of level of prosperity, 1995 70
viiSocial support programs

20 Householders who owned or part owned a dwelling off-farm, 1995 71
21 Households’ ability to obtain $5000 within a week for something important, 1995 71
22 Source of funds for households that could obtain $5000, 1995 72
23 Households cutting back on expenditure, 1995 7324 Households’ assessment of their own health, 1995 7425 Households with private health insurance, 1995 7426 Highest level of education achieved, 1995 7627 Reasons for discontinuing education, 1995 7728 AUSTUDY recipients among full time students, 1995 7729 Households with a child at boarding school during the
previous two years 7830 Households that were behind with boarding school fees
during the previous two years 7931 Distance between household and school, 1995 79B1–4 Telephone survey questionnaire 99B5 Regression tree analysis for Age Pension payments 110
MapsA Statistical local areas according to rural and remote
location 30B Awareness of Basic Family Payment, by statistical
division, 1995 42C Awareness of Job Search Allowance, by statistical
ivision, 1995 42D Awareness of Age Pension, by statistical division, 1995 43E Awareness of AUSTUDY/ABSTUDY, by statistical division,
1995 43F Awareness of Rural Adjustment Scheme, by statistical
division, 1995 44G Awareness of Drought Relief Payment, by statistical
division, 1995 44
viii ABARE research report 97.7
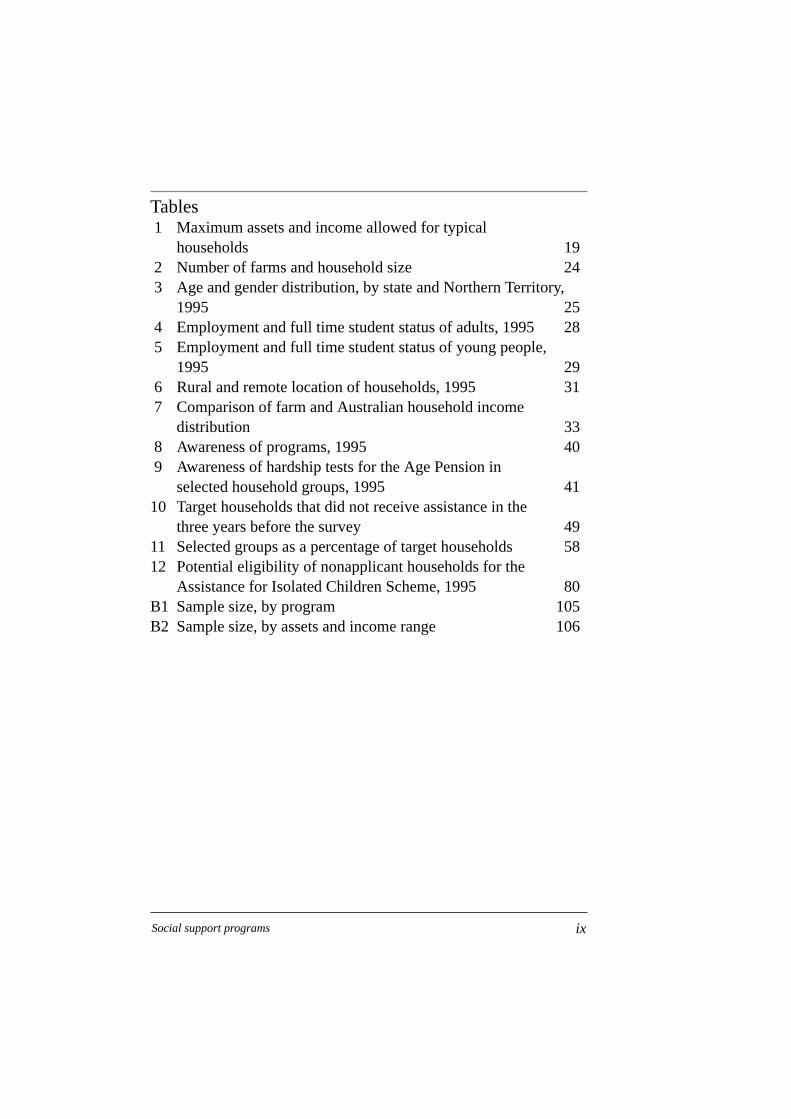
Tables1 Maximum assets and income allowed for typical
households 192 Number of farms and household size 243 Age and gender distribution, by state and Northern Territory,
1995 254 Employment and full time student status of adults, 1995 285 Employment and full time student status of young people,
1995 296 Rural and remote location of households, 1995 317 Comparison of farm and Australian household income
distribution 338 Awareness of programs, 1995 409 Awareness of hardship tests for the Age Pension in
selected household groups, 1995 4110 Target households that did not receive assistance in the
three years before the survey 4911 Selected groups as a percentage of target households 5812 Potential eligibility of nonapplicant households for the
Assistance for Isolated Children Scheme, 1995 80B1 Sample size, by program 105B2 Sample size, by assets and income range 106
ixSocial support programs
Glossary of financial terms
Assessable assets (as used by Commonwealth programs at the time ofthe survey)Assets used to determine eligibility under the particular program provisions.The household unit whose assets are assessed varies between programs asdo the asset components. The assessable value of a home and surroundingdomestic land on a farm often differs from the market value. Some programsassess farm assets as a percentage of their value.
Assessable income (as used by Commonwealth programs)Income used to determine eligibility under the particular programprovisions. The household unit whose income is assessed varies betweenprograms. Adjustments or allowances can be made, for example, accordingto the age, number, partner status and student status of household members.
Farm capital valuationValue of the farm (on a walk-in, walk-out basis) — including the value ofland, buildings, livestock, plant and machinery, grain and wool on hand, andso on — at the time of collection (March–May 1995). The value of privatelyleased land is not included.
Farm debtTotal farm debt (not including non-farm debt) at the time of collection(March–May 1995).
Farm liquid assetsValue of liquid assets owned by the farm business — including interestbearing deposits, shares, bank deposits, debentures, bonds, income equal-isation deposits, and so on — at the time of collection (March–May 1995).
Household net assetsTotal combined on-farm and off-farm assets net of debt of all familymembers, including minors, in the household at the time of data collection(March–May 1995).
x ABARE research report 97.7
Household incomeTotal combined on-farm and off-farm income of all household members(including minors), excluding government sources for the 1994-95 financialyear.
Household non-farm debtHousehold’s total non-farm debt at the time of collection (March–May1995).
Household non-farm liquid assetsPresent value of liquid assets (which are not part of the farm business) ownedby members of the household, including interest bearing deposits, shares,bank deposits, debentures, bonds, and so on).
Household non-farm, non-liquid assetsValue of any assets owned by the household (not the farm business) that arenot readily convertible to cash, including real estate, business, and so on.
Household off-farm incomeOff-farm income for this household in 1993-94, excluding governmentassistance but including any income from rents, dividends, wages, share ofother business profits or losses, and so on).
Modified household assetsHousehold assets minus $150 000 (this amount being the assumed value ofthe domestic home on all farms). AUSTUDY includes only 50 per cent of farmassets in its measure.
Modified household income for AUSTUDY
Household income minus allowances under AUSTUDY provisions for thenumber and age of dependent children.
Net farm incomeIncome received from the farm (after business costs but before tax) by themembers of this household in 1993-94, including any wages and salariespaid to household members by the farm business.
xiSocial support programs
Summary
This study of farm families was commissioned by the Commonwealthgovernment to examine issues of delivery of Commonwealth social supportprograms to people in rural areas, and to provide a database for ongoingpolicy development. The study was undertaken in two stages in 1995: first,a telephone survey and analysis of almost 3500 farm households relating tofourteen Commonwealth programs; and, second, a case studies analysisexamining some broad questions arising from the initial survey analysis.
The case studies involved in-depth interviews with twelve households aswell as further statistical analysis of the survey data using a predictive modeland wellbeing analysis.
The prediction model and the wellbeing scale used appear to be useful toolsfor identifying issues in the delivery and development of Commonwealthsocial support programs which need further investigation. The predictionmodel was highly accurate in predicting actual recipients of programsupport, with a probability of 89–96 per cent. The predictions of recipientsamong nonapplicant households were also consistent with the measuresmade using the wellbeing scale.
Overall, the study showed that Commonwealth social support programswere widely used by farm families. It also showed that there were somedeficiencies in the delivery of these programs.
Demographic and locational profileIn 1995, an estimated 451 000 people were living in the main households ofAustralian broadacre and dairy farms with an estimated value of agriculturaloperations greater than $5000. Around 10.5 per cent of the surveyedpopulation was over retirement age compared with 13 per cent in theAustralian population. However, there were proportionately more peopleover retirement age living in subcommercial farm households (15.1 per cent)than in commercial farm households (9.5 per cent). A further demographicfeature was that 38 per cent fewer women than men fell in the group aged18–21 years (including full time students living away from home).
1Social support programs

Eighty-one per cent of surveyed households were in zones designated asrural, while 13 per cent were located in remote zones and the remainder wereclose to metropolitan cities.
Financial profileNo national data exist on assets levels, but anecdotal evidence suggests thataverage farm household assets were above the national average. Manysurveyed households had substantial assets, with 14 per cent reporting morethan $1 million in assets (including the domestic home and net of debt) atthe time of the survey in 1995. However, 42 per cent reported total householdassets of less than $350 000.
The proportion of farm households with nominal household incomes (net ofbusiness costs and before tax) above $40 000 in 1993-94 was similar to thatof the total Australian population in 1991. Twenty per cent of farm house-holds surveyed had household incomes below $10 000; most of these wouldhave been eligible on income grounds alone for support from the fourteenprograms considered.
After excluding an average value for the domestic home, around 14 per centof surveyed households had household assets below $350 000 and householdincomes below $15 000. Generally, households with the highest assets inthis group would have been ineligible under most program assets tests buteligible under income tests. Most households with full time students wouldhave been eligible for AUSTUDY on assets and income grounds.
Income and assets values during the survey period were likely to be lowerthan usual for a large number of farm households given a combination oflow commodity prices in the early 1990s and widespread drought during1993-94. However, there has been a long term downward decline in the netvalue of farm production, with fluctuations commonly occurring either sideof the trend line. The downturn during the survey period was not unusual inthis context, and similar or even lower levels of income can be expected inthe future.
Material wellbeingMaterial wellbeing was examined by a wellbeing score developed from anumber of measures which were being assessed by the Department of SocialSecurity at the time of the study. Differences in material wellbeing scores
2 ABARE research report 97.7

between households of different assets and income combinations reflectedthe broad differences in wellbeing that might be expected — for example,wellbeing scores tended to be lower for households with lower assets andincomes and higher for those with higher assets and incomes.
Further, for all programs, the wellbeing scores of households whoseapplication had been rejected were higher than those of households who hadreceived assistance. It is noteworthy that the distribution of wellbeing scoresfor households that were predicted recipients but unaware of a program wassimilar to the distribution of scores for households that had received supportfrom the program. The median score of predicted recipients that were awareof the Age Pension and AUSTUDY, was between the median scores of actualrecipients and rejected applicants. However, for the Basic Family Payment,the median score of predicted recipients was higher than those for actualrecipients and rejected applications.
High asset values were sometimes associated with low wellbeing scores:around 8 per cent of households with assets worth more than $1 million hadwellbeing scores in the lowest quintile (20 per cent).
Analysis of the survey responses to questions on wellbeing showed that asignificant number of farm households (including those with high assets)were experiencing difficulty. For example, 21 per cent of all households hadcut back on basic food during the previous two years and slightly more thana quarter were concerned about making ends meet ‘all the time’ or ‘often’.The proportion of households with low assets or low incomes experiencingdifficulty was generally higher than for those with high assets or incomes.For example, approximately 28 per cent of households with assets between$50 000 and $100 000 had cut back on basic food in the two years beforethe survey, compared with approximately 13 per cent of households withassets greater than $1 million. Households that were concerned aboutmaking ends meet ‘all the time’ were much more likely to have low incomesthan were households that were not so concerned. Three per cent ofhouseholds with assets between $500 000 and $1 million received help fromwelfare agencies.
The in-depth interviews further indicated living standards and howhouseholds assessed their material wellbeing. Cutting back on basichousehold expenditure was common among households with low incomesand relatively low assets. Measures included reducing cash expenditures byliving off garden produce, severely restricting use of the family vehicle,
3Social support programs

forgoing farm improvements and sometimes reducing expenditure on fodderfor cattle. Some households with higher assets were able to maintain theirstandard of living by increasing their overdraft. The interviewed householdsrarely took holidays, and most on low incomes and low assets said they were‘struggling’ or ‘just getting by’.
Many of those interviewed in-depth who had low living standards did notbelieve they could maintain a viable operation if they subdivided their farm.Others, despite recognising the financial advantage of selling the farm andbuying a home elsewhere to retire, remained as a result of other issues.
Awareness of programsAwareness of social support programs at the national level was generallyhigh for programs administered by the Department of Social Security andthe Department of Employment, Education, Training and Youth Affairs. Itwas lower for programs such as the Sickness Allowance and those ad-ministered by the Department of Primary Industries and Energy.
Ninety-four per cent of households with a young person aged 16–21 yearswere aware of AUSTUDY. A similar proportion of households with a personof retirement age were aware of the Age Pension. However, while 78 percent of households with children were aware of the Basic Family Payment,only 57 per cent were aware of the Additional Family Payment. Sixty-sixper cent of households were aware of the Rural Adjustment Scheme, 39 percent were aware of the Countrylink information service, and 18 per cent wereaware of the Rural Access Program. In Queensland and areas of New SouthWales, South Australia and Tasmania in drought exceptional circumstances,79 per cent of households were aware of the Drought Relief Payment.
There were some important differences in awareness at the state and regionallevel. For example, awareness of the Basic Family Payment and Job Searchamong farm households with at least one child younger than 18 years rangedfrom 45 per cent to 100 per cent at the statistical division level. Awarenessof the Rural Adjustment Scheme (RAS) among households variedconsiderably at the statistical division level in all states from the nationalaverage of 66 per cent. These differences might have resulted from stateshaving different needs, or from communication strategies of some state RASauthorities being less effective than others, both at the state and statisticaldivision level.
4 ABARE research report 97.7

Hardship tests
Hardship tests were designed to meet the needs of those in severe financialdifficulties but unable to meet the assets or income tests. However, most ofthe farm population were unaware of these tests. Three-quarters of targethouseholds for the Age Pension and one-fifth of the target population forJob Search were unaware that hardship tests applied to these programs.
Knowledge or understanding of programsProgram awareness was high for many programs, but knowledge of theseprograms was often scant, nonexistent or incorrect for many of thosehouseholders interviewed in-depth. Some farm families felt they were beingdenied an entitlement when this was unlikely.
Beneficiaries and rejectionsFifty-seven per cent of households with at least one child younger than 18years received the Basic Family Payment at some time during the three yearsbefore the survey, and 45 per cent of households with a person aged 16–21years received AUSTUDY in that time. Twenty-four per cent of householdswith a female aged over 60 years or a male over 65 years received the AgePension during the three years prior to the survey. Twenty-two per cent ofhouseholds in areas of drought exceptional circumstances at the time of thesurvey had received the Drought Relief Payment since its introduction in1994.
A substantial proportion (18 per cent) of households with a person aged16–21 years had had their application for AUSTUDY rejected during the threeyears before the survey. According to respondents, the main reason forrejections from most programs was that their assets were too high — thereason for 95 per cent of rejections for the Age Pension and more than 60per cent of rejections for AUSTUDY.
Nonapplication by potentially eligible householdersThe prediction model suggested that a substantial number of farmhouseholds might have received support had they applied. For householdswith a member of eligible age, an additional 35 per cent might have qualifiedfor the Age Pension, 24 per cent might have qualified for AUSTUDY, and 27per cent might have qualified for the Basic Family Payment. These results
5Social support programs
suggest that many of the respondents who indicated that they knew orassumed that they were ineligible for assistance from a program weremistaken.
Why potentially eligible households do not apply for assistanceEvidence from the in-depth interviews and the statistical analysis suggestseveral reasons for nonapplication by householders who are likely to beeligible might not apply for Commonwealth support. Lack of relevantinformation, including information about the differences in assets andincome provisions between programs and hardship tests, is important.
First, some householders, despite having low assets and/or income did notfeel that they needed assistance. This might have been the case for some ofthe predicted recipients who had higher wellbeing scores than those of actualrecipients.
Second, others overvalued their assets — an issue partly related to theinherent difficulties of valuing farm properties for government socialsupport programs — as discussed below.
A third factor was lack of knowledge of the provisions of the programs. Asmall percentage of households knew almost nothing about programs thatwere likely to be relevant to them. Others were not aware that assets andincome tests differ among the programs: some householders interviewed in-depth indicated that they assume that the same assets test is applied to allCommonwealth programs, whereas these tests vary considerably betweenprograms; and some households with people aged 16–21 years were unawarethat farm assets were discounted by 50 per cent for AUSTUDY, while otherswere unaware that farm assets could be ignored in applications for AUSTUDY
in drought exceptional circumstances areas.
Finally, there also appeared to be an access problem with the Age Pensionin some rural areas: the ratio of predicted to actual recipients was higher inthese areas than elsewhere, but 47 per cent of households with a member ofeligible age reside in these areas.
Farm valuationThe in-depth interviews revealed the difficulties of some householders inproviding reliable valuations of farm assets. The difficulties were com-pounded when there were few, if any, sales in an area to indicate market
6 ABARE research report 97.7

values. Some householders relied on shire rates values, and some familiesprovided a valuation that took into account the capital they would need ifthey were to sell the farm.
It seems that some farm families in severe financial difficulty were notapplying for Commonwealth assistance because there were inherentdifficulties in providing a reliable valuation. Comparative analysis of 1099farm property valuations by Department of Social Security clients and theAustralian Valuation Office in New South Wales in 1994-95 showed that asignificant number of farmers attributed a value to their properties (partic-ularly the home and surrounding land) which would have been substantiallydifferent from an official valuation done for a Commonwealth social supportprogram.
Also, compared with other social security clients, a higher proportion offarmers received less than the maximum allowable payment where benefitswere reduced because of high assets.
Views on the assets testHouseholds interviewed in-depth expressed a range of concerns about assetstesting. Some commented that rural residents were disadvantaged by theexemption of the principal residence, which they saw as having a higheraverage value in cities. Others thought that households with high assets butlow incomes associated with severe downturns should be given moreconsideration. Discussion of the options for selling part of the farm to gainfinancial independence in old age led to issues associated with continuingfarm viability, succession and council subdivision regulations.
Views on service providedGenerally, 80–92 per cent of farm households with some contact with aservice rated the quality of that service as average or better on a five pointrating scale, and 8–20 per cent rated the quality as poor or very poor. Similarratings were given in a separate study by 5 per cent of individuals contactingSocial Security regional offices about Social Security programs.
Other service issuesMany of those interviewed felt that the complexity of farm financialaccounts and social security applications required the engagement of a
7Social support programs

financial professional or accountant. This was a burden on people strugglingto make ends meet.
It is not possible to gauge the extent of a number of problems which emergedfrom the in-depth interviews. Long delays in telephone enquiries wereaccepted by some but irritated others. Negative experiences with one agencywere sometimes generalised to all agencies. A long delay in response to acase of extreme hardship caused severe personal distress in one household.
Needy householders unaware of programsWellbeing scores suggest that eligible nonapplicant farm families who wereunaware of relevant programs were at least as much in need of Common-wealth support as those who were aware. Most in need were elderly people.The circumstances of farm families with little or virtually no knowledge oftarget programs, although a small group, make them a high priority forattention.
Young people and educationSixteen per cent of people aged 16–17 years and 45 per cent of people aged18–21 years who were in full time study were living away from home at thetime of the survey. A higher proportion of those living away from home wereAUSTUDY beneficiaries. Approximately one in three of the estimated 26 000young people aged 16–21 years in full time education were receivingAUSTUDY.
A higher proportion of those aged 16–17 years in farm households were infull time education compared with the same age group in Australia.Compared with young men, a much larger proportion of young women aged18–21 in farm households were in full time education. However, there wasrelatively little difference between the total number of young women (6152)and young men (5708) aged 18–21 years in farm households in full timeeducation.
Approximately 19 per cent of farm households were more than 20 kilometresfrom a primary school and almost half were more than 20 kilometres froma secondary school. Of households that did not apply for assistance from theAssistance for Isolated Children Scheme but had children of eligible age andmet the 56 kilometres distance provision, only 5 per cent were potentiallyeligible for assistance.
8 ABARE research report 97.7

An estimated 14 per cent of households with children of school age hadchildren at boarding school at some time during the two years before thesurvey. Slightly more than one in ten of those households with children atboarding school had been behind with boarding school fees in the two yearsbefore the survey.
ConclusionThis study indicated that many farm households relied on the Common-wealth social support system at the time of survey. However, the researchundertaken for this study indicated that a large number of farm families withincome levels and material wellbeing scores similar to those of actualrecipients were not receiving Commonwealth support. Furthermore, manyof these families were likely to be eligible for Commonwealth assistance,but were not applying for it. It would appear that some did not apply becausethey misunderstood the assets limit for a program, and some did notunderstand that some assets might have been discounted or that the value oftheir home should have been assessed as the value of an equivalent homeand block in the nearest regional centre. Many provided valuations thatwould have differed from official valuations done for the Commonwealthprogram. In this context, methods used to determine property valuationsneeded further examination.
9Social support programs
Introduction
The adequacy and equity of Commonwealth social support for farm familieshas come under increased scrutiny both publicly and within government inrecent years. There is some criticism that social support services do not takeproper account of the characteristics of rural Australia, including the relativeremoteness and the high assets but low incomes of some farm families.
Community consultations undertaken by the National Council for theInternational Year of the Family (1994, pp. 154–61) heard concerns thatassets testing for income support was unfair to farm families. The Depart-ment of Social Security viewed the assets test from its inception as affectingfarm families more than any other group (DSS 1993, p. 15).
Another issue emerging from the International Year of the Family study wasthe need for many young people to pursue their education away from homeand thus deal with a major expense. Similar themes emerged from theparliamentary report of the Senate Rural and Regional Affairs and TransportReferences Committee on assets testing (1995b) and the annual conferenceof the Country Women’s Association in New South Wales (The Land, 1 June1995, p. 59). However, there has been little quantitative informationavailable for more rigorously examining such criticisms.
In December 1994, federal Cabinet considered the needs of farm families indifficulty in drought affected areas during its deliberations on the long termresponse to drought. As a result, ABARE was commissioned to undertakea two stage study through the Commonwealth Department of PrimaryIndustries and Energy to assist government policy makers to developpolicies and programs for farm families and others in rural communities.The first stage was a survey of farm families, and the second was an analysisof case studies to follow the initial survey.
The survey was to ascertain farm families’ knowledge of, access to, and useof existing social welfare and related programs. In meeting these aims, thesurvey was to consider problems in access to programs and services; theresponsiveness of Commonwealth social agencies to the needs of ruralclients; geographic differences in the understanding and take-up of pro-grams; assets and income levels; and living standards.
10
1
ABARE research report 97.7

The terms of reference for the two stages of the study are listed inappendix A.
Responding to the terms of reference, ABARE consulted with the Depart-ment of Social Security, the Department of Employment, Education,Training and Youth Affairs, the Department of Finance, the Attorney-General’s Department and the Department of Primary Industries and Energyto design a questionnaire to collect information from Australian farmers.ABARE selected a sample of farms from all agricultural industries andconducted a telephone survey in March, April and May 1995. The surveyresults were weighted to produce population estimates. The telephonequestionnaire and other details of the survey method are provided inappendix B.
The telephone survey collected information on:
• age, gender and employment of all household members;
• awareness and use of various Commonwealth government programs;
• on-farm and off-farm income, assets and debts;
• standard of living and access to services; and
• participation in education.
Income is the measure most commonly used to indicate relative poverty andliving standards, and is used to assess eligibility for a wide range ofCommonwealth support programs. Assets tests have been introduced forassessment of most programs too. Wealth can modify the effects of incomeon wellbeing — that is, home owners usually enjoy a higher level of well-being than non-homeowners with the same income. Wealth and income canalso be interchangeable. However, income levels (with or without assetslevels or other various adjustments such as for the number of children) donot indicate standard of living necessarily. Qualitative measures have beendeveloped and applied instead of, or in addition to, income to assessstandards of living and need for support (Travers and Richardson 1993). Inthis study, the measures of wellbeing used were similar to those developedfor the Department of Social Security.
Results of the telephone survey raised questions about the decision makingdynamics of farm families when it came to Commonwealth social supportprograms, the nature of farmers’ understanding of the programs, their level
11Social support programs
of material wellbeing, and the means by which the Commonwealthgovernment may be more effective in responding to the needs of farmers inthe design and delivery of their social support programs (Leach 1967; Yin1994).
Questions such as these called for a method of research which couldinvestigate a range of behaviours, experiences and opinions which thetelephone survey was unable to examine. In-depth face to face interviewswith twelve selected farm households allowed examination of the context inwhich farmers provided answers to the telephone survey questions, andhighlighted the complexity of their relationships with Commonwealthsupport programs.
An analysis of the telephone survey data indicated, according to assets andincome criteria, that a substantial proportion of farmers may have beeneligible for support under a number of Commonwealth programs. However,a significant proportion did not apply because they indicated that they knewor assumed that they were not eligible. This suggested a need to furtherexamine farmers’ understanding of the criteria for programs, and their meansof arriving at an estimate of their assets. The survey indicated a fairly highlevel of basic awareness of most of the major Commonwealth social supportprograms, but some farm households were not aware of particular programsat all, and only around a quarter of households were aware of hardship tests.These results suggested a need to further examine farmers’ knowledge ofsocial support programs.
Results and analysis from the telephone survey are presented in this report.An outline of major Commonwealth support programs is given in chapter2, and the economic conditions in the survey period are discussed in chapter3. Demographic, locational profiles and assets and income profiles of farmscovered by the survey are contained in chapters 4 and 5. Results arepresented in chapters 6–9, covering awareness and use of programs (chapter6); reasons for nonapplication (chapter 7); reasons for rejection (chapter 8);potential for wider program use (chapter 9). Details are also provided on thequality of program service (chapter 10); householders’ material wellbeingand health (chapter 11); and their education (chapter 12). The findings fromthe study are discussed in chapter 13. The basis on which the householdswere selected for in-depth interview is described in chapter 9.
Full details of the methods used for the telephone survey and the in-depthinterviews are provided in appendix B.
12 ABARE research report 97.7

Findings and conclusions only from the in-depth household interviews areincluded in this report. Summaries of the interviews have been presented tothe Steering Committee separately.
The results presented are likely to assist policy makers, analysts and programadministrators to improve the targeting of social support (and other) servicesto farm families. They are also likely to help others who wish to considerthis information and demographic and locational detail in work on ruralindustries, adjustment and rural development, for example. The analysismay also assist in improving service delivery to others in rural communities,particularly to those in more remote areas. This study provides informationon commercial and subcommercial farms and all agricultural industries.Much of this information has not been available previously.
13Social support programs
Government programs during thesurvey period
The Department of Social Security, the Department of Employment,Education, Training and Youth Affairs and the Department of PrimaryIndustries and Energy manage a wide range of Commonwealth socialsupport programs. The social security and education programs consideredin this study were developed to meet community needs for short term andlong term income support, for financial assistance with the cost of rearingchildren and for student financial assistance. Other programs providesupport for rural people or farm families (some on a community basis)specifically.
Stemming from their different rationales, different eligibility provisions(including assets and income tests) have been developed for each program.Several programs also have provisions which can be applied in particularsituations of hardship.
The programs examined in this study are described below as they existed atthe time of the survey. Further details about eligibility for these programsare contained in appendix C. (Note that some details have been changedsince the survey was undertaken in 1995 — for example, the Basic FamilyPayment and Additional Family Payment were combined as FamilyPayment in January 1996, and Farm Household Support was closed to newapplications from 5 May 1997.)
Programs
Family paymentsFunds were provided under the Family Payments Program to eligible parentsof children aged up to 16 years, or, in the case of full time dependentsecondary students who are ineligible for AUSTUDY, until the end of the yearin which the student turned 18.
The Basic Family Payment was provided to most families with dependentchildren in recognition of the costs of rearing a child. The Additional FamilyPayment was an extra payment for low income families with dependentchildren.
14
2
ABARE research report 97.7
Job Search Allowance
Job Search Allowance — which was absorbed into the New Start programin July 1996 — was available for eligible unemployed people who wereactively seeking and willing to undertake suitable paid work, aged 18–65years if male or 18–60 years if female, and registered with the Common-wealth Employment Service (CES). People older than 18 years had to havebeen willing to undertake suitable vocational training or other activity ap-proved by the CES. The allowance provided short term income support.
Farmers might have qualified even if they had a limited role in running thefarm, but they had to meet normal provisions such as being willing to workoff-farm and taking reasonable steps to find work. In severe financialhardship, farm assets might have been ignored if the property could nothave been sold because there was no buyer or there was a legal impedimentto selling and the property could not have been used as security forborrowing.
Age PensionThe Age Pension was available for eligible women aged over 60 years andmen aged over 65 years who were not in the workforce. In some situations,retired farmers in severe financial hardship could receive the Age Pensioneven if the value of their farm and other assets exceeded the normal eligibilitylimits. In these cases, a test of ‘reasonableness’ was applied — that is, apension might have been granted if the applicant could not reasonably havebeen expected to realise the farm asset by selling the farm or could notreasonably have been expected to use the farm as security for borrowing.
Sole Parent PensionThe Sole Parent Pension provided income support for eligible people whowere not part of a couple and were caring for a child. The child had to beyounger than 16 years or qualify for a child disability allowance.
Sickness AllowanceThe Sickness Allowance provided short term income support to eligiblewomen aged 16–60 years and men aged 16–65 years whose illness meantthat they were temporarily unable to support themselves by participating inthe labour market.
15Social support programs

Disability Support PensionThe Disability Support Pension was available for eligible people aged 16years or more who had an impairment level of at least 20 per cent that meantthey were unable to work or undertake work related training for at least thefollowing two years. People who were permanently blind were also entitledto this pension.
AUSTUDY
AUSTUDY provided financial support to needy students to complete theirsecondary education and go on to further study. Generally, assistance wasavailable to eligible full time students aged 16 years or over. Students wereeligible for the ‘independent’ rate of AUSTUDY from the age of 22 years, andthis rate was exempt from tests on parental assets and income. The schemeprovided a living allowance and, for some students, assistance with the costof travel between the parental home and the relevant educational institution.
Only 50 per cent of farm assets were included in the total assets assessed.Families receiving Drought Relief Payments were exempt from theAUSTUDY farm assets testing and parental income testing. On-farm assetswere exempt from testing for applicants in areas of drought exceptionalcircumstances.
Students aged over 16 years in isolated geographic areas who met theeligibility requirements for both AUSTUDY and the Assistance for IsolatedChildren Scheme were entitled to receive payment from the program whichprovided the higher benefit.
In this report, analysis mostly relates to AUSTUDY, although telephone surveyquestions about program awareness and the use and quality of services werecollected for AUSTUDY and ABSTUDY (see below) jointly. Few households inthe survey population would have included Aboriginal or Torres Straitpeople, and most responses would have related to AUSTUDY, so referencesto ABSTUDY have been generally omitted (although it is important to notethat no assets test applies to ABSTUDY).
ABSTUDY
ABSTUDY payment was made to Aboriginal and Torres Strait Islanderstudents to support approved secondary or tertiary education courses and
16 ABARE research report 97.7

primary courses for students aged 14 years and over. A number of allowancesapplied. Some ABSTUDY allowances were paid regardless of family income,while others were subject to income testing. Full time, part time andcorrespondence students might have been be eligible. During interview,ABSTUDY information was obtained with information on AUSTUDY.
Assistance for Isolated Children SchemeThe Assistance for Isolated Children Scheme was directed mainly towardstudents aged under 19 years who did not have reasonable access to anappropriate government school because they were geographically isolated.The eligibility criteria for this scheme was based on the distance and traveltime between home and school, and on the availability of transport servicesto the nearest appropriate government school.
Rural Adjustment SchemeThe Rural Adjustment Scheme (RAS) provided financial support to eligiblefarm businesses to facilitate rural adjustment. The scheme was aimed atsupporting farmers to improve the productivity, sustainability and profit-ability of their farm businesses. In addition, the scheme assisted thosefarmers whose farm businesses were not viable and who wished to leavefarming. The scheme also supported those farmers who were considered tobe profitable in the long term but who were experiencing exceptionalcircumstances such as severe drought.
Drought Relief PaymentThe Drought Relief Payment was designed to assist farmers in areas ofexceptional circumstances to meet their living expenses. To qualify for theDrought Relief Payment, a farmer had to be aged at least 18 years and havea drought ‘exceptional circumstances’ certificate from a RAS authority.Payments for this program were equivalent to Job Search Allowance and,where applicable, Partner Allowance and Family Payments. Job SearchAllowance assets and income tests applied but farm assets were excludedfrom assets testing.
Farm Household SupportThe Farm Household Support Scheme helped eligible farmers who couldnot get further commercial finance to meet day to day living expenses. It
17Social support programs

provided a loan available for up to two years. Under certain circumstances,such as if the farm was sold within two years, part of the payment might havebeen converted to a grant and extended repayment periods applied. Norepayments were required until the family ceased using the scheme andrepayments could be made by instalments over a period of up to ten years. TheJob Search assets and income tests applied, but the tests excluded farm assets.
Rural Counselling ProgramThe Rural Counselling Program was aimed at helping rural communities setup services which provided financial advice and counselling for farmbusinesses experiencing hardship. Under this program, rural communitiesreceived government grants toward the cost of setting up and running theseservices. Farm families in financial difficulty could receive free financialcounselling on a confidential basis.
CountrylinkCountrylink provided information on Commonwealth programs throughseveral services including a toll-free telephone service, a printed directory,an electronic database and community information stands. The programaimed to help people living in rural and remote areas to learn aboutCommonwealth services and assistance.
Rural Access ProgramThrough grants to community groups, the Rural Access Program helpedrural and remote communities to increase access to services. This programassisted country people in developing projects that improved the health,education, training, information and social services of their communities.The program supported community oriented projects, including those forwomen, Aborigines and Torres Strait Islanders, people from non-Englishspeaking backgrounds, and people with disabilities. Nonprofit communitygroups, educational institutions and industry groups were eligible to applyfor funds from this program.
Assets and income assessmentReceipt of Commonwealth social support payment depended on theapplicant meeting eligibility criteria, including assets and income tests. Theapplicant’s assessable assets and income had to be below certain values;
18 ABARE research report 97.7
these values varied between programs and were related to characteristicssuch as age, family composition and other policy considerations. Allprograms excluded the value of the domestic home and curtilage fromassessment. The value of the family home and curtilage on a farm wasdetermined as their market value in the closest regional centre.
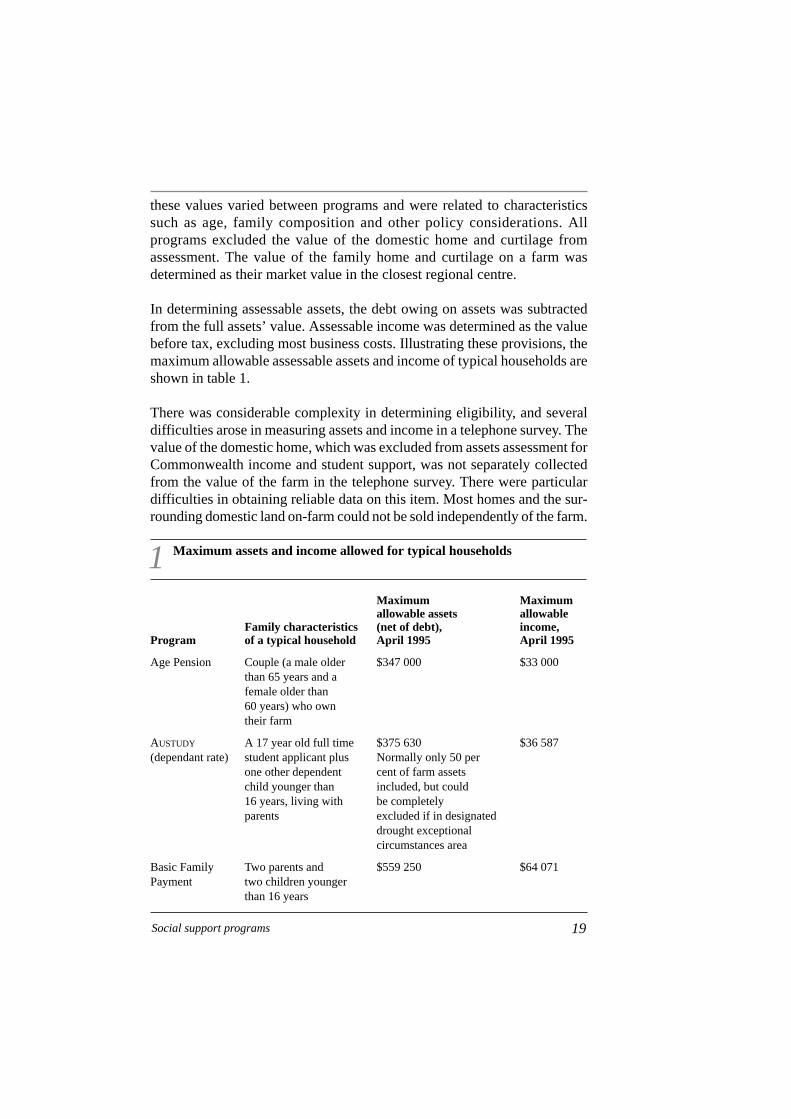
In determining assessable assets, the debt owing on assets was subtractedfrom the full assets’ value. Assessable income was determined as the valuebefore tax, excluding most business costs. Illustrating these provisions, themaximum allowable assessable assets and income of typical households areshown in table 1.
There was considerable complexity in determining eligibility, and severaldifficulties arose in measuring assets and income in a telephone survey. Thevalue of the domestic home, which was excluded from assets assessment forCommonwealth income and student support, was not separately collectedfrom the value of the farm in the telephone survey. There were particulardifficulties in obtaining reliable data on this item. Most homes and the sur-rounding domestic land on-farm could not be sold independently of the farm.
19Social support programs
1 Maximum assets and income allowed for typical households
Maximum Maximumallowable assets allowable
Family characteristics (net of debt), income,Program of a typical household April 1995 April 1995
Age Pension Couple (a male older $347 000 $33 000than 65 years and afemale older than60 years) who owntheir farm
AUSTUDY A 17 year old full time $375 630 $36 587(dependant rate) student applicant plus Normally only 50 per
one other dependent cent of farm assetschild younger than included, but could16 years, living with be completelyparents excluded if in designated
drought exceptional circumstances area
Basic Family Two parents and $559 250 $64 071Payment two children younger
than 16 years

The Department of Social Security and the Department of Employment,Education, Training and Youth Affairs, acting on the advice of the AustralianValuation Office, have determined a method for valuing farmers’ domestichomes which was considered to provide an equitable valuation with that ofhomes of town people: the value of the farm home was taken as the valueof an equivalent home on an averaged sized block in the nearest regionalcentre. Providing a value for their home in these terms during a telephoneinterview would have been very difficult for many farmers.
To derive assessable assets for some programs, certain financial items wereexcluded. For example, in the case of hardship tests for the Basic FamilyPayment, farm assets were not included if the parents’ income was less thana specified minimum. At the time of the survey this was $14 144 for a twoparent family with one child of eligible age.
There were variations within and between programs in relation to the upperassessable assets and income limits for eligibility. These depended on familycomposition and the number and age of dependent children (see appendix C),for example. The assets and income unit assessed for many of the programsconsidered in this report was the parent/s plus dependent children, but thiswas not the case for all programs — for example, if the applicant for JobSearch Allowance was a 20 year old daughter living with her parents, onlythe daughter’s assets and income were assessed.
To further illustrate these types of complexities in program provisions,consider AUSTUDY and the Age Pension. Excluding the Assistance forIsolated Children Scheme, for which an assets and income test applied onlyto the Additional Boarding Allowance component, AUSTUDY had the leastrestrictive eligibility conditions — for example, no farm assets test appliedfor AUSTUDY applicants coming from a farm with a drought exceptionalcircumstances certificate. For standard AUSTUDY, only 50 per cent of farmassets net of debt were assessed. At the time of the survey, the maximumassets value and the maximum income value for eligibility were $375 630and $31 687 respectively for a family with one dependent applicant childyounger than 17 years at home.
The maximum allowable income for the Age Pension for a married applicantwas $33 000 during the survey period. Farm assets could be excluded fromassessment for the Age Pension under hardship circumstances.
20 ABARE research report 97.7

Economic conditions in the surveyperiod
The need for family income support is affected by general economicconditions. Historically, farm businesses have experienced a high degree ofvariability in incomes and adjustment pressures to maintain or improve theirproductivity. The degree of variability in farm incomes is influenced byfluctuations in seasonal conditions and commodity prices mainly (Wrightet al. 1994; Martin 1995).
Some long term perspective on the decline in commodity prices can beobtained from figure 1. However, the effect of these low prices on-farmincomes was exacerbated by the significant decline in farm production in1994-95 (particularly grain production) as a result of the effects of drought.The downward trend in figure 1 indicates the long term pressures on Aus-tralian farm businesses to improve their productivity.
During 1994-95, Australia was faced with the most serious drought since atleast 1982-83. A significant number of family farms within all states andterritories felt the impact of the drought. In some areas, particularly inQueensland, farmers experienced their fourth successive year of low rainfall.As a result of the drought conditions, most farms in drought areas receivedlower than the usual farm income, consequently reducing the cash flow formost of these farms (Martin 1995, pp. 58–64).
21
3
Social support programs
1 Index of real prices received by farmers a
a Movements in prices received by Australian farmers for the products they sell, deflated by the consumer price index. The index measures changes in unit prices and so is not an indicator of changes in farmers' gross income which incorporates both price and quantity changes. Source: ABARE (1995).
index
1.0
1.5
2.0
2.5
1959-60
1954-55
1964-65
1969-70
1974-75
1979-80
1984-85
1989-90
1994-95
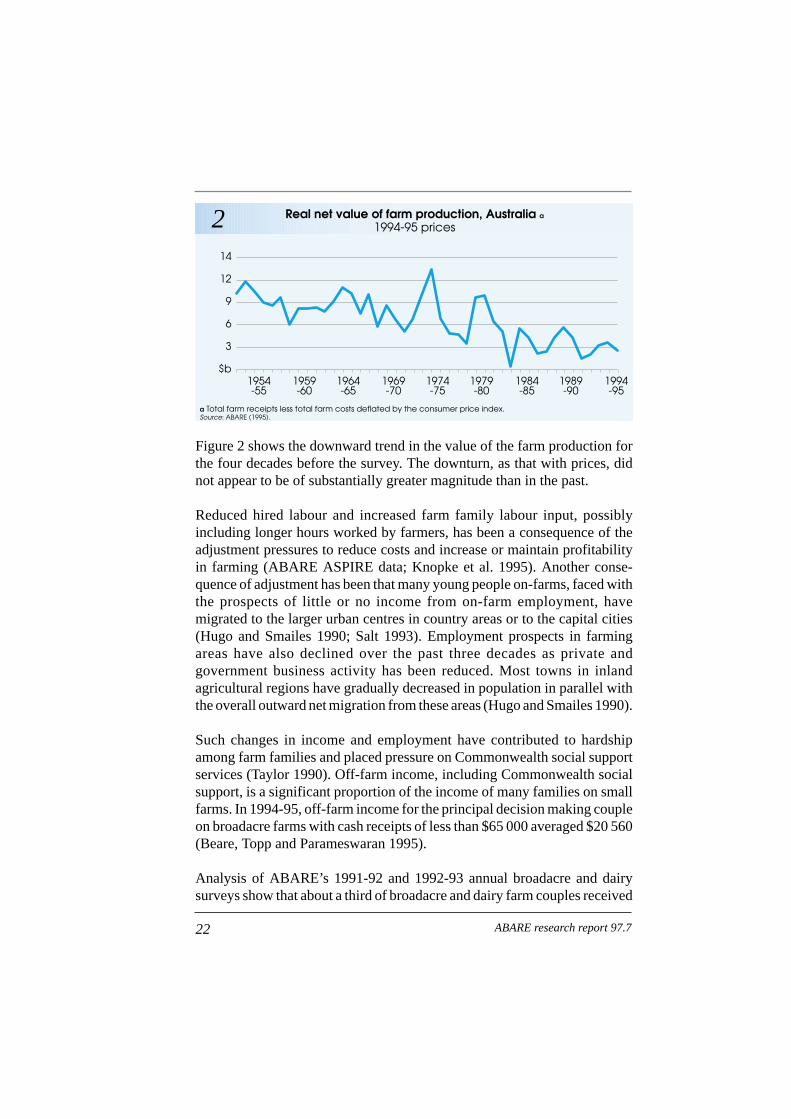
Figure 2 shows the downward trend in the value of the farm production forthe four decades before the survey. The downturn, as that with prices, didnot appear to be of substantially greater magnitude than in the past.
Reduced hired labour and increased farm family labour input, possiblyincluding longer hours worked by farmers, has been a consequence of theadjustment pressures to reduce costs and increase or maintain profitabilityin farming (ABARE ASPIRE data; Knopke et al. 1995). Another conse-quence of adjustment has been that many young people on-farms, faced withthe prospects of little or no income from on-farm employment, havemigrated to the larger urban centres in country areas or to the capital cities(Hugo and Smailes 1990; Salt 1993). Employment prospects in farmingareas have also declined over the past three decades as private andgovernment business activity has been reduced. Most towns in inlandagricultural regions have gradually decreased in population in parallel withthe overall outward net migration from these areas (Hugo and Smailes 1990).
Such changes in income and employment have contributed to hardshipamong farm families and placed pressure on Commonwealth social supportservices (Taylor 1990). Off-farm income, including Commonwealth socialsupport, is a significant proportion of the income of many families on smallfarms. In 1994-95, off-farm income for the principal decision making coupleon broadacre farms with cash receipts of less than $65 000 averaged $20 560(Beare, Topp and Parameswaran 1995).
Analysis of ABARE’s 1991-92 and 1992-93 annual broadacre and dairysurveys show that about a third of broadacre and dairy farm couples received
22 ABARE research report 97.7
2 Real net value of farm production, Australia a
1994-95 prices
a Total farm receipts less total farm costs deflated by the consumer price index. Source: ABARE (1995).
$b
3
6
9
14
12
1959-60
1954-55
1964-65
1969-70
1974-75
1979-80
1984-85
1989-90
1994-95
some income under at least one Commonwealth social support program fromthe Department of Social Security or the Department of Employment,Education, Training and Youth Affairs.
23Social support programs
Demographic and locational profile
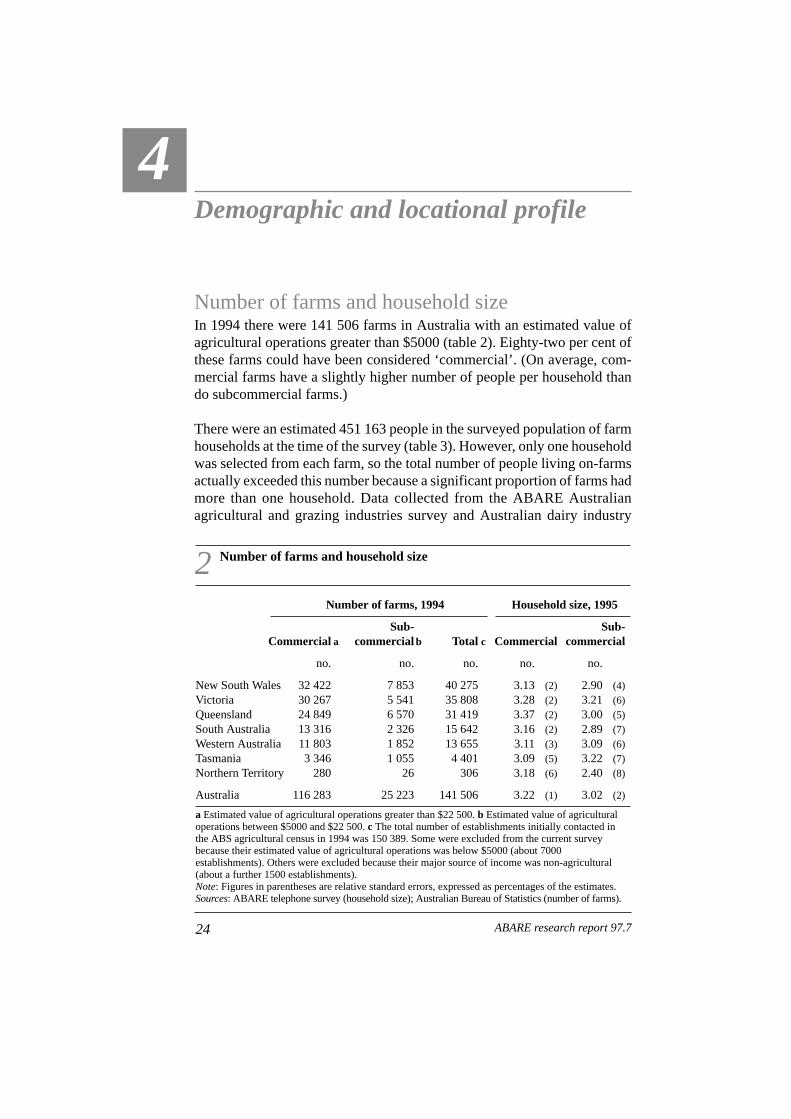
Number of farms and household sizeIn 1994 there were 141 506 farms in Australia with an estimated value ofagricultural operations greater than $5000 (table 2). Eighty-two per cent ofthese farms could have been considered ‘commercial’. (On average, com-mercial farms have a slightly higher number of people per household thando subcommercial farms.)
There were an estimated 451 163 people in the surveyed population of farmhouseholds at the time of the survey (table 3). However, only one householdwas selected from each farm, so the total number of people living on-farmsactually exceeded this number because a significant proportion of farms hadmore than one household. Data collected from the ABARE Australianagricultural and grazing industries survey and Australian dairy industry
24
4
ABARE research report 97.7
2 Number of farms and household size
Number of farms, 1994 Household size, 1995
Sub- Sub-Commercial a commercial b Total c Commercial commercial
no. no. no. no. no.
New South Wales 32 422 7 853 40 275 3.13 (2) 2.90 (4)Victoria 30 267 5 541 35 808 3.28 (2) 3.21 (6)Queensland 24 849 6 570 31 419 3.37 (2) 3.00 (5)South Australia 13 316 2 326 15 642 3.16 (2) 2.89 (7)Western Australia 11 803 1 852 13 655 3.11 (3) 3.09 (6)Tasmania 3 346 1 055 4 401 3.09 (5) 3.22 (7)Northern Territory 280 26 306 3.18 (6) 2.40 (8)
Australia 116 283 25 223 141 506 3.22 (1) 3.02 (2)
a Estimated value of agricultural operations greater than $22 500. b Estimated value of agriculturaloperations between $5000 and $22 500. c The total number of establishments initially contacted inthe ABS agricultural census in 1994 was 150 389. Some were excluded from the current surveybecause their estimated value of agricultural operations was below $5000 (about 7000establishments). Others were excluded because their major source of income was non-agricultural(about a further 1500 establishments).Note: Figures in parentheses are relative standard errors, expressed as percentages of the estimates.Sources: ABARE telephone survey (household size); Australian Bureau of Statistics (number of farms).
25Social support programs
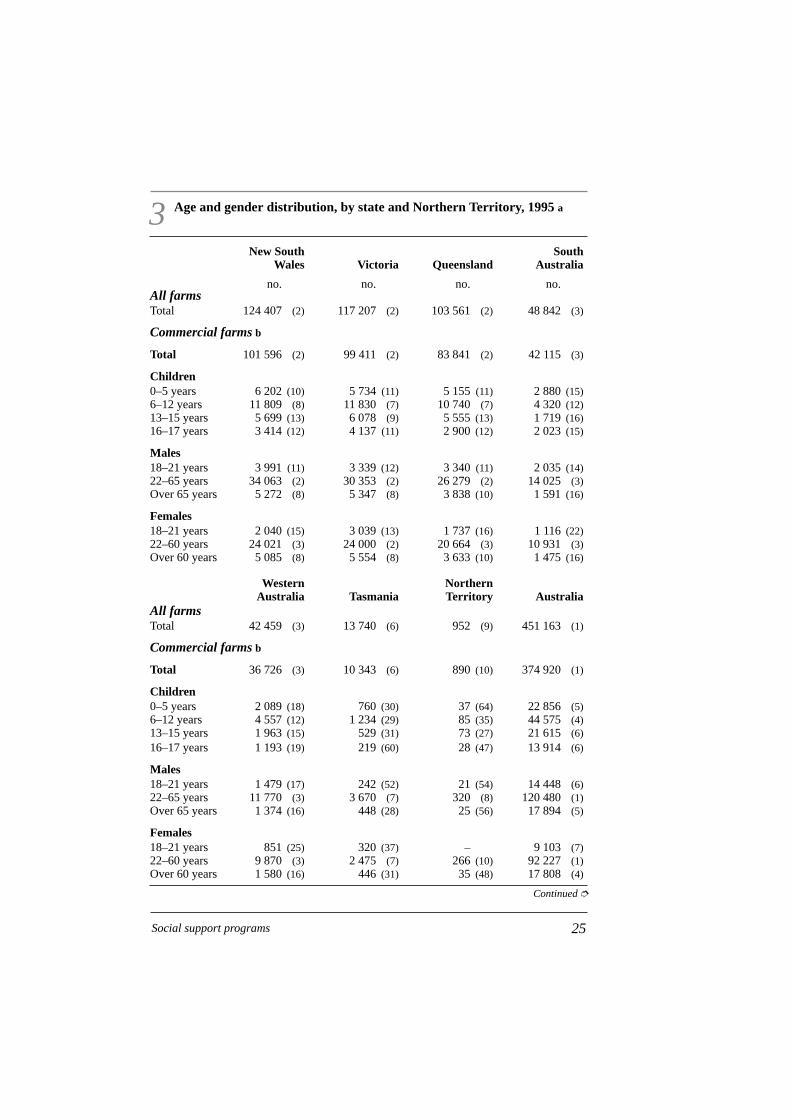
3 Age and gender distribution, by state and Northern Territory, 1995 a
New South SouthWales Victoria Queensland Australia
no. no. no. no.All farmsTotal 124 407 (2) 117 207 (2) 103 561 (2) 48 842 (3)
Commercial farms b
Total 101 596 (2) 99 411 (2) 83 841 (2) 42 115 (3)
Children0–5 years 6 202 (10) 5 734 (11) 5 155 (11) 2 880 (15)6–12 years 11 809 (8) 11 830 (7) 10 740 (7) 4 320 (12)13–15 years 5 699 (13) 6 078 (9) 5 555 (13) 1 719 (16)16–17 years 3 414 (12) 4 137 (11) 2 900 (12) 2 023 (15)
Males18–21 years 3 991 (11) 3 339 (12) 3 340 (11) 2 035 (14)22–65 years 34 063 (2) 30 353 (2) 26 279 (2) 14 025 (3)Over 65 years 5 272 (8) 5 347 (8) 3 838 (10) 1 591 (16)
Females18–21 years 2 040 (15) 3 039 (13) 1 737 (16) 1 116 (22)22–60 years 24 021 (3) 24 000 (2) 20 664 (3) 10 931 (3)Over 60 years 5 085 (8) 5 554 (8) 3 633 (10) 1 475 (16)
Western NorthernAustralia Tasmania Territory Australia
All farmsTotal 42 459 (3) 13 740 (6) 952 (9) 451 163 (1)
Commercial farms b
Total 36 726 (3) 10 343 (6) 890 (10) 374 920 (1)
Children0–5 years 2 089 (18) 760 (30) 37 (64) 22 856 (5)6–12 years 4 557 (12) 1 234 (29) 85 (35) 44 575 (4)13–15 years 1 963 (15) 529 (31) 73 (27) 21 615 (6)16–17 years 1 193 (19) 219 (60) 28 (47) 13 914 (6)
Males18–21 years 1 479 (17) 242 (52) 21 (54) 14 448 (6)22–65 years 11 770 (3) 3 670 (7) 320 (8) 120 480 (1)Over 65 years 1 374 (16) 448 (28) 25 (56) 17 894 (5)
Females18–21 years 851 (25) 320 (37) – 9 103 (7)22–60 years 9 870 (3) 2 475 (7) 266 (10) 92 227 (1)Over 60 years 1 580 (16) 446 (31) 35 (48) 17 808 (4)
Continued ➮
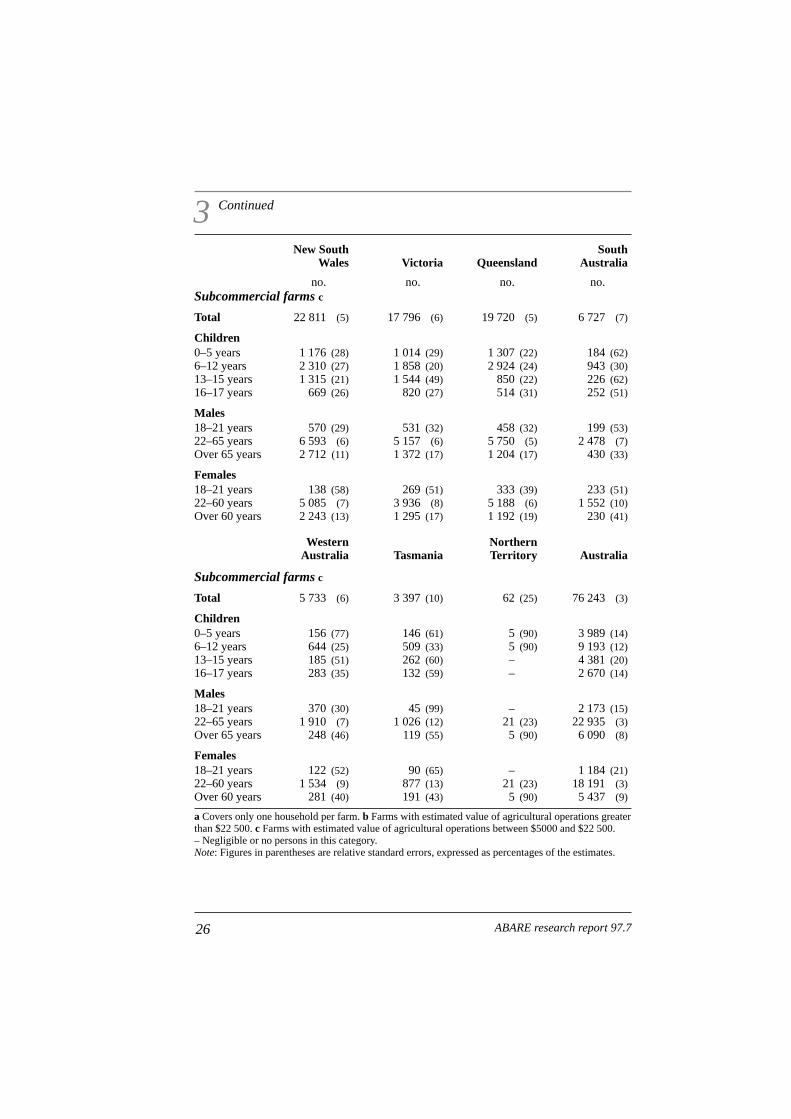
3 Continued
New South SouthWales Victoria Queensland Australia
no. no. no. no.Subcommercial farms c
Total 22 811 (5) 17 796 (6) 19 720 (5) 6 727 (7)
Children0–5 years 1 176 (28) 1 014 (29) 1 307 (22) 184 (62)6–12 years 2 310 (27) 1 858 (20) 2 924 (24) 943 (30)13–15 years 1 315 (21) 1 544 (49) 850 (22) 226 (62)16–17 years 669 (26) 820 (27) 514 (31) 252 (51)
Males18–21 years 570 (29) 531 (32) 458 (32) 199 (53)22–65 years 6 593 (6) 5 157 (6) 5 750 (5) 2 478 (7)Over 65 years 2 712 (11) 1 372 (17) 1 204 (17) 430 (33)
Females18–21 years 138 (58) 269 (51) 333 (39) 233 (51)22–60 years 5 085 (7) 3 936 (8) 5 188 (6) 1 552 (10)Over 60 years 2 243 (13) 1 295 (17) 1 192 (19) 230 (41)
Western NorthernAustralia Tasmania Territory Australia
Subcommercial farms c
Total 5 733 (6) 3 397 (10) 62 (25) 76 243 (3)
Children0–5 years 156 (77) 146 (61) 5 (90) 3 989 (14)6–12 years 644 (25) 509 (33) 5 (90) 9 193 (12)13–15 years 185 (51) 262 (60) – 4 381 (20)16–17 years 283 (35) 132 (59) – 2 670 (14)
Males18–21 years 370 (30) 45 (99) – 2 173 (15)22–65 years 1 910 (7) 1 026 (12) 21 (23) 22 935 (3)Over 65 years 248 (46) 119 (55) 5 (90) 6 090 (8)
Females18–21 years 122 (52) 90 (65) – 1 184 (21)22–60 years 1 534 (9) 877 (13) 21 (23) 18 191 (3)Over 60 years 281 (40) 191 (43) 5 (90) 5 437 (9)
a Covers only one household per farm. b Farms with estimated value of agricultural operations greaterthan $22 500. c Farms with estimated value of agricultural operations between $5000 and $22 500.– Negligible or no persons in this category.Note: Figures in parentheses are relative standard errors, expressed as percentages of the estimates.
26 ABARE research report 97.7
survey in 1990-91 indicated an average of 1.35 households per farm onbroadacre and dairy farms with an estimated value of agricultural operationsgreater than $22 500 (Stayner 1995). The principal decision makinghouseholds were larger on average than other farm households, having anaverage of 3.22 persons compared with 2.37 persons in other households.Based on these numbers and on the households in this survey being those ofthe principal decision making households, there were an estimated 573 028people in farm households in 1994-95.
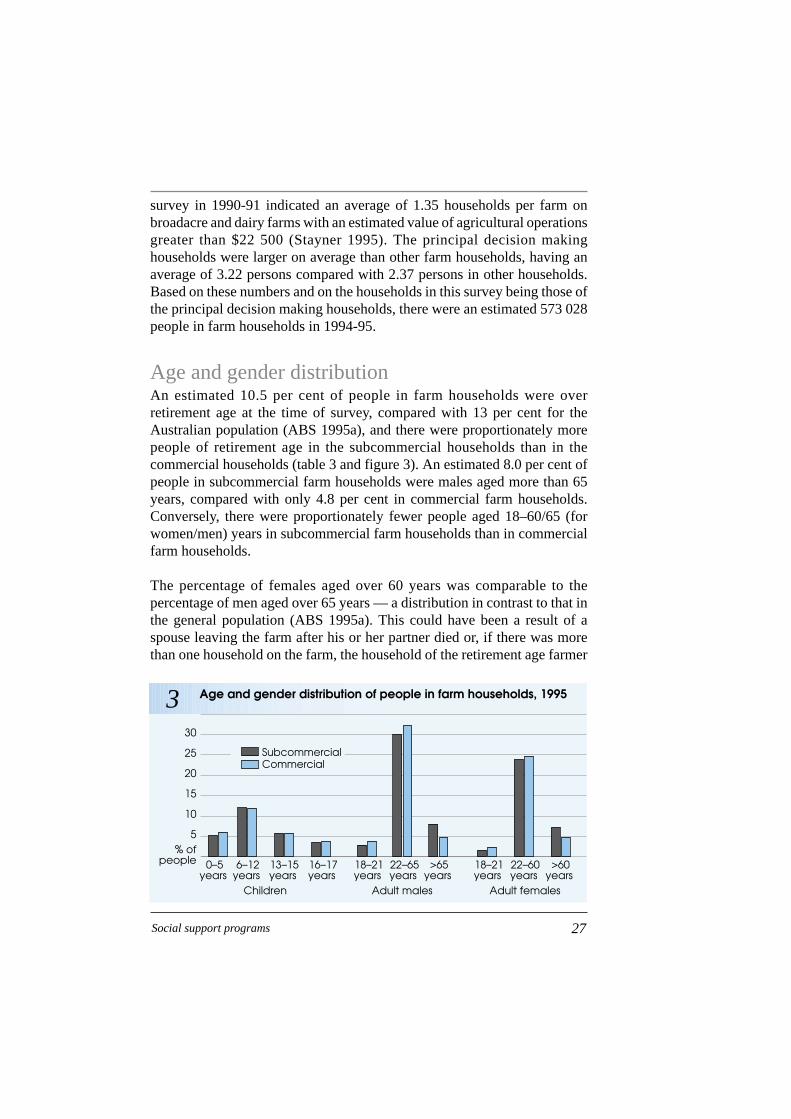
Age and gender distributionAn estimated 10.5 per cent of people in farm households were overretirement age at the time of survey, compared with 13 per cent for theAustralian population (ABS 1995a), and there were proportionately morepeople of retirement age in the subcommercial households than in thecommercial households (table 3 and figure 3). An estimated 8.0 per cent ofpeople in subcommercial farm households were males aged more than 65years, compared with only 4.8 per cent in commercial farm households.Conversely, there were proportionately fewer people aged 18–60/65 (forwomen/men) years in subcommercial farm households than in commercialfarm households.
The percentage of females aged over 60 years was comparable to thepercentage of men aged over 65 years — a distribution in contrast to that inthe general population (ABS 1995a). This could have been a result of aspouse leaving the farm after his or her partner died or, if there was morethan one household on the farm, the household of the retirement age farmer
27Social support programs
3 Age and gender distribution of people in farm households, 1995
% ofpeople
5
20
15
10
25
30
SubcommercialCommercial
>60years
22–60years
18–21years
>65years
22–65years
18–21years
16–17years
13–15years
6–12years
0–5years
Children Adult males Adult females

becoming less important to the farm business, in which case another farmhousehold might have become the principal decision making householdsurveyed.
There were an estimated 10 287 young women and 16 621 young men aged18–21 years living on-farms or away in full time education in 1995 (table 3and figure 3). The large gender difference among this age group in the farmpopulation suggests a substantially larger net migration of young womenfrom farms than of men. This is because the small differences in birth rates,infant mortality rates and child mortality rates between males and femalesin the Australian population tend to balance each other out by mid-adolescence (ABS 1994b).
Employment and education statusAt the time of the interview, an estimated 97 per cent of males aged 22–65years and 79 per cent of females aged 22–60 years were in paid employmenton-farm and/or off-farm (table 4). A further 19 per cent of females and 1 percent of males were employed in home duties. An estimated 1 per cent ofadults aged 22–60 (for women) or 22–65 (for men) years in households wereunemployed. Eleven per cent of 16–17 year olds who were not full timestudents were employed (table 5). Thirty-four per cent of young people aged16–21 years who were not full time students were employed while 4 per centwere unemployed.
The employment status of young men and young women aged 18–21 yearsand living on-farm differed substantially (table 5): 60 per cent of the males
28 ABARE research report 97.7
4 Employment and full time student status of adults, 1995
Males a Females b Total
no. % no. % no. %
Employed c 138 547 (3) 97 (4) 86 968 (1) 79 (2) 225 516 (4) 89 (6)Full time student 1 346 (17) 1 (17) 1250 (17) 1 (17) 2 596 (12) 1 (13)Home duties 1 659 (16) 1 (16) 20 809 (4) 19 (4) 22 468 (4) 9 (6)Unemployed 1 021 (21) 1 (21) 531 (27) 1 (27) 1 553 (17) 1 (17)Other 841 (23) 1 (23) 860 (22) 1 (22) 1 701 (16) 1 (16)
Total 143 414 (3) 100 110 419 (1) 100 253 833 (4) 100
a Aged 22–65 years. b Aged 22–60 years. c Excludes those who were also in full time education orwho were only engaged in home duties.Note: Figures in parentheses are relative standard errors, expressed as percentages of the estimates.
29Social support programs
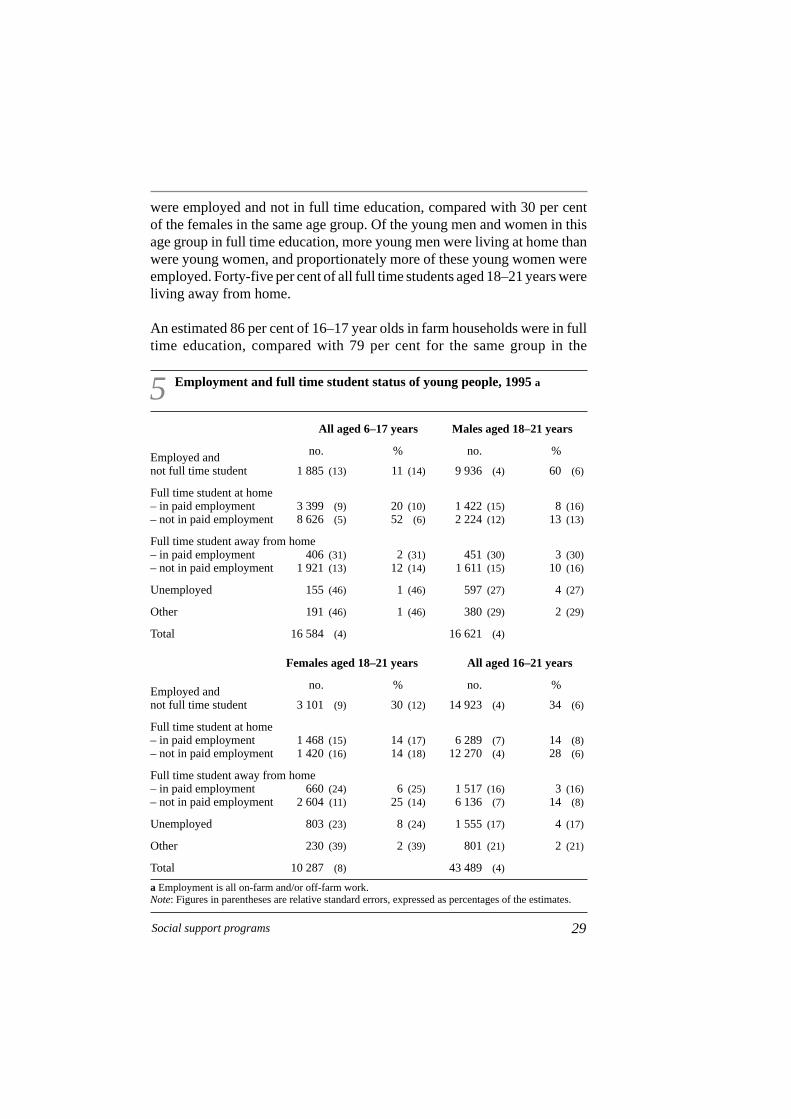
5 Employment and full time student status of young people, 1995 a
All aged 6–17 years Males aged 18–21 years
no. % no. %Employed and not full time student 1 885 (13) 11 (14) 9 936 (4) 60 (6)
Full time student at home– in paid employment 3 399 (9) 20 (10) 1 422 (15) 8 (16)– not in paid employment 8 626 (5) 52 (6) 2 224 (12) 13 (13)
Full time student away from home– in paid employment 406 (31) 2 (31) 451 (30) 3 (30)– not in paid employment 1 921 (13) 12 (14) 1 611 (15) 10 (16)
Unemployed 155 (46) 1 (46) 597 (27) 4 (27)
Other 191 (46) 1 (46) 380 (29) 2 (29)
Total 16 584 (4) 16 621 (4)
Females aged 18–21 years All aged 16–21 years
no. % no. %Employed and not full time student 3 101 (9) 30 (12) 14 923 (4) 34 (6)
Full time student at home– in paid employment 1 468 (15) 14 (17) 6 289 (7) 14 (8)– not in paid employment 1 420 (16) 14 (18) 12 270 (4) 28 (6)
Full time student away from home– in paid employment 660 (24) 6 (25) 1 517 (16) 3 (16)– not in paid employment 2 604 (11) 25 (14) 6 136 (7) 14 (8)
Unemployed 803 (23) 8 (24) 1 555 (17) 4 (17)
Other 230 (39) 2 (39) 801 (21) 2 (21)
Total 10 287 (8) 43 489 (4)
a Employment is all on-farm and/or off-farm work.Note: Figures in parentheses are relative standard errors, expressed as percentages of the estimates.
were employed and not in full time education, compared with 30 per centof the females in the same age group. Of the young men and women in thisage group in full time education, more young men were living at home thanwere young women, and proportionately more of these young women wereemployed. Forty-five per cent of all full time students aged 18–21 years wereliving away from home.
An estimated 86 per cent of 16–17 year olds in farm households were in fulltime education, compared with 79 per cent for the same group in the

Australian population (ABS 1995b). Seventy-two per cent of 16–17 yearolds were in full time education and living at home, while 14 per cent werefull time students residing away from home (table 5).
Rural, remote and metropolitan locationsUnder the Rural, Remote and Metropolitan Areas Classification (DPIE andDHSH 1994) remoteness is measured by an index which is a function ofpopulation density and distance to the nearest urban centre in each of fourpopulation size groups. It is assumed that availability of and access to otherpeople and goods and services decreases as remoteness increases. Theclassification of statistical local areas is shown in map A.
An estimated 81 per cent of farms were in rural zones and 13 per cent werein remote zones, with the remaining 6 per cent in close proximity tometropolitan cities (table 6). Most farms were located a considerabledistance from towns of any substantial size. In rural zones, 91 per cent offarm households were in statistical local areas where the largest town had apopulation less than 10 000. In remote zones, 88 per cent of farm households
30 ABARE research report 97.7
Metropolitan areasLarge rural centresSmall rural centresOther rural areasRemote centresOther remote areas
A Statistical local areas according to rural andremote location a
a 1990-91 census edition. Source: Based on DPIE and DHSH (1994).
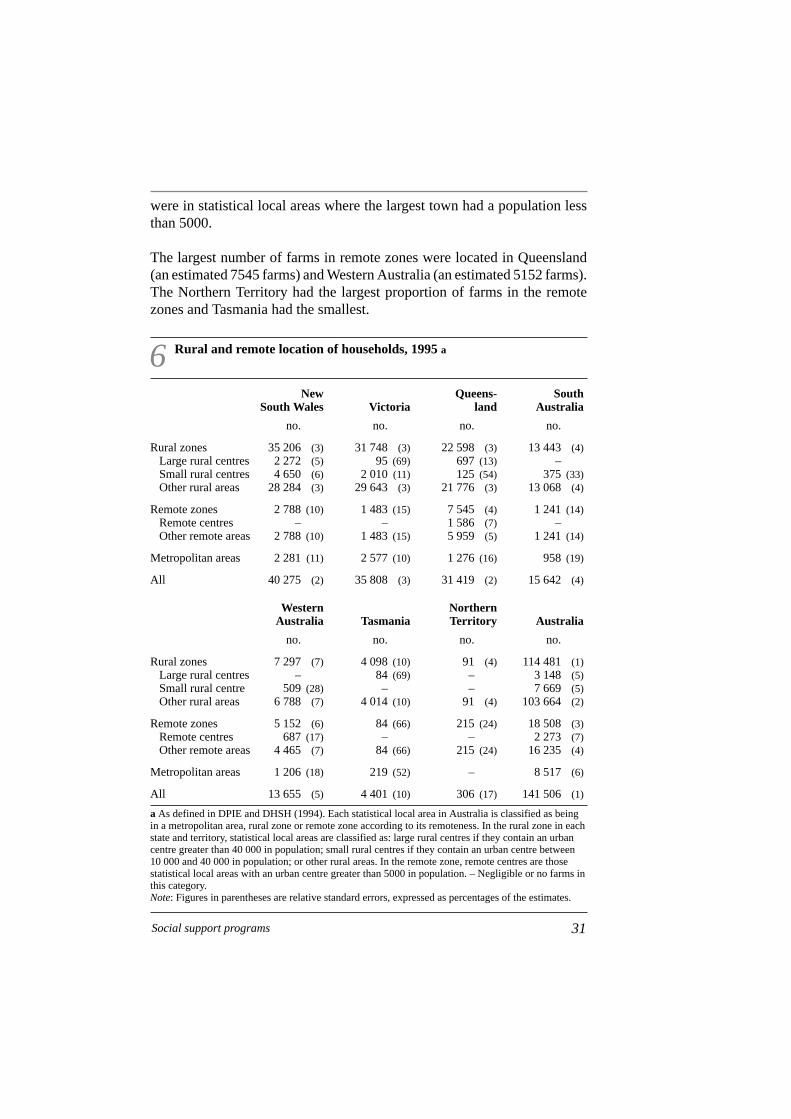
6 Rural and remote location of households, 1995 a
New Queens- SouthSouth Wales Victoria land Australia
no. no. no. no.
Rural zones 35 206 (3) 31 748 (3) 22 598 (3) 13 443 (4)Large rural centres 2 272 (5) 95 (69) 697 (13) –Small rural centres 4 650 (6) 2 010 (11) 125 (54) 375 (33)Other rural areas 28 284 (3) 29 643 (3) 21 776 (3) 13 068 (4)
Remote zones 2 788 (10) 1 483 (15) 7 545 (4) 1 241 (14)Remote centres – – 1 586 (7) –Other remote areas 2 788 (10) 1 483 (15) 5 959 (5) 1 241 (14)
Metropolitan areas 2 281 (11) 2 577 (10) 1 276 (16) 958 (19)
All 40 275 (2) 35 808 (3) 31 419 (2) 15 642 (4)
Western NorthernAustralia Tasmania Territory Australia
no. no. no. no.
Rural zones 7 297 (7) 4 098 (10) 91 (4) 114 481 (1)Large rural centres – 84 (69) – 3 148 (5)Small rural centre 509 (28) – – 7 669 (5)Other rural areas 6 788 (7) 4 014 (10) 91 (4) 103 664 (2)
Remote zones 5 152 (6) 84 (66) 215 (24) 18 508 (3)Remote centres 687 (17) – – 2 273 (7)Other remote areas 4 465 (7) 84 (66) 215 (24) 16 235 (4)
Metropolitan areas 1 206 (18) 219 (52) – 8 517 (6)
All 13 655 (5) 4 401 (10) 306 (17) 141 506 (1)
a As defined in DPIE and DHSH (1994). Each statistical local area in Australia is classified as beingin a metropolitan area, rural zone or remote zone according to its remoteness. In the rural zone in eachstate and territory, statistical local areas are classified as: large rural centres if they contain an urbancentre greater than 40 000 in population; small rural centres if they contain an urban centre between10 000 and 40 000 in population; or other rural areas. In the remote zone, remote centres are thosestatistical local areas with an urban centre greater than 5000 in population. – Negligible or no farms inthis category.Note: Figures in parentheses are relative standard errors, expressed as percentages of the estimates.
31Social support programs
were in statistical local areas where the largest town had a population lessthan 5000.
The largest number of farms in remote zones were located in Queensland(an estimated 7545 farms) and Western Australia (an estimated 5152 farms).The Northern Territory had the largest proportion of farms in the remotezones and Tasmania had the smallest.
Assets and income profiles and assetsvaluation
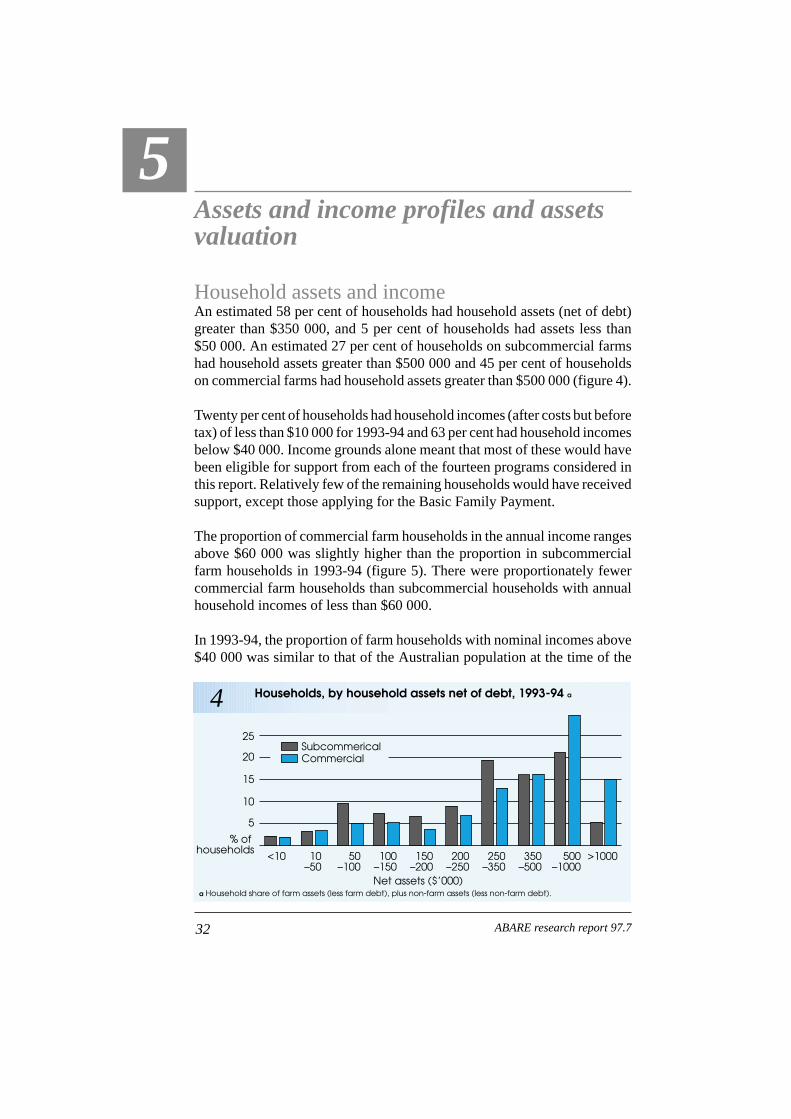
Household assets and incomeAn estimated 58 per cent of households had household assets (net of debt)greater than $350 000, and 5 per cent of households had assets less than$50 000. An estimated 27 per cent of households on subcommercial farmshad household assets greater than $500 000 and 45 per cent of householdson commercial farms had household assets greater than $500 000 (figure 4).
Twenty per cent of households had household incomes (after costs but beforetax) of less than $10 000 for 1993-94 and 63 per cent had household incomesbelow $40 000. Income grounds alone meant that most of these would havebeen eligible for support from each of the fourteen programs considered inthis report. Relatively few of the remaining households would have receivedsupport, except those applying for the Basic Family Payment.
The proportion of commercial farm households in the annual income rangesabove $60 000 was slightly higher than the proportion in subcommercialfarm households in 1993-94 (figure 5). There were proportionately fewercommercial farm households than subcommercial households with annualhousehold incomes of less than $60 000.
In 1993-94, the proportion of farm households with nominal incomes above$40 000 was similar to that of the Australian population at the time of the
32
5
ABARE research report 97.7
a Household share of farm assets (less farm debt), plus non-farm assets (less non-farm debt).
4 Households, by household assets net of debt, 1993-94 a
Net assets ($’000)
<10 10–50
50–100
100–150
150–200
200–250
250–350
350–500
500–1000
>1000
% of households
5
15
10
20
25SubcommericalCommercial

1991 census (table 7). However, there were differences between the pro-portions of the two populations in the lower ranges: 14 per cent of farm house-holds had nominal incomes of less than $5000 and 49 per cent had nominalincomes between $5000 and $40 000, compared with 2 per cent and 63 percent respectively of the whole Australian population.
The response rate on financial items was high given the sensitivity andcomplexity of the questions, and given that the information was collectedby telephone. Only 13 per cent of respondents were unable to providesufficient information to enable calculation of their household assets, and15 per cent were unable to provide sufficient information to enablecalculation of their household income. These respondents were excludedfrom the statistical analysis.
33Social support programs
a Income after costs but before tax.
5 Households, by household income, 1993-94 a
Income ($’000)
>200100–200
60–100
40–60
25–40
15–25
10–15
5–101–5<1% of
households
5
15
10
20SubcommericalCommercial
7 Comparison of farm and Australian household income distribution
Household Percentage of farm Percentage of Australianincome range a households, 1993-94 households, 1991
< $5000 14 (12) 2$5000–40 000 49 (3) 63$40 000–60 000 19 (9) 21$60 000 –100 000 12 (14) 11>$100 000 6 (29) 4
a Nominal income in 1993-94 after costs but before tax for farm households. Nominal income in1991 after superannuation, health insurance and similar deductions but before tax for Australianhouseholds. Note: Figures in parentheses are relative standard errors, expressed as percentages of the estimates.Source: ABS (1995c) for Australian data.
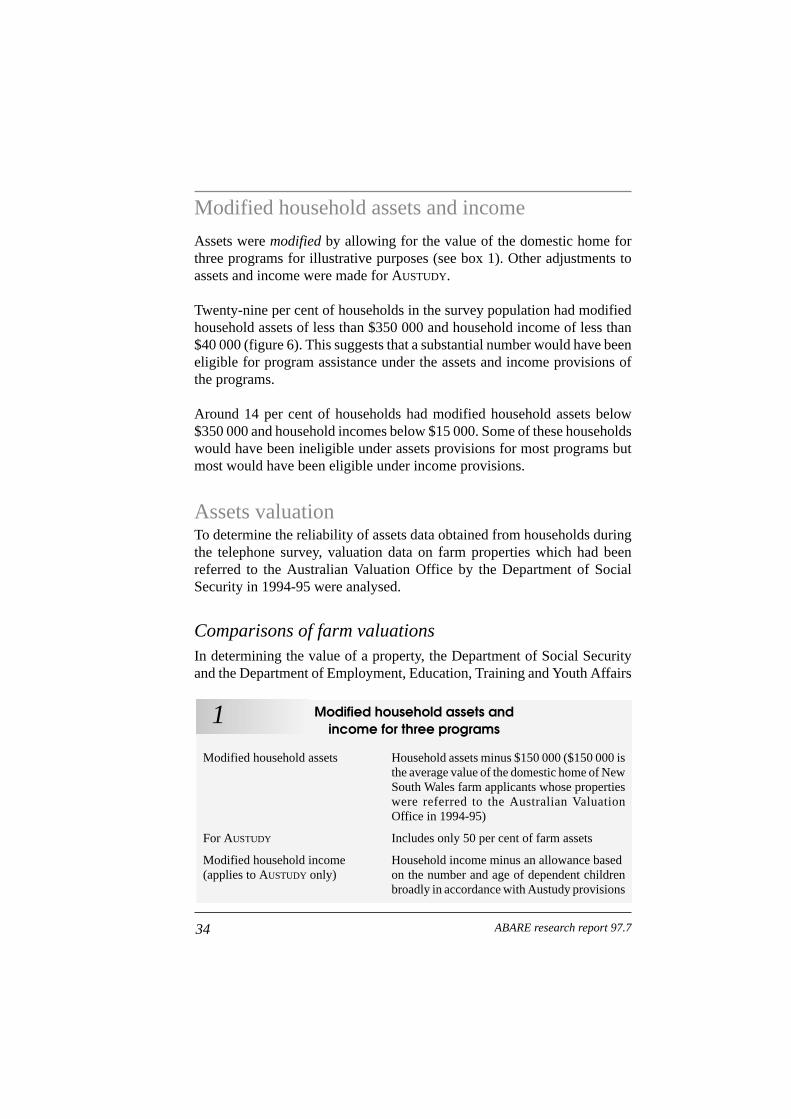
Modified household assets andincome for three programs
Modified household assets Household assets minus $150 000 ($150 000 isthe average value of the domestic home of NewSouth Wales farm applicants whose propertieswere referred to the Australian ValuationOffice in 1994-95)
For AUSTUDY Includes only 50 per cent of farm assets
Modified household income Household income minus an allowance based(applies to AUSTUDY only) on the number and age of dependent children
broadly in accordance with Austudy provisions
1
Modified household assets and income
Assets were modified by allowing for the value of the domestic home forthree programs for illustrative purposes (see box 1). Other adjustments toassets and income were made for AUSTUDY.
Twenty-nine per cent of households in the survey population had modifiedhousehold assets of less than $350 000 and household income of less than$40 000 (figure 6). This suggests that a substantial number would have beeneligible for program assistance under the assets and income provisions ofthe programs.
Around 14 per cent of households had modified household assets below$350 000 and household incomes below $15 000. Some of these householdswould have been ineligible under assets provisions for most programs butmost would have been eligible under income provisions.
Assets valuationTo determine the reliability of assets data obtained from households duringthe telephone survey, valuation data on farm properties which had beenreferred to the Australian Valuation Office by the Department of SocialSecurity in 1994-95 were analysed.
Comparisons of farm valuationsIn determining the value of a property, the Department of Social Securityand the Department of Employment, Education, Training and Youth Affairs
34 ABARE research report 97.7

act on the advice of the Australian Valuation Office. (In 1993-94 the majorityof properties that were referred by the Department of Social Security relatedto applications for the Age Pension.) However, only some farm applicants’properties are referred to the Australian Valuation Office. These are notrepresentative of applicant and nonapplicant farm properties, but thevaluations illustrate how farmers’ valuations compare with those by theAustralian Valuation Office.
The Australian Valuation Office undertook valuations of 1099 properties inNew South Wales in 1994-95. The comparison of these valuations with thoseprovided to the Department of Social Security by the relevant farm clients(figure 7) shows that the two valuations were relatively close. Thecorrelation coefficient between the two valuations was 0.86 and the averagedifference (in absolute terms) between the two was $20 000. Although thecorrelation coefficient indicated a high positive relationship between thevaluations by the two methods, some valuations differed considerably morethan the average difference.
The valuations of the house and surrounding domestic land (curtilage)relating to those properties are compared in figure 8. The valuations provided
35Social support programs
6 Households, by modified household assets and income ranges, 1994-95 a
a Modified household assets are 1995 values net of debt and exclude $150 000 for the domestic home. Income is for 1994-95 after business costs but before tax.Notes: Excludes households with missing assets or income data. Groups are not mutually exclusive nor exhaustive, so percentages do not add to 100.
80706050403020100% of households
Ho
use
ho
ld a
sse
ts a
nd
inc
om
e ra
ng
es
Assets < $500 000 & income < $15 000Assets < $350 000 & income < $60 000Assets < $350 000 & income < $40 000Assets < $350 000 & income < $15 000
Assets < $1000 000 & income < $60 000Assets < $1000 000 & income < $40 000Assets < $1000 000 & income < $15 000Assets < $500 000 & income < $60 000Assets < $500 000 & income < $40 000

by each method were not as close as those for the whole farm, with acorrelation coefficient of 0.79. Considerable discrepancies existed betweenthe two methods of valuation in some cases, particularly in the lower ranges.Considering only those with a valuation less than $300 000 according to theAustralian Valuation Office, the correlation coefficient between thevaluations by the two methods was 0.72. Valuations by the AustralianValuation Office were $21 000 higher than those by social security clientson average.
The average of all valuations by the Australian Valuation Office was $16 958higher for total farm value and $16 158 higher for house and curtilagerespectively than the average of all valuations by social security clients.
36 ABARE research report 97.7
De
pa
rtm
en
t o
f So
cia
lSe
cu
rity
clie
nt's
va
lue
8 Comparative farm house and curtilage valuations,New South Wales, 1994-95 a
a Value adjusted to that of an equivalent house on a normal sized lot in the nearest regional centre.
Australian Valuation Office's valuation
$’000
100
200
300
400
500
600
$’000 200 400 600
7 Comparative total farm valuations, New South Wales, 1994-95 a
a Market value.
De
pa
rtm
en
t o
f So
cia
lSe
cu
rity
clie
nt's
va
lue
Australian Valuation Office's valuation
$’000
200
400
600
800
1000
$’000 500 1000 1500
In some cases, a farmer’s valuation of the whole farm exceeded the valuationby the Australian Valuation Office and/or the farmer’s valuation of the homeand curtilage was less than the valuation by the Australian Valuation Office.If assessment for program eligibility by the Commonwealth programadministrators depended on a farmer’s valuation, such applications wouldbe incorrectly assessed as ineligible on the grounds that the household’sassets were too high. Farmers might also incorrectly assess themselves asineligible, believing that the value of their assets exceeded eligibility limits.
37Social support programs

Awareness and use of programs
Target households
For the programs considered in this report (as listed in box 2), analysis aboutawareness, use, reasons for rejection and reasons for not applying forassistance usually relates to ‘target’ households.
The target households for the survey were not necessarily the same as thetarget population for the program (appendix C): for example, for Job SearchAllowance, the target population was unemployed persons, but the targethouseholds for the survey were all households in the survey populationbecause unemployment is transient and unpredictable. In another example,
38
6
ABARE research report 97.7
Characteristics of target households
Program Characteristics of households surveyed
Job Search Allowance, All householdsSickness Allowance, Rural Adjustment Scheme, Farm Household Support, Countrylink, Rural Counselling Program, Rural Access Program
Family Payment, Assistance Households with a member younger for Isolated Children than 18 years
Age Pension Households with a male older than 65 years ora female older than 60 years
Sole Parent Pension Households with a sole parent
Disability Support Pension Households with a person with a disability
AUSTUDY Households with a person aged 16–21 years
Drought Relief Payment Households located in Queensland or an area inNew South Wales, South Australia or Tasmaniadeclared to be in drought exceptional circum-stances
2

39Social support programs
applicants for AUSTUDY must be undertaking full time study in an approvedcourse, but for this study, households with young people aged 16–21 yearswere targeted regardless of their student status, one reason being thatcontinuation in education could be related to the household’s financialsituation.
Awareness of programsThe most well known support programs were the Age Pension and AUSTUDY
(table 8). Over nine in ten target households were aware of each of theseprograms. The Basic Family Payment and Job Search Allowance were lesswell known: awareness of each was 78 per cent. However, it was commonfor respondents to say initially that they were unaware of these twoprograms, but to recognise the names of the earlier Child Endowment andUnemployment Benefit when prompted. It is likely that awareness of thesetwo payments would have been higher if all interviewers had used the earliernames as prompts.
Awareness of the Additional Family Payment was only 57 per cent, andawareness of the Assistance for Isolated Children’s Scheme among targetfarm households was 50 per cent. Some of these households would havebeen ineligible for assistance under the distance provisions of the Assistancefor Isolated Chilren’s Scheme.
Awareness of most programs administered by the Department of PrimaryIndustries and Energy was lower than that for other programs considered.Awareness of Countrylink was 39 per cent among farm households, anestimate which is similar to that reported in a survey of householders in threetowns in New South Wales, Victoria and South Australia for an evaluationof the Countrylink program in 1993 (DPIE 1993). Least well known of allthe programs was the small community grant program, the Rural AccessProgram. Approximately one in six households knew of this program.
Awareness of hardship testsThree-quarters of all target households for the Age Pension were unawarethat hardship tests applied to the pension, and few households were awarethat hardship tests applied to some of the programs at all. Only 20 per centof farm households were aware that hardship tests applied to Job Search andonly 25 per cent were aware that hardship tests applied to the Age Pension.
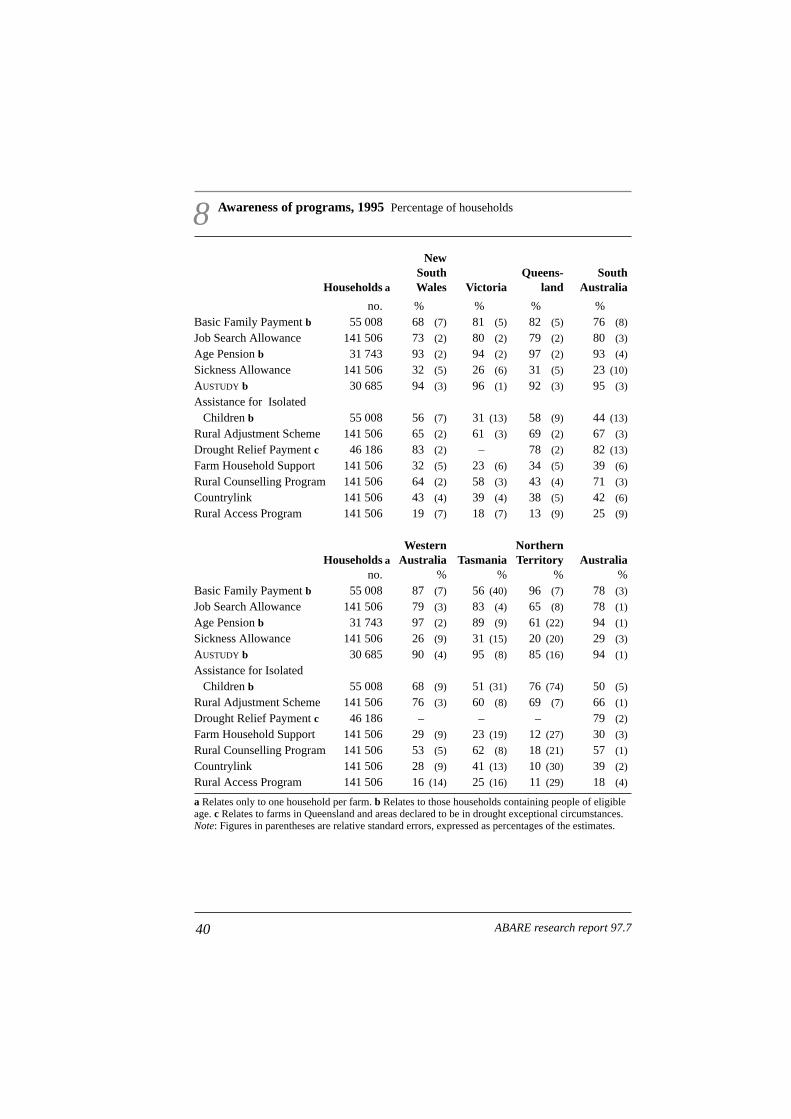
40 ABARE research report 97.7
8 Awareness of programs, 1995 Percentage of households
NewSouth Queens- South
Households a Wales Victoria land Australia
no. % % % %Basic Family Payment b 55 008 68 (7) 81 (5) 82 (5) 76 (8)
Job Search Allowance 141 506 73 (2) 80 (2) 79 (2) 80 (3)
Age Pension b 31 743 93 (2) 94 (2) 97 (2) 93 (4)
Sickness Allowance 141 506 32 (5) 26 (6) 31 (5) 23 (10)
AUSTUDY b 30 685 94 (3) 96 (1) 92 (3) 95 (3)
Assistance for IsolatedChildren b 55 008 56 (7) 31 (13) 58 (9) 44 (13)
Rural Adjustment Scheme 141 506 65 (2) 61 (3) 69 (2) 67 (3)
Drought Relief Payment c 46 186 83 (2) – 78 (2) 82 (13)
Farm Household Support 141 506 32 (5) 23 (6) 34 (5) 39 (6)
Rural Counselling Program 141 506 64 (2) 58 (3) 43 (4) 71 (3)
Countrylink 141 506 43 (4) 39 (4) 38 (5) 42 (6)
Rural Access Program 141 506 19 (7) 18 (7) 13 (9) 25 (9)
Western NorthernHouseholds a Australia Tasmania Territory Australia
no. % % % %Basic Family Payment b 55 008 87 (7) 56 (40) 96 (7) 78 (3)
Job Search Allowance 141 506 79 (3) 83 (4) 65 (8) 78 (1)
Age Pension b 31 743 97 (2) 89 (9) 61 (22) 94 (1)
Sickness Allowance 141 506 26 (9) 31 (15) 20 (20) 29 (3)
AUSTUDY b 30 685 90 (4) 95 (8) 85 (16) 94 (1)
Assistance for IsolatedChildren b 55 008 68 (9) 51 (31) 76 (74) 50 (5)
Rural Adjustment Scheme 141 506 76 (3) 60 (8) 69 (7) 66 (1)
Drought Relief Payment c 46 186 – – – 79 (2)
Farm Household Support 141 506 29 (9) 23 (19) 12 (27) 30 (3)
Rural Counselling Program 141 506 53 (5) 62 (8) 18 (21) 57 (1)
Countrylink 141 506 28 (9) 41 (13) 10 (30) 39 (2)
Rural Access Program 141 506 16 (14) 25 (16) 11 (29) 18 (4)
a Relates only to one household per farm. b Relates to those households containing people of eligibleage. c Relates to farms in Queensland and areas declared to be in drought exceptional circumstances. Note: Figures in parentheses are relative standard errors, expressed as percentages of the estimates.
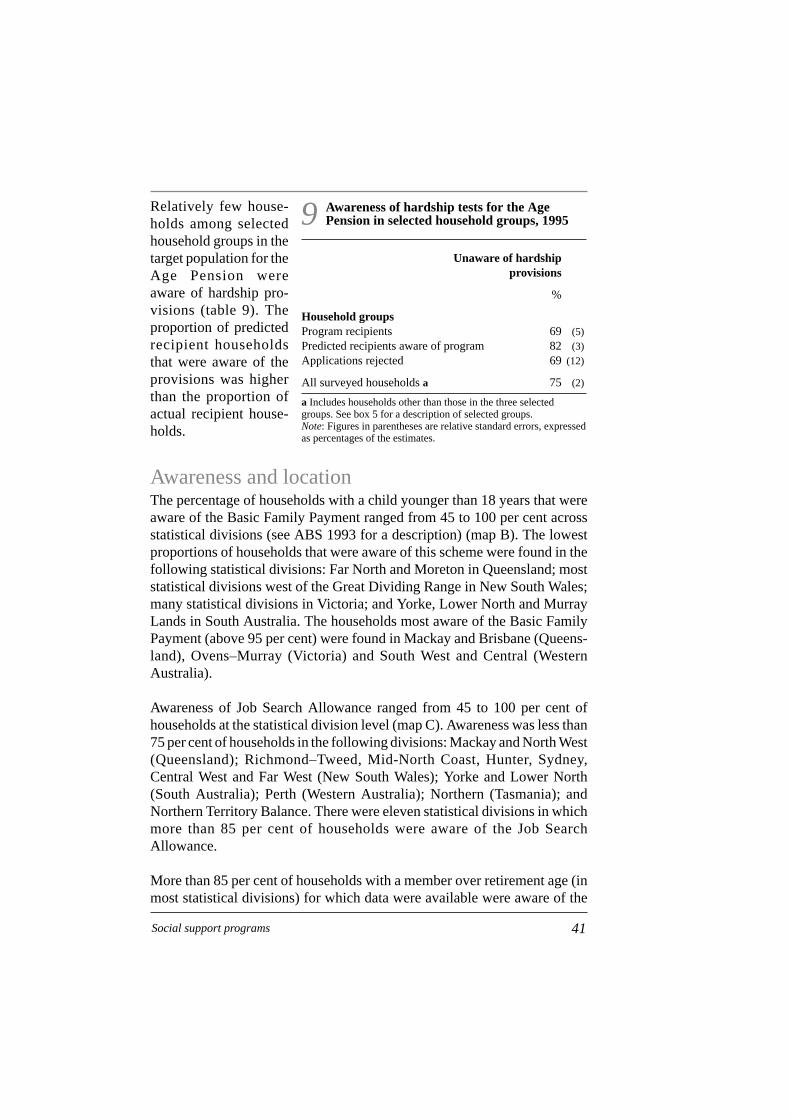
Relatively few house-holds among selectedhousehold groups in thetarget population for theAge Pension wereaware of hardship pro-visions (table 9). Theproportion of predictedrecipient householdsthat were aware of theprovisions was higherthan the proportion ofactual recipient house-holds.
Awareness and locationThe percentage of households with a child younger than 18 years that wereaware of the Basic Family Payment ranged from 45 to 100 per cent acrossstatistical divisions (see ABS 1993 for a description) (map B). The lowestproportions of households that were aware of this scheme were found in thefollowing statistical divisions: Far North and Moreton in Queensland; moststatistical divisions west of the Great Dividing Range in New South Wales;many statistical divisions in Victoria; and Yorke, Lower North and MurrayLands in South Australia. The households most aware of the Basic FamilyPayment (above 95 per cent) were found in Mackay and Brisbane (Queens-land), Ovens–Murray (Victoria) and South West and Central (WesternAustralia).
Awareness of Job Search Allowance ranged from 45 to 100 per cent ofhouseholds at the statistical division level (map C). Awareness was less than75 per cent of households in the following divisions: Mackay and North West(Queensland); Richmond–Tweed, Mid-North Coast, Hunter, Sydney,Central West and Far West (New South Wales); Yorke and Lower North(South Australia); Perth (Western Australia); Northern (Tasmania); andNorthern Territory Balance. There were eleven statistical divisions in whichmore than 85 per cent of households were aware of the Job SearchAllowance.
More than 85 per cent of households with a member over retirement age (inmost statistical divisions) for which data were available were aware of the
41Social support programs
9 Awareness of hardship tests for the AgePension in selected household groups, 1995
Unaware of hardshipprovisions
%
Household groupsProgram recipients 69 (5)Predicted recipients aware of program 82 (3)Applications rejected 69 (12)
All surveyed households a 75 (2)
a Includes households other than those in the three selectedgroups. See box 5 for a description of selected groups.Note: Figures in parentheses are relative standard errors, expressedas percentages of the estimates.

42 ABARE research report 97.7
45–55 per cent55–65 per cent65–75 per cent75–85 per cent85–95 per cent95–100 per centNone in sampleInsufficient data
B Awareness of Basic Family Payment,by statistical division, 1995
% of households�@�À��y�Q¢�Q¢�y �y�@�À��@�À��@�À��@�À��@�À��@�À��@�À��@�À��@�À��@�À��@�À��@�À��@�À��@�À��@�À��@�À��@�À��@�À��@�À��@�À��@�À��@�À��@�À��@�À��@�À��@�À��@�À��@�À��@�À��@�À��@�À��@�À��@�À��@�À��@�À��@�À��@�À��@�À��@�À��@�À��@�À��@�À��@�À��@�À��@�À��@�À��@�À��@�À��@�À��@�À��@�À��@�À��@�À��@�À��@�À��@�À��@�À��@�À��@�À��@�À��@�À��@�À��@�À��@�À��@�À��@�À��@�À��@�À��@�À��@�À��@�À��@�À��@�À��@�À��@�À��@�À��@�À��y�y�y�y�y�y�y�y�y�y�y�y�y�y�y�y�y�y�y�y�y�y�y�y�y�y�y�y�y�y�y�y�y�y�y�y�y�y�y�y�y�y�y�y�y�y
�Q¢�Q¢��QQ¢¢�Q¢�Q¢�Q¢�Q¢�Q¢�Q¢��QQ¢¢�Q¢��QQ¢¢��QQ¢¢�Q¢�Q¢�Q¢�Q¢�Q¢��QQ¢¢�Q¢�Q¢�Q¢�Q¢�Q¢�Q¢�Q¢�Q¢�Q¢�Q¢�Q¢�Q¢�Q¢�Q¢�Q¢�Q¢�Q¢�Q¢�Q¢�Q¢�Q¢�Q¢�Q¢�Q¢�Q¢��QQ¢¢��QQ¢¢��QQ¢¢�Q¢�Q¢�Q¢�Q¢�Q¢�Q¢�Q¢�Q¢�Q¢�Q¢�Q¢��QQ¢¢�Q¢�Q¢��QQ¢¢�Q¢�Q¢�Q¢�Q¢�Q¢�Q¢�Q¢�Q¢�Q¢�Q¢�Q¢�Q¢�Q¢�Q¢�Q¢�Q¢�Q¢�Q¢�Q¢�Q¢��QQ¢¢�Q¢�Q¢�Q¢�Q¢�Q¢�Q¢�Q¢�Q¢�Q¢�Q¢�Q¢�Q¢�Q¢�Q¢�Q¢�Q¢�Q¢�Q¢��QQ¢¢�Q¢�Q¢�Q¢�Q¢�Q¢��QQ¢¢�Q¢�Q¢�Q¢�Q¢�Q¢�Q¢�Q¢�Q¢�Q¢�Q¢�Q¢�Q¢�Q¢�Q¢�Q¢�Q¢�Q¢�Q¢�Q¢�Q¢�Q¢�Q¢�Q¢�Q¢�Q¢�Q¢�Q¢�Q¢�Q¢�Q¢�Q¢�Q¢�Q¢�Q¢�Q¢�Q¢�Q¢�Q¢�Q¢�Q¢�Q¢�Q¢�Q¢�Q¢�Q¢�Q¢�Q¢�Q¢�Q¢�Q¢�Q¢�Q¢�Q¢�Q¢�Q¢�Q¢�Q¢�Q¢�Q¢�Q¢�Q¢�Q¢�Q¢�Q¢�Q¢�Q¢�Q¢�Q¢�Q¢�Q¢�Q¢�Q¢�Q¢�Q¢�Q¢�Q¢�Q¢�Q¢�Q¢�Q¢�Q¢�Q¢�Q¢�Q¢�Q¢�Q¢�Q¢�Q¢�Q¢�Q¢�Q¢��QQ¢¢�Q¢�Q¢�Q¢�Q¢�Q¢�Q¢�Q¢�Q¢�Q¢�Q¢�Q¢�Q¢�Q¢�Q¢�Q¢�Q¢�Q¢�Q¢�Q¢�Q¢�Q¢�Q¢�Q¢�Q¢��QQ¢¢�Q¢�Q¢��QQ¢¢�Q¢�Q¢�Q¢�Q¢�Q¢�Q¢�Q¢�Q¢�Q¢�Q¢�Q¢�Q¢�Q¢�Q¢�Q¢�Q¢�Q¢�Q¢�Q¢�Q¢�Q¢�Q¢�Q¢�Q¢�Q¢�Q¢�Q¢�Q¢�Q¢�Q¢�Q¢�Q¢�Q¢�Q¢�Q¢�Q¢�Q¢�Q¢�Q¢�Q¢�Q¢�Q¢�Q¢�Q¢�Q¢�Q¢�Q¢�Q¢�Q¢�Q¢�Q¢�Q¢�Q¢�Q¢�Q¢�Q¢�Q¢�Q¢�Q¢�Q¢�Q¢�Q¢�Q¢�Q¢�Q¢�Q¢�Q¢�Q¢�Q¢�Q¢�Q¢�Q¢�Q¢�Q¢�Q¢�Q¢�Q¢�Q¢�Q¢�Q¢�Q¢�Q¢�Q¢�Q¢�Q¢�Q¢�Q¢�Q¢�Q¢�Q¢�Q¢�Q¢��QQ¢¢�Q¢�Q¢����QQQQ¢¢¢¢��QQ¢¢��QQ¢¢��QQ¢¢����QQQQ¢¢¢¢��QQ¢¢�Q¢�Q¢�Q¢�Q¢�Q¢�Q¢��QQ¢¢�Q¢�Q¢�Q¢�Q¢�Q¢�Q¢�Q¢�Q¢�Q¢��QQ¢¢��QQ¢¢�Q¢�Q¢�Q¢�Q¢�Q¢�Q¢�Q¢�Q¢�Q¢�Q¢�Q¢�Q¢�Q¢�Q¢�Q¢�Q¢�Q¢�Q¢�Q¢�Q¢�Q¢�Q¢�Q¢�Q¢�Q¢�Q¢�Q¢�Q¢�Q¢�Q¢�Q¢�Q¢�Q¢�Q¢�Q¢�Q¢�Q¢�Q¢�Q¢
45–55 per cent55–65 per cent65–75 per cent75–85 per cent85–95 per cent95–100 per centInsufficient data
C Awareness of Job Search Allowance,by statistical division, 1995
% of households�@�À��y�Q¢�Q¢�y �y�y�y�@�À��@�À��@�À��@�À��@�À��@�À��@�À��@�À��@�À��@�À��@�À��@�À��@�À��@�À��@�À��@�À��@�À��@�À��@�À��@�À��@�À��@�À��@�À��@�À��@�À��@�À��@�À��@�À��@�À��@�À��@�À��@�À��@�À��@�À��@�À��@�À��@�À��@�À��@�À��@�À��@�À��@�À��@�À��@�À��@�À��@�À��@�À��@�À��@�À��@�À��@�À��@�À��@�À��@�À��@�À��@�À��@�À��@�À��@�À��@�À��@�À��@�À��@�À��@�À��@�À��@�À��@�À��@�À��@�À��@�À��@�À��@�À��@�À��@�À��@�À��@�À��@�À��@�À��@�À��@�À��@�À��@�À��@�À��@�À��@�À��@�À��@�À��@�À��@�À��@�À��@�À��@�À��@�À��@�À��@�À��@�À��@�À��@�À��@�À��@�À��@�À��@�À��@�À��@�À��@�À��@�À��@�À��@�À��@�À��@�À��@�À��@�À��@�À��@�À��@�À��@�À��@�À��@�À��@�À��@�À��@�À��@�À��@�À��@�À��@�À��@�À��@�À��@�À��@�À��@�À��@�À��@�À��@�À��@�À��@�À��@�À��@�À��@�À��@�À��@�À��@�À��@�À��@�À��y�y�y��yy�y�y�y�y�y�y�y�y�y�y�y�y�y�y�y�y�y�y�y�y�y�y�y�y�y�y�y�y�y�y�y�y�y�y�y�y�y�y�y�y�y�y�y�y�y�y�y�y�y�y�y�y�y�y�y�y�y�y�y�y�y�y�y�y�y�y�y�y�y�y�y�y�y�y�y�y�y�y�y�y�y�y�y�y�y�y�y�y�y�y�y�y�y�y�y�y�y�y�y�y�y�y�y�y�y�y�y�y�y�y�y�y�y�y�y�y�y�y�y�y�y�y�y�y�y�y�y�y�y�y�y�y�y�y�y�y�y�y�y�y�y�y�y�y�y�y�y�y�y�y�y�y�y�y�y�y�y�y�y�y�y�y�y�y�y�y�y�y�y�y�y�y�y�y�y�y�y�y�y�y�y�y�y�y�y�y�y�y�y�y�y�y�y�y�y�y�y�y�y�y�y�y�y�y�y�y�y�y�y�y�y�y�y�y�y�y�y�y�y�y�y�y�y�y�y�y�y�y�y�y�y�y�y�y�y�y�y�y�y�y�y�y�y�y�y�y�y�y�y�y�y�y�y�y�y�y�y�y�y�y�y�y�y�y�y�y�y�y�y�y�y�y�y�y�y�y�y�y�y�y�y�y�y�y�y�y�y�y�y�y�y�y�y�y�y�y�y�y�y�y�y�y�y�y�y�y�y�y�y�y�y�y�y�y�y�y�y�y�y�y�y�y�y�y�y�y�y�y�y�y�y�y�y�y�y�y�y�y�y�y�y�y�y�y�y�y�y�y�y�y�y�y�y�y�y�y�y�y�y�y�y�y�y�y�y�y�y�y�y�y�y�y�y�y�y�y�y�y�y�y�y�y�y�y�y�y�y�y�y�y�y�y�y�y�y�y�y�y�y�y�y�y�y�y�y�y�y�y�y�y�y�y�y�y�y�y�y�y�y�y�y�y�y�y�y�y�y�y�y�y�y�y�y�y�y�y�y�y�y�y�y�y�y�y�y�y�y�y�y�y�y�y�y�y�y�y�y�y�y�y�y�y�y�y�y�y�y�y�y�y�y�y�y�y�y�y�y�y�y�y�y�y�y�y�y�y�y�y�y�y�y�y�y�y�y�y�y�y�y�y�y�y�y�y�y�y�y�y�y�y�y�y�y�y�y�y�y�y�y�y�y�y�y�y�y�y�y�y�y�y�y�y�y�y�y�y�y�y�y�y�y�y�y�y�y�y�y�y�y�y�y�y�y�y�y�y�y�y�y�y�y�y�y�y�y�y�y�y�y�y�y�y�y�y�y�y�y�y�y�y�y�y�y�y�y�y�y�y�y�y��QQ¢¢�Q¢�Q¢�Q¢��QQ¢¢��QQ¢¢����QQQQ¢¢¢¢��QQ¢¢��QQ¢¢�Q¢�Q¢�Q¢�Q¢�Q¢�Q¢�Q¢�Q¢�Q¢�Q¢�Q¢�Q¢��QQ¢¢��QQ¢¢��QQ¢¢�Q¢�Q¢�Q¢�Q¢�Q¢�Q¢�Q¢�Q¢�Q¢�Q¢�Q¢�Q¢�Q¢�Q¢�Q¢�Q¢�Q¢�Q¢�Q¢�Q¢�Q¢�Q¢�Q¢�Q¢�Q¢�Q¢�Q¢�Q¢�Q¢�Q¢�Q¢�Q¢�Q¢�Q¢�Q¢�Q¢�Q¢�Q¢�Q¢�Q¢�Q¢�Q¢�Q¢�Q¢�Q¢�Q¢�Q¢�Q¢�Q¢�Q¢�Q¢�Q¢�Q¢�Q¢�Q¢�Q¢�Q¢�Q¢�Q¢�Q¢�Q¢�Q¢�Q¢�Q¢�Q¢�Q¢�Q¢�Q¢�Q¢�Q¢�Q¢�Q¢�Q¢�Q¢�Q¢�Q¢�Q¢�Q¢�Q¢�Q¢�Q¢�Q¢�Q¢�Q¢�Q¢�Q¢�Q¢�Q¢�Q¢�Q¢�Q¢�Q¢�Q¢�Q¢�Q¢�Q¢�Q¢�Q¢
�Q¢�Q¢�Q¢�Q¢�Q¢��QQ¢¢�Q¢��QQ¢¢�Q¢
��QQ¢¢��QQ¢¢
��QQ¢¢�Q¢�Q¢�Q¢ �Q¢�Q¢ �Q¢�Q¢�Q¢�Q¢�Q¢�Q¢�Q¢ �Q¢�Q¢�Q¢��QQ¢¢�Q¢�Q¢�Q¢�Q¢ �Q¢�Q¢�Q¢�Q¢�Q¢ �Q¢�Q¢�Q¢�Q¢�Q¢�Q¢ �Q¢�Q¢ �Q¢�Q¢�Q¢�Q¢�Q¢�Q¢ �Q¢�Q¢�Q¢�Q¢�Q¢�Q¢�Q¢�Q¢�Q¢�Q¢�Q¢�Q¢�Q¢�Q¢�Q¢�Q¢�Q¢�Q¢�Q¢�Q¢ �Q¢�Q¢�Q¢�Q¢�Q¢�Q¢�Q¢�Q¢�Q¢�Q¢�Q¢�Q¢�Q¢�Q¢�Q¢�Q¢�Q¢�Q¢�Q¢�Q¢�Q¢�Q¢�Q¢�Q¢�Q¢�Q¢�Q¢�Q¢�Q¢�Q¢�Q¢�Q¢�Q¢�Q¢�Q¢�Q¢�Q¢�Q¢�Q¢�Q¢�Q¢�Q¢�Q¢�Q¢�Q¢�Q¢�Q¢�Q¢�Q¢�Q¢�Q¢�Q¢�Q¢�Q¢�Q¢�Q¢�Q¢�Q¢�Q¢�Q¢�Q¢�Q¢�Q¢�Q¢�Q¢�Q¢�Q¢�Q¢�Q¢�Q¢�Q¢�Q¢�Q¢�Q¢�Q¢�Q¢�Q¢�Q¢�Q¢�Q¢�Q¢�Q¢�Q¢�Q¢�Q¢�Q¢�Q¢�Q¢�Q¢�Q¢�Q¢�Q¢�Q¢�Q¢�Q¢�Q¢�Q¢�Q¢�Q¢�Q¢�Q¢�Q¢�Q¢�Q¢�Q¢�Q¢�Q¢�Q¢�Q¢�Q¢�Q¢�Q¢�Q¢�Q¢�Q¢�Q¢�Q¢�Q¢�Q¢�Q¢�Q¢�Q¢�Q¢�Q¢�Q¢�Q¢�Q¢�Q¢�Q¢�Q¢�Q¢�Q¢�Q¢�Q¢�Q¢�Q¢�Q¢�Q¢�Q¢�Q¢�Q¢�Q¢�Q¢�Q¢�Q¢�Q¢�Q¢�Q¢�Q¢�Q¢�Q¢�Q¢�Q¢�Q¢�Q¢�Q¢�Q¢�Q¢�Q¢�Q¢�Q¢�Q¢�Q¢�Q¢�Q¢�Q¢�Q¢�Q¢�Q¢�Q¢�Q¢�Q¢�Q¢�Q¢�Q¢�Q¢�Q¢�Q¢�Q¢�Q¢�Q¢�Q¢�Q¢�Q¢�Q¢�Q¢�Q¢�Q¢�Q¢�Q¢ �Q¢�Q¢�Q¢�Q¢�Q¢�Q¢�Q¢�Q¢�Q¢��QQ¢¢�Q¢�Q¢�Q¢�Q¢�Q¢�Q¢�Q¢�Q¢�Q¢�Q¢�Q¢��QQ¢¢�Q¢�Q¢�Q¢�Q¢�Q¢�Q¢�Q¢�Q¢�Q¢�Q¢�Q¢�Q¢�Q¢�Q¢�Q¢�Q¢�Q¢�Q¢�Q¢�Q¢�Q¢�Q¢�Q¢�Q¢�Q¢�Q¢�Q¢�Q¢�Q¢�Q¢�Q¢�Q¢�Q¢�Q¢�Q¢�Q¢�Q¢�Q¢�Q¢�Q¢�Q¢�Q¢�Q¢�Q¢�Q¢�Q¢�Q¢�Q¢�Q¢�Q¢�Q¢�Q¢�Q¢�Q¢�Q¢�Q¢�Q¢�Q¢�Q¢�Q¢�Q¢�Q¢�Q¢�Q¢�Q¢�Q¢�Q¢�Q¢�Q¢�Q¢�Q¢�Q¢�Q¢�Q¢�Q¢�Q¢�Q¢�Q¢�Q¢�Q¢�Q¢�Q¢�Q¢�Q¢�Q¢�Q¢�Q¢�Q¢�Q¢�Q¢�Q¢�Q¢�Q¢�Q¢�Q¢�Q¢�Q¢�Q¢�Q¢�Q¢�Q¢�Q¢�Q¢�Q¢�Q¢�Q¢�Q¢�Q¢�Q¢�Q¢�Q¢�Q¢�Q¢�Q¢�Q¢�Q¢�Q¢�Q¢�Q¢�Q¢�Q¢�Q¢�Q¢�Q¢�Q¢�Q¢�Q¢�Q¢�Q¢�Q¢

43Social support programs
65–75 per cent75–85 per cent85–95 per cent95–100 per centInsufficient data
D Awareness of Age Pension,by statistical division, 1995
% of households
�Q¢�Q¢
�y�Q¢�Q¢�Q¢�Q¢�Q¢�Q¢�Q¢�Q¢�Q¢�Q¢�Q¢�Q¢�Q¢�Q¢�Q¢�Q¢�Q¢�Q¢�Q¢�Q¢�Q¢�Q¢�Q¢�Q¢�Q¢�Q¢�Q¢�Q¢�Q¢�Q¢�Q¢�Q¢�Q¢����QQQQ¢¢¢¢�Q¢�Q¢��QQ¢¢�Q¢�Q¢�Q¢�Q¢�Q¢�Q¢�Q¢�Q¢�Q¢����QQQQ¢¢¢¢��QQ¢¢�Q¢�Q¢��QQ¢¢�Q¢��QQ¢¢
�Q¢�Q¢�Q¢�Q¢�Q¢�Q¢�Q¢�Q¢�Q¢�Q¢�Q¢�Q¢�Q¢�Q¢�Q¢�Q¢�Q¢�Q¢�Q¢�Q¢�Q¢�Q¢�Q¢�Q¢�Q¢�Q¢�Q¢�Q¢�Q¢�Q¢�Q¢�Q¢�Q¢�Q¢�Q¢�Q¢�Q¢�Q¢�Q¢�Q¢�Q¢�Q¢�Q¢�Q¢�Q¢�Q¢�Q¢�Q¢�Q¢�Q¢�Q¢�Q¢�Q¢�Q¢�Q¢�Q¢�Q¢�Q¢�Q¢�Q¢�Q¢�Q¢�Q¢�Q¢�Q¢�Q¢�Q¢�Q¢�Q¢�Q¢�Q¢�Q¢�Q¢�Q¢�Q¢�Q¢�Q¢�Q¢�Q¢�Q¢�Q¢�Q¢�Q¢�Q¢�Q¢�Q¢�Q¢�Q¢�Q¢�Q¢�Q¢�Q¢�Q¢�Q¢�Q¢�Q¢ �Q¢�Q¢�Q¢�Q¢ �Q¢�Q¢ �Q¢�Q¢�Q¢ �Q¢�Q¢�Q¢�Q¢�Q¢�Q¢�Q¢�Q¢�Q¢ �Q¢�Q¢�Q¢�Q¢�Q¢�Q¢�Q¢ �Q¢�Q¢�Q¢�Q¢�Q¢�Q¢ �Q¢�Q¢�Q¢�Q¢�Q¢�Q¢�Q¢�Q¢ �Q¢�Q¢�Q¢ �Q¢�Q¢�Q¢�Q¢�Q¢�Q¢�Q¢�Q¢�Q¢ �Q¢�Q¢�Q¢�Q¢�Q¢ �Q¢�Q¢�Q¢�Q¢�Q¢ �Q¢�Q¢�Q¢�Q¢�Q¢�Q¢�Q¢�Q¢ �Q¢�Q¢ �Q¢�Q¢�Q¢�Q¢�Q¢�Q¢�Q¢�Q¢�Q¢�Q¢�Q¢�Q¢�Q¢�Q¢�Q¢�Q¢�Q¢�Q¢�Q¢�Q¢�Q¢�Q¢�Q¢�Q¢�Q¢�Q¢�Q¢�Q¢�Q¢�Q¢�Q¢�Q¢�Q¢�Q¢�Q¢�Q¢�Q¢��QQ¢¢�Q¢�Q¢�Q¢�Q¢�Q¢��QQ¢¢�Q¢��QQ¢¢��QQ¢¢�Q¢��QQ¢¢�Q¢�Q¢�Q¢�Q¢�Q¢�Q¢�Q¢�Q¢�Q¢�Q¢�Q¢�Q¢�Q¢�Q¢�Q¢�Q¢�Q¢�Q¢�Q¢�Q¢�Q¢�Q¢�Q¢�Q¢�Q¢�Q¢�Q¢�Q¢�Q¢�Q¢�Q¢�Q¢�Q¢�Q¢�Q¢�Q¢�Q¢�Q¢�Q¢�Q¢�Q¢�Q¢�Q¢�Q¢�Q¢�Q¢�Q¢�Q¢�Q¢�Q¢�Q¢�Q¢�Q¢�Q¢�Q¢�Q¢�Q¢�Q¢�Q¢�Q¢�Q¢�Q¢�Q¢�Q¢�Q¢�Q¢�Q¢�Q¢�Q¢�Q¢�Q¢�Q¢�Q¢�Q¢�Q¢�Q¢�Q¢�Q¢�Q¢�Q¢�Q¢�Q¢�Q¢�Q¢�y�y�y�y�y�y�y�y�y�y�y�y�y�y�y�y�y�y�y�y�y�y�y�y�y�y�y�y�y�y�y�y�y�y�y�y�y�y�y�y�y�y�y�y�y�y�y�y�y�y�y�y�y�y�y�y�y�y�y�y�y
65–75 per cent75–85 per cent85–95 per cent95–100 per centInsufficient data
E Awareness of AUSTUDY/ABSTUDY,by statistical division, 1995
% of households
�Q¢�Q¢�y�Q¢�Q¢�Q¢�Q¢�Q¢�Q¢�Q¢�Q¢�Q¢�Q¢�Q¢�Q¢�Q¢�Q¢�Q¢�Q¢�Q¢�Q¢�Q¢�Q¢�Q¢�Q¢�Q¢�Q¢�Q¢�Q¢�Q¢�Q¢�Q¢�Q¢�Q¢�Q¢�Q¢�Q¢�Q¢�Q¢
��QQ¢¢��QQ¢¢�Q¢�Q¢�Q¢�Q¢�Q¢�Q¢�Q¢�Q¢�Q¢�Q¢�Q¢�Q¢�Q¢�Q¢�Q¢�Q¢�Q¢�Q¢�Q¢�Q¢�Q¢�Q¢�Q¢�Q¢�Q¢�Q¢�Q¢�Q¢�Q¢�Q¢�Q¢�Q¢�Q¢�Q¢�Q¢�Q¢�Q¢�Q¢�Q¢�Q¢�Q¢�Q¢�Q¢�Q¢�Q¢�Q¢��QQ¢¢�Q¢��QQ¢¢��QQ¢¢�Q¢��QQ¢¢�Q¢��QQ¢¢�Q¢��QQ¢¢��QQ¢¢��QQ¢¢�Q¢�Q¢�Q¢�Q¢�Q¢�Q¢�Q¢�Q¢�Q¢�Q¢�Q¢�Q¢�Q¢�Q¢�Q¢�Q¢�Q¢�Q¢�Q¢�Q¢�Q¢�Q¢�Q¢�Q¢�Q¢�Q¢�Q¢�Q¢�Q¢�Q¢�Q¢�Q¢�Q¢�Q¢�Q¢�Q¢�Q¢�Q¢�Q¢�Q¢�Q¢�Q¢�Q¢�Q¢�Q¢�Q¢�Q¢�Q¢�Q¢�Q¢�Q¢�Q¢�Q¢�Q¢�Q¢�Q¢�Q¢�Q¢�Q¢�Q¢�Q¢�Q¢�Q¢�Q¢�Q¢�Q¢�Q¢�Q¢�Q¢�Q¢�Q¢�Q¢�Q¢�Q¢�Q¢�Q¢�Q¢�Q¢�Q¢�Q¢�Q¢�Q¢�Q¢�Q¢�Q¢�Q¢�Q¢�Q¢�Q¢�Q¢�Q¢�Q¢�Q¢�Q¢�Q¢�Q¢�Q¢�Q¢�Q¢�Q¢�Q¢�Q¢�Q¢�Q¢�Q¢�Q¢�Q¢�Q¢�Q¢�Q¢�Q¢�Q¢�Q¢�Q¢�Q¢�Q¢�Q¢�Q¢�Q¢�Q¢�Q¢�Q¢�Q¢�Q¢�Q¢�Q¢�Q¢�Q¢ �Q¢�Q¢�Q¢ �Q¢�Q¢�Q¢�Q¢�Q¢�Q¢ �Q¢�Q¢ �Q¢�Q¢�Q¢ �Q¢�Q¢�Q¢�Q¢ �Q¢�Q¢�Q¢�Q¢�Q¢�Q¢�Q¢�Q¢�Q¢ �Q¢�Q¢�Q¢�Q¢ �Q¢�Q¢�Q¢�Q¢ �Q¢�Q¢�Q¢�Q¢�Q¢ �Q¢�Q¢�Q¢�Q¢�Q¢�Q¢ �Q¢�Q¢ �Q¢�Q¢ �Q¢�Q¢�Q¢ �Q¢�Q¢ �Q¢�Q¢�Q¢ �Q¢�Q¢�Q¢ �Q¢�Q¢�Q¢�Q¢�Q¢�Q¢ �Q¢�Q¢�Q¢�Q¢�Q¢ �Q¢�Q¢�Q¢ �Q¢�Q¢ �Q¢�Q¢�Q¢�Q¢ �Q¢�Q¢ �Q¢�Q¢ �Q¢�Q¢�Q¢ �Q¢�Q¢�Q¢�Q¢�Q¢�Q¢�Q¢�Q¢�Q¢�Q¢�Q¢�Q¢�Q¢�Q¢ �Q¢�Q¢�Q¢�Q¢�Q¢�Q¢�Q¢�Q¢�Q¢�Q¢�Q¢�Q¢ �Q¢�Q¢�Q¢�Q¢�Q¢�Q¢�Q¢�Q¢�Q¢�Q¢�Q¢�Q¢�Q¢�Q¢�Q¢�Q¢�Q¢�Q¢�Q¢�Q¢�Q¢�Q¢�Q¢�Q¢�Q¢�Q¢�Q¢�Q¢�Q¢�Q¢��QQ¢¢�Q¢�Q¢�Q¢�Q¢�Q¢�Q¢�Q¢�Q¢�Q¢�Q¢�Q¢�Q¢�Q¢�Q¢�Q¢�Q¢�Q¢�Q¢�Q¢�Q¢�Q¢�Q¢�Q¢�Q¢�Q¢�Q¢�Q¢�Q¢�Q¢�Q¢�Q¢�Q¢�Q¢�Q¢�Q¢�Q¢�Q¢�Q¢�Q¢�Q¢�Q¢�Q¢�Q¢�Q¢�Q¢�Q¢�Q¢�Q¢�Q¢�Q¢�Q¢�Q¢�Q¢�Q¢�Q¢�Q¢�Q¢�Q¢�Q¢�Q¢�Q¢�Q¢�Q¢�Q¢�Q¢�Q¢�Q¢�Q¢�Q¢�Q¢�Q¢�Q¢�Q¢�Q¢�Q¢�Q¢�Q¢�Q¢�Q¢�Q¢�Q¢�Q¢�Q¢�Q¢�Q¢�Q¢�Q¢�Q¢�Q¢�Q¢�Q¢�Q¢�Q¢�Q¢�Q¢�Q¢�Q¢�Q¢�Q¢�Q¢�y�y�y�y�y�y�y�y�y�y�y�y�y�y�y�y�y�y�y�y�y�y�y�y�y�y�y�y�y�y�y�y�y�y�y�y�y�y�y�y�y�y�y�y�y�y�y�y�y�y�y�y�y�y�y�y�y�y�y�y�y�y�y�y�y�y�y�y�y�y�y�y�y�y�y�y�y�y�y�y�y�y�y�y�y�y�y�y�y�y�y�y�y�y�y�y�y�y�y�y�y

44 ABARE research report 97.7
25–35 per cent35–45 per cent45–55 per cent55–65 per cent65–75 per cent75–85 per cent85–95 per cent95–100 per centInsufficient data
F Awareness of Rural Adjustment Scheme,by statistical division, 1995
% of households
�y�y�y�y�y��yy��yy�y�y�y�y�y�y�y�y�y�y�y�y�y�y�y�y�y�y�y�y�y�y�y�y�y�y�y�y�y�Q¢�Q¢�Q¢�Q¢�Q¢��QQ¢¢�Q¢�Q¢�Q¢�Q¢�Q¢�Q¢�Q¢�Q¢�Q¢�Q¢�Q¢�Q¢�Q¢�Q¢�Q¢�Q¢�Q¢�Q¢�Q¢�Q¢�Q¢�Q¢�Q¢�Q¢�Q¢�Q¢�Q¢��QQ¢¢�Q¢�Q¢�Q¢�Q¢��
��QQQQ¢¢¢¢�Q¢�Q¢��QQ¢¢�Q¢�Q¢��
��QQQQ¢¢¢¢�Q¢�Q¢�Q¢����QQQQ¢¢¢¢�Q¢�Q¢�y�y�y�y�y�y�y ��yy�y�y
�y�y�y�y�y�y�y�y
55–65 per cent65–75 per cent75–85 per cent85–95 per centInsufficient data
G Awareness of Drought Relief Payment,by statistical division, 1995
% of households
�y�Q¢��QQ¢¢
�y�Q¢�Q¢�Q¢�Q¢�Q¢�Q¢�Q¢��QQ¢¢�Q¢�Q¢�Q¢�Q¢�Q¢��QQ¢¢�Q¢�Q¢�Q¢�Q¢�Q¢�Q¢�Q¢�Q¢��QQ¢¢�Q¢�Q¢�Q¢�Q¢�Q¢�Q¢�Q¢��QQ¢¢��QQ¢¢�Q¢�Q¢��QQ¢¢�Q¢����QQQQ¢¢¢¢�Q¢�Q¢�Q¢�Q¢�Q¢��QQ¢¢�Q¢�Q¢�Q¢�Q¢�Q¢�Q¢�Q¢�Q¢�Q¢�Q¢�Q¢�Q¢�Q¢�Q¢�Q¢�Q¢�Q¢�Q¢�Q¢��QQ¢¢�Q¢�Q¢��QQ¢¢��QQ¢¢�Q¢��QQ¢¢��QQ¢¢�Q¢�Q¢�Q¢�Q¢�Q¢�Q¢�Q¢�Q¢�Q¢�Q¢�Q¢�Q¢�Q¢�Q¢�Q¢�Q¢�Q¢��QQ¢¢�Q¢�Q¢�Q¢�Q¢�Q¢�Q¢�Q¢�Q¢�Q¢�Q¢�Q¢�Q¢�Q¢�Q¢�Q¢�Q¢�Q¢�Q¢�Q¢�Q¢�Q¢�Q¢�Q¢�Q¢�Q¢�Q¢�Q¢�Q¢�Q¢�Q¢�Q¢�Q¢�Q¢�Q¢�Q¢�Q¢�Q¢�Q¢�Q¢�Q¢�Q¢�Q¢�Q¢�Q¢�Q¢�Q¢�Q¢�Q¢�Q¢�Q¢�Q¢�Q¢�Q¢�Q¢�Q¢�Q¢�Q¢�Q¢�Q¢�Q¢�Q¢�Q¢�Q¢�Q¢�Q¢�Q¢�Q¢�Q¢�Q¢�Q¢�Q¢�Q¢�Q¢��QQ¢¢�Q¢��QQ¢¢�Q¢��QQ¢¢��QQ¢¢�Q¢�Q¢�Q¢�Q¢�Q¢�Q¢�Q¢�Q¢�Q¢�Q¢�Q¢�Q¢�Q¢�Q¢�Q¢�Q¢�Q¢�Q¢�Q¢�Q¢�Q¢�Q¢�Q¢�Q¢�Q¢�Q¢�Q¢�Q¢�Q¢�Q¢�Q¢�Q¢�Q¢�Q¢�Q¢�Q¢�Q¢�Q¢�Q¢�Q¢�Q¢�Q¢�Q¢�Q¢�Q¢�Q¢�Q¢�Q¢�Q¢�Q¢�Q¢�Q¢�Q¢�Q¢�Q¢�Q¢�Q¢�Q¢�Q¢�Q¢�Q¢�Q¢�Q¢�Q¢�Q¢�Q¢�Q¢�Q¢�Q¢�Q¢�Q¢�Q¢�Q¢�Q¢�Q¢�Q¢�Q¢�Q¢�Q¢�Q¢�Q¢�Q¢
�y�y�y�y�y�y�y�y�y�y�y�y�y�y�y�y�y�y�y�y�y�y�y�y�y�y�y�y�y�y�y�y�y�y�y�y�y�y�y�y�y�y�y�y�y�y�y�y�y�y�y�y�y�y�y�y�y�y�y�y�y�y�y�y�y�y�y�y�y�y�y�y�y�y�y�y�y�y�y�y�y�y�y�y�y�y�y�y�y�y�y�y�y�y�y�y�y�y�y�y�y�y�y�y�y�y�y�y�y�y�y�y�y�y�y�y�y�y�y�y�y�y�y�y�y�y�y�y�y�y�y�y�y�y�y�y�y�y�y�y�y�y�y�y�y�y�y�y�y�y�y�y�y�y�y�y�y�y�y�y�y�y�y�y�y�y�y�y�y�y�y�y�y�y�y�y�y�y�y�y�y�y�y�y�y�y�y�y�y�y�y�y�y�y�y�y�y�y�y�y�y�y�y�y�y�y�y�y�y�y�y�y�y�y�y�y�y�y�y�y�y�y�y�y�y�y�y�y�y�y�y�y�y�y�y�y�y�y�y�y�y�y�y�y�y�y�y�y�y�y�y�y�y�y�y�y�y�y�y�y�y�y�y�y�y�y�y�y�y�y�y�y�y�y�y�y�y�y�y�y�y�y�y�y�y�y�y�y�y�y�y�y�y�y�y�y�y�y�y�y�y�y�y�y�y�y�y�y�y�y�y�y�y�y�y�y�y�y�y�y�y�y�y�y�y�y�y�y�y�y�y�y�y�y�y�y�y�y�y�y�y

Age Pension (map D) and more than 85 per cent of households with a youngperson aged 16–21 years were aware of AUSTUDY (map E). Nationally, 94per cent of households were aware of each of these programs. However,outside Darwin in the Northern Territory, only 61 per cent of householdswere aware of the Age Pension.
Awareness of the Rural Adjustment Scheme varied considerably from thenational average of 66 per cent among households in all states (map F).Awareness was generally lowest in the metropolitan areas, and was highestin far west of New South Wales, Eyre in South Australia, south easternWestern Australia and Hobart in Tasmania.
In New South Wales and South Australia, those areas with more than 75 percent of households aware of the drought relief program generally matchedareas declared to be in drought exceptional circumstances (map G). (Notethat drought exceptional circumstances areas do not match statisticaldivisions very closely.) In northern Queensland, relatively few propertieswere declared to be in drought exceptional circumstances at the time of thesurvey, compared with the number in the rest of the state, and awareness inQueensland reflected this.
Sources of information about programsFarm households obtained most of their information about programs fromfamily, friends and the media. Specifically, around two in five householdsindicated that family and friends were their source of information about theAge Pension and the Sole Parent Pension. More households said the mediawas their source of information about Job Search Allowance and theprograms managed by the Department of Primary Industries and Energy(figure 9).
Specialist sources, such as the Department of Social Security and studentassistance centres were important for particular programs: for example,approximately one in three indicated that the Department of Social Securitywas their source of information about the Basic Family Payment.
Less than 1 per cent of households received their information about socialsecurity income support payments or student assistance payments from ruralcounsellors. However, rural counsellors were slightly more important as asource of information for the Rural Adjustment Scheme, Drought ReliefPayment and Farm Household Support than for other programs.
45Social support programs

Use of programsUse of a particular program was analysed for three groups within thesurveyed population:
• recipient households: those that were receiving assistance at the time ofthe survey interview, had received assistance in the three years before thesurvey, or had been approved to receive assistance in the three years beforethe survey;
• nonrecipient target households;
• nontarget households.
All households in the survey population were included in one of the abovethree groups. The first two groups together constituted the target householdsfor the program as described at the beginning of this chapter. All householdswere targeted for seven of the programs.
The nonrecipient target households were grouped as:
• households that were unaware of the program;
46 ABARE research report 97.7
9 Sources of information about programs, 1995
% of households aware of program0 20 40 60 80 100
Basic Family Payment a
Job Search Allowance
Age Pension a
Sole Parent Pension b
Sickness Allowance
Disability Support Pension c
AUSTUDY and ABSTUDY a
Assistance for Isolated Children a
Rural Adjustment Scheme
Drought Relief Payment d
Farm Household Support
Rural Counselling Program
Countrylink
Rural Access Program
a Relates to households containing people of eligible age. b Relates to households with a sole parent. c Relates to households with a person with a disability. d Relates to farms in Queensland and areas declared to be in drought exceptional circumstances. e Includes ABC regional radio, rural newspapers and other media. f Includes state government agencies and other government agencies. g Includes consultant, accountant, bank, solicitor, school, student assistance centre, rural counsellor, church, welfare and other.
Family/friends CES DSS Media e Govt agencies f Other g

• households that were aware of a program but had not applied forassistance;
• households that had been rejected in their application for assistance in thethree years before the survey;
• households that were waiting for the results of their application forassistance.
Analysis relating to the seven household groups is shown for each programin figure 10. Some of these groups were not relevant to some programs. Noinformation was collected about awareness for the Disability Support andSole Parent Pensions, and application data were not relevant to Countrylink,the Rural Counselling Program or the Rural Access Program.
The proportion of households in the surveyed population that had receivedassistance from a social support or related program in the three years beforethe survey differed substantially between programs. For example, 22 percent of all farm households surveyed had received the Basic Family Paymentin the three years before the survey, compared with 12 per cent for the RuralAdjustment Scheme, 10 per cent for AUSTUDY, 7 per cent for both theDrought Relief Payment and Job Search, and less than 1 per cent for boththe Sole Parent Pension and Rural Access Program.
When considering only target households, a better indication of use wasapparent for some programs. Fifty-seven per cent of households with at leastone child younger than 18 years had received the Basic Family Paymentduring the three years before the survey and 45 per cent of households witha person aged 16–21 years had received AUSTUDY. Twenty-four per cent ofhouseholds with a female older than 60 years or a male older than 65 yearshad received the Age Pension during the survey period. Of those householdsin Queensland and those areas of New South Wales, South Australia andTasmania that were in drought exceptional circumstances in March 1995,22 per cent had received the Drought Relief Payment since its introductionin 1994.
Differences in the proportion of all farm households that received paymentwas expected between programs as a result of differences in the size of thetarget populations as defined by each program. For example, among othereligibility conditions, a recipient of the Sole Parent Pension had to be a soleparent and a recipient of the Basic Family Payment had to have a childyounger than 18 years: only 5 per cent of all surveyed households included
47Social support programs
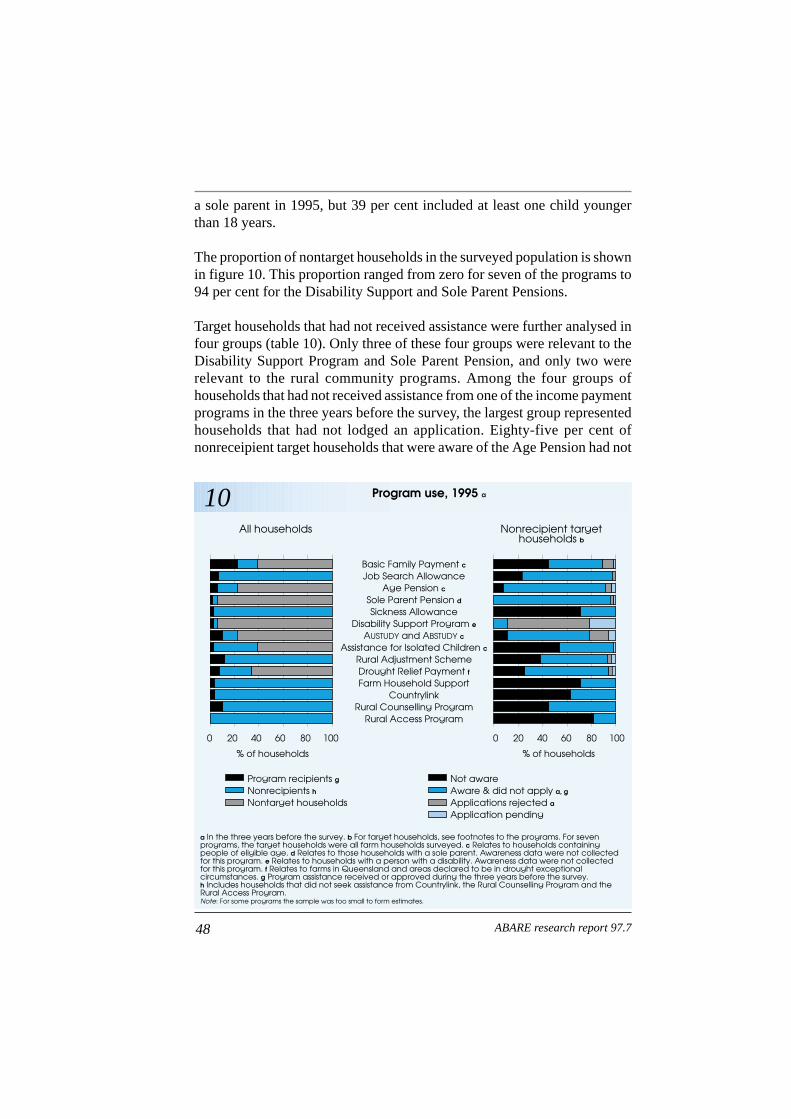
a sole parent in 1995, but 39 per cent included at least one child youngerthan 18 years.
The proportion of nontarget households in the surveyed population is shownin figure 10. This proportion ranged from zero for seven of the programs to94 per cent for the Disability Support and Sole Parent Pensions.
Target households that had not received assistance were further analysed infour groups (table 10). Only three of these four groups were relevant to theDisability Support Program and Sole Parent Pension, and only two wererelevant to the rural community programs. Among the four groups ofhouseholds that had not received assistance from one of the income paymentprograms in the three years before the survey, the largest group representedhouseholds that had not lodged an application. Eighty-five per cent ofnonreceipient target households that were aware of the Age Pension had not
48 ABARE research report 97.7
10 Program use, 1995 a
Program recipients gNonrecipients hNontarget households
Not awareAware & did not apply a, g
Applications rejected aApplication pending
All households Nonrecipient targethouseholds b
a In the three years before the survey. b For target households, see footnotes to the programs. For seven programs, the target households were all farm households surveyed. c Relates to households containing people of eligible age. d Relates to those households with a sole parent. Awareness data were not collected for this program. e Relates to households with a person with a disability. Awareness data were not collected for this program. f Relates to farms in Queensland and areas declared to be in drought exceptional circumstances. g Program assistance received or approved during the three years before the survey. h Includes households that did not seek assistance from Countrylink, the Rural Counselling Program and the Rural Access Program.Note: For some programs the sample was too small to form estimates.
Basic Family Payment cJob Search Allowance
Age Pension cSole Parent Pension dSickness Allowance
Disability Support Program eAUSTUDY and ABSTUDY c
Assistance for Isolated Children cRural Adjustment SchemeDrought Relief Payment fFarm Household Support
CountrylinkRural Counselling Program
Rural Access Program
% of households
0 20 40 60 80 100
% of households
0 20 40 60 80 100

applied for assistance, and 75 per cent of households that were aware of JobSearch had not applied.
The largest group of target households that had not received assistance fromthe remaining programs represented households that were not aware of aparticular program. For example, 83 per cent of households that had notreceived grant assistance from the Rural Access Program and 46 per cent oftarget households that had not received assistance from the Basic FamilyPayment, were not aware of the particular program.
The percentage of households that had not received assistance because anapplication had been rejected in the three years before the survey rangedfrom less than 1 per cent for both the Assistance for Isolated Children
49Social support programs
10 Target households that did not receive assistance in the three yearsbefore the survey a
Percentage of households
Not aware Aware
Did notapply b Rejected Pending
no. % % % %
Basic Family Payment c 23 819 45 (5) 44 (5) 8.1 (13) 2.2 (29)Job Search Allowance 132 050 23 (3) 75 (1) 1.4 (15) 0.4 (27)Age Pension c 24 253 8 (14) 85 (2) 5.7 (17) 1.5 (36)Sole Parent Pension d 6 325 na 98 (1) 1.5 (70) 0.8 (99)Sickness Allowance 138 610 73 (1) 27 (3) 0.5 (24) 0.1 (70)Disability Support Pension e 4 495 na 88 (4) 5.1 (43) 6.5 (37)AUSTUDY c 16 806 11 (14) 68 (4) 17.7 (11) 2.5 (30)Assistance for Isolated
Children Scheme b 50 776 54 (3) 44 (3) 0.8 (31) 0.3(150)Rural Adjustment Scheme 125 069 38 (2) 56 (2) 4.5 (8) 0.1 (18)Drought Relief Payment f 36 011 26 (6) 69 (2) 3.5 (18) 1.6 (27)Farm Household Support 138 496 71 (1) 29 (2) – –Countrylink 137 518 63 (1) 37 (2) na naRural Counselling Program 131 520 46 (2) 54 (2) na naRural Access Program 140 661 83 (1) 17 (4) na na
a For target households, see footnotes to the programs. b Includes households that did not seekassistance from Countrylink, the Rural Counselling Program and the Rural Access Program. c Relatesto households containing people of eligible age. d Relates to households with a sole parent. e Relatesto households with a person with a disability. f Relates to farms in Queensland and areas declared tobe in drought exceptional circumstances in New South Wales, South Australia and Tasmania.– Negligible or no households in this category. na Not applicable.Note: Figures in parentheses are relative standard errors, expressed as percentages of the estimates.

Scheme and Sickness Allowance, to 6 per cent for the Age Pension and 18per cent for AUSTUDY.
Important reasons for the variation between these rejection percentagescould have been differences in: access to information about the assistanceprograms; the complexity of the application process, with more ineligiblepeople applying when access to detailed information is poor; the matchbetween target households as defined in this report and eligible householdsas defined by the program; and/or the needs of applicants relative to theeligibility limits for assets and incomes.
A small proportion of households that had applied for assistance werewaiting for the results of their application at the time of the survey. For eightof the programs, that proportion was less than 1 per cent of those householdsthat had not received assistance. However, 7 per cent of households that hadnot received assistance from the Disability Support Program were waitingfor their application to be assessed.
50 ABARE research report 97.7

Reasons for nonapplication
It has been argued that some farm families in need do not seek governmentincome support because they have strong negative feelings about welfare orbecause they have strong feelings of independence. However, on average,only 2 per cent of households across the programs did not apply for supportfrom a program of which they were aware of because they ‘wished to remainindependent’.
The relative importance of the reasons for nonapplication differed amongthe programs. However, for all programs, a substantial proportion ofhouseholds that did not apply for assistance (when they were aware of it)stated that the programs did not apply to them or that they did not needassistance. Together, these two reasons applied to 75 per cent of householdsthat did not apply for the Job Search Allowance, and 26 per cent of thosethat did not apply for the Age Pension.
51
7
Social support programs
11 Reasons for nonapplication, 1995
% of households aware of program0 20 40 60 80 100
Basic Family Payment a
Job Search Allowance
Age Pension a
Sole Parent Pension b
Sickness Allowance
Disability Support Pension c
AUSTUDY and ABSTUDY a
Assistance for Isolated Children a
Rural Adjustment Scheme
Drought Relief Payment d
Farm Household Support
Rural Counselling Program
a Relates to households containing people of eligible age. b Relates to households with a sole parent. c Relates to households with a person with a disability. d Relates to farms in Queensland and areas declared to be in drought exceptional circumstances.
Not interested: doesn't apply to me Not interested: don't need assistanceNot interested: don't want/agree with assistance/want independence
Assume not eligible Know not eligible Other

For many programs, a substantial proportion of households also indicatedthat they either knew, or assumed, that they were not eligible (figure 11).These eligibility reasons accounted for 67 per cent of households that didnot apply for the Age Pension despite knowing about the program.
Some of these apparent differences in the reasons for not applying forsupport were linked to the coverage of target households. As a programbecame more relevant because a member in the household met at least oneof the eligibility provisions (which the Age Pension did if there was anelderly person in the household), it was more likely that the household wouldconsider applying for assistance. In other words, it was more likely that thehousehold more clearly understood eligibility provisions and, consequently,that reasons about eligibility were articulated when explaining non-application. Other differences may have been a result of households beingunable to discriminate between the options provided for reasons forrejection.
The information obtained from the survey did not allow direct analysis ofthe proportion of households that did not apply for support because theyincorrectly assessed themselves as ineligible.
52 ABARE research report 97.7

Reasons for rejection of application
Among target households that had not received assistance from anyparticular program, 0–17.7 per cent had had an application for assistancerejected (table 10).
The most common reason for rejection by most programs was that thehousehold’s assets were too high. This was the case for 95 per cent ofhouseholds rejected for the Age Pension (figure 12). In the case of Job SearchAllowance, roughly two in five rejections were attributed to high assets, andone in five were a result of the household’s failure to meet the work eligibilitytest. High income was the major reason that applications for Drought ReliefPayment were rejected. In the case of the Rural Adjustment Scheme, highassets, high income, nonviability and other reasons were of similar impor-tance. A higher proportion of households on subcommercial farms said thatthey were rejected for Rural Adjustment Scheme assistance on ‘nonviability’grounds compared with that of households on commercial farms.
53
8
Social support programs
12 Reasons for rejection, 1995 a
% of households rejected0 20 40 60 80 100
a Rejections based on applications made in the three years before the survey. b Relates to households containing people of eligible age. c Relates to households with a sole parent. d Relates to households with a person with a disability. e Relates to farms in Queensland and areas declared to be in drought exceptional circumstances. Note: For some programs the sample was too small to form estimates.
Assets too high Farm income too high Off-farm income too highNot viable Other
Basic Family Payment b
Job Search Allowance
Age Pension b
Sole Parent Pension c
Sickness Allowance
Disability Support Pension d
AUSTUDY and ABSTUDY b
Assistance for Isolated Children b
Rural Adjustment Scheme
Drought Relief Payment e
Farm Household Support

Some confusion existed about reasons for rejection. For example, ‘notviable’ was given by some households as the reason for the rejection of theirapplication for the Basic Family Payment, whereas this criterion only appliesto the Rural Adjustment Scheme. Similarly, some households identified highon-farm income as the reason while other households identified high off-farm income. None of the programs distinguished between these sources ofincome in determining eligibility.
54 ABARE research report 97.7
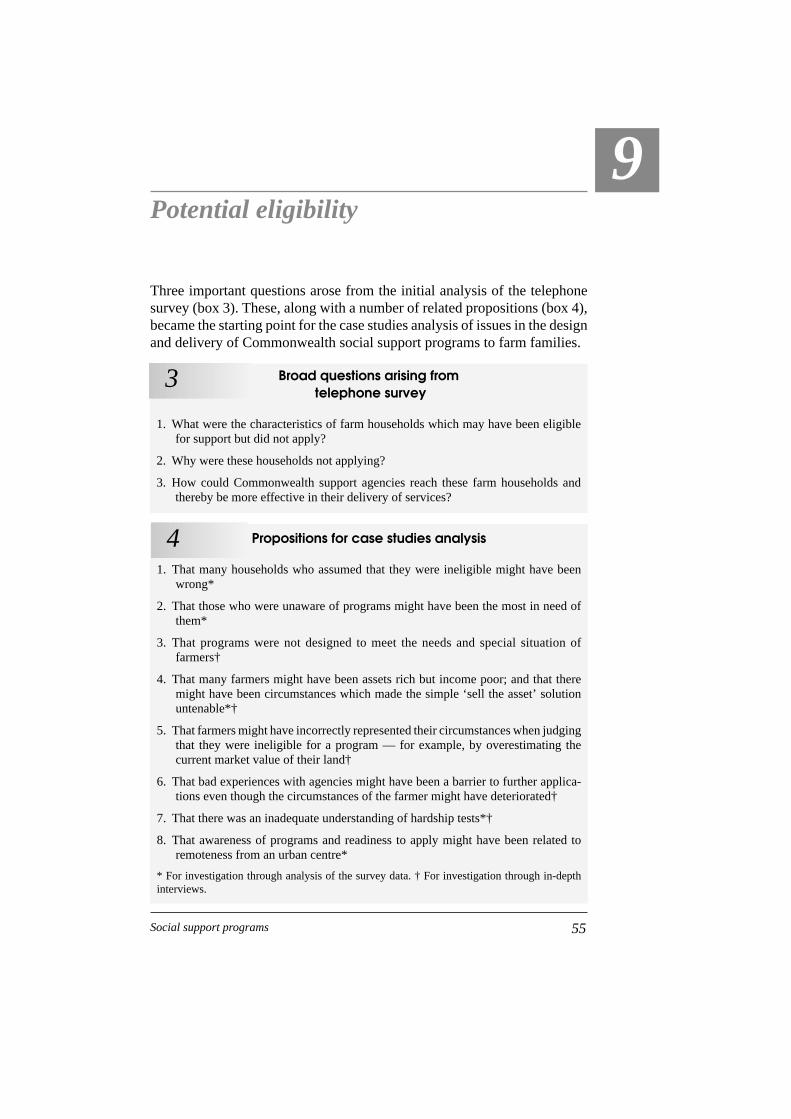
Potential eligibility
Three important questions arose from the initial analysis of the telephonesurvey (box 3). These, along with a number of related propositions (box 4),became the starting point for the case studies analysis of issues in the designand delivery of Commonwealth social support programs to farm families.
55
9
Social support programs
Broad questions arising fromtelephone survey
1. What were the characteristics of farm households which may have been eligiblefor support but did not apply?
2. Why were these households not applying?
3. How could Commonwealth support agencies reach these farm households andthereby be more effective in their delivery of services?
3
Propositions for case studies analysis
1. That many households who assumed that they were ineligible might have beenwrong*
2. That those who were unaware of programs might have been the most in need ofthem*
3. That programs were not designed to meet the needs and special situation offarmers†
4. That many farmers might have been assets rich but income poor; and that theremight have been circumstances which made the simple ‘sell the asset’ solutionuntenable*†
5. That farmers might have incorrectly represented their circumstances when judgingthat they were ineligible for a program — for example, by overestimating thecurrent market value of their land†
6. That bad experiences with agencies might have been a barrier to further applica-tions even though the circumstances of the farmer might have deteriorated†
7. That there was an inadequate understanding of hardship tests*†
8. That awareness of programs and readiness to apply might have been related toremoteness from an urban centre*
* For investigation through analysis of the survey data. † For investigation through in-depthinterviews.
4
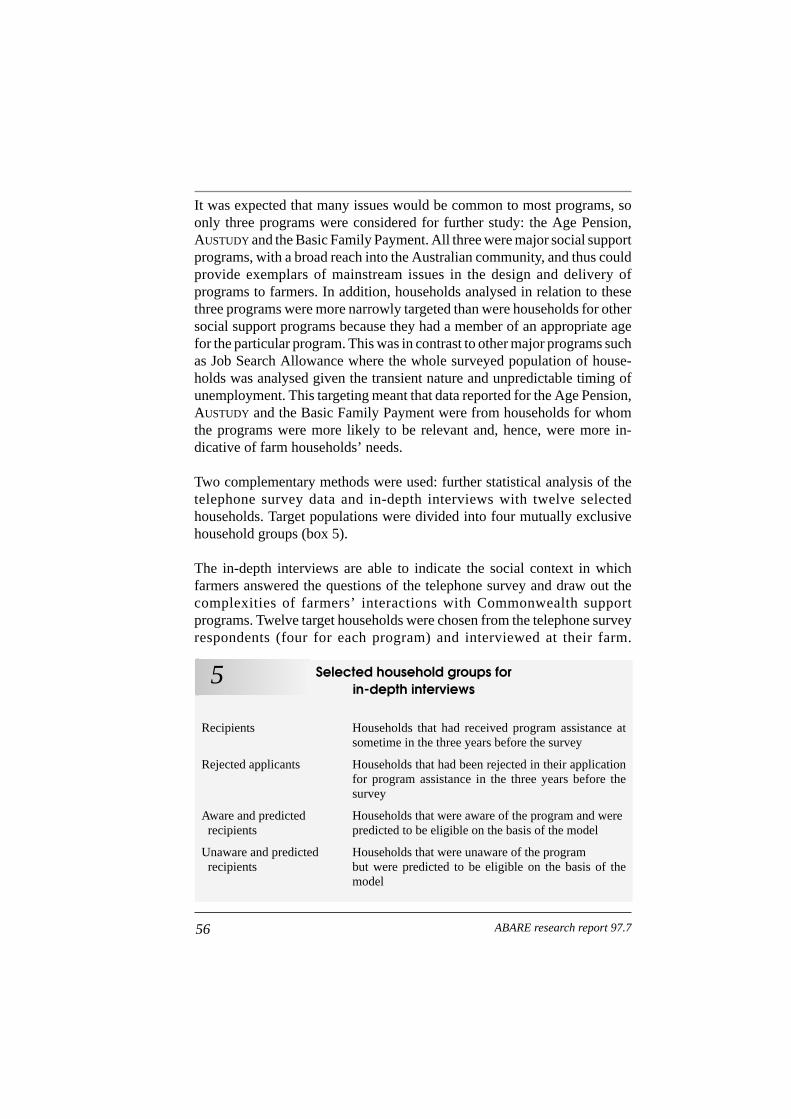
It was expected that many issues would be common to most programs, soonly three programs were considered for further study: the Age Pension,AUSTUDY and the Basic Family Payment. All three were major social supportprograms, with a broad reach into the Australian community, and thus couldprovide exemplars of mainstream issues in the design and delivery ofprograms to farmers. In addition, households analysed in relation to thesethree programs were more narrowly targeted than were households for othersocial support programs because they had a member of an appropriate agefor the particular program. This was in contrast to other major programs suchas Job Search Allowance where the whole surveyed population of house-holds was analysed given the transient nature and unpredictable timing ofunemployment. This targeting meant that data reported for the Age Pension,AUSTUDY and the Basic Family Payment were from households for whomthe programs were more likely to be relevant and, hence, were more in-dicative of farm households’ needs.
Two complementary methods were used: further statistical analysis of thetelephone survey data and in-depth interviews with twelve selectedhouseholds. Target populations were divided into four mutually exclusivehousehold groups (box 5).
The in-depth interviews are able to indicate the social context in whichfarmers answered the questions of the telephone survey and draw out thecomplexities of farmers’ interactions with Commonwealth supportprograms. Twelve target households were chosen from the telephone surveyrespondents (four for each program) and interviewed at their farm.
56 ABARE research report 97.7
Selected household groups forin-depth interviews
Recipients Households that had received program assistance atsometime in the three years before the survey
Rejected applicants Households that had been rejected in their applicationfor program assistance in the three years before thesurvey
Aware and predicted Households that were aware of the program and were recipients predicted to be eligible on the basis of the model
Unaware and predicted Households that were unaware of the program recipients but were predicted to be eligible on the basis of the
model
5

Households were selected on the basis that they had not received programsupport because they were unaware of the program or assumed/knew thatthey were not eligible. Only predicted recipients of support and those withlow to medium wellbeing scores were selected.
Originally, the intention was to interview only those target households thathad not applied for the relevant social support program. It became clearduring the interviews that some of the selected households did not clearlyunderstand the telephone survey questions on this issue, and had applied forsupport or, in some cases, were receiving support. One household hadsuccessfully applied following the telephone interview. Given the value oftheir information on family circumstances and the interaction of farmfamilies with Commonwealth support agencies in general, these householdswere retained in the case studies analysis.
It should be noted that the twelve households were neither representativenor average. Rather, they were chosen because they exhibited some specialfeatures signalled in the survey data.
Predictive analysisPredictions about successful applications were made according to a modelbased on decision tree analysis developed by ABARE (appendix B). Foreach program, a model was constructed using data from households that hadreceived program assistance in the three years before the telephone surveyor that had an application rejected.
Applied to households that had actually received a payment, the model hada predictive value of 89 per cent for AUSTUDY, 90 per cent for the AgePension and 96 per cent for the Basic Family Payment.
Predicted recipients among nonapplicantsThe number of predicted recipients for the Age Pension exceeded actualrecipients (table 11): 24 per cent of target households for the Age Pensionhad received the pension in the three years before the survey, compared with35 per cent that would have received the pension had they applied on thebasis of the prediction model. Eighty-five per cent of target households wereaware of the Age Pension but did not apply so did not receive assistance(table 10). Therefore, most predicted recipients would have been aware ofthe Age Pension.
57Social support programs
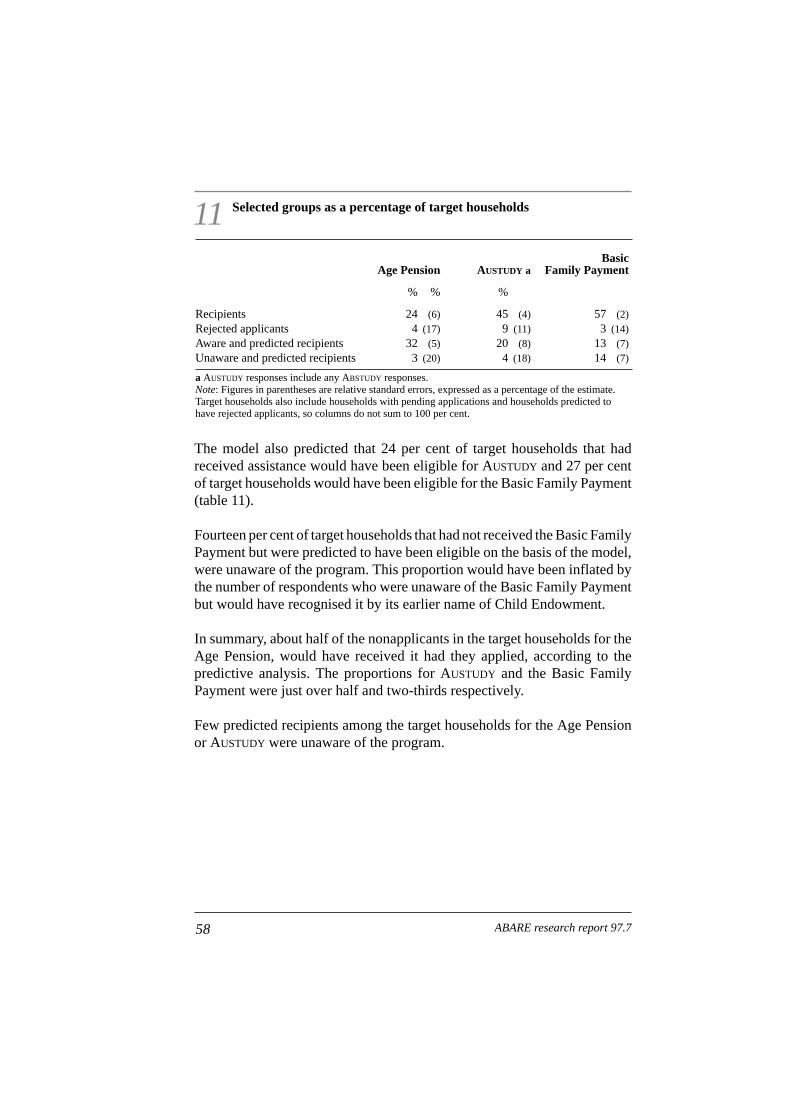
The model also predicted that 24 per cent of target households that hadreceived assistance would have been eligible for AUSTUDY and 27 per centof target households would have been eligible for the Basic Family Payment(table 11).
Fourteen per cent of target households that had not received the Basic FamilyPayment but were predicted to have been eligible on the basis of the model,were unaware of the program. This proportion would have been inflated bythe number of respondents who were unaware of the Basic Family Paymentbut would have recognised it by its earlier name of Child Endowment.
In summary, about half of the nonapplicants in the target households for theAge Pension, would have received it had they applied, according to thepredictive analysis. The proportions for AUSTUDY and the Basic FamilyPayment were just over half and two-thirds respectively.
Few predicted recipients among the target households for the Age Pensionor AUSTUDY were unaware of the program.
58 ABARE research report 97.7
11 Selected groups as a percentage of target households
Basic Age Pension AUSTUDY a Family Payment
% % %
Recipients 24 (6) 45 (4) 57 (2)Rejected applicants 4 (17) 9 (11) 3 (14)Aware and predicted recipients 32 (5) 20 (8) 13 (7)Unaware and predicted recipients 3 (20) 4 (18) 14 (7)
a AUSTUDY responses include any ABSTUDY responses.Note: Figures in parentheses are relative standard errors, expressed as a percentage of the estimate.Target households also include households with pending applications and households predicted tohave rejected applicants, so columns do not sum to 100 per cent.
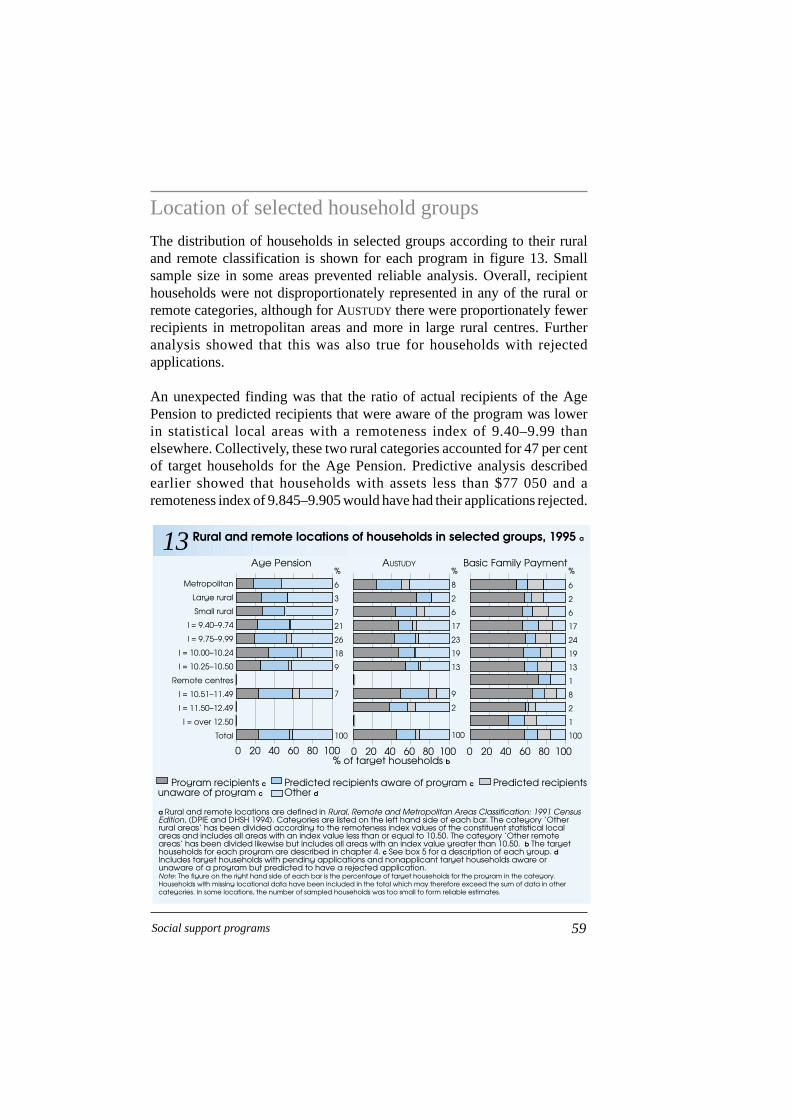
Location of selected household groups
The distribution of households in selected groups according to their ruraland remote classification is shown for each program in figure 13. Smallsample size in some areas prevented reliable analysis. Overall, recipienthouseholds were not disproportionately represented in any of the rural orremote categories, although for AUSTUDY there were proportionately fewerrecipients in metropolitan areas and more in large rural centres. Furtheranalysis showed that this was also true for households with rejectedapplications.
An unexpected finding was that the ratio of actual recipients of the AgePension to predicted recipients that were aware of the program was lowerin statistical local areas with a remoteness index of 9.40–9.99 thanelsewhere. Collectively, these two rural categories accounted for 47 per centof target households for the Age Pension. Predictive analysis describedearlier showed that households with assets less than $77 050 and aremoteness index of 9.845–9.905 would have had their applications rejected.
59Social support programs
13 Rural and remote locations of households in selected groups, 1995 a
Metropolitan
Large rural
Small rural
I = 9.40–9.74
I = 9.75–9.99
I = 10.00–10.24
I = 10.25–10.50
Remote centres
I = 10.51–11.49
I = 11.50–12.49
I = over 12.50
Total
0 20 40 60 80 100% of target households b
0 20 40 60 80 100 0 20 40 60 80 100
a Rural and remote locations are defined in Rural, Remote and Metropolitan Areas Classification: 1991 Census Edition, (DPIE and DHSH 1994). Categories are listed on the left hand side of each bar. The category ’Other rural areas‘ has been divided according to the remoteness index values of the constituent statistical local areas and includes all areas with an index value less than or equal to 10.50. The category ’Other remote areas‘ has been divided likewise but includes all areas with an index value greater than 10.50. b The target households for each program are described in chapter 4. c See box 5 for a description of each group. d Includes target households with pending applications and nonapplicant target households aware or unaware of a program but predicted to have a rejected application. Note: The figure on the right hand side of each bar is the percentage of target households for the program in the category. Households with missing locational data have been included in the total which may therefore exceed the sum of data in other categories. In some locations, the number of sampled households was too small to form reliable estimates.
Program recipients c Predicted recipients aware of program c Predicted recipients unaware of program c Other d
Age Pension%
6
3
7
21
26
18
9
7
100
%
8
2
6
17
23
19
13
2
6
17
24
19
13
1
8
2
1
9
2
100
%
6
100
AUSTUDY Basic Family Payment
Areas with these remoteness indexes are not very remote. There is noobvious explanation for these results, but it may be that the low proportionof actual and predicted recipients in these locations was related to factorsnot directly related to the application or assessment process but rather toanother factor of service delivery.
No difference was found between the proportion of households that wereunaware of the Basic Family Payment in any of the rural and remotelocations shown. Households that were unaware of the Age Pension andAUSTUDY were too few to enable meaningful location based comparisons.
Potential eligibility – another approachAnother approach was used to examine potential eligibility. The typicalhousehold described in table 1 would generally have been eligible forassistance from the Age Pension if its assessable assets were less than$350 000 and its assessable income were less than $40 000. Approximately70 per cent of actual recipients of the Age Pension had modified householdassets and income roughly within these ranges. However, only about halfthe households identified by the model as predicted recipients of the AgePension had assets or incomes within these ranges. The proportions withineligibility ranges for AUSTUDY and the Basic Family Payment were similar.For the three programs, the proportion of predicted recipients withineligibility ranges were generally higher than those for households withrejected applications.
Modified household assets and income as calculated in this study was a crudemeasure for assessment purposes. It did not account for variations toassessable assets and income allowed for all family composition and otherparticular circumstances. In addition, assets and income responses werecollected in ranges which reduced precision. Further: respondent errors weremore likely in the short telephone interviews than in a formal application forassistance from a Commonwealth department; some recipient householdswould have ceased receiving payment when the survey collection wasundertaken and may have had assets or income levels above allowable limitsat the time of the survey; and household assets would have been higher thanthe assessable assets of an applicant if the household included more than twoadults with a share in the farm. Many such inconsistencies are overcome inthe regression tree analysis.
60 ABARE research report 97.7

Nevertheless, a substantial difference between actual recipients andpredicted recipients was found in the proportion of households withmodified household assets and income levels within eligible ranges. Thereare several possible explanations for this difference. Actual recipients andpredicted recipients, on average, may have differed in some characteristicsused to determine assessable assets and income. Households in one groupmay have tended to provide data that were consistently biased. Anotherexplanation is that the model may have overpredicted recipients.
61Social support programs

Quality of service
RatingsQuality of service was rated on a five point scale by those households thataccessed a service. Over 80 per cent of households that had some contactwith a Commonwealth social support service, other than the Rural AccessProgram, rated the service given under that program as average to very good(figure 14). Quality of service was rated average or better by 75 per cent ofhouseholds who accessed the Rural Access Program.
Nevertheless, dissatisfaction was expressed by some households. Belowaverage service was particularly reported in relation to Job Search (19 percent), Sickness Allowance (20 per cent), AUSTUDY (17 per cent), the RuralAdjustment Scheme (19 per cent) and the Rural Access Program (25 percent).
62
10
ABARE research report 97.7
14 Quality of service, 1995
% of households that sought assistance0 20 40 60 80 100
Basic Family Payment a
Job Search Allowance
Age Pension a
Sole Parent Pension b
Sickness Allowance
Disability Support Pension c
AUSTUDY and ABSTUDY a
Assistance for Isolated Children a
Rural Adjustment Scheme
Drought Relief Payment d
Farm Household Support
Rural Counselling Program
Countrylink
Rural Access Program
Very poor Poor Average Good Very gooda Relates to households containing people of eligible age. b Relates to households with a sole parent. c Relates to households with a person with a disability. d Relates to farms in Queensland and areas declared to be in drought exceptional circumstances.

While not directly comparable, these figures indicate a lower satisfactionwith the quality of service than had been reported by other users of socialsupport programs. Data supplied by the Department of Social Securityshowed that an estimated 81 per cent of clients who visited departmentoffices reported good or excellent service from staff on the day of their visit.In comparison, only 6 per cent rated the service as poor or very poor.
In-depth interviewsSeveral quality of service issues arose from the in-depth interviews whichcould have wide application to the farm family population. Several familieshad come to trust and rely on particular government agency personnel insorting out problems associated with particular programs. Others hadnegative experiences which dominated their perceptions. (Stoppage ofpayments was a traumatic experience for two of the families interviewed,although payment was eventually resumed in one case.) The fact that somefamilies were a considerable distance from counter staff added to thedifficulties in resolving problems.
In some cases, information and assistance from relevant agencies aboutassets valuation and assets testing appeared to be inadequate. There werestrong perceptions that assets testing favoured city homeowners because thefamily home was exempted. Some families also demonstrated that theylacked the information or skills to provide reliable valuations for the purposeof government assistance programs. Few were aware of hardship tests andsome for whom AUSTUDY or the Drought Relief Payment appeared relevantwere not aware of the discounting provisions of the programs.
Dependence on rural financial counsellors and accountants was high. Theyencouraged likely beneficiaries to apply for assistance, extracted financialdetails and assisted with filling in forms. Some of the families interviewedfelt that accountancy fees were a significant barrier to obtaining assistance.
63Social support programs
Material wellbeing and health
The main indicators of material wellbeing, income and assets, are consideredin chapter 5. Information on qualitative measures of wellbeing was obtainedto indicate relative standards of living which might not emerge from assetsand income analysis alone. (For a discussion of qualitative information onmeasures of wellbeing for the Australian population, see Travers andRichardson 1993 and DSS 1995.)
A wellbeing score was obtained for each household using these individualmeasures and a scale of wellbeing was constructed. The household scorewas analysed according to the combination assets and income ranges. Thewellbeing score was also analysed for selected groups of target householdsfor the Age Pension, AUSTUDY and the Basic Family Payment. In addition,the results of individual qualitative measures of wellbeing were examinedaccording to household assets and income. A further indication of livingstandards compared with income and assets levels was obtained fromhouseholds interviewed in-depth.
Wellbeing scaleThe wellbeing score for each household was derived from responses to theseventeen qualitative questions on material wellbeing used in the survey.Intuitively, each of the questions would be expected to contribute to materialwellbeing. The questions related to:
• how households manage on their family income;
• households’ concern about making ends meet;
• perceptions of the level of prosperity of households;
• ownership of an off-farm dwelling;
• households’ ability to obtain $5000 within a week for something import-ant (and source of funds for households able to obtain $5000);
• cutting back on basic food and heating;
• getting behind with payments of utilities, hire purchase and credit cards;
• seeking financial help from family or material help from a welfare agency;
64
11
ABARE research report 97.7

• self-assessment of health;
• private health insurance cover; and
• taking holidays in the year before the survey.
Principal component analysis, which can be used to summarise most of thevariation in variables into fewer ‘components’, was used to construct thescale of material wellbeing (Morrison 1967). All the wellbeing measureswere defined such that a low measure corresponded to low wellbeing and ahigh measure corresponded to high wellbeing.
Wellbeing, assets and incomeWellbeing scores among the whole surveyed household ranged from –7.9 to3.7. When the household population was divided into five groups of equalsize (quintiles), it was found that wellbeing tended to be lower as assets andincome decreased.
A household quintile is 20 per cent of households grouped according to aparticular variable. In this report, the first or bottom quintile representedhouseholds with the lowest 20 per cent of wellbeing scores. The upper
65Social support programs
15 Distribution of wellbeing scores of households, by modifiedhousehold assets and income ranges, 1995 a
a Scores are for households in the total surveyed population. Modified household assets were 1995 values and equalled the household share of farm assets (less farm debt) plus non-farm assets (less non-farm debt) minus the average valuation of the domestic home and curtilage. Incomes were for 1994-95 after business costs but before tax. Twenty per cent of households were represented in each range of wellbeing scores.Note: Excludes households with missing assets or income data. Groups are not mutually exclusive nor exhaustive, so percentages do not add to 100.
% ofhouseholds
in quintile
20
60
40
80
1.6 to 3.70.8 to 1.6– 0.1 to 0.8–1.4 to – 0.1–7.9 to –1.4
Wellbeing score
Assets < $350 000 & income < $15 000 Assets < $500 000 & income < $40 000Assets < $1000 000 & income < $60 000 Assets > $1000 000
or assets < $1000 000 & income > $60 000

quintile represented those households with the highest 20 per cent of well-being scores.
Forty per cent of households with modified household assets less than$350 000 and household incomes less than $15 000 were in the bottomquintile (figure 15). By contrast, 35 per cent of households with modifiedassets greater than $1 million, or less than $1 million but with incomesgreater than $60 000 were in the top quintile. By further illustration, 27 percent of households in the bottom quintile had modified household assets lessthan $350 000 and household incomes less than $15 000 compared with only4 per cent of households in the top quintile (figure 15). Additional analysisshowed that around 8 per cent of households with more than $1 million inassets had wellbeing scores equal to the those who had the lowest 20 percent of scores.
Such relationships between the wellbeing score and income and assetsindicated that the scale was a useful measure of material need.
Wellbeing of selected household groupsBox plots show the distribution of wellbeing between selected groups oftarget households for the Age Pension, AUSTUDY and the Basic FamilyPayment, illustrating the scores for given percentiles of the population ineach group (figure 16).
The median wellbeing score for all households in the surveyed populationwas 0.34. Seventy-five per cent of households had a score between –1.02and 1.40 at the time of the survey. Households that had received the AgePension, AUSTUDY or the Basic Family Payment at some time in the threeyears before the survey tended to have lower scores than did the wholesurveyed population. Median scores of recipient households were –0.01,–0.19 and –0.22 respectively for the three programs.
The wellbeing scores of households that had unsuccessfully lodged anapplication for the Age Pension tended to be higher than the scores of thewhole surveyed population. The median score of this group was 1.10. Tenper cent of households for the Age Pension in this group had scores less than–2.47 whereas 10 per cent of households in the whole surveyed populationhad scores less than –2.61. The validity of the wellbeing scale is furthershown in figure 16 by the differences in the distribution of scores between
66 ABARE research report 97.7

67Social support programs
16 Distribution of wellbeing scores of households in selected groups, 1995
90%75%
50%
25%
10%–4
–2
Wellbeing score
2
All Rec Rej APRec UPRec
Age Pension
90%75%
50%
25%
10%–4
–2
Wellbeing score
2
All Rec Rej APRec UPRec
AUSTUDY
90%
75%
50%
25%
–4
–2
Wellbeing score
2
All Rec Rej APRec UPRec
Basic Family Payment
10%
All: All surveyed households; Rec: Program recipients; Rej: Rejected applicants; APRec: Predicted recipients aware of program; UPRec: Predicted recipients unaware of program
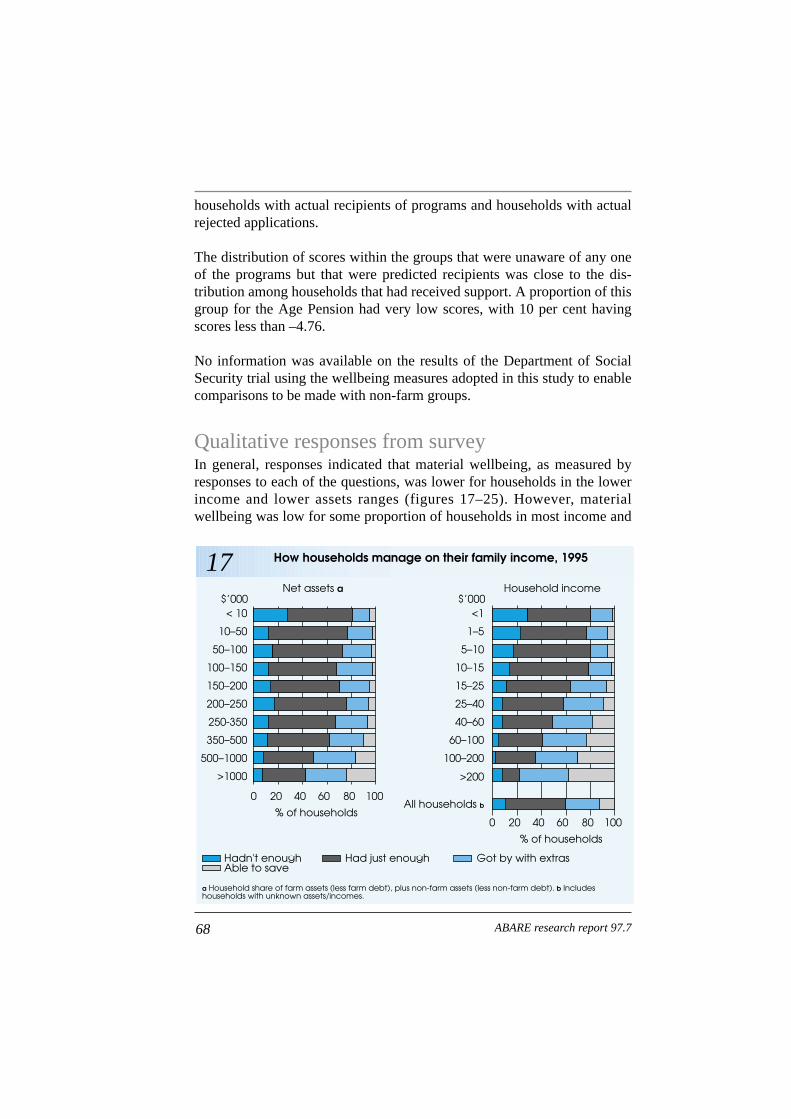
households with actual recipients of programs and households with actualrejected applications.
The distribution of scores within the groups that were unaware of any oneof the programs but that were predicted recipients was close to the dis-tribution among households that had received support. A proportion of thisgroup for the Age Pension had very low scores, with 10 per cent havingscores less than –4.76.
No information was available on the results of the Department of SocialSecurity trial using the wellbeing measures adopted in this study to enablecomparisons to be made with non-farm groups.
Qualitative responses from surveyIn general, responses indicated that material wellbeing, as measured byresponses to each of the questions, was lower for households in the lowerincome and lower assets ranges (figures 17–25). However, materialwellbeing was low for some proportion of households in most income and
68 ABARE research report 97.7
17 How households manage on their family income, 1995
Hadn't enough Had just enough Got by with extrasAble to save
Net assets a Household income
a Household share of farm assets (less farm debt), plus non-farm assets (less non-farm debt). b Includes households with unknown assets/incomes.
< 10
10–50
50–100
100–150
150–200
200–250
250-350
350–500
500–1000
>1000
<1
1–5
5–10
10–15
15–25
25–40
40–60
60–100
100–200
>200
All households b% of households
% of households
$’000 $’000
0 20 40 60 80 100
0 20 40 60 80 100

assets ranges. In general, the relationship appeared to be stronger for incomeranges than for assets ranges.
There was a strong relationship between income levels and responses to thequestion ‘How you get along on your family income’ (figure 17). In 1995,around 12 per cent of households in all income ranges indicated that they‘had not enough income to get by’ but twice this percentage of householdswith incomes below $1000 indicated the same response. Few householdswith incomes below $15 000 and assets below $350 000 said they couldsave. About one in six with incomes of $40 000–60 000 or assets of$500 000– 1 000 000 said they could save.
Slightly more than a quarter said that they were concerned about makingends meet ‘all the time’ or ‘often’ (figure 18). The proportion of householdsin each income range that were concerned ‘all the time’ about making endsmeet were similar to the proportions that said they ‘had not enough to getby’ in figure 17, with the proportion decreasing as incomes increased.Correspondingly, the proportion that were ‘never’ concerned about makingends meet decreased as incomes increased.
69Social support programs
18 Households’ concern about making ends meet, 1995
All the time Often From time to time Hardly ever Never
Net assets a Household income
a Household share of farm assets (less farm debt), plus non-farm assets (less non-farm debt). b Includes households where assets/income were unknown.
< 10
10–50
50–100
100–150
150–200
200–250
250-350
350–500
500–1000
>1000
<1
1–5
5–10
10–15
15–25
25–40
40–60
60–100
100–200
>200
All households b% of households
% of households
$’000 $’000
0 20 40 60 80 100
0 20 40 60 80 100

Households were also asked for their perceptions about their level ofprosperity. Figure 19 shows that few people in farm households said thatthey were ‘very poor’, even in the low assets and income ranges. Themajority said that they were ‘just getting along’ or ‘living reasonablycomfortably’. Above assets of $150 000 and income of $15 000, the relativeproportions of households ‘just getting along’ or ‘living reasonablycomfortably’ appeared to be related to the level of assets and income. Belowthese levels, no consistent relationship was apparent.
An estimated 45 per cent of households with more than $1 million inhousehold net assets said they had a dwelling off the farm, as did 77 per centof those with household incomes over $200 000 (figure 20). In most incomeranges, at least one in five households had equity in an off-farm dwelling.
An estimated 42 per cent of households with assets less than $10 000 couldnot obtain $5000 in an emergency (figure 21). This proportion decreasedconsistently as assets increased. The proportion of households that could notget the $5000 also decreased as household incomes increased, but therelationship did not appear to be as strong.
70 ABARE research report 97.7
19 Households’ perceptions of level of prosperity, 1995
Very poor Poor Just getting along Living reasonably comfortablyProsperous
Net assets a Household income
a Household share of farm assets (less farm debt), plus non-farm assets (less non-farm debt). b Includes households where assets/income were unknown.
< 10
10–50
50–100
100–150
150–200
200–250
250-350
350–500
500–1000
>1000
<1
1–5
5–10
10–15
15–25
25–40
40–60
60–100
100–200
>200
All households b% of households
% of households
$’000 $’000
0 20 40 60 80 100
0 20 40 60 80 100

71Social support programs
20 Householders who owned or part owned a dwelling off-farm, 1995
Net assets a Household income
a Household share of farm assets (less farm debt), plus non-farm assets (less non-farm debt). b Includes households where assets/income were unknown.
$’000< 10
10–50
50–100
100–150
150–200
200–250
250-350
350–500
500–1000
>1000
$’000<1
1–5
5–10
10–15
15–25
25–40
40–60
60–100
100–200
>200
All households b% of households
% of households
0 20 40 60 80
0 20 40 60 80
21 Households’ ability to obtain $5000 within a weekfor something important, 1995
Could not obtain $5000 Could obtain $5000
Net assets a Household income
a Household share of farm assets (less farm debt), plus non-farm assets (less non-farm debt). b Includes households where assets/income were unknown.
< 10
10–50
50–100
100–150
150–200
200–250
250-350
350–500
500–1000
>1000
<1
1–5
5–10
10–15
15–25
25–40
40–60
60–100
100–200
>200
All households b% of households
% of households
$’000 $’000
0 20 40 60 80 100
0 20 40 60 80 100

In each assets and income range, the most important sources of $5000 forhouseholds that said they could obtain this sum in an emergency were ‘ownsavings’, ‘business drawings’ and ‘bank or credit union loan’ (figure 22).As assets or income increased, savings tended to become a more importantsource. Loans from family, loans from friends and credit cards were rela-tively unimportant sources.
The proportions of households which cut back on expenditure in variousways, had help from family, and had help from welfare agencies are shownin figure 23. Some households in all assets and income ranges indicated thatthey had cut back on expenditure on basic items, and 21 per cent ofhouseholds had cut back on basic food in the previous two years. In almostall assets and income ranges, households also indicated that they hadreceived financial help from family and welfare agencies: 4 per cent ofhouseholds in all assets ranges had received help from a welfare agency inthe two years before the survey. Even with household assets of $500 000 to
72 ABARE research report 97.7
22 Source of funds for households that could obtain $5000, 1995 a
a See previous figure. b Household share of farm assets (less farm debt), plus non-farm assets (less non-farm debt). c Includes households where assets/income were unknown. d Other is defined as loans from family, loans from friends, credit cards and other. These were of similar proportions in all ranges and have been aggregated.Note: Some householders nominated more than one type of source.
Net assets ($’000) b
01020304050607080
over200
All h/holds c
100–200
60–100
40–60
20–25
15–2010–155–101–5<1
over1000
500–1000
350–500
250–350
200–250
150–200
100–150
50–100
10–50
<10
% o
f h
ou
seh
old
s
Household income ($’000)
01020304050607080
% o
f h
ou
seh
old
s
Own savings Business drawings Bank/credit union loan Other d
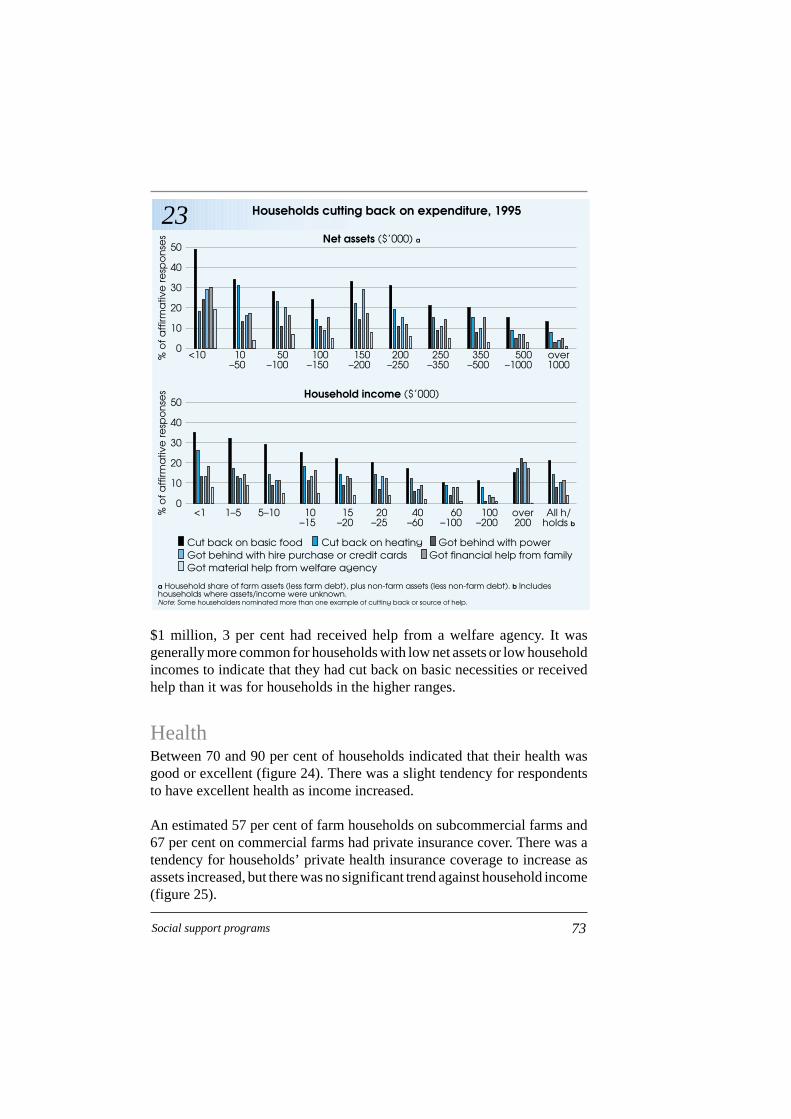
$1 million, 3 per cent had received help from a welfare agency. It wasgenerally more common for households with low net assets or low householdincomes to indicate that they had cut back on basic necessities or receivedhelp than it was for households in the higher ranges.
HealthBetween 70 and 90 per cent of households indicated that their health wasgood or excellent (figure 24). There was a slight tendency for respondentsto have excellent health as income increased.
An estimated 57 per cent of farm households on subcommercial farms and67 per cent on commercial farms had private insurance cover. There was atendency for households’ private health insurance coverage to increase asassets increased, but there was no significant trend against household income(figure 25).
73Social support programs
23 Households cutting back on expenditure, 1995
a Household share of farm assets (less farm debt), plus non-farm assets (less non-farm debt). b Includes households where assets/income were unknown. Note: Some householders nominated more than one example of cutting back or source of help.
Net assets ($’000) a
0
10
20
30
40
50
over200
All h/holds b
100–200
60–100
40–60
20–25
15–20
10–15
5–101–5<1
over1000
500–1000
350–500
250–350
200–250
150–200
100–150
50–100
10–50
<10% o
f a
ffirm
ativ
e re
spo
nse
s
Household income ($’000)
0
10
20
30
40
50
% o
f a
ffirm
ativ
e re
spo
nse
s
Cut back on basic food Cut back on heating Got behind with powerGot behind with hire purchase or credit cards Got financial help from familyGot material help from welfare agency
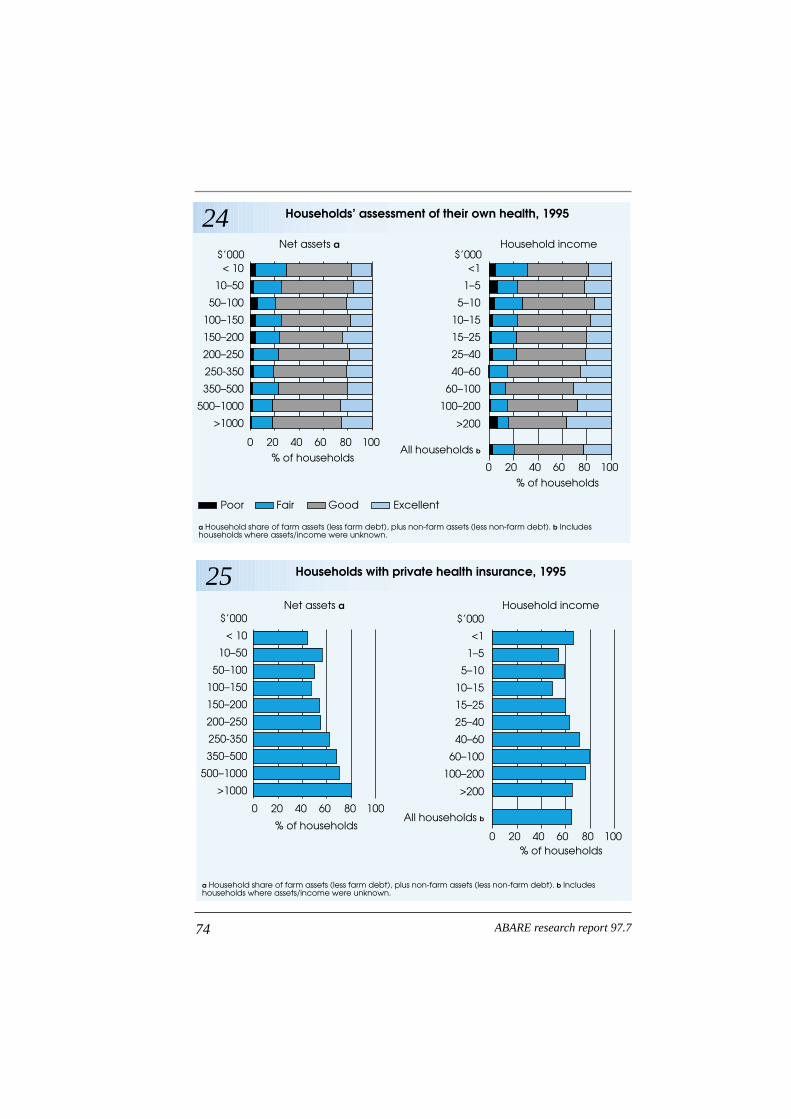
74 ABARE research report 97.7
24 Households’ assessment of their own health, 1995
Poor Fair Good Excellent
Net assets a Household income
a Household share of farm assets (less farm debt), plus non-farm assets (less non-farm debt). b Includes households where assets/income were unknown.
< 10
10–50
50–100
100–150
150–200
200–250
250-350
350–500
500–1000
>1000
<1
1–5
5–10
10–15
15–25
25–40
40–60
60–100
100–200
>200
All households b% of households
% of households
$’000 $’000
0 20 40 60 80 100
0 20 40 60 80 100
25 Households with private health insurance, 1995
Net assets a Household income
a Household share of farm assets (less farm debt), plus non-farm assets (less non-farm debt). b Includes households where assets/income were unknown.
$’000
< 10
10–50
50–100
100–150
150–200
200–250
250-350
350–500
500–1000
>1000
$’000
<1
1–5
5–10
10–15
15–25
25–40
40–60
60–100
100–200
>200
All households b% of households
% of households0 20 40 60 80 100
0 20 40 60 80 100

In-depth interviews
Households expanded on their survey responses during the in-depthinterviews, indicating the ways in which they juggled their household andfarm expenditures and decided priorities between family life, farm business,their own retirement and their children’s future. The standards of livingsuggested at these interviews supported the indications of wellbeing thatemerged from the telephone survey. Most families whose survey responsesindicated low levels of wellbeing, reduced their household consumptionexpenditures by growing their own vegetables, reducing their social contactsand vehicle use, not taking holidays and keeping their motor vehicles formany years. However, in many cases, the education of their childrenremained a high priority item of expenditure. Many depended on socialsupport payments.
75Social support programs

Young people and education
Educational and employment opportunities are key concerns of farmfamilies (Gooday 1995). Information from the survey about the educationand employment status of household residents is provided in tables 3–5, andinformation about awareness of, and experience with, the Assistance forIsolated Children Scheme and AUSTUDY is provided in chapters 6–10.Household members living away from home were counted in the householdif there were dependants younger than 22 years and in full time education.Sixteen per cent of 16–17 year old full time students were living away fromhome and 45 per cent of 18–21 year old full time students were living awayfrom home (table 5).
Year 10 or less was the highest level of education achieved for 24 per centof young men compared with 12 per cent of young women in farmhouseholds (figure 26). The proportion of graduate women aged 18–21 yearsin households was double that of graduate men the same age. As discussedin chapter 14, there were far fewer young women than young men in thisage group.
If a person in the household was aged 16–21 years and was not studying atthe time of the survey, information was obtained on their reason fordiscontinuing study. The most common reason (for about three out of fourpeople) was that the person had ‘finished their education’ (figure 27). For
76
12
ABARE research report 97.7
26 Highest level of education achieved, 1995
% of people0 20 40 60 80 100
Children 16–17 years
Males 18–21 years
Females 18–21 years
Year 10 and less Years 11–12 Undergraduate GraduatePart technical certificate Technical certificate Postgraduate
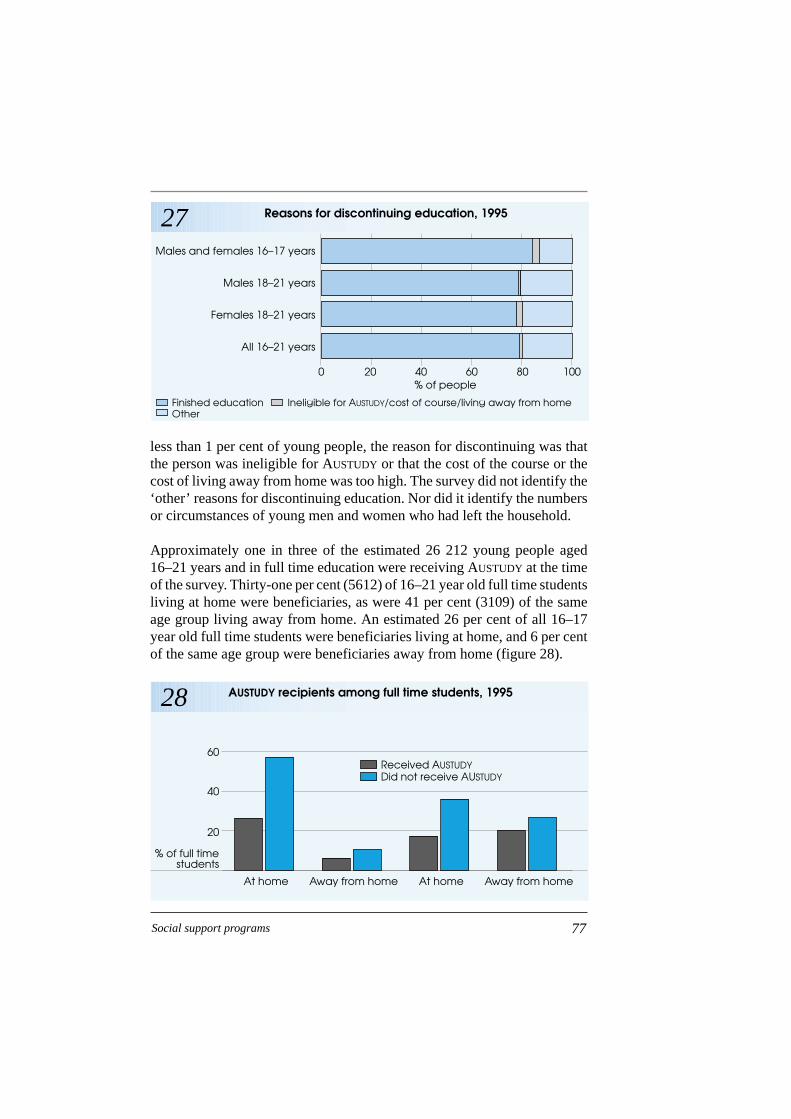
less than 1 per cent of young people, the reason for discontinuing was thatthe person was ineligible for AUSTUDY or that the cost of the course or thecost of living away from home was too high. The survey did not identify the‘other’ reasons for discontinuing education. Nor did it identify the numbersor circumstances of young men and women who had left the household.
Approximately one in three of the estimated 26 212 young people aged16–21 years and in full time education were receiving AUSTUDY at the timeof the survey. Thirty-one per cent (5612) of 16–21 year old full time studentsliving at home were beneficiaries, as were 41 per cent (3109) of the sameage group living away from home. An estimated 26 per cent of all 16–17year old full time students were beneficiaries living at home, and 6 per centof the same age group were beneficiaries away from home (figure 28).
77Social support programs
27 Reasons for discontinuing education, 1995
% of people0 20 40 60 80 100
Males and females 16–17 years
Males 18–21 years
Females 18–21 years
All 16–21 years
Finished education Ineligible for AUSTUDY/cost of course/living away from homeOther
28 AUSTUDY recipients among full time students, 1995
Away from homeAt homeAway from homeAt home
% of full timestudents
20
40
60Received AUSTUDYDid not receive AUSTUDY

Boarding school was not an option chosen by many households: only anestimated 14 per cent of households with children of school age had childrenat boarding school in the two years before the survey (figure 29). Boardingschool children came from households in all assets and income ranges.
For households with children at boarding school, slightly more than one inten had been behind with boarding school fees in the previous two years(figure 30). Being behind in fees appeared to be more common in the incomeranges below $40 000 and assets ranges above $250 000.
An estimated one in five households were more than 20 kilometres from aprimary school and almost half were more than 20 kilometres from asecondary school (figure 31). Households were considered to be potentiallyeligibile for the Assistance for Isolated Children Scheme if they had depen-dent children younger than 18 years and were more than 16 kilometres froma school. It should be noted that these criteria only partly met the eligibilityrequirements for the scheme: for example, students more than 16 kilometresbut less than 56 kilometres from a school also had to be more than 4.5 kilo-metres from an available transport service to school. Households also mighthave been eligible if the travel time to school is at least 1.5 hours each way.
78 ABARE research report 97.7
29 Households with a child at boarding school duringthe previous two years
Net assets a Household income
a Household share of farm assets (less farm debt), plus non-farm assets (less non-farm debt). b Includes households where assets/income were unknown.
$’000
< 10
10–50
50–100
100–150
150–200
200–250
250-350
350–500
500–1000
>1000
$’000
<1
1–5
5–10
10–15
15–25
25–40
40–60
60–100
100–200
>200
All households b% of households with
a child 5–17 years% of households with
a child 5–17 years
0 20 40 60 80 100
0 20 40 60 80 100

79Social support programs
30 Households that were behind with boarding school feesduring the previous two years
Net assets a Household income
a Household share of farm assets (less farm debt), plus non-farm assets (less non-farm debt). b Includes households where assets/income were unknown.
$’000< 10
10–50
50–100
100–150
150–200
200–250
250-350
350–500
500–1000
>1000
$’000<1
1–55–10
10–1515–2525–4040–60
60–100100–200
>200
All households b
% of households
% of households
0 10 20 30 40 50
0 10 20 30 40 50
31 Distance between household and school, 1995
Over 50 km31–50 km21–30 km 11–20 km Under 11 km
% of households
20
40
60Distance to primary schoolDistance to secondary school
Few applications for assistance were rejected (table 10), indicating thatpeople in most of the households that applied for assistance had a realisticunderstanding of their likelihood of success. Of an estimated 55 008households with children younger than 18 years, 50 per cent were aware ofthe scheme and 8 per cent had received or been approved to receiveassistance. The remaining households indicated their reasons for notapplying for assistance (figure 11). Some would have been ineligible becausethey had only children who were of preschool age or who had left school.
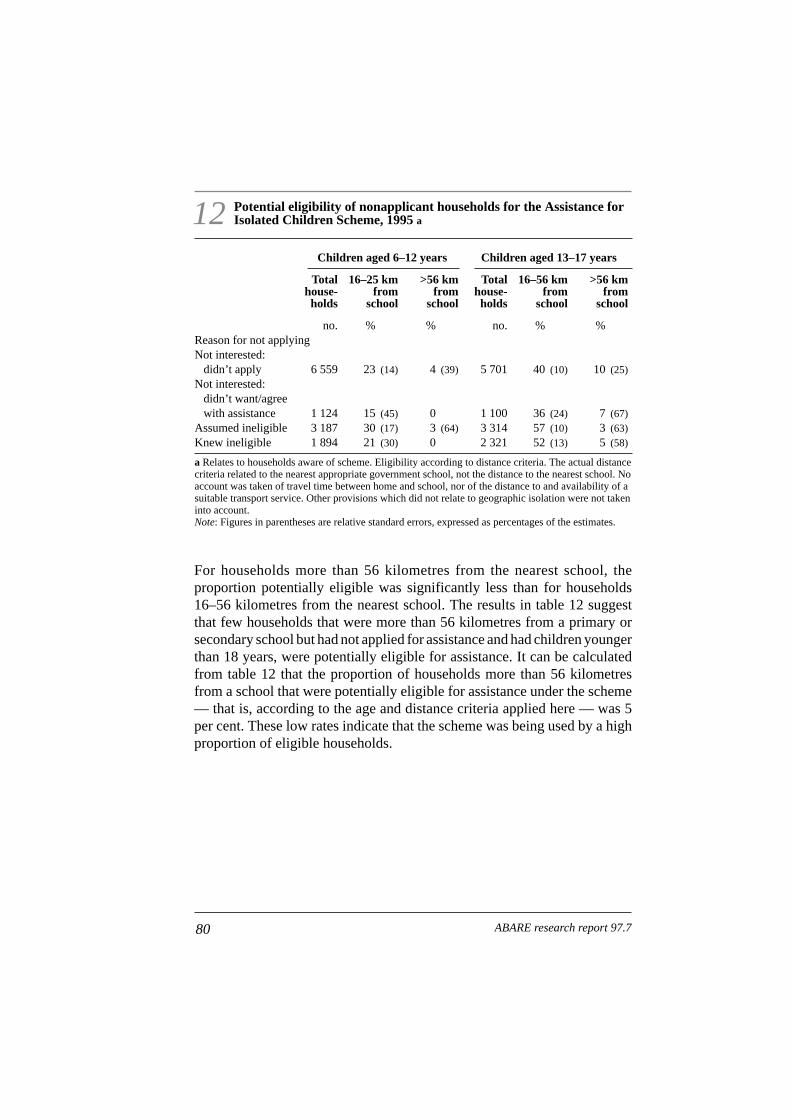
80 ABARE research report 97.7
12 Potential eligibility of nonapplicant households for the Assistance forIsolated Children Scheme, 1995 a
Children aged 6–12 years Children aged 13–17 years
Total 16–25 km >56 km Total 16–56 km >56 kmhouse- from from house- from fromholds school school holds school school
no. % % no. % %Reason for not applyingNot interested:
didn’t apply 6 559 23 (14) 4 (39) 5 701 40 (10) 10 (25)Not interested:
didn’t want/agree with assistance 1 124 15 (45) 0 1 100 36 (24) 7 (67)
Assumed ineligible 3 187 30 (17) 3 (64) 3 314 57 (10) 3 (63)Knew ineligible 1 894 21 (30) 0 2 321 52 (13) 5 (58)
a Relates to households aware of scheme. Eligibility according to distance criteria. The actual distancecriteria related to the nearest appropriate government school, not the distance to the nearest school. Noaccount was taken of travel time between home and school, nor of the distance to and availability of asuitable transport service. Other provisions which did not relate to geographic isolation were not takeninto account.Note: Figures in parentheses are relative standard errors, expressed as percentages of the estimates.
For households more than 56 kilometres from the nearest school, theproportion potentially eligible was significantly less than for households16–56 kilometres from the nearest school. The results in table 12 suggestthat few households that were more than 56 kilometres from a primary orsecondary school but had not applied for assistance and had children youngerthan 18 years, were potentially eligible for assistance. It can be calculatedfrom table 12 that the proportion of households more than 56 kilometresfrom a school that were potentially eligible for assistance under the scheme— that is, according to the age and distance criteria applied here — was 5per cent. These low rates indicate that the scheme was being used by a highproportion of eligible households.

Major findings and discussion
The study investigated farm families’ knowledge of, access to and use ofexisting social welfare and related programs by analysing telephone surveydata and by conducting in-depth interviews with selected households. Initialanalysis on income and assets distribution and awareness and use ofprograms (chapters 4–8) left three broad questions:
• What was the eligibility of households that did not apply for support fromCommonwealth social programs in the three years to March–May 1995?
• Why did these households not seek assistance?
• What other issues related to improved service delivery?
Prediction analysis (chapter 9) identified the extent of potential eligibilityfor support from three programs, the Age Pension, AUSTUDY and the BasicFamily Payment. These three were examined in detail, not to draw out issuespeculiar to the three programs, but rather to draw out findings that were likelyto have general application to social support programs for farm families.
The standard of living of farm families was examined through three ap-proaches: income and assets analysis; use of wellbeing score constructedfrom a set of questions asked in the survey; and in-depth interviews with asmall number of selected households.
Major findings from the statistical analysis described in the previouschapters and from the in-depth interviews are drawn together in this chapter.
Awareness of programsNinety-four per cent of households with a young person aged 16–21 yearswere aware of AUSTUDY, 94 per cent of households with a person overretirement age were aware of the Age Pension, and 78 per cent of householdswith children were aware of the Basic Family Payment. In Queensland anddrought exceptional circumstance areas of New South Wales, South Aus-tralia and Tasmania, 79 per cent of households were aware of the DroughtRelief Payment.
81
13
Social support programs

The proportions of households aware of the remaining programs wereconsiderably lower than these figures. A smaller percentage of householdscould be expected to have been aware of some of these programs, such asthe Sickness Allowance, because such programs were only likely to havebeen relevant to a small proportion of households. Countrylink and the RuralAccess Program were available to all people in rural and remote areas, butonly 39 per cent and 18 per cent of households respectively were aware ofthese programs. (Both programs are small in terms of overall funding levels.)
Given that some respondents volunteered that they were confused by namechanges to programs and that others only indicated awareness whenprompted with the most recent name change, awareness of some programsmight be higher than was reported from the survey.
There were substantial regional differences in awareness of most programs.For example, at the statistical division level, awareness of the Basic FamilyPayment and the Job Search Allowance ranged from 45 to 100 per cent.
Ignorance of hardship tests (see proposition 7, ch. 9)
By contrast with the generally high levels of program awareness found,relatively few households were aware of the hardship tests. While hardshiptests were designed to meet the needs of those who are in severe financialdifficulties who did not meet the assets or income tests, the tests were notknown to most of the farm population. Three quarters of target householdsfor the Age Pension were unaware that hardship tests applied to the pension.Only one-fifth of the farm population were aware that such tests applied toJob Search (chapter 6).
Take-up and rejection ratesThe number of farm households receiving assistance differed widely amongthe programs, as would be expected given the variation in specific needsbeing targeted by the programs. Take-up, expressed as the percentage of allhouseholds in the survey population that had received assistance during thethree years before the survey, ranged from 0.7 per cent for the Rural AccessProgram to 22 per cent for the Basic Family Payment (table 11).
Most target households that were aware of a program but did not apply forsupport stated that the assistance ‘did not apply’ to them or they ‘weren’teligible’. The reasons given varied across programs. For example, ‘weren’t
82 ABARE research report 97.7

eligible’ was the main reason given for not applying for the Basic FamilyPayment, while ‘don’t need assistance’ was the reason that 56 per cent ofhouseholds aware of the program did not apply for assistance from the RuralCounselling Program. An estimated 5 per cent of households with a personwith a disability did not apply for the Disability Support Pension becausethey ‘knew they were not eligible’ for assistance, while the same reason wastrue for 20 per cent of households with a person over 60/65 years who didnot apply for the Age Pension.
Relatively few households that lodged an application misjudged theirlikelihood of success. Rejection rates among target populations for the AgePension, AUSTUDY and the Basic Family Payment were 4 per cent, 9 per centand 3 per cent respectively (table 11).
For all programs, the most common reason for applications being rejected(according to respondents) was that assets were too high. Excluding the JobSearch Allowance, the Rural Adjustment Scheme and the Drought ReliefPayment, this reason exceeded all other reasons combined. Ninety-five percent of households that were rejected for the Age Pension were refusedassistance on this ground.
Nonapplicants who were potentially eligibleA high percentage of households that did not receive support would havedone so had they applied, according to the prediction analysis. Excludingactual recipients, total predicted recipients (aware and unaware), additionalto actual recipients, were 20 per cent of the target population for AUSTUDY,27 per cent for the Basic Family Payment and 35 per cent for the AgePension. However, it is likely that many of the predicted recipients for theBasic Family Payment were in fact receiving the Basic Family Payment butonly knew the payment as ‘Child Endowment’.
Reasons for nonapplication
Assistance not needed (see proposition 5, ch. 9)
Analysis showed that some predicted recipient households had relativelyhigh assets and income levels. It is likely that many of these would not haveapplied for assistance. Figure 11 shows that a small proportion (around 10per cent) of each of the target household populations that were aware of theAge Pension, AUSTUDY and the Basic Family Payment but did not apply for
83Social support programs

assistance said that they were not interested and did not need assistance. Inaddition, other households that were aware of a program but did not applyfor assistance said that they were not interested in the program and that theprogram did not apply to them. It is reasonable to assume that many of these— 14 per cent for the Age Pension to 29 per cent for AUSTUDY — wouldhave believed that they did not need assistance. Some of the 29 per cent ofpredicted recipients for AUSTUDY would have included households that hadno students aged 16–21 years.
The wellbeing analysis undertaken for the case studies also indicated relativeneed between the selected household groups. The median wellbeing scoresof predicted recipients for the Age Pension, AUSTUDY and the Basic FamilyPayment were higher than the scores of both the household population andactual recipients. Nevertheless, because wellbeing is not an assessmentprovision, these householders were still predicted recipient householdseligible for assistance.
Overvaluation of assessable farm assetsThe important issue about valuation is what householders thought theirassets were worth. If they thought their assets exceeded the eligible limit,they were unlikely to apply.
The comparative analysis of property valuations by social security clientsand the Australian Valuation Office (figures 7 and 8), showed that many farmfamilies overvalued their farm or undervalue their domestic home. It istherefore likely that some farmers who considered seeking Commonwealthassistance did not proceed with an application for government supportbecause they overvalued their farm. The in-depth interviews showed that therationale for assessing farm capital value that several of the households usedin the initial telephone interviews was unlikely to provide a reliable value.Often a combination of approaches was used. Some used council rate values,others used old market valuations of their own or other properties, and othersbased their valuation on their hopes and expected income needs. Somefarmers were likely to apply the same rationale in reaching a decision not toapply on the basis of their assets.
Limited or mistaken understanding of program provisionsIt is likely that some predicted recipient households incorrectly assumed thatthe value of their farm assets precluded them from program assistance. Morethan half the target households for each program said they knew or assumed
84 ABARE research report 97.7

that they were not eligible for assistance (chapter 7). Yet a high proportionof target households that were nonreceipients were predicted recipients(chapter 9). Assets determination and assessment was a complex process.The applicant needed to have detailed accounts to provide the assets andincome details required. Eligibility limits varied between programs andaccording to household composition. Also, for the Age Pension, partialpayment of the maximum assistance was available when assets were higherthan the levels for maximum payment, up to a certain assets limit.
The in-depth interviews indicated other reasons for some people not seekingassistance despite being in need. Being aware of a program was notnecessarily associated with having information which was adequate formaking informed decisions about applying for assistance. One householdinterviewed in-depth believed that they were in eligible for assistance fromany program because an application to one was rejected.
All of these findings were consistent with evidence from the Department ofEmployment, Education, Training and Youth Affairs that only a smallnumber of applicants for AUSTUDY from rural areas (including non-farmapplicants) were unsuccessful as a result of high assets. The Departmentadvised the Senate Rural and Regional Affairs and Transport ReferencesCommittee that only 133 students from rural areas were assessed asineligible as a result of the assets test in 1994 (Senate Rural and RegionalAffairs and Transport References Committee 1995a, s34).
Householders likely to need support (see proposition 2, ch. 9)
Wellbeing scores suggest that eligible non-applicants that were not aware ofa program were at least as much in need of government assistance as thosethat were aware. For the Age Pension and AUSTUDY, median wellbeingscores for predicted eligible non-applicants who were unaware were lessthan those for actual recipients. The distribution of scores for those unawareof the Basic Family Payment program was similar to the scores of those thatwere actual recipients.
Households most in need by the wellbeing analysis were those with elderlypeople unaware of the Age Pension but predicted to be eligible. This grouptended to have lower wellbeing scores than actual recipients of the pension.They also tended to be in poor assets and income circumstances comparedwith other households that included elderly people. The proportion of this
85Social support programs

group with low household assets and income was similar to that of actualrecipient groups with low household assets and incomes.
The wellbeing scores of predicted recipient households aware of a programtended to be higher than the wellbeing scores of actual recipient households.Households which had indicated lack of awareness in the telephone surveyactually indicated some degree of knowledge of the program during the in-depth interviews, but most were in poor circumstances, supporting theevidence from the statistical analysis that the wellbeing scores of thoseunaware of a program tended to be lower than those of other groups.
Assets testingThe assets test, from its inception, has been seen as affecting farm familiesmore than any other group (DSS 1993, p. 15). Just as the telephone surveyindicated that many householders thought that a high level of assets was themain reason for rejection of their applications for social support programs,the in-depth interviews suggested that farm households had many concernsabout assets testing. This concern was expressed both by households thathad applied to programs and been rejected and those that had not appliedbecause they assumed or knew that they were ineligible.
Issues raised relating to assets included:
• the exemption from assets testing of the principal residence (perceived tobe causing inequities between city home owners and farmers);
• the need to consider households with high assets but low income, whethera result of drought, price fluctuations or a long term downturn in farmfortunes; and
• the difficulties of selling a portion of farm assets so that farmers couldcontinue to provide for themselves instead of using Commonwealthsupport programs, particularly the Age Pension (including concerns aboutthe viability of the remaining farm; reduced ability to recover whenconditions improve; concerns about leaving a viable operation for the nextgeneration; and council regulations on the subdivision of land).
Capital valuation of farms (see proposition 7, ch. 9)
Capital valuation relates to assets testing but it was pursued separately in thein-depth interviews, with the objective of gaining an insight into how farmers
86 ABARE research report 97.7

arrived at a figure for the value of their farm. This was relevant for both thosewho applied for assistance and had to provide an estimate of the currentmarket value of the farm, and for those who assessed themselves as ineligibleon the grounds of their asset value and hence did not apply for support.
The following means of arriving at a capital value were given:
• the assessment provided in the most recent rates notice;
• recent sales in the area (although sometimes these properties were seenby the farmer as different from their own: for example, they were forcedsales, or they were ‘hobby farms’, or they supported a different kind offarming); and
• an assessment of what the household would want or need if they were tosell the farm.
A number of the households used a combination of these means to assessthe capital value they provided in the interview. When asked if they thoughtthey would be able to sell at that price today, two of the households said no,one had had the asset on the market at the given price for fifteen monthswithout a buyer, one was unsure because they had tested the market fiveyears ago and not found a buyer, and four believed that they could sell thefarm at the price they had estimated. Another householder had sold two-thirds of his land within the past three months, receiving almost the amounthe had estimated as the capital valuation of the whole farm.
It seems likely that some farmers were not accurately representing the valueof their farm asset when they applied for social support and, more par-ticularly, when they took the decision not to apply on the basis of their assets.
Valuation of rural properties for government social assistance is problematicgiven that there are no actual market buyers and sellers involved. In addition,rural markets in Australia are small compared with metropolitan marketsand therefore provide a much more limited indication of market values. Evenin good times, there are relatively few sales in most regions to usefullyindicate market values. During rural downturns, valuation is more difficult.Factors such as forced sales can effectively produce a dual market in a ruralregion.
The Senate report on the AUSTUDY assets test noted, ‘The Department [ofEmployment, Education, Training and Youth Affairs] recognised that
87Social support programs

accurate valuation of farm assets in times of rural hardship “is a practicaldifficulty with the current assets test”.’ (Senate Rural and Regional Affairsand Transport References Committee 1995a, s24)
The second report on assets tests from the Senate committee noted that theAustralian Valuation Office recognised that usual indicators of valuationsbased on market forces — where there is a willing buyer and a willing sellerand recent local sales of comparable farms — may not be reliable indicatorsduring rural downturns or drought (1995b, s5.10). The Australian ValuationOffice provided information to the committee on its valuation approach insuch circumstances.
There were other issues relevant to valuation for assets testing. Differentmethods of valuation provided different results. Commonwealth depart-ments specifically advised their clients not to use local council valuationsfor farm valuations. The components of farm assets taken into account bydifferent methods and organisations could also differ.
Farm valuation is a specialised professional business which not surprisinglycaused considerable difficulty, and sometimes anxiety, to farm clientsconsidering applying for government social support.
Financial managementAs with other groups in the population, there was evidence of deficienciesin the business and personal planning of many of the households, especiallyin the area of planning for retirement and the transfer of the farm asset to thenext generation. The case studies provide at least one example of what wouldappear to have been effective financial management, but it is significant thatthis case was a professional family who placed a high value on the farmlifestyle and used the farm to offset income earned from the professionalbusiness. Women’s financial management was another area of need revealedby the case of an older woman of non-English speaking background.Separation or the death of a partner can mean that women are left to managefinances when they have not previously had the responsibility.
Knowledge or understanding of programsThe issue of awareness of programs was not simply about knowing of aprogram’s existence but, importantly, about some of the key policies andprovisions as they might have related to the client or potential client. The
88 ABARE research report 97.7

in-depth interviews revealed that knowledge was often scant, nonexistent orincorrect.
• Substantial changes in policy directions in social security have developedover recent years, leading to some confusion. It also seems that somefarmers held the false assumption that welfare assistance was available asa guaranteed minimum income support to any in need. Change and falseassumptions can lead to resentment and anger. They also hinderconsideration of feasible options.
• There was little knowledge of hardship tests for any of the programs inquestion, including in the two cases where an application had beenrejected under the assets test. AUSTUDY households, including two house-holds which were located in areas of drought exceptional circumstances,did not know about the exemption of farm assets from testing in suchareas.
• A number of the households depended on accountants or professionalfinancial advisers for dealing with Commonwealth social supportprograms. There was a likelihood that some professionals were notcompletely informed about hardship tests for assets testing and otherspecial criteria of programs. (It can be noted that the 1995 edition of TheRural Book, published by the Department of Primary Industries andEnergy’s Countrylink program, did not provide information abouthardship tests for the Age Pension or the Family Payment, although it didfor AUSTUDY.)
• There was an implied assumption in some households that there was nodifference in assets eligibility for the various Commonwealth assistanceprograms, and a rejected application in one program led these householdsto decide not to apply for other programs.
• Three of four target households for AUSTUDY interviewed in-depth wereunaware that farm assets were discounted by 50 per cent for assets testing,even in the case of a family receiving AUSTUDY. (see proposition 5, ch. 9)
• Decisions about whether to apply for assistance were based on‘knowledge’ of an acquaintance’s success or otherwise in applying to aprogram.
• Some households took the step of obtaining written information from therelevant program, then decided they were ineligible (possibly withvarying degrees of accuracy).
89Social support programs
Service delivery
On a five point rating scale, 75 per cent of farm households rated the qualityof service as average or better for most programs. Ratings below averageapplied to 19 per cent of households for Job Search, 20 per cent for the Sick-ness Allowance, 17 per cent for AUSTUDY , 19 per cent for the Rural Adjust-ment Scheme and 27 per cent for the Rural Access Program.
The in-depth interviews provided a rich account of the varying circum-stances of farm families and the service difficulties they encountered withgovernment agencies. They suggested issues which might apply to thegeneral population and to many of the government social support programs(not merely the one that was the focus of the interview).
• A negative experience with one program or one particular office wasgeneralised into a negative perception of all government social supportprograms in a number of cases. (see proposition 6, ch. 9)
• In some households, a negative experience with a government socialsupport agency led to reluctance to apply for support from anotherprogram. Some of the negative experiences mentioned were insensitivityby a particular officer to disability in the family, lack of privacy in thelocal Department of Social Security office when being questioned aboutpersonal finances, refusal by an officer to provide written informationabout eligibility for a program, and rejection for support from oneprogram.
• In a case of extreme hardship, a delay between an interview by aDepartment of Social Security officer and notification of the result addedto severe personal stress.
• Some households found that they required the assistance of an accountantor other professional person to complete application forms for programs,thus incurring extra cost.
• Households appreciated individual notification by post of their possibleeligibility for programs when a member of the family became nominallyeligible. For example, the provision of AUSTUDY information by theDepartment of Social Security when they notified families that entitle-ment to the Basic Family Payment has ceased for an 18 year old child, ora postal notification of the Parenting Allowance. Conversely, severalhouseholds felt that they had encountered information relevant to theirassistance entitlement by accident only.
90 ABARE research report 97.7

• Although a number of households accepted that they often had long waitson the telephone when dealing with social support programs, others sawthis as a source of irritation. Two households commented that the personalservice by a trusted local officer was favourable.
To some extent, better availability of information on social support programswould have overcome the limited knowledge or understanding found insome farm households. The Countrylink information service was designedto make information on all Commonwealth programs readily available.However, the service was less well known than the major social security andeducation assistance programs examined in this study, all of which had in-built information strategies. A couple of households commented that theywould seek information when they needed it, but most households said therewas a role for a program such as Countrylink.
Location (see proposition 8, ch. 9)
Locational differences in awareness of programs at the state and statisticaldivision level are shown in chapter 4.
Little difference was found in awareness of the Age Pension and AUSTUDY
between states. However, 68 per cent of households in New South Waleswere aware of the Basic Family Payment and 56 per cent in Tasmania,compared with a national average of 78 per cent. Some of the differencesmight have been explained by differences in program promotion at the statelevel or differences in remoteness from large urban centres. In some states,target populations might have been more cognisant that the Child Endow-ment program no longer existed, and that the Family Payment was the newmajor payment program for families with children. Awareness of eachprogram was also lower in some statistical divisions than in others.
There appeared to be an access problem for Age Pension target householdsin some statistical local areas close to urban centres. The ratio of predictedrecipients of the Age Pension to actual recipients that were aware of theprogram was higher in statistical local areas with a remoteness index of9.40–9.99 than elsewhere (map A). Collectively, these two rural categoriesaccounted for 47 per cent of target households for the Age Pension.
91Social support programs

Education participation and achievement
The survey obtained information about young people aged 16–21 years oneducation related issues, enabling comparison of this population with allyoung people in the same age group in Australia.
An estimated 14 per cent of 16–17 year old people on farms were full timestudents living away from home. This percentage increased to 31 per centfor 18–21 year old women, but was only 13 per cent for young men.
A much higher proportion of women aged 18–21 years continued their fulltime education than did men of the same age — 59 per cent compared with34 per cent. No information was obtained on the education and employmentstatus of young people not in full time education and who were not livingon the farm. However, the survey showed that women aged 18–21 years stillliving on-farm or away in full time education made up only 62 per cent ofthe number of young men in the same circumstances.
The highest level of education achieved for people aged 16–21 years wasalso collected: an estimated 43 per cent of 18–21 year old men and 37 percent of women of the same age had achieved year 11 or 12 as their highestlevel of education. Four in five of those young people who were no longerstudying stopped because they had ‘finished their education’, and less than1 per cent had stopped because of funding difficulties.
The distance between home and the nearest school was also analysed.Approximately 19 per cent of households were more than 20 kilometres froma primary school, while almost half of the households were more than20 kilometres from a secondary school. Fifteen per cent of households withchildren younger than 18 years had received support from the Assistance forIsolated Children Scheme.
Utility of the prediction model and wellbeing scaleEach of the two statistical tools developed for the case studies demonstrateda utility when applied to policy and service delivery issues of social supportprograms. The prediction model, developed to indicate which householdswould have been likely recipients of the Age Pension, AUSTUDY or the BasicFamily Payment, showed a high degree of accuracy. It predicted actualrecipients in the sample with a probability of 89–96 per cent accuracy forthe three programs. Nevertheless, it should be noted that an unknown
92 ABARE research report 97.7
proportion of predicted recipients would have been rejected had theyapplied.
The material wellbeing scale provided a good measure of material need, asevidenced by households with low household assets and low householdincomes tending to be in the bottom wellbeing quintile and households withhigh assets and high household incomes tending to be in the top wellbeingquintile. There was also a marked difference in the distribution of wellbeingscores between the household groups, with actual rejected applicants havinghigher scores than actual recipient households.
Application of the wellbeing analysis used in this study to other householdpopulations would assist in examining the equity of Commonwealthprograms between the farm population and the Australian population as awhole. Results from this study could provide a benchmark to compare anychanges in wellbeing over time among the farm population.
93Social support programs
Conclusion
The case studies were designed to assist Commonwealth agencies improvethe design and delivery of their programs. They were not designed to showthe positive facets of current policy and practice. The seeming deficiencieshighlighted in this report do not detract from the overall benefits thatCommonwealth social support programs brings to the lives of thousands offarm families throughout Australia.
Major findings from the study related to self-assessment of ineligibility,assets valuation, ignorance of programs and some particular provisions(including hardship tests), and more general service delivery issues.
While many needy farm families were unable to obtain support because theyhad too many assets, this study suggested that some farmers incorrectly ruledthemselves as ineligible on assets grounds. Most in need of support werethose farm families that were eligible for assistance but who had scant or noknowledge of programs likely to be relevant to them. While developing astrategy for a hidden population has particular challenges, the survey datacould assist in identifying further characteristics of this group, such as thescale of their business operations, their location, the number of householdsdependent on the farm income, and farm ownership details in more detail.Ignorance about hardship tests is an important issue for attention for allprograms.
Many of the findings from the in-depth interviews are likely to have generalapplication. It is likely that many eligible families perceive that the assetsand income tests are the same for all programs, not just some of thosehouseholds interviewed for this study. To overcome this, program adminis-trators could ensure that important program differences are highlighted toclients.
It became clear that some training in farm business operations and practicescould be useful for government policy makers and administrators. It is oftennot realised, for example, that farmers on low, nil or negative incomes can,and frequently do, meet household and business expenses. (They can do thisby taking on further debt by borrowing on their business assets, an optionnot available to most pay-as-you-earn employees.)
94
14
ABARE research report 97.7

Whether for farm families or government decision makers, the projectprovides a unique information base about assets as well as income in relationto Commonwealth social support programs.
95Social support programs
Terms of reference
Telephone surveyTo undertake a comprehensive survey of Australian farm families toascertain farm families’ knowledge of, access to, and take-up of existingsocial welfare and related programs to assist relevant agencies in theirongoing policy development and delivery of programs to rural communities.In particular, the survey will address:
(a) the level of understanding in rural communities of Commonwealthsocial welfare and related programs;
(b) the take-up by the farming community of the available programs and,where applicable, the reasons for not taking up the entitlements;
(c) the extent to which people currently ineligible for assistance under theexisting rules are disadvantaged in their access to education;
(d) any problems regarding access to Commonwealth social welfare andrelated programs and services;
(e) the extent to which Commonwealth social agencies are responsive tothe needs of rural clients;
(f) geographic differences, if any, in the level of understanding and take-up of the programs;
(g) non-farm income and asset levels;
(h) overall income and asset levels; and
(i) income levels relating to living standards.
Case studiesThe case studies will be developed in light of results from the phone surveyof farm families’ use of Commonwealth social services in consultation withthe Steering Committee, and will investigate in detail:
(a) the individual and/or group level of understanding of Commonwealthsocial welfare and related programs and reasons for accessing or notaccessing entitlements;
96
A
ABARE research report 97.7
Appendix
(b) the perceived difficulty of individual and/or group access (geographicetc.) to social welfare and related programs and services;
(c) the extent to which individuals and/or groups perceive Commonwealthagencies to be responsive to their needs;
(d) the overall income and asset levels and the non-farm income and assetslevels; and
(e) income levels relating to living standards.
97Social support programs

Survey method
Telephone questionnaire and interviewFlow charts summarising the interview questions and their sequence anddetails of the telephone questionnaire are provided in figures B1–B4.
Interview responses were given on behalf of all family household membersbut only one response per household was recorded. In other words, thehousehold was treated as a proxy client although clients were actually treatedon an individual basis. Before being questioned about some programs,households were screened for certain eligibility characteristics. Targethouseholds were defined for this report following further screening of thedata collected. The methods of calculating household assets (net of debt) andhousehold income from the data collected are also described later in thisappendix.
The set of questions aimed at providing information on living standards aresimilar to a set of living standards questions that the Department of SocialSecurity was assessing for the general population. Similar questions haveproved useful in other studies (see DSS 1995; Travers and Richardson 1993).
A total of 3447 telephone interviews with farm householders wereconducted. Interviews were confined to one household per farm, with therespondent indicating an ability to answer questions on behalf of othermembers of the household and about the farm business. Non-familymembers of the household were not covered by the survey. Householdsinterviewed for the survey were usually located on the farm, although someoff-farm households were included. Members who were not living in thehousehold were not covered by the survey unless they were full time studentsyounger than 22 years.
A farm household is defined in this report as all people living under the sameroof, with at least one member having some equity in the farm business andall members being family related.
Interviews were usually conducted during the evening and each took anaverage of 15–20 minutes. Responses were entered directly onto a computer
98
B
ABARE research report 97.7
Appendix

99Social support programs
B1 Telephone survey questionnaire
Household section
No Yes
member = member + 1
For each person in the household over the age of 15 years, the
questions on this page were asked
Genderand age?
Current employmen
status?
Relationshipto respondent?
Level ofeducation?
From Q1, is the member22 years of age or less?
Currently studying? Yes No
Does the individual receiveAUSTUDY/ABSTUDY?
Are there any morehousehold members?
Proceed to questionson number of children
Yes No Reason studywas discontinued

100 ABARE research report 97.7
B2 Telephone survey questionnaire
Program selection procedure
Distances to educationand health services?
Questions on living standards
Assistance for Isolated Children Scheme/Basic/Advanced Family Payment
Drought ReliefPayment Scheme
Age Pension
Sole Parent Pension
Disability Support Scheme
Is there a sole parent in the household?
Yes No
Are there men overthe age of 65 or women over
the age of 60 in the household?
Yes No
Is there a person in the householdwith a disability?
YesNo
Are there members of the householdunder the age of 22?
YesNo
Is the property located in Queensland,or the drought exceptional
circumstances areas of New South Wales,South Australia or Tasmania?
YesNo
PROGRAMS FOR ALL HOUSEHOLDSCountrylinkRural Access ProgramFarm Household Support SchemeRural Adjustment SchemeRural Counselling ServiceJob Search AllowanceSickness AllowanceAUSTUDY/ABSTUDY
Number of children incertain age groups?
Continue on with incomeand assets questions
For details on questions asked of eachprogram, see the following page
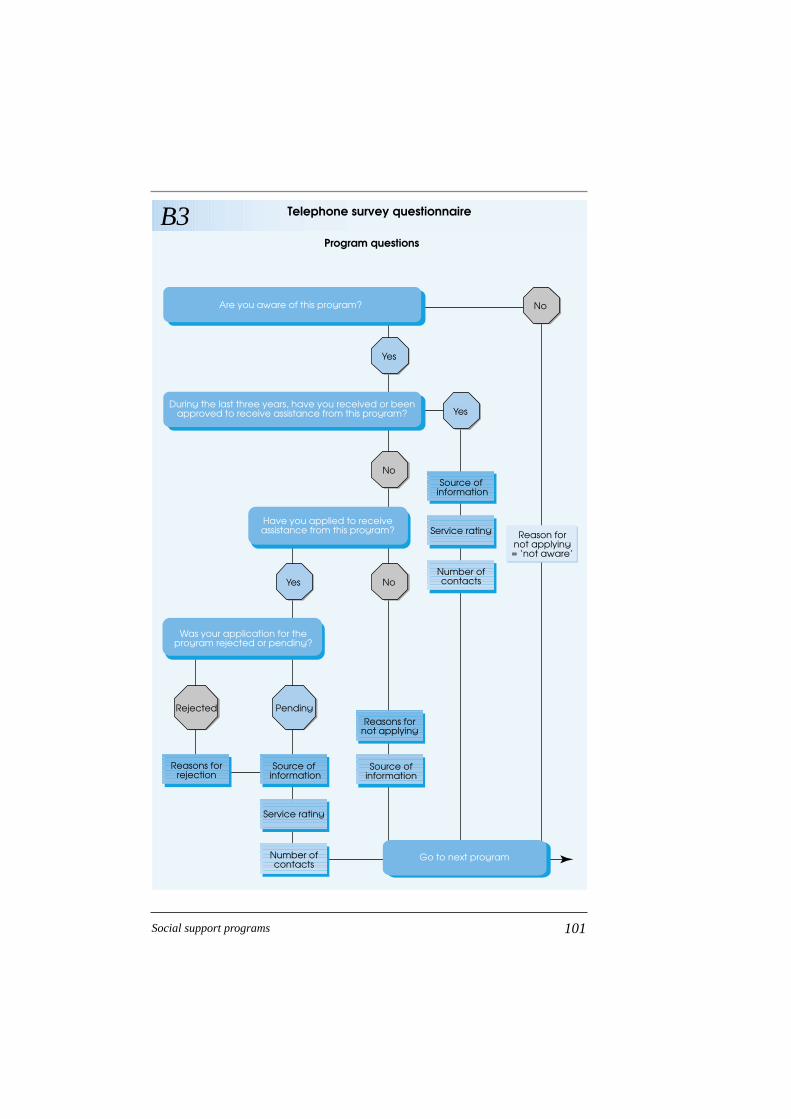
101Social support programs
B3 Telephone survey questionnaire
Program questions
Reasons forrejection
Rejected
Go to next program
Have you applied to receiveassistance from this program?
Was your application for theprogram rejected or pending?
During the last three years, have you received or beenapproved to receive assistance from this program?
Are you aware of this program? No
Reason fornot applying= ‘not aware’
Pending
Yes
Source of information
Service rating
Number ofcontacts
Yes
Source of information
Service rating
Number ofcontacts
Yes
No
No
Reasons fornot applying
Source ofinformation

102 ABARE research report 97.7
B4 Telephone survey questionnaire
End of questionnaire
Number of households supportedby the farm business?
Household's share ofnet farm income?
Net farm income?
Walk-in, walk-out valueof farm business?
Total farm business debt?
Farm business liquid assets?
Household non-farm debt?
Household non-farm assets• liquid?• other?
Household off-farm income?
Income and assets questions

which was programmed to skip certain questions when specified responsesoccurred.
Survey population and selection of farm householdsThe survey population of households in this report is one household fromall Australian farms in all agricultural industries with an estimated value ofagricultural operations greater than $5000 a year.
The sample of farms from which the households were surveyed was selectedfrom a list of all agricultural establishments compiled by the AustralianBureau of Statistics (derived from the Agricultural Census conducted inMarch 1994). The list contained information on key characteristics andindustry information for each farm. Estimated value of agriculturaloperations is defined by the Australian Bureau of Statistics as the dollarvalue of the level of agricultural output for an establishment, obtained byapplying crop area, livestock numbers and output values to agriculturalcensus data (ABS 1994a). In this study, farms with an estimated value ofagricultural operations greater than $22 500 a year were classified ascommercial, while farms with an estimated value of agricultural operationsbetween $5000 and $22 500 a year were classified as subcommercial.
Sample design and size enabled analysis to be undertaken on the basis ofremoteness as defined by the Rural, Remote and Metropolitan Areas Clas-sification (DPIE and DHSH 1994).
Estimates and reliabilityOnly a proportion of farms out of the total number of farms in the populationwere surveyed to produce the population estimates contained in this report.The estimates were calculated by appropriately weighting the data collectedfrom each sample farm, then using these weighted data to calculate popu-lation estimates. Sample weights were calculated so that sample estimatesof numbers of farms in various geographic regions and industries corre-sponded as closely as possible to known Australian Bureau of Statistics data.
The differences between estimates from a sample and the values that wouldhave been obtained if information had been collected from all farms arecalled sampling errors. The more farms in the sample, the lower the samplingerror is likely to be. Thus, statistical division estimates are likely to havegreater sampling errors than state estimates, and state estimates are likely to
103Social support programs

have greater sampling errors than national estimates. To give a guide to thereliability of the estimates, estimates of standard errors were calculated andexpressed as a percentage of the population estimates and termed ‘relativestandard errors’. These are given in parentheses next to each estimate in thetables.
To obtain the standard error from the relative standard error, multiply therelative standard error by the population estimate and divide by 100. Forexample, if the number of people in households in New South Wales are 124407 with a relative standard error of 2 per cent, the standard error for thisestimate is 2488 (124 407 x 2/100). There is roughly a two in three chancethat a population estimate is within one standard error of the ‘census value’(the value which would have been obtained if all farms in the surveyedpopulation had been surveyed). There is a roughly a nineteen in twentychance that a population estimate is within two standard errors of the censusvalue. Thus, in the above example, there is an approximately two in threechance that the census value is between 121 919 and 126 895 people, andan approximately nineteen in twenty chance that the census value liesbetween 119 431 and 129 383 people.
Non-sampling errors may be introduced into some of the results reportedfrom the survey as a result of errors in respondents’ recollections of factsand events and their perceptions of certain circumstances.
Accuracy of estimates in the figuresRelative standard errors can be computed for most results presented in thevarious figures. A formula based on the estimate and associated sample sizeis provided that will give a reasonably good estimate of the relative standarderror in most situations.
Consider figure 10. Among other things, it shows the percentage of house-holds among all nonreceipient households that were aware of a program butdid not apply for assistance. A relative standard error can be calculated forthese estimates using the formula:
where n is number of nonreceipient households in the sample and p is theproportion of households which were aware but did not apply.
RSEp
n p= −
1001( )
.,
104 ABARE research report 97.7

For example, in the case of the Basic Family Payment, p = 0.44 (table 10)and n = 261 (table B1), so the relative standard error is about 7 per cent.Therefore, the standard error is 0.03. A 95 per cent confidence level can beconstructed by adding and subtracting twice this standard error from theestimate of p. That is, there is approximately a nineteen in twenty chancethat the true proportion of households that did not apply is 38–50 per centof nonreceipient households for the Basic Family Payment.
The sample sizes needed to calculate the relative standard errors for most ofthe estimates in the figures can be obtained from tables B1 and B2. It isimportant to use the correct sample size when performing the calculation.For example, if the estimate is a proportion of those households aware of aparticular program, then n is the number of households aware of the program.If the estimate is a proportion of those households with assets between$10 000 and $50 000, then n is the number of households with assets in thisrange.
105Social support programs
B1 Sample size, by program
Number of households in the sample
Aware ofprogram,
Interviewed Aware of Did not did not Applicationabout program program receive apply a rejected
no. no. no. no. no.
Basic Family Payment 1 357 1 087 592 261 49Job Search Allowance 3 451 2 684 3 213 2 390 45Age Pension 760 713 582 494 33Sole Parent Pension 177 na 149 146 2Sickness Allowance 3 451 993 3 368 894 17Disability Support Pension 198 na 112 99 6AUSTUDY 754 707 412 280 75Assistance for Isolated Children
Scheme 1 357 680 1 244 558 10Rural Adjustment Scheme 3 451 2 287 3 029 1 706 136Drought Relief Payment 1 122 891 870 597 31Farm Household Support 3 451 1 040 3 365 962 –Rural Counselling Program 3 451 1 960 3 201 1 717 naCountrylink 3 451 1 346 3 345 1 226 naRural Access Program 3 451 609 3 419 584 na
a Includes households that did not seek assistance from Countrylink, the Rural Counselling Programand the Rural Access Program. na Not applicable. – Negligible or no households in this category.
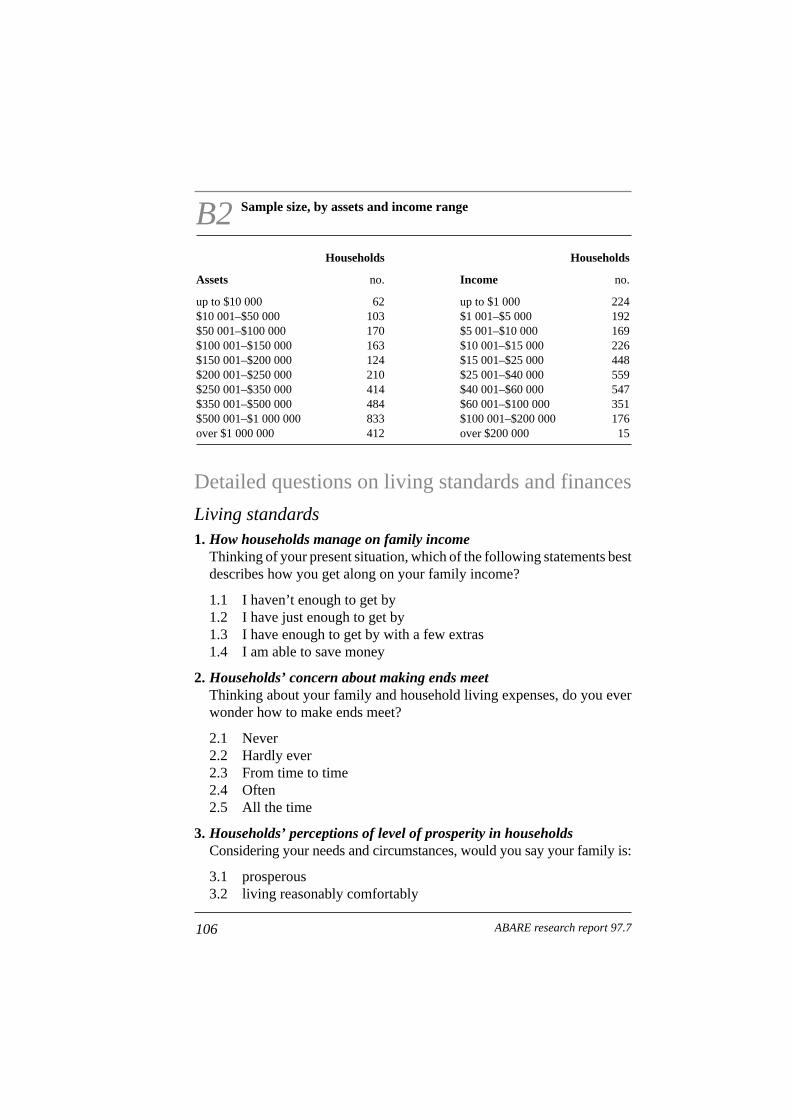
Detailed questions on living standards and finances
Living standards1. How households manage on family income
Thinking of your present situation, which of the following statements bestdescribes how you get along on your family income?
1.1 I haven’t enough to get by1.2 I have just enough to get by1.3 I have enough to get by with a few extras1.4 I am able to save money
2. Households’ concern about making ends meetThinking about your family and household living expenses, do you everwonder how to make ends meet?
2.1 Never2.2 Hardly ever2.3 From time to time2.4 Often2.5 All the time
3. Households’ perceptions of level of prosperity in householdsConsidering your needs and circumstances, would you say your family is:
3.1 prosperous3.2 living reasonably comfortably
106 ABARE research report 97.7
B2 Sample size, by assets and income range
Households Households
Assets no. Income no.
up to $10 000 62 up to $1 000 224$10 001–$50 000 103 $1 001–$5 000 192$50 001–$100 000 170 $5 001–$10 000 169$100 001–$150 000 163 $10 001–$15 000 226$150 001–$200 000 124 $15 001–$25 000 448$200 001–$250 000 210 $25 001–$40 000 559$250 001–$350 000 414 $40 001–$60 000 547$350 001–$500 000 484 $60 001–$100 000 351$500 001–$1 000 000 833 $100 001–$200 000 176over $1 000 000 412 over $200 000 15

3.3 just getting along3.4 poor3.5 very poor
4. Households’ ability to obtain $5000 within a week for somethingimportantIf all of a sudden you needed $5000 within a week for somethingimportant (for personal or family expenses), could you get it?
5. Source of funds for households that were able to obtain $5000Which of the following sources would you use?
(You can select more than one)
5.1 Your own savings5.2 Loan from a family member5.3 Loan from a friend5.4 Business drawings (for example, overdraft)5.5 Loan from bank, credit union etc5.6 Credit card/s5.7 Other
6. Cutting back on expenditureOver the past two years, have you ever:
6.1 cut back on basic food to save money?6.2 cut back on heating or cooling to save money?6.3 got behind with payments for power, gas or water?6.4 got behind with hire purchase payments?6.5 got behind with credit card payments?6.6 got financial help from family or relatives?6.7 got material help from a welfare agency?
7. Boarding school7.1 In the past two years, did your children go to a boarding school?7.2 Did you get behind with boarding fees?
8. Ownership of off-farm dwellingsDo you own or have a share in a dwelling other than the dwelling you livein? (Do not include other houses on the farm.)
9. Holidays9.1 Did you go away on holiday last year?9.2. Did you go:
9.2.1 within the state?9.2.2 interstate?9.3.3 overseas?
107Social support programs

10. Would you say your overall health is:10.1 excellent?10.2 good?10.3 fair?10.4 poor?
11. Do you have private health insurance?
Finances1. Households supportsHow many households are supported by this farm business? (Includepartners and family only, not hired labour.)
2. Income shareWhat percentage of net farm income (after costs but before tax) is receivedby your household? (When interviewing the manager of a property, put avalue of 999 in this field.)
3. Net farm incomeWhat was the 1993-94 income received form this farm (after costs but beforetax) by the members of this household? (Include any wages and salaries paidto household members by the farm business).
4. Capital valuationWhat would you say is the present value of your farm? (On a walk-in, walk-out basis: include the value of land, buildings, livestock, plant and machinery,grain and wool on hand, etc.) but do not include the value of privately leasedland.)
5. Farm debtPlease estimate the present total farm debt. (Do not include non-farm debts.)
6. Liquid assetsWhat is the present value of liquid assets owned by the farm business?(Include interest bearing deposits, shares, bank deposits, debentures, bonds,Income Equalisation Deposits, etc.)
7. Household non-farm debtWhat is your household’s present total non-farm debt (include no farm debtfrom this household only.)
108 ABARE research report 97.7
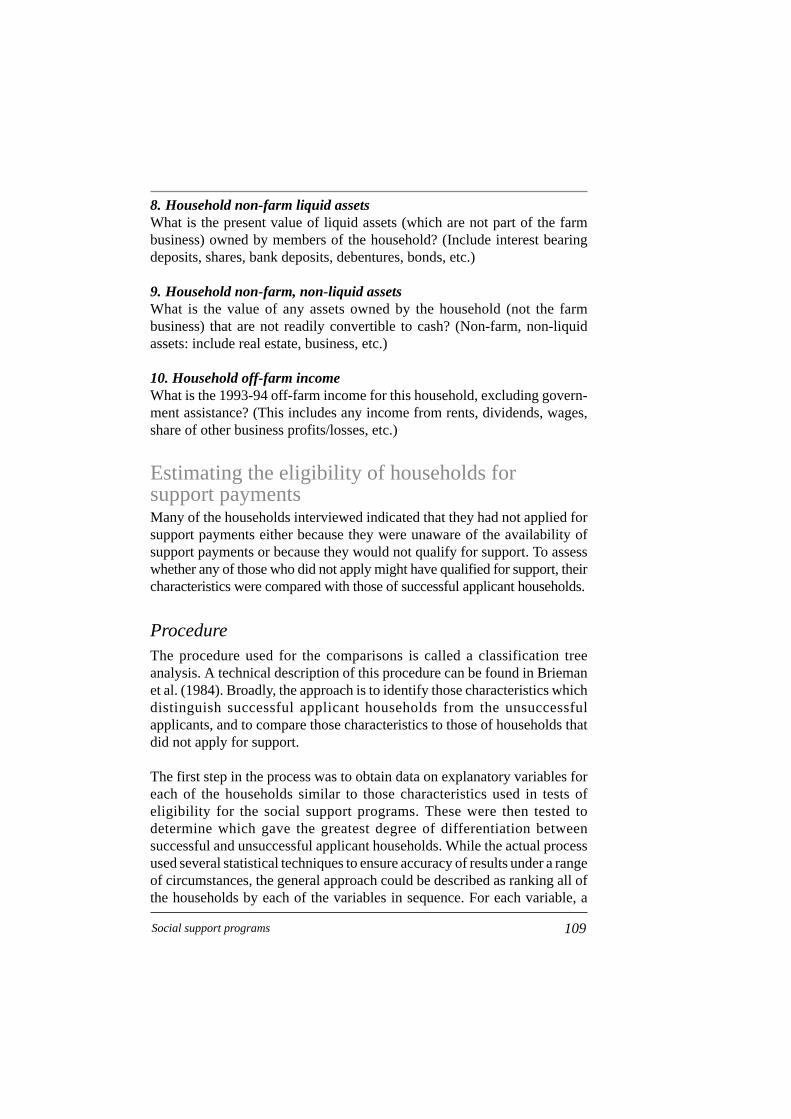
8. Household non-farm liquid assetsWhat is the present value of liquid assets (which are not part of the farmbusiness) owned by members of the household? (Include interest bearingdeposits, shares, bank deposits, debentures, bonds, etc.)
9. Household non-farm, non-liquid assetsWhat is the value of any assets owned by the household (not the farmbusiness) that are not readily convertible to cash? (Non-farm, non-liquidassets: include real estate, business, etc.)
10. Household off-farm incomeWhat is the 1993-94 off-farm income for this household, excluding govern-ment assistance? (This includes any income from rents, dividends, wages,share of other business profits/losses, etc.)
Estimating the eligibility of households for support paymentsMany of the households interviewed indicated that they had not applied forsupport payments either because they were unaware of the availability ofsupport payments or because they would not qualify for support. To assesswhether any of those who did not apply might have qualified for support, theircharacteristics were compared with those of successful applicant households.
ProcedureThe procedure used for the comparisons is called a classification treeanalysis. A technical description of this procedure can be found in Briemanet al. (1984). Broadly, the approach is to identify those characteristics whichdistinguish successful applicant households from the unsuccessfulapplicants, and to compare those characteristics to those of households thatdid not apply for support.
The first step in the process was to obtain data on explanatory variables foreach of the households similar to those characteristics used in tests ofeligibility for the social support programs. These were then tested todetermine which gave the greatest degree of differentiation betweensuccessful and unsuccessful applicant households. While the actual processused several statistical techniques to ensure accuracy of results under a rangeof circumstances, the general approach could be described as ranking all ofthe households by each of the variables in sequence. For each variable, a
109Social support programs
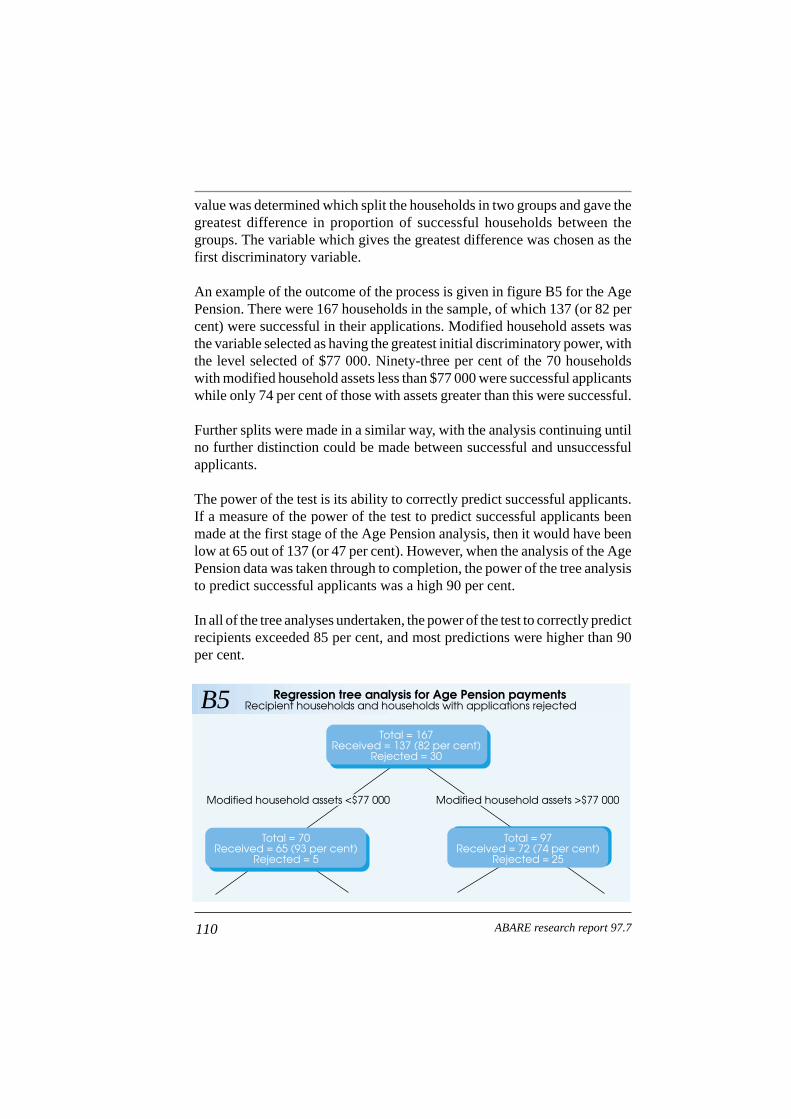
value was determined which split the households in two groups and gave thegreatest difference in proportion of successful households between thegroups. The variable which gives the greatest difference was chosen as thefirst discriminatory variable.
An example of the outcome of the process is given in figure B5 for the AgePension. There were 167 households in the sample, of which 137 (or 82 percent) were successful in their applications. Modified household assets wasthe variable selected as having the greatest initial discriminatory power, withthe level selected of $77 000. Ninety-three per cent of the 70 householdswith modified household assets less than $77 000 were successful applicantswhile only 74 per cent of those with assets greater than this were successful.
Further splits were made in a similar way, with the analysis continuing untilno further distinction could be made between successful and unsuccessfulapplicants.
The power of the test is its ability to correctly predict successful applicants.If a measure of the power of the test to predict successful applicants beenmade at the first stage of the Age Pension analysis, then it would have beenlow at 65 out of 137 (or 47 per cent). However, when the analysis of the AgePension data was taken through to completion, the power of the tree analysisto predict successful applicants was a high 90 per cent.
In all of the tree analyses undertaken, the power of the test to correctly predictrecipients exceeded 85 per cent, and most predictions were higher than 90per cent.
110 ABARE research report 97.7
B5 Regression tree analysis for Age Pension paymentsRecipient households and households with applications rejected
Total = 167Received = 137 (82 per cent)
Rejected = 30
Total = 70Received = 65 (93 per cent)
Rejected = 5
Total = 97Received = 72 (74 per cent)
Rejected = 25
Modified household assets <$77 000 Modified household assets >$77 000

Applying the resultsThe results of the tree analysis were applied to the data for those who hadnot applied. This was done by splitting the households into the same groupsas in the tree analysis. The probabilities of receiving support derived fromthe tree analysis were then applied to each of these groups, and the totalpredicted applicants were calculated.
In-depth interviews
Interviewers’ checklistEach household required an individual line of questioning according totheir circumstances, and the program under which they were beingconsidered, but questions were guided by this checklist of informationrequirements. Information collected about income and assets at the farminterview followed the same wording as the telephone survey.
[Check] after a point indicates that the telephone information survey datafor the family was checked.
GeneralThe household1. Family relationships (check)
2. Residence (check)
3. Age/occupation (on-farm/off-farm?) (check)
4. Education levels (check)
5. Next generation plan
The property6. Number of households supported — family relationship?
7. Type of business relationship
8. History on land
9. Total acreage
10. Crop types and area
11. Livestock and numbers
12. Major changes in land ownership/crop production
111Social support programs

13. Capital valuation [What would you say is the present value of your farm(on a walk-in, walk-out basis, including the value of land, buildings,livestock, plant and machinery, grain and wool on hand, etc)?] (check)
Who owns what?
How did they assess the value of the farm?
14. Farm debt [Please estimate farm debt (do not include non-farm debt)?](check)
15. Farm liquid assets [What is the total present value of liquid assets ownedby the farm business (Include shares, bank deposits, debentures, bonds,IEDs, etc.)?] (check)
16. Household share of farm income (check)
17. 1993-94 income from farm received by members of this household[After costs but before tax — include wages and salaries paid tohousehold members by the farm business]
18. Household non-farm debt [What is your household’s present non-farmdebt?] (check)
19. Household non-farm liquid assets [What is the present value of liquidassets (which are not part of the farm business) owned by members ofthe household (include IBDs, shares, bank deposits, debentures, bonds,IEDs, etc.)?] (check)
20. Household non-farm non-liquid assets [What is the present value of anyassets owned by members of the household (not the farm business) thatare not readily convertible to cash (include real estate, businesses, etc.)?](check)
21. 1993-94 household off-farm income for this household [Excludegovernment assistance; include money from rents, dividends, wages,share of other business profits/losses, etc.)] (check)
Hardship1. Lifestyle with current income (check)
– are things now better or worse?– how making ends meet?
2. Missing out on anything?
3. When things get tough, what goes?
112 ABARE research report 97.7

4. Follow up:– getting behind power / gas / water / credit card– cutting back food / heating / cooling– getting financial help from family / friends / welfare agency
5. Sell farm — some or all– what circumstances– sell a portion and remain viable– find a buyer at the right price
6. Circumstances (check): compared to?
7. Raise $5000 in a week (check)If yes, from? (check)
8. Is this (that is, the two questions above) still the case?
No applicationAware of program but did not apply1. Why didn’t apply? (check)
2. Information source? (check) How detailed about this program?
3. Professional advice? Who, when, general advice or specifically re thisprogram
4. Other programs applied for? (check) Affect on decision not to apply forthis one.
5. Knowledge of program – age / assets / income / other criteria, hardshiptests
Unaware of program1. Not aware? (check)
2. Current knowledge of program
3. Best channels of information
4. Ever thought of getting assistance in this area?
5. How learnt about other programs (check – if other programs applied for)
6. Would they have applied if aware?
113Social support programs

Service delivery1. Difficulties – from experience or foreseen difficulties
2. Changes that would make programs more responsive to farmers’ needs– forms, Teleservice,– Department of Social Security/CES office: problems in attending or
positives of past experiences
3. Location: effect on access; how far to closest Department of SocialSecurity office
4. Rural counsellor in area? Use a rural counsellor or get advice elsewhere?
5. Countrylink – what role would be useful?
Questions specific to programAUSTUDY
1. Would/will all the children of the family be able to pursue theireducational targets without assistance from Austudy?
2. If any of the children have already finished their education, did lack offunds have anything to do with the completion of education? What wasthe reason for finishing education if finished at the minimum age?
3. Where the child who is of AUSTUDY age is in paid employment, is thatemployment essential for the child to continue with study?
Age Pension1. Why do older people want to hold on to the land if it is not bringing them
a living income: is it for inheritance reasons, lifestyle reasons, or becausethey see the period of low income as being temporary?
2. Is the family aware of concessions available to age pensioners? Wouldthe receipt of these, with even a minimal pension payment, make adifference to their wellbeing?
114 ABARE research report 97.7

Eligibility for program assistance
115
C
Social support programs
Appendix
Selected eligibility criteria for program assistance, April–May 1995 a
Maximum assets Maximum incomeof unit assessed b of unit assessed c Other criteria
Basic Family Total net assets: Varied with number Normally for aPayment d $559 250 of parents, age and child under 16 years
number of children: but could be paid– 1 child $61 020 to if child was up to– 5 children $73 224 19 years and a
full time student
Hardship As above, but farm – 1 child $14 444 to Paid to parenttests d assets not assessed 5 children $48 662
Liquid assets:– 1 parent $6000– 2 parents $10 000
Additional Total net assets: Varied with age and As for Basic FamilyFamily $376 750 number of children: PaymentPayment d – 1 child < 13 years
$25 194 to– 5 children < 13 years
$41 666
Hardship Total net assets: – 1 child $14 144 totests d $559 250 – 5 children $16 640
Liquid assets:– 1 parent $6000– 2 parents $10 000
Job Search Total net assets: – single person For persons Allowance e – single, home owner $10 439 18–60/65 years
$115 500 – couple $16 744 who were:– single, non-home – actively seeking
owner $197 000 and willing to– couple, home owner undertake suitable
$163 500 work– couple, non-home – willing to under-
owner $245 500 take suitablevocational trainingapproved by CES
– willing to participatein any other activityapproved by the CES

Farmers who werenot substantiallyemployed in runningthe farm might havequalified if they metthe above criteria
Hardship As for Job Search Maximum incometests d above but farm assets as for normal Job
might have been Searchignored if these could not be sold or borrowed against
Age Pension e Total net assets: – single person For women over– single person, $20 000 60 years and men
home owner – couple $33 000 over 65 years$225 000
– single person, non-home owner$307 500
– couple, home owner$347 000
– couple, non-homeowner $429 000
Hardship As above but assets If farm assets weretests d might have been not assessed, income
ignored it was not on farm assets was‘reasonable’ to sell deemed at 2.5 per centthe property nor and added to otherborrow against it income
Liquid assets: As for normal Age– single person Pension
$6000– 2 adults $10 000
Sole Parent As for Age Pension As for Age Pension For single parentsPension supporting children
under 16 years
Sickness As for Age Pension As for Age Pension For persons 16–60/65Allowance e who had suffered a
temporary loss ofincome as a result ofan injury or illnessmaking them unable towork
116 ABARE research report 97.7

Disability As for Age Pension As for Age Pension For persons 16–60/65Support years who had anPension e impairment level of at
least 20 per cent andwere unable to work orundertake work relatedtraining for at least thenext two years becauseof the impairment
AUSTUDY f Farm assets were Income was adjusted For dependent normally discounted by adding an allow- students (applicants50 per cent ance for the age and 22 years and over
number of dependent were treated aschildren independent of their
parentsTotal net assets: Adjusted maximum Paid to student$375 630 income:
– at home <17 yearsFor families living $31 687 toin exceptional – away from home,circumstances 18–21 years $43 275drought declared areaon-farm assets couldbe discounted 100 percentFor families receiving DroughtRelief Payments, allfamily assets couldbe discounted 100 percent
Assistance for None for For full-time studentsIsolated Correspondence, <19 years if any ofChildren Basic Boarding and following:Scheme f Second Home – distance between
Allowance home and nearest
For Additional appropriate govern-Boarding Allowance, ment primary adjusted income school was >16 km(calculated similarly and <56 km, andas for AUSTUDY): distance between– primary students home and available
$24 299 transport service to– secondary students nearest appropriate
$25 699 government schoolwas 4.5 km
117Social support programs

– distance betweenhome and nearestappropriategovernment primaryor secondary schoolwas >56 km
– travel time was atleast 1.5 hours eachway or at least 3hours daily
– Paid to parent
Drought Relief Farm assets not As for Job Search For farmers inPayment e assessed Allowance areas of drought
Other assets as for exceptional circum-Job Search Allowance stances who were
experiencingdifficulties in meetingfamily and personalexpenses
Farm Farm assets not As for Job Search For day-to-dayHousehold assessed Allowance household expensesSupport e for farmers unable
Otherwise, as for to access furtherJob Search Allowance commercial finance
Paid as a loan for up totwo years if farmer leftthe farm within the twoyears Converted to agrant for the first ninemonths if farmer leftthe farm
a Only income support and student assistance programs administered by the Department of SocialSecurity and the Department of Employment, Education, Training and Youth Affairs are described.Eligibility for the Rural Adjustment Scheme was assessed by Rural Adjustment Authorities in eachstate; assessment included business viability in the longer term. The Rural Counselling Program,Countrylink and the Rural Access Program were community programs, not income support programs.b Business and personal assets, including cash, shares, investment property; excluded the value of thedomestic home and up to two hectares of curtilage. c Generally taxable income but some differences,for example, income losses from a non-farm business could not be offset against farm income; incomefrom all sources; income normally assessed on a twelve month basis for farm families. d Unit assessedfor assets and income was parents plus children for whom Family Payment was made. e Unit assessedfor assets and income was applicant plus partner if married. f Unit assessed for assets and income wasparents plus their dependent children.
118 ABARE research report 97.7
References
ABARE 1995, Australian Commodity Statistics 1995, Canberra.
ABS (Australian Bureau of Statistics) 1993, Australian Standard GeographicalClassification, 2.3, cat. no. 1216.0, Canberra.
—— 1994a, Characteristics of Australian Farms 1993, cat. no. 7102.0,Canberra.
—— 1994b, Social Indicators, cat. no. 4101.0, Canberra.
—— 1995a, June 1993 and Preliminary June 1994, Estimated ResidentPopulation By Sex and Age, States and Territories of Australia, cat. no.3201.0, Canberra.
—— 1995b, September 1994, Participation in Education in Australia(Persons Aged 15 to 24), Product Reference no. 6272.0.40.001, Canberra.
—— 1995c, The Integrated Regional Database Version 2, cat. no. 1353.0,Canberra.
Beare, S., Topp, V. and Parameswaran, B. 1995, ‘Broadacre farm per-formance’, in ABARE, Farm Surveys Report 1995, Canberra.
Brieman, I., Friedman, J.H., Olshen, R.A. and Stone, C.J. 1984, Classi-fication and Regression Trees, Wadsworth, Belmont, California.
DPIE (Department of Primary Industries and Energy) 1993, CommunityGroup Evaluation Report on the Countrylink Evaluation, Canberra.
—— and DHSH (Department of Human Services and Health) 1994, Rural,Remote and Metropolitan Areas Classification: 1991 Census Edition,AGPS, Canberra.
DSS (Department of Social Security) 1993, Evaluation of the Administrationof the Pensions Asset Test – Report, Canberra.
119Social support programs
—— 1995, Developing a Framework for Benchmarks of Adequacy forSocial Security Payments, Discussion Paper no. 6, AGPS, Canberra.
Gooday, J. 1995, ‘Women in agriculture: broadacre and dairy family farms,1993–94’, in ABARE, Farm Surveys Report 1995, Canberra.
Hugo, G.J. and Smailes, P.J. 1990, Population dynamics in rural Australia,Paper presented at the Annual Conference of the Regional Science Asso-ciation, Australian and New Zealand Section, Perth, 3–5 December.
Knopke, P., Furmage, P., Walters, P. and Kreig, A. 1995, ‘Agriculture in theAustralian economy’, in National Farmers Federation (ed.), AustralianAgriculture, 5th Edition, 1995/96, Morescope Publishing, Hawthorn East,Victoria, pp. 17–33.
Leach, E.R. 1967, ‘An anthropologist’s reflections on a social survey’, inJorgmans, D.G. and Gutkind, P.C. (eds), Anthropologists in the Field, VanGorcum, Assen.
Martin, P. 1995, ‘Drought: impact on-farm financial performance’, inABARE, Farm Surveys Report 1995, Canberra.
Morrison, D.F. 1967, Multivariate Statistical Methods, McGraw-Hill,Sydney.
National Council for the International Year of the Family 1994, Creating theLinks: Families and Social Responsibility, Final Report, AGPS, Canberra.
Salt, B. 1993, Population Movements in Non-metropolitan Australia, AGPS,Canberra.
Senate Rural and Regional Affairs and Transport References Committee1995a, Impact of Assets Test on-farming Families’ Access to SocialSecurity and AUSTUDY: First Report – AUSTUDY Assets Test, Parliament ofthe Commonwealth of Australia, Canberra.
—— 1995b, Impact of Assets Test on-farming Families Access to SocialSecurity and AUSTUDY: Second Report – Social Security Assets Test,Parliament of the Commonwealth of Australia, Canberra.
120 ABARE research report 97.7
Stayner, R. 1995, People on-farms, Rural Development Centre, Universityof New England, Armidale.
Taylor, M. 1990, Economic restructuring and regional change in Australia,Paper presented at the Institute of Australian Geographers Conference,University of New England, Armidale, New South Wales, September.
Travers, P. and Richardson, S. 1993, Living Decently: Material Wellbeingin Australia, Oxford University Press, Melbourne.
Wright, J., Beare, S., Tulpulé, V. and Kokic, P. 1994, Risk and returns inAustralian broadacre agriculture, ABARE paper presented at the 38thAnnual Conference of the Australian Agricultural and Resource Econ-omics Society, Wellington, New Zealand, 8–10 February.
Yin, R.K. 1994, Case Study Research: Design and Methods, 2nd edn,Applied Social Research Methods Series, vol. 5, Sage Publications,Thousand Oaks.
121Social support programs