刘瑶. introduction method experiment results summary & future work
TRANSCRIPT

刘瑶


Introduction
Method
Experiment results
Summary & future work

Definition of image simulation◦ generates synthetic images based
on the analysis and understanding of imaging acquisition
Application◦ Evaluation of system specifications◦ Test of processing facilities◦ Test-bench for future algorithm
development◦ Cost-versus-quality trade-offs

Simulation tools◦ DIRSIG (The Digital Imaging and Remote Sensing
Image Generation Model)Spectral range: 0.3 - 20 μm regionTypes of imagery:multi- and hyper-spectral passive systems, polarimetric imagery, radiative transfer in littoral waters, and active LIDAR systems
source : http://dirsig.blogspot.com/2011/02/scene-building-with-blender.html

Simulation tools◦ EeTes (EnMAP end-to-end Simulation)
Spectral range: VNIR & SWIR◦ PICASSO (Parameterized Image Chain Analysis & Simulation SOftware)
Spectral Range: visible to near-infrared(VISNIR) & TIR Summary
◦ Image simulation in mid-infrared regions is rarely discussed, especially the absorption bands.

Applications of mid-infrared regions (3-5 μm)◦ Sensitive to high temperature
objects(fire, active volcanoes etc.) Mid-infrared absorption bands
◦ Fundamental research on these two special band to make preparation for mid-infrared simulation.

Image simulation chain
◦ Surface scene simulation is basis for other two processes.
◦ Solar radiation is absorbed and less will reach the ground and be reflected.
Question◦ whether the reflected part of surface
radiance can be neglected ? ◦ what factors affect the surface radiance
composition ? study bands: 2.7 &4.3 μm
Surface scene simulation
Atmospheric simulation
Sensor hardware simulation
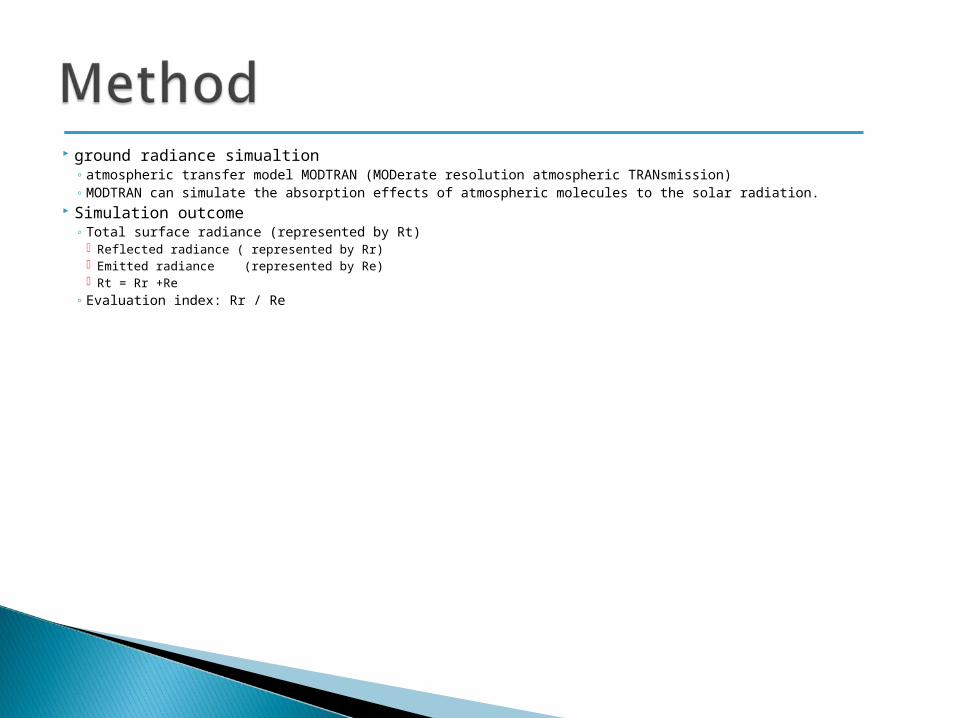
ground radiance simualtion ◦ atmospheric transfer model MODTRAN (MODerate resolution atmospheric TRANsmission)◦ MODTRAN can simulate the absorption effects of atmospheric molecules to the solar radiation.
Simulation outcome◦ Total surface radiance (represented by Rt)
Reflected radiance ( represented by Rr) Emitted radiance (represented by Re) Rt = Rr +Re
◦ Evaluation index: Rr / Re

Input parameters
atmosphere typemid latitude
summer/winteraerosol type urban
visibility 50 kilometerssolar zenith angle 30°view zenith angle 30°
relative azimuth angle 90°surface temperature 300K/272.2K
gas concentration(H2O,O3,CO2)
default values
sensor altitude 1msurface altitude 0

surface features
assume all features are lambert in simulation.
Type of objects Name
vegetationconifer
deciduousgrass
soilsandy loam
brown fine sandy loambrown loamy fine sand
watersea water
distilled water

Spectral reflectance(from JHU spectral library)
The reflectance of soil is relatively higher than vegetation and water

Rr/Re near 2.7μm in summer and winter
Temperature & reflectance have impacts on surface radiance compositon in mid-infrared absorption bands
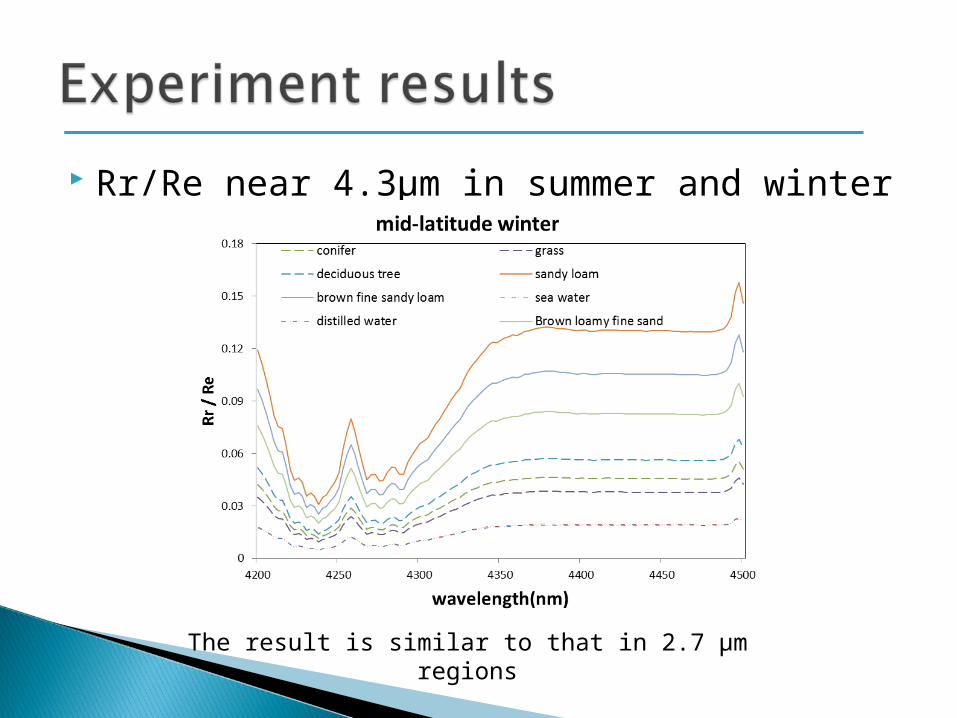
Rr/Re near 4.3μm in summer and winter
The result is similar to that in 2.7 μm regions

Ratio of Rr to Re of the band◦ assumption: square-wave spectral response
function Response equals 1 within the band Response equals 0 outside the band
Initial wavelength Final wavelength
0
1
wavelength
r e s p o n s e

Rr_b/Re_b in 2.7 & 4.3 band
The result in bands is consistent with that in wavelengths.
Summary◦ Temperature and reflectance of surface
features both contribute to the surface radiance composition.
◦ Whether the reflected radiance can be neglected in surface scene simulation relates to the expected accuracy of simulation. For example, if a 10 percent of error is allowed, the reflection of soils, water and vegetation can all be neglected.

Further work◦ More factors need to be involved: water vapor
contents, BRDF, etc.◦ Reflectance data of surface features should be
expanded.◦ In-situ validation: field measurements of
reflected and emitted radiance. ◦ Simulation is working with the sensor. Since
the proportion changes with the wavelength, for specific sensor, the surface composition analysis also depends on the bandwidth.