® ibm software group © 2012 ibm corporation september, 2012 rdz workbench – debugging z/os...
TRANSCRIPT

®
IBM Software Group
© 2012 IBM CorporationSeptember, 2012September, 2012
RDz Workbench – Debugging z/OS Assembler RDz Workbench – Debugging z/OS Assembler ApplicationsApplications
Jon Sayles, Rational System z Products - [email protected]

2
IBM Trademarks and Copyrights © Copyright IBM Corporation 2007,2008, 2009, 2010, 2011, 2012. All rights reserved.
The information contained in these materials is provided for informational purposes only, and is provided AS IS without warranty of any kind, express or implied. IBM shall not be responsible for any damages arising out of the use of, or otherwise related to, these materials. Nothing contained in these materials is intended to, nor shall have the effect of, creating any warranties or representations from IBM or its suppliers or licensors, or altering the terms and conditions of the applicable license agreement governing the use of IBM software. References in these materials to IBM products, programs, or services do not imply that they will be available in all countries in which IBM operates.
This information is based on current IBM product plans and strategy, which are subject to change by IBM without notice. Product release dates and/or capabilities referenced in these materials may change at any time at IBM’s sole discretion based on market opportunities or other factors, and are not intended to be a commitment to future product or feature availability in any way.
IBM, the IBM logo, the on-demand business logo, Rational, the Rational logo, and other IBM Rational products and services are trademarks or registered trademarks of the International Business Machines Corporation, in the United States, other countries or both. Other company, product, or service names may be trademarks or service marks of others.
3
Course Contributing Authors Thanks to the following individuals, for assisting
with this course: Larry England/IBM Russ Courtney/IBM Doug Stout/IBM
4
Course Overview Audience
This course is designed for application developers who have learned or programmed in Assembler, and who need to do z/OS Traditional Development and Maintenance as well as build leading-edge applications using Assembler and Rational Developer for System z.
Prerequisites This course assumes that the student has a basic understanding and
knowledge of software computing technologies, and general data processing terms, concepts and vocabulary, as well as a working knowledge of Assembler and z/OS.
Knowledge of SQL (Structured Query Language) is assumed for database access is assumed as well.
Basic PC and mouse-driven development skills, terms and concepts are also assumed.

5
Course Topics Course Name: Rational Developer for System z Foundation Training
Course Description: Learn how to use Rational Developer for System z to do z/OS traditional development, maintenance, support and for Enterprise Modernization of z/OS applications
Pre-requisites: Some experience developing Assembler applications using z/OS is expected. A working knowledge of SQL is also recommended.
Course Length: ~5days – or if done in self-paced mode, at your own pace
Topics (Agenda) Getting Started - installing and configuring RDz - and the course materials, and using Eclipse The RDz Workbench
– Code analysis tools– Editing – Compiling programs– Debugging local Assembler programs
The Data Perspective:– Working with relational data sources– Modifying test data– Editing and testing SQL statements
Working with remote system resources:– Connecting to a mainframe– Data management – Accessing and editing files
z/OS Application Development– Creating MVS Subprojects– Creating and customizing project properties
Debugging z/OS Applications– Debugging Batch Applications– Setting Debug Tool for Online Applications
Working with File Manager– Creating test data– Editing complex file-types
Working with mainframe ABENDs using Fault Analyzer– Creating Fault History views– Analyzing and solving mainframe ABENDs
Creating and modifying BMS Maps using the BMS Map Editor

6
UNIT
Topics:Topics:
The RDz WorkbenchThe RDz Workbench
Debugging z/OS Assembler Batch ApplicationsDebugging z/OS Assembler Batch Applications Debugging z/OS Assembler Online Applications Appendix

7
Topic Considerations
Note:Note: In this topic you will learn how to debug a Assembler program In this topic you will learn how to debug a Assembler program
running on a z/OS mainframe. The screen captures all describe connecting to a running on a z/OS mainframe. The screen captures all describe connecting to a public z/OS machine that IBM makes available – during classes. public z/OS machine that IBM makes available – during classes.
If you are taking this course through standard IBM services delivery you should If you are taking this course through standard IBM services delivery you should be able to use the properties (I/P address, port#s, etc.), logon IDs and passwords be able to use the properties (I/P address, port#s, etc.), logon IDs and passwords that your instructor provides you with.that your instructor provides you with.
But you may also be taking this course standalone – and in that case, you will But you may also be taking this course standalone – and in that case, you will need to speak to your company's Systems Programming staff to learn how to need to speak to your company's Systems Programming staff to learn how to connect and logon.connect and logon.
It goes without saying that the actual file names in the screen captures of It goes without saying that the actual file names in the screen captures of mainframe libraries and datasets will vary. So you should focus on the process mainframe libraries and datasets will vary. So you should focus on the process and steps and "how to" – and don't be perplexed at differences in screen and steps and "how to" – and don't be perplexed at differences in screen captures.captures.
You also may be using your company's own Source Control Management system You also may be using your company's own Source Control Management system – to do things like builds, compiles, etc. In that case much of the remote – to do things like builds, compiles, etc. In that case much of the remote functionality in RDz will be customized and tailored to your company's unique and functionality in RDz will be customized and tailored to your company's unique and idiosyncratic procedures and protocols.idiosyncratic procedures and protocols.

8
Workshop Considerations
Note:Note: Unfortunately, due to the fact that you will need an I/P address that resolves to your
workstation in order to use IBM Debug Tool, there is no way that you can use the Sandbox or zServerOS for workshops that reflect the content in this unit.
Your options for additional learning include:Return to the RDz Workbench Introduction unit – and carefully go over all the Debug option materials in the slides. Note that the workbench interface/perspective and > 95% of the functionality of Remote Debug is also contained in Local Debug.
Along with this course you can watch the following Camtasias on RDz Debugging:: http://websphere.dfw.ibm.com/atdemo/atdemo_rdz_zosad_recorded.html
RDz and Debugging
RDz and Remote Development (including Debugging)
1.
2.

9
Topic ObjectivesAfter completing this unit, you should be able to:Describe the concept of source code debugging
List the run-times that Debug Tool supports List the steps in preparing a program for debugging Debug a mainframe batch job
– Describe the run/step/animate options– List PF-Keys associated with them– Set/unset/inspect conditional and unconditional break-points– Set "watch" break-points that halt execution when a value in a variable changes– Show how to access the LPEX editor functionality during debugging (such as Perform
Hierarchy)– Be able to Jump to any given line, and run to a line– Show how to change variable values dynamically during debug– Show how to set different levels of variable display– Monitor specific variables you are interested in
Debug a CICS online transaction– Discuss the Debug Option setup and configuration requirements for Online Debugging
– DTCN Profile/View– DTCN Transaction
– Launch a CICS transaction that invokes Debug Tool

10
Debugging Overview
Face facts: No one gets No one gets it it right the first time. right the first time. Not at the level of
production business logic
That's why IBM invented source-level application debuggers, so that you can:
View program execution, line-by-line Verify the value of a variable – during program execution Stop and start program execution, and analyze results at the
speed that our procedural understanding of the application's execution flow can handle

11
Enter Source-Level Debuggers Specifically: IBM Debug Tool/PD Tools FamilyIBM Debug Tool/PD Tools Family
Green-screen (TSO-based) or RDz/Workstation-basedor RDz/Workstation-based interface to z/OS-based debugging engines
Debug: Online (CICS, or IMS TM) Batch Multiple languages (Assembler, PL/I, COBOL, Java, etc.)
Seamless debugging of mixed-language/cross-platform applications
Interactive, source-level debugging in RDz with program running on z/OS
Display, monitor and alter program variables
Set standard types of breakpoints
View data in Hex (EBCDIC) or string values
Multiple configurable views
Ability to make adjustments to the program while debugging
Debug Tool product web-site: http://www-01.ibm.com/software/awdtools/debugtool/

12
Debug Tool - Application EnvironmentsOne debugging engine, with support for many environments:
z/OSz/OS
3270 3270 or GUIor GUI
3270or GUI
Debug Tool
BatchApplication
Batch region
Debug Tool
Transaction
CICSApplication
CICS region
Debug Tool
Transaction
IMSApplication
IMS/TM region
Debug Tool
DB2 Stored Procedure
WLM region
Batch
Debug Tool
PosixApplication
3270or GUI
3270or GUI
3270or GUI
CICS IMS/TMDB2
stored procedure
UNIX systems services

13
z/OSz/OS
RDz Interfacing with Debug Tool
The RDz remote debugger Client software that is installed with RDz on your workstation Communicates with the Debug Tool engine on the mainframe
Note that Debug Tool must be installed on z/OS in order for you to do the labs in this unit
Debug ToolTCP/IP
Debug ToolDebug Tool
EngineEngine
Debug ToolDebug Tool
EngineEngine
DataDataSourceSource
YourYour
ApplicationApplication
Load ModuleLoad Module
YourYour
ApplicationApplication
Load ModuleLoad Module

14
Steps for BatchBatch Application Debug Session
1. Ensure that your compile proc has the necessary TEST parameter, and Compile/Link options and DD cards to create a debug-ready load module
2. Discover workstation TCP/IP parameters: IP Address
Listener port#
3. Enter TCP/IP address of workstation in run JCL for Debug Tool DD statement, and Submit the JCL
4. Load the Assembler source code
5. Debug the application

15
Compile JCL Requirements for Using Debug Tool for AssemblerCompile JCL Requirements for Using Debug Tool for Assembler
To debug Assembler programs, you will need additional datasets and steps:
SYSADATA
EQALANGXStep creates Debug symbolics
See the Debug Tool v11 Users GuideDebug Tool v11 Users Guide – Chapter 6 Preparing an Assembler program – for more information on these datasets.
Sample Assembler JCL is in the slide notes
16
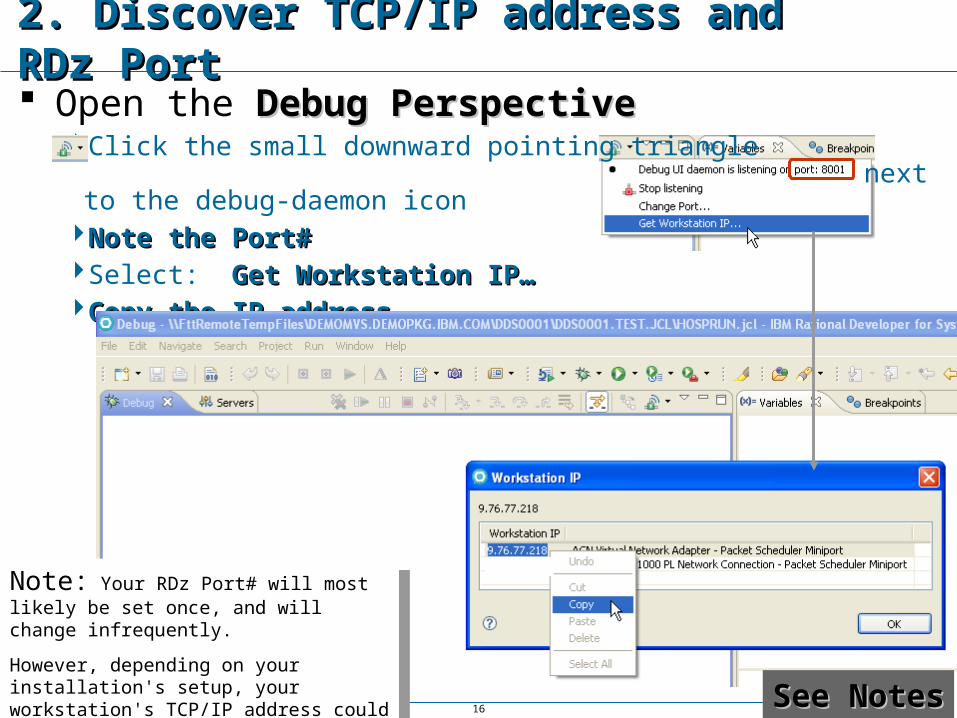
2. Discover TCP/IP address and RDz Port2. Discover TCP/IP address and RDz Port Open the Debug PerspectiveDebug Perspective
Click the small downward pointing triangle next to the debug-daemon icon
Note the Port#Note the Port#Select: Get Workstation IP…Get Workstation IP…Copy the IP addressCopy the IP address
Note: Your RDz Port# will most likely be set once, and will change infrequently.
However, depending on your installation's setup, your workstation's TCP/IP address could change - often
Note: Your RDz Port# will most likely be set once, and will change infrequently.
However, depending on your installation's setup, your workstation's TCP/IP address could change - often See NotesSee Notes

17
3. Submit the JCL for Assembler Debugging3. Submit the JCL for Assembler Debugging Configure your application to start Debug Tool by including a specific DD card in the run JCL – that
includes your workstation's current Port# and TCP/IP address This is an example of JCL to run a batch job The EQANMDBG DD statement is the easiest way to start the Debug Tool for batch applications
Sample JCLSample JCLIn Slide NotesIn Slide Notes
Sample JCLSample JCLIn Slide NotesIn Slide Notes
//EQANMDBG EQANMDBG DDDD * *PGM TEST(,,,TCPIP&PGM TEST(,,,TCPIP&5.76.97.2365.76.97.236%%80038003:) :)
//EQANMDBG EQANMDBG DDDD * *PGM TEST(,,,TCPIP&PGM TEST(,,,TCPIP&5.76.97.2365.76.97.236%%80038003:) :)

18
3a. Debug Tool - Prompts3a. Debug Tool - Prompts Debug Tool will
interface with RDz and throw the Confirm Perspective Switch prompt
Click Yes
Additionally, if if your mainframe source code is out sync with the Load Module you'll get an informational prompt.
This typically means you need to check your compile listings for syntax errors that caused the link edit step not to execute because of condition codes
19
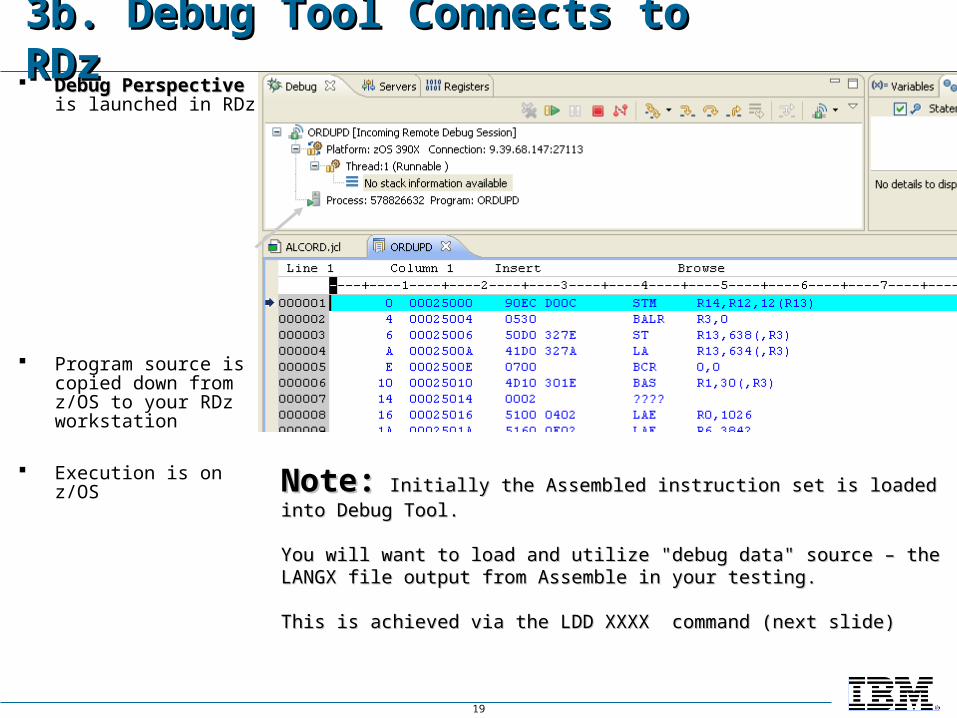
3b. Debug Tool Connects to RDz3b. Debug Tool Connects to RDz Debug PerspectiveDebug Perspective is
launched in RDz
Program source is copied down from z/OS to your RDz workstation
Execution is on z/OS
Note:Note: Initially the Assembled instruction set is loaded into Debug Initially the Assembled instruction set is loaded into Debug Tool. Tool.
You will want to load and utilize "debug data" source – the LANGX file You will want to load and utilize "debug data" source – the LANGX file output from Assemble in your testing. output from Assemble in your testing.
This is achieved via the LDD XXXX command (next slide)This is achieved via the LDD XXXX command (next slide)
20
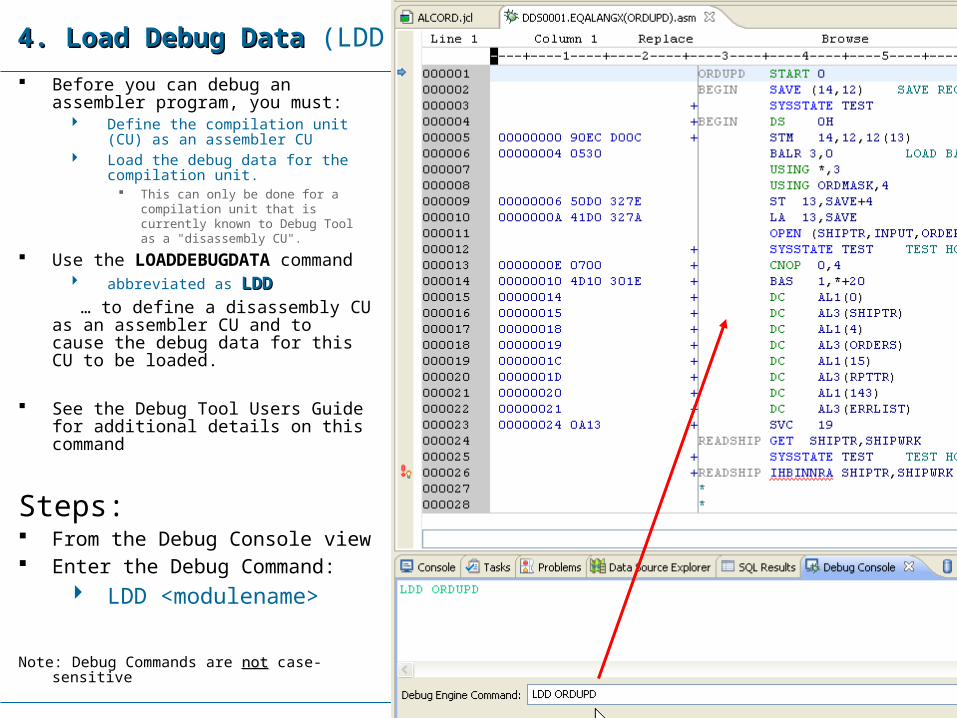
4. Load Debug Data 4. Load Debug Data (LDD Command)
Before you can debug an assembler program, you must:
Define the compilation unit (CU) as an assembler CU
Load the debug data for the compilation unit.
This can only be done for a compilation unit that is currently known to Debug Tool as a "disassembly CU".
Use the LOADDEBUGDATA command
abbreviated as LDDLDD
… to define a disassembly CU as an assembler CU and to cause the debug data for this CU to be loaded.
See the Debug Tool Users Guide for additional details on this command
Steps: From the Debug Console view Enter the Debug Command:
LDD <modulename>
Note: Debug Commands are notnot case-sensitive

21
5. The Debug Perspective and Views 5. The Debug Perspective and Views
Your code
BreakpointsMonitors and
Registers views
The Debug Icons
Assembler Macro
Expansions
Hovering over a variable returns the
variable value
Current Instruction Pointer
Load Module Disassembled Offset Object Code

22
Debug and RDz's LPEX Editor FunctionalityDebug and RDz's LPEX Editor Functionality
All of the LPEX editing features work under Debug Tool All of the LPEX editing features work under Debug Tool
Command Line
Pre
fix
Are
a

23
Action Icons – Review Action Icons – Review
Resume: Run the program to the next breakpoint or to the end
Resume: Run the program to the next breakpoint or to the end
Terminate: End the program
Terminate: End the program
Step: run one statement
Step: run one statement
Step Over: run one statement, but step over a CALL
Step Over: run one statement, but step over a CALL
Step Return: run until return from subprogram
Step Return: run until return from subprogram
Disconnect: from the debug engine
Disconnect: from the debug engine
Animated Step Continuous source-level debugging without user interaction
Animated Step Continuous source-level debugging without user interaction
Debug ListenerDebug Listener(Should be green)(Should be green)
24
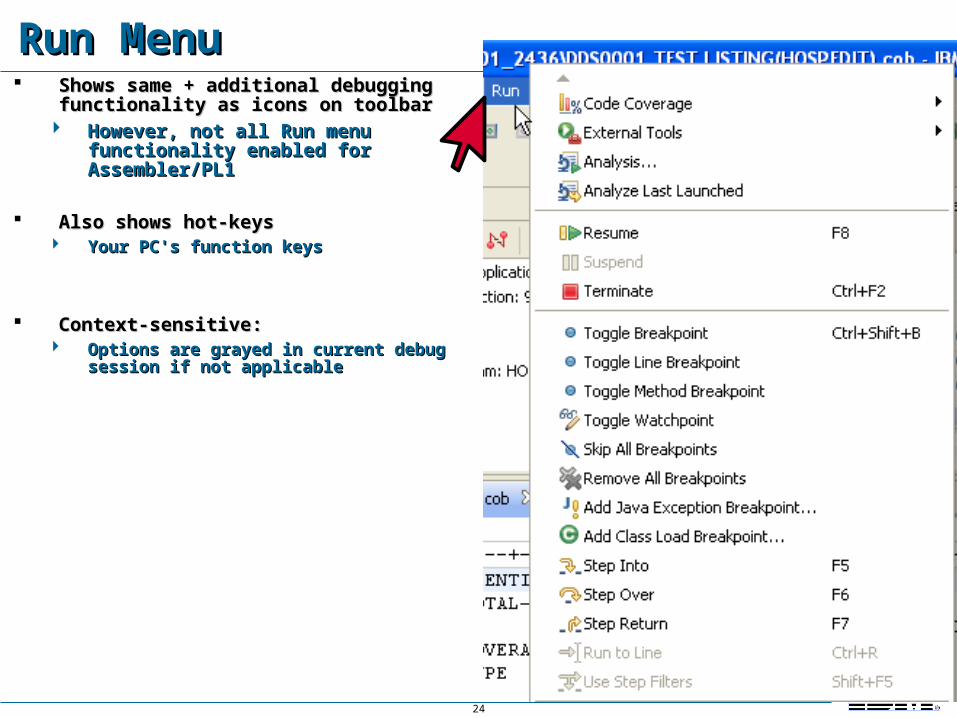
Run MenuRun Menu Shows same + additional debugging Shows same + additional debugging
functionality as icons on toolbarfunctionality as icons on toolbar However, not all Run menu functionality However, not all Run menu functionality
enabled for Assembler/PL1enabled for Assembler/PL1
Also shows hot-keys Also shows hot-keys Your PC's function keysYour PC's function keys
Context-sensitive:Context-sensitive: Options are grayed in current debug session Options are grayed in current debug session
if not applicableif not applicable

25
Displaying/Manipulating the RegistersDisplaying/Manipulating the RegistersEnable from: Window > Show View > Registers
Opens the RegistersRegisters view to a scrollable, editable register list with access to the following:

26
Statement Breakpoints – Review Statement Breakpoints – Review
A statement breakpoint will stop the program when it reaches a statement: It stops before the statement runs
A breakpoint can optionally be made conditional A simple condition may be specified such as:
VAR1 > 999VAR1 > 999 …or…
VAR2 = 'ABC'VAR2 = 'ABC'
A breakpoint can be based on a frequency:
Stop the Nth time a statement runs

27
Set a Statement Breakpoint – Review Set a Statement Breakpoint – Review
Set a statement breakpoint by double-clicking in the gray area next to a statement
Set a statement breakpoint by double-clicking in the gray area next to a statement
dblclick

28
Set/Edit Conditional Statement BreakpointsSet/Edit Conditional Statement Breakpoints
A breakpoint can trigger the Nth time the statement runs…
A breakpoint can trigger the Nth time the statement runs…
… and breakpoints can be conditional.
… and breakpoints can be conditional.
Select the Breakpoint. Right-click and select: Edit Breakpoint…
Select the Breakpoint. Right-click and select: Edit Breakpoint…
Can set to different statement/lineOr click Next >Next > to specify conditional breakpoint logic
Can set to different statement/lineOr click Next >Next > to specify conditional breakpoint logic
RECORDS = 9RECORDS = 9

29
Watch Monitor BreakpointsWatch Monitor Breakpoints Can have breakpoints occur
conditionally, when: The value in a field changes Some portion (# of bytes) of a field
changes A simple condition tests true for the
value in the field
Steps: Select a variable Right-click, and select: Add Watch
Breakpoint… Select Number of bytes to watch –
or add a simple condition Specify Auto to test for all bytes

30
Run (F8) to a Statement BreakpointRun (F8) to a Statement Breakpoint
A breakpoint icon is shown…and the breakpoint is also shown in the Breakpoints view.
A breakpoint icon is shown…and the breakpoint is also shown in the Breakpoints view.
click
Resume Resume
See Slide Notes

31
Breakpoint Options – 1 of 2Breakpoint Options – 1 of 2
The program ran to the breakpoint
The program ran to the breakpoint
… or by deleting it from the Breakpoints view from the Context Menu
… or by deleting it from the Breakpoints view from the Context Menu
You can remove the breakpoint by double clicking again here…
You can remove the breakpoint by double clicking again here…
Disable (but do not Remove) Breakpoints by un-checking a box
Disable (but do not Remove) Breakpoints by un-checking a box

32
Breakpoint Options – 2 of 2Breakpoint Options – 2 of 2Disable (but do not Remove) Breakpoints by un-checking a box
Disable (but do not Remove) Breakpoints by un-checking a box
By Editing a Breakpoint… you can make the Breakpoint conditional (prior topic)
By Editing a Breakpoint… you can make the Breakpoint conditional (prior topic)

33
Entry Breakpoint OptionsEntry Breakpoint OptionsYou can set an “Entry Breakpoint” – which would allow you to Resume (run) your module until the Called program is launched by z/OS
You can set an “Entry Breakpoint” – which would allow you to Resume (run) your module until the Called program is launched by z/OS
From Modules
Right-click the module and Set an Entry breakpoint
From Modules
Right-click the module and Set an Entry breakpoint
Resume to the Called module Resume to the Called module
Note that you will need to load the Debug Descriptor (LDD) for the subroutine(s)
Note that you will need to load the Debug Descriptor (LDD) for the subroutine(s)

34
Monitoring Variable ValuesMonitoring Variable ValuesBesides hovering over a variable, you can:
1. Double-click and select any variable
2. Right-click and monitor the variable value throughout your debug session
Besides hovering over a variable, you can:
1. Double-click and select any variable
2. Right-click and monitor the variable value throughout your debug session
The Monitors view shows the variable's value The Monitors view shows the variable's value

35
Monitors View – OptionsMonitors View – Options
Monitored variable value – in EBCDIC internal display very useful for debugging data exceptions
Monitored variable value – in EBCDIC internal display very useful for debugging data exceptions
Change Value… allows you to modify the variable's value on the fly – during debug
Change Value… allows you to modify the variable's value on the fly – during debug
36
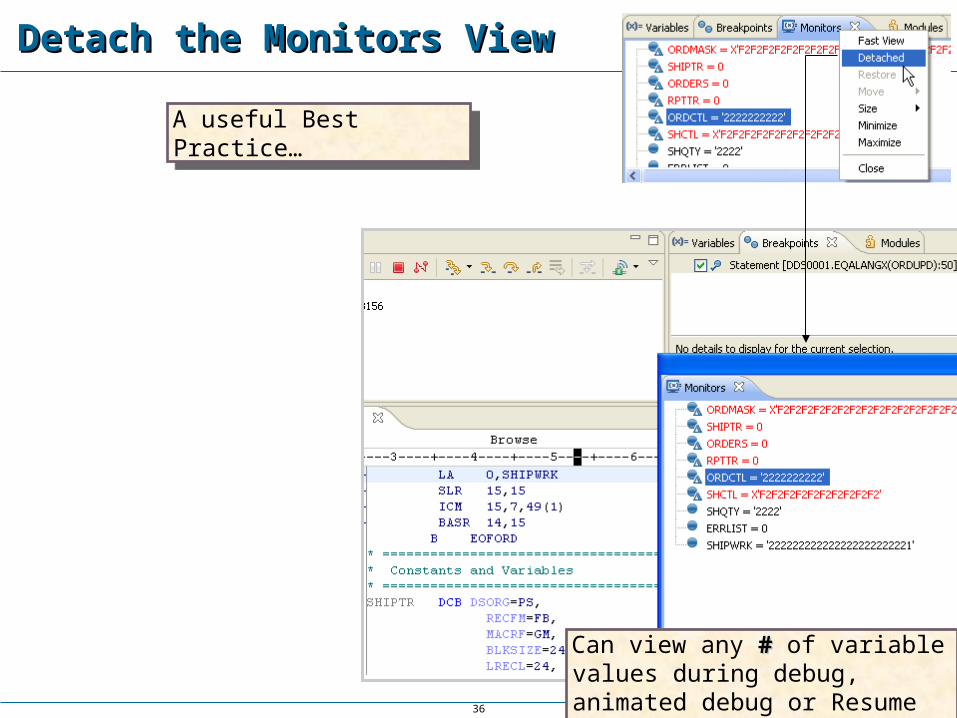
Detach the Monitors ViewDetach the Monitors View
A useful Best Practice…A useful Best Practice…
Can view any ## of variable values during debug, animated debug or Resume to breakpoints
Can view any ## of variable values during debug, animated debug or Resume to breakpoints

37
Making Optimal use of Screen Real EstateMaking Optimal use of Screen Real Estate Some of the Debug Perspective views are not enabled for Assembler
programs: Variables, Outline, etc.
Along with detaching views, consider moving the useful Assembler views "front-and-center" to maximize your screen real estate – adding to your ability to see as much useful information at a glance
Monitors viewMonitors view
Registers viewRegisters view Breakpoints viewBreakpoints view
38
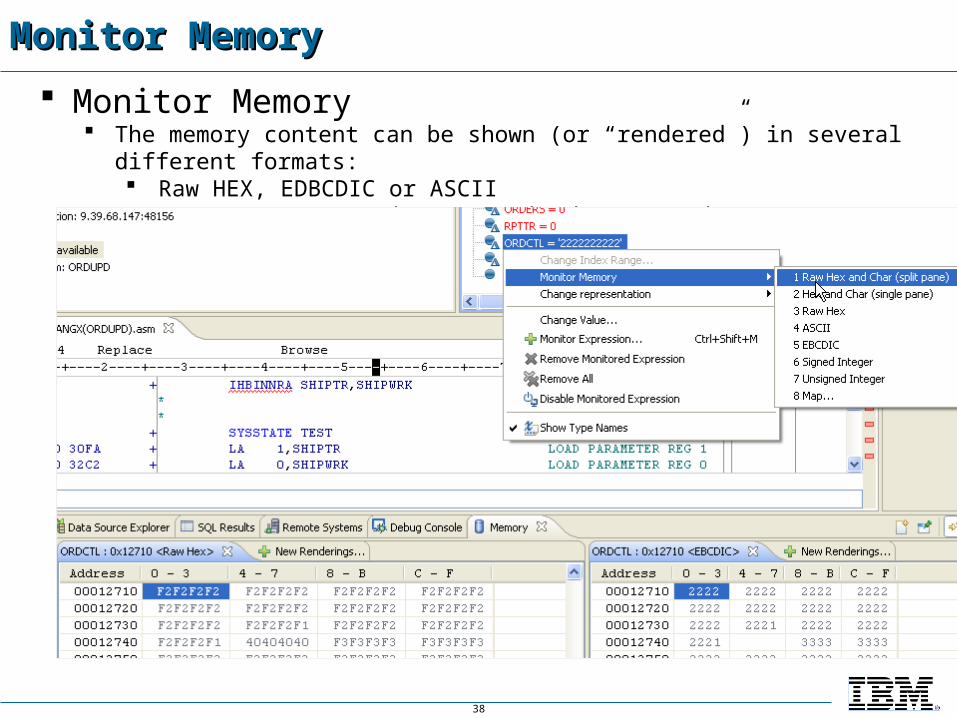
Monitor MemoryMonitor Memory
Monitor Memory The memory content can be shown (or “rendered”) in several different formats:
Raw HEX, EDBCDIC or ASCII Tree structure using customized XML mappings.
39
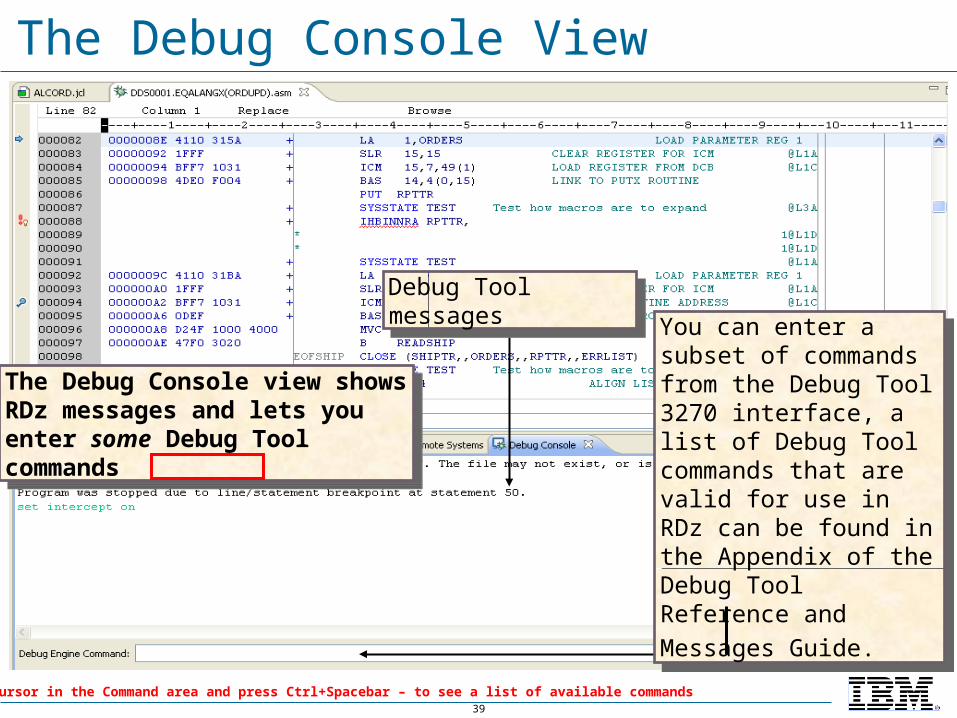
The Debug Console View
Debug Tool messagesDebug Tool messages
You can enter a subset of commands from the Debug Tool 3270 interface, a list of Debug Tool commands that are valid for use in RDz can be found in the Appendix of the Debug Tool Reference and Messages
Guide.
You can enter a subset of commands from the Debug Tool 3270 interface, a list of Debug Tool commands that are valid for use in RDz can be found in the Appendix of the Debug Tool Reference and Messages
Guide.
The Debug Console view shows RDz messages and lets you enter some Debug Tool commands
The Debug Console view shows RDz messages and lets you enter some Debug Tool commands
Place your cursor in the Command area and press Ctrl+Spacebar – to see a list of available commands
40
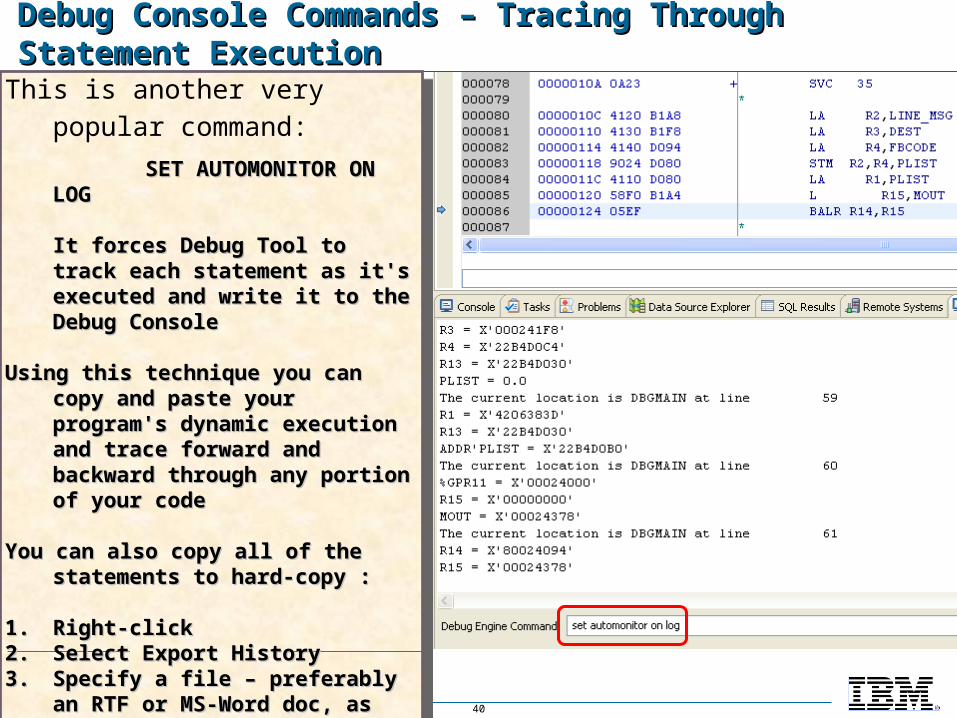
Debug Console Commands – Tracing Through Statement ExecutionDebug Console Commands – Tracing Through Statement Execution
This is another very popular
command: SET AUTOMONITOR ON LOGSET AUTOMONITOR ON LOG
It forces Debug Tool to track each It forces Debug Tool to track each statement as it's executed and write statement as it's executed and write it to the Debug Consoleit to the Debug Console
Using this technique you can copy and Using this technique you can copy and paste your program's dynamic paste your program's dynamic execution and trace forward and execution and trace forward and backward through any portion of backward through any portion of your codeyour code
You can also copy all of the statements You can also copy all of the statements to hard-copy :to hard-copy :
1.1. Right-clickRight-click2.2. Select Export HistorySelect Export History3.3. Specify a file – preferably an RTF or Specify a file – preferably an RTF or
MS-Word doc, as formatting will be MS-Word doc, as formatting will be retainedretained
41
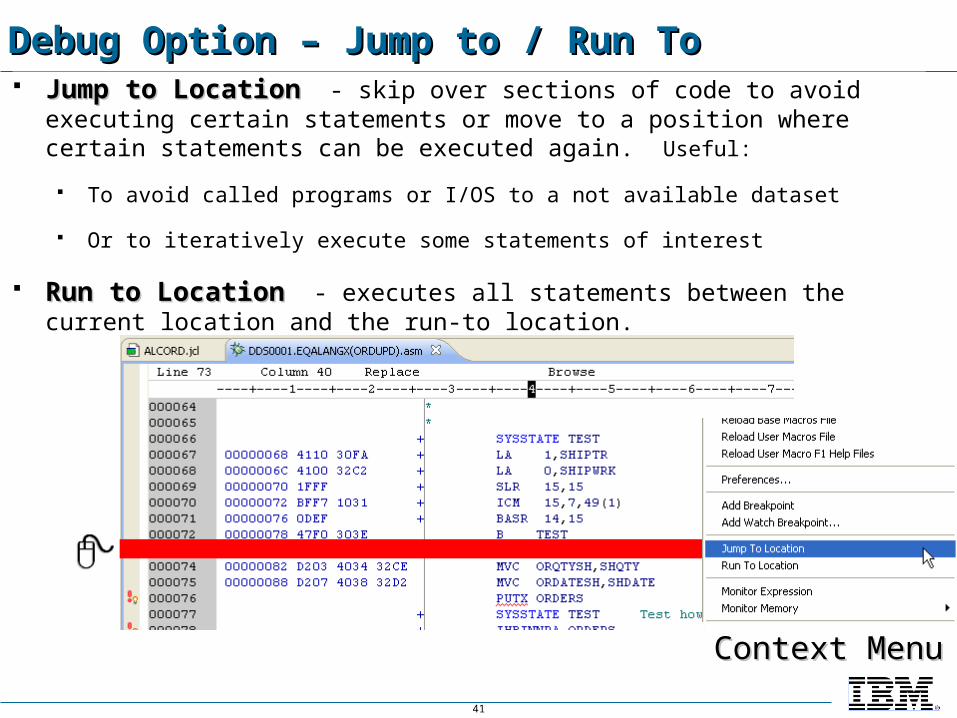
Debug Option – Jump to / Run ToDebug Option – Jump to / Run To Jump to LocationJump to Location - skip over sections of code to avoid executing certain
statements or move to a position where certain statements can be executed again. Useful:
To avoid called programs or I/OS to a not available dataset
Or to iteratively execute some statements of interest
Run to LocationRun to Location - executes all statements between the current location and the run-to location.
Context MenuContext Menu

42
How to return from anywhere in your program to the Current Instruction
To get back to the Current Instruction Pointer (the "next sequential instruction") – if you've navigated away within the source:Click the small blue rectangle in the right-hand margin of your
source code
43
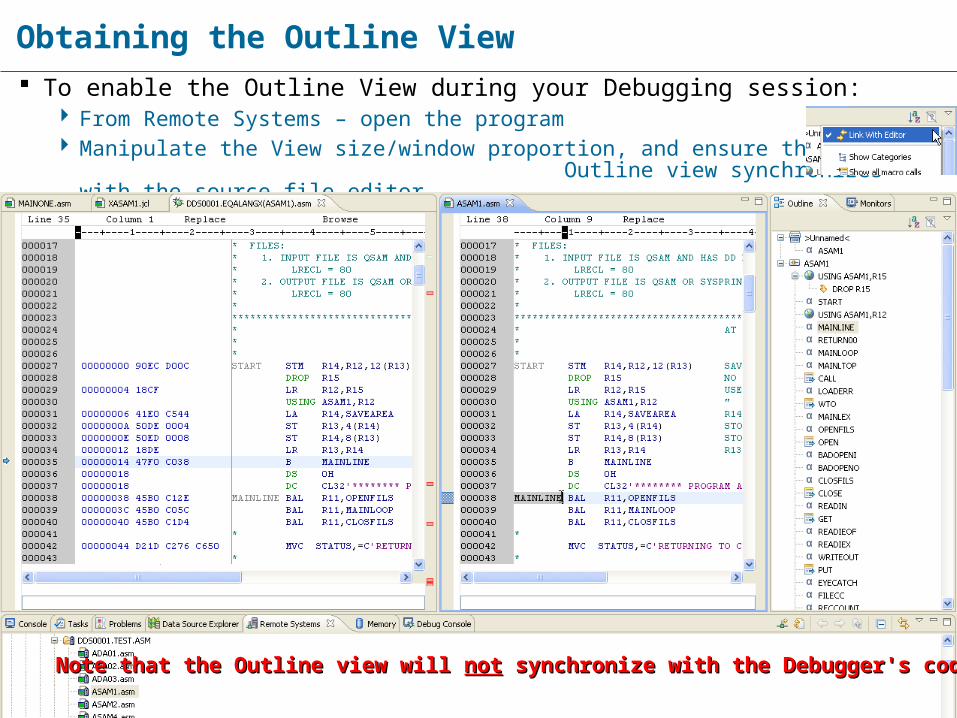
Obtaining the Outline View To enable the Outline View during your Debugging session:
From Remote Systems – open the program Manipulate the View size/window proportion, and ensure that the
Outline view synchronizes with the source file editor
Note that the Outline view will Note that the Outline view will notnot synchronize with the Debugger's code view synchronize with the Debugger's code view

44
Handling program abends Debug Tool can receive control back from the system after an
abend occurs The program will be stopped at the abending statement
You can: Allow the application to abend and terminate
Capture abend info with a product such as Fault Analyzer Terminate the application and prevent further processing
Or continue running the program
Usage note: The LE TRAP(ON)LE TRAP(ON) option must be active

45
Terminating the application There are several options for terminating your application:
Remain in the debugger, and RESUME until the program runs to completion The program will terminate normally or with an abend The return code is controlled by the program
Disconnect the debugger, and allow the program to run to completion The program will terminate normally or with an abend The return code is controlled by the program

46
Termination action buttonsYou can immediately terminate the
application using action buttons
You can immediately terminate the application using action buttons
Terminate: Immediate termination of the application. No more program statements run. RC=0 is returned to the environment.
Terminate: Immediate termination of the application. No more program statements run. RC=0 is returned to the environment.
Disconnect: Disconnect Debug Tool from the application. The program continues to run from the current location without the debugger. And subsequent batch job steps can finish as well.
Disconnect: Disconnect Debug Tool from the application. The program continues to run from the current location without the debugger. And subsequent batch job steps can finish as well.

47
Force an immediate termination with abend
rightclick
11
2233
Right click in the Debug view
Right click in the Debug view
OptionsOptionsTerminate and abend
Terminate and abend

48
Restart Your Debugging SessionRestart Your Debugging Session
For batch debugging If your submitted JCL is still
in the code (Content) area No need to return to the z/OS
Projects perspective
Right-clickRight-click Select: Submit Submit
Note that F11 (or Debug from the Note that F11 (or Debug from the Run menu) does Run menu) does NOTNOT work – as it work – as it did with Local Assembler debuggingdid with Local Assembler debugging
49
SummaryHaving completed this unit, you should now be able to:
Describe where the debug engines are located Show how to set the workbench preferences for running
and debugging Show how to invoke the debugger for local programs Describe the views of the Debug perspective Demonstrate how to set breakpoints in Assembler code Explain how to set up the Assembler compile options for
remote debugging Show how to debug a remote batch Assembler program
®
IBM Software Group
© 2012 IBM CorporationSeptember, 2012September, 2012
Batch Assembler Debugging WorkshopBatch Assembler Debugging Workshop

51
Pre-Workshop Overview You will use Debug Tool to test the ASAM1 and
ASAM2 batch Assembler programs Steps:
Allocate data setsModify the JCL for the compile and run stream JCLFind your workstations:
I/P Address Port#
Substitute those variables into the run steam JCLDebugTest out various Debug Tool options
At any point, you can terminate your debug session by clicking the Red icon or pressing Ctrl+2
You can submit the JCL again – Debug (again)
52
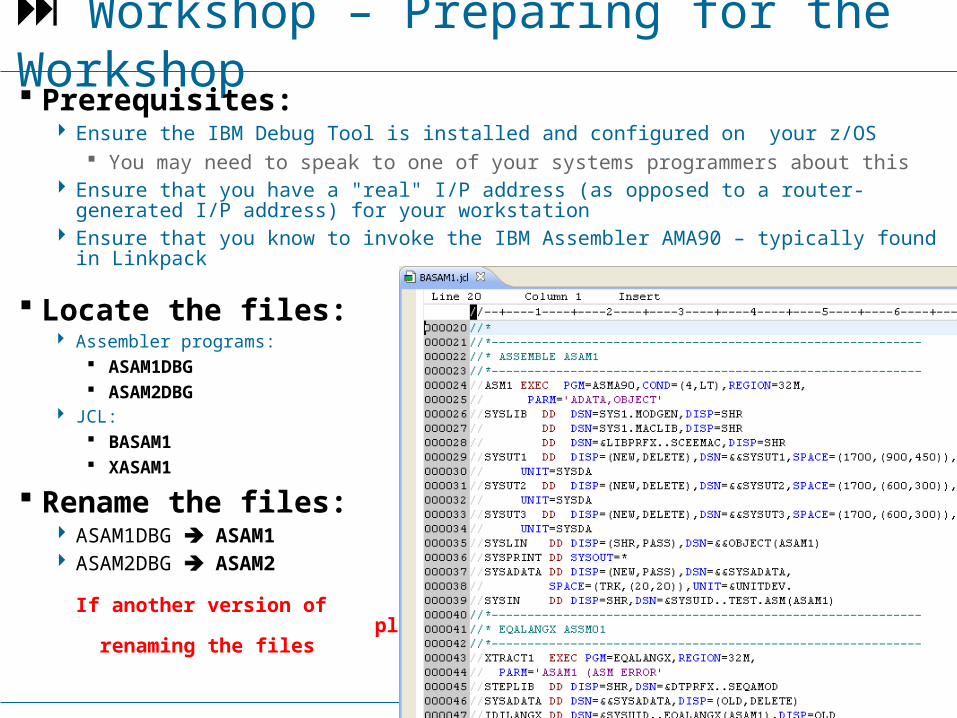
Workshop – Preparing for the Workshop Prerequisites:
Ensure the IBM Debug Tool is installed and configured on your z/OS You may need to speak to one of your systems programmers about this
Ensure that you have a "real" I/P address (as opposed to a router-generated I/P address) for your workstation
Ensure that you know to invoke the IBM Assembler AMA90 – typically found in Linkpack
Locate the files: Assembler programs:
ASAM1DBG ASAM2DBG
JCL: BASAM1 XASAM1
Rename the files: ASAM1DBG ASAM1 ASAM2DBG ASAM2
If another version of ASAM1 and ASAM2 exist, please delete them before renaming the files

53
You will need the following development and debugging libraries: <HLQ>.xxx.ASM – example: DDS0001.TEST.ASM <HLQ>.xxx.COPYLIB – example: DDS0001.TEST.COPYLIB <HLQ>.xxx.LISTING – example: DDS0001.TEST.LISTING <HLQ>.xxx.LOAD – example: DDS0001.TEST.LOAD <HLQ>.xxx.EQALANGX – example: DDS0001.TEST.EQALANGX
If you don't already have these libraries, allocate them, using Specify characteristics by usage typeusage type:
Workshop – Allocate Data Sets
54
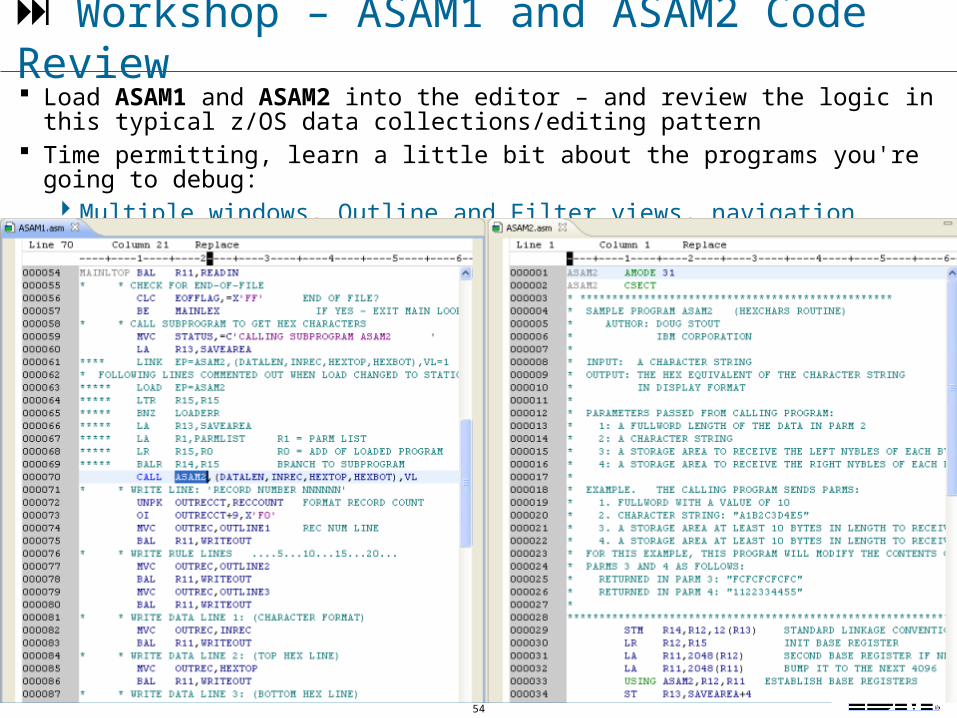
Workshop – ASAM1 and ASAM2 Code Review Load ASAM1 and ASAM2 into the editor – and review the logic in this typical z/OS
data collections/editing pattern Time permitting, learn a little bit about the programs you're going to debug:
Multiple windows, Outline and Filter views, navigation techniques, etc.

55
Assemble ASAM1 and ASAM2
Steps (in BASAM1.jcl): In all fourfour job steps, modify the library
names for: Assembler compiler library Your personal datasets
Submit the JCL Go to the JES queue and check the
return codes for each step
Optionally, expand your load library and ensure that there are members for ASAM1 and ASAM2
Note – this step requires you to have allocated the datasets referenced in the JCL (see prior slide)
Don't forget the 2nd LKED step

56
Switch to the Debug perspective
Click on the downward pointing triangle to the right of the little green listener tool, and:Note the Port#Select and copy the I/P address
Ensure that green listener tool is – in fact – green, and not red. If it's red (not listening) click it once to change it to green
Workshop – Obtain your I/P Address and Port#
This is the I/P address you want!
57
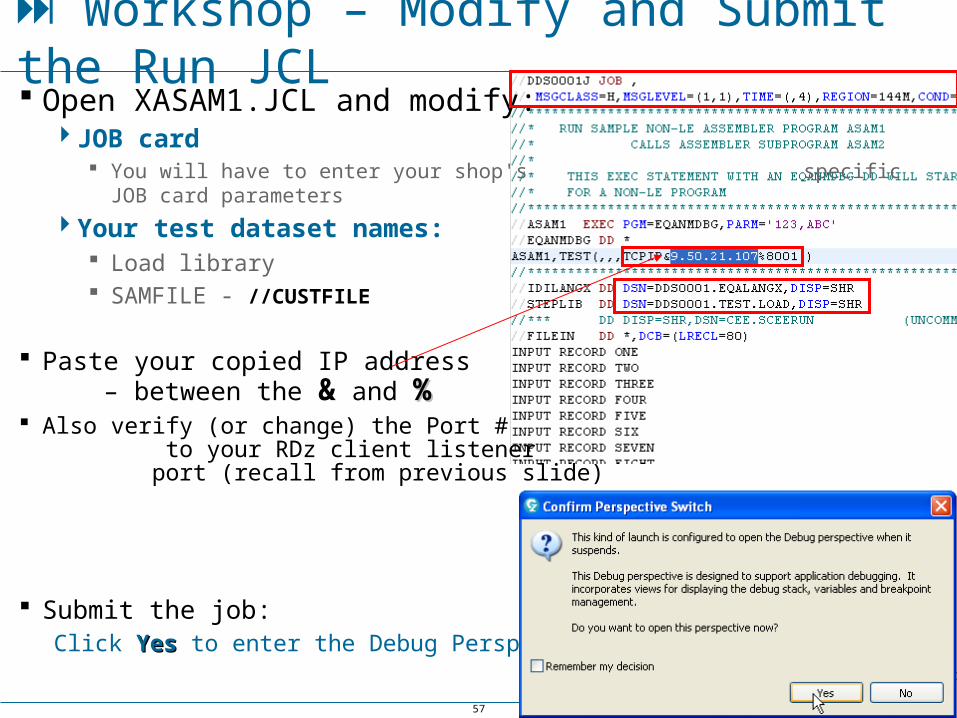
Open XASAM1.JCL and modify:JOB card
You will have to enter your shop's specific JOB card parameters
Your test dataset names: Load library SAMFILE - //CUSTFILE
Paste your copied IP address – between the & and %%
Also verify (or change) the Port # to your RDz client listener port (recall from previous slide)
Submit the job:Click YesYes to enter the Debug Perspective
Workshop – Modify and Submit the Run JCL

58
Begin using the Debug Tool functions that you learned about in this section: Start by loading the
Assembler source code for both modules – From the Debug Console, type: LDD ASAM1 LDD ASAM2
Press F5 – or click Step Into a few times –
Hover over a few variables INREC DATALEN
Try some find commands – in the ISPF command line area of ASAM1.asm
From the Context menu, Filter ASAM1
Press F2 – then close the split screen
Basic Debug Techniques
LDD ASAM1
Top ; f closfils last

59
Select the RegistersRegisters view Step through the program – as the various Assembler statements update
the register contents note the changes
Right-click and Monitor one or more of the Registers
Workshop – Debug Techniques – Working with Registers

60
Check the MonitorsMonitors view
Experiment with: Change representation Change Value… Show Type Names Remove
Try Detaching the Monitors view – or moving it to a different area within the Debug perspective
Also experiment with: Monitor Memory
Workshop – Debug Techniques – Monitors

61
Set and use breakpointsSet and use breakpoints From the Modules view – drill down to ASAM2 and
Set an entry breakpoint Click Resume (F8) to the breakpoint Press F5 (or click Step Into) a few times Press F7 – to return to ASAM1
Resume (F8) to the entry breakpoint again (you'll stop inside of ASAM2) From inside of ASAM2 – Resume or press F8 … what happened? Press F7 – to return to line-by-line debugging of ASAM1 From the Breakpoints view – un-check (disable) the
Entry breakpoint Add a few other breakpoints by either double-clicking in the prefix area – or Right-
clicking over the statement and select Add Breakpoint Resume (F8) to the breakpoints while they are enabled Remove or Disable the breakpoints Right-click over INREC and select: Add Watch Breakpoint Resume (F8) -
Did the program stop? Where? What's in the Debug Console view?
Workshop – Debug Techniques – Breakpoints

62
Tracing execution flowTracing execution flow From the Debug Console, type: set automonitor on log Continue to step – or use: What happens in the Console?
At any point, Right-click inside of the Debug Console content and select Export History
Open the exported messages with Wordpad
(not Notepad)
Workshop – Automonitor on Log
63
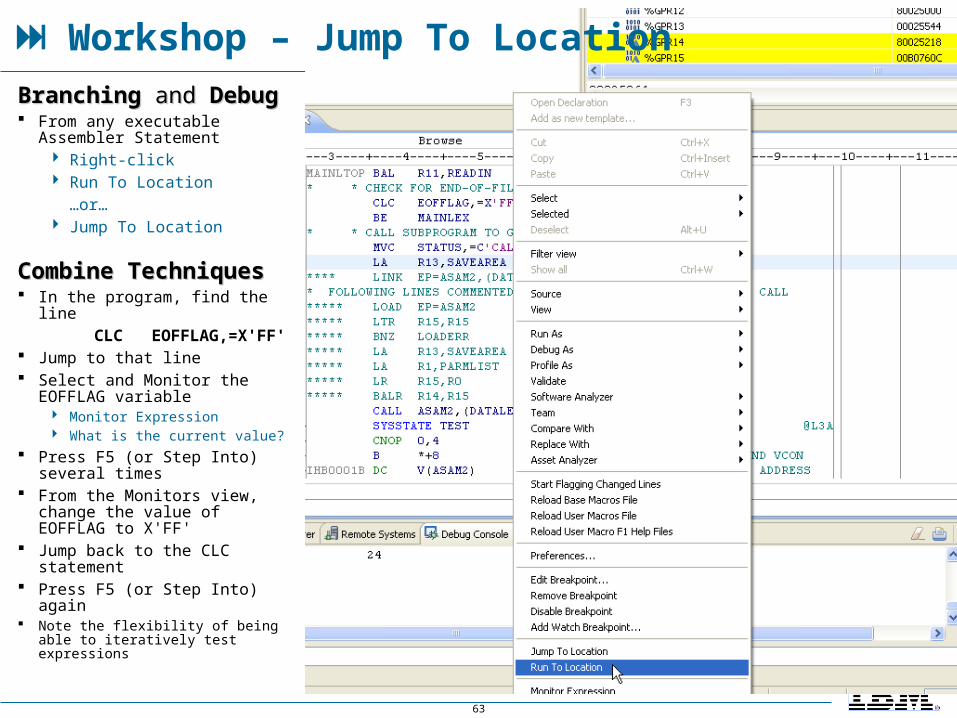
Branching Branching andand Debug Debug From any executable
Assembler Statement Right-click Run To Location
…or… Jump To Location
Combine TechniquesCombine Techniques In the program, find the line
CLC EOFFLAG,=X'FF' Jump to that line Select and Monitor the
EOFFLAG variable Monitor Expression What is the current value?
Press F5 (or Step Into) several times
From the Monitors view, change the value of EOFFLAG to X'FF'
Jump back to the CLC statement
Press F5 (or Step Into) again Note the flexibility of being able to
iteratively test expressions
Workshop – Jump To Location

64
Terminate your debug session
Time permitting – submit the JCL again, and try:
Set conditional breakpointsUnset/Remove breakpoints
Single Remove All
Submit the JCL again, try:Run to Location
How does this differ from Jump to Location?
Workshop – Experiment !

65
UNIT
Topics:Topics:
The RDz WorkbenchThe RDz Workbench
Debugging z/OS Assembler Batch Applications Debugging z/OS Assembler Online ApplicationsDebugging z/OS Assembler Online Applications Appendix

66
Topic ObjectivesAfter completing this unit, you should be able to:Using the Problem Determination Tools, Debug Option and RDz:Debug a mainframe online transaction
Describe the online transaction features for configuring your 3270 sessions with Debug Option
Debug a CICS 3270 Application

67
Online Debugging Overview Guess what?
No one gets No one gets it it right the first time right the first time coding coding online online programs programs either either
Lucky for you: Debug tool handles:
CICS 3270 online transactions IMS TM online transactions
Without any different debugging techniques The only difference from batch is the debug setup procedure for the online
environment

68
Steps for OnlineOnline (CICS) Application Debug Session
1. Ensure that your compile proc has the necessary TEST parameter, and Compile/Link to create load module – and that your CICS application is setup for Debug Option testing
2. Discover workstation TCP/IP parameters:
IP Address
Listener port#
3. Access and login to your CICS region – Green Screen
4. Use the DTCN view, or execute the DTCN transaction and specify: Terminal ID
Transaction code and programs – to put under Debug control
User-ID
TCP/IP parameters: IP Address Port#
Save the DTCN transaction specification
5. Debug your CICS application

69
1. Compile JCL Requirements for Using Debug Tool1. Compile JCL Requirements for Using Debug Tool Use the TESTTEST compiler option to prepare your
executable Assembler program for use with the debugger.
The TEST option is required for remote debugging. It produces symbol and statement information that enables the debugger to perform symbolic source-level debugging
Enterprise Assembler 3.4: TEST(NONE,SYM,SEP) Enterprise Assembler V4.1 +:
TEST(NOHOOK,SEP,EJPD)
Include the DD card for your SYSDEBUG dataset in the Assembler Compile step In traditional compile JCL – this would be in the
IGYCTRL step
If you are not using the IBM/RDz compile PROCs for building your applications, be sure to override the compiler option and add TEST - as shown

70
2. Discover TCP/IP address and RDz Port - Review2. Discover TCP/IP address and RDz Port - Review
Open the Debug PerspectiveClick the small downward pointing triangle
next to the debug-daemon iconNote the Port#Note the Port#Select: Get Workstation IP…Get Workstation IP…Copy the IP addressCopy the IP addressEither paste the IP address into Notepad, or write it downEither paste the IP address into Notepad, or write it down
Note: Your RDz Port# will most likely be set once, and will change infrequently.
However, depending on your installation's setup, your workstation's TCP/IP address could change - often
Note: Your RDz Port# will most likely be set once, and will change infrequently.
However, depending on your installation's setup, your workstation's TCP/IP address could change - often
71
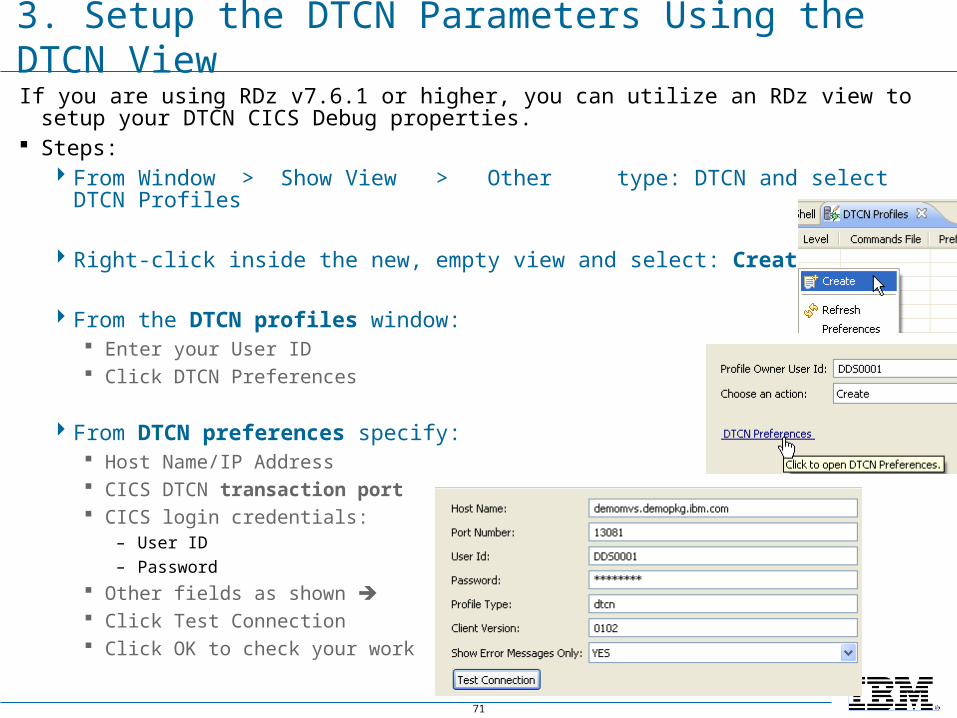
3. Setup the DTCN Parameters Using the DTCN ViewIf you are using RDz v7.6.1 or higher, you can utilize an RDz view to setup your DTCN
CICS Debug properties. Steps:
From Window > Show View > Other type: DTCN and select DTCN Profiles
Right-click inside the new, empty view and select: Create
From the DTCN profiles window: Enter your User ID Click DTCN Preferences
From DTCN preferences specify: Host Name/IP Address CICS DTCN transaction port CICS login credentials:
– User ID– Password
Other fields as shown Click Test Connection Click OK to check your work

72
Setup the DTCN Parameters Using the DTCN View – continued
From DTCN profiles click Next >From DTCN pattern matching specify :
Terminal ID: * Transaction ID (Trancode) Click Add, and specify the Compile Units
(Load Module names)
Click Next >From DTCN TEST run-time specify:
Fields as shown
Session Address (your workstation I/P address) Port (your listener Debug Tool listener port) Other fields – as shown Click Finish
DTCN Profiles will be populated with entries for all users connecting into that CICS region

73
Using the DTCN View
Once you have setup the DTCN View, you can: Activate the profileActivate the profile
This modifies the CICS System Tables dynamically, through the Debug Tool facilities – and allows you to debug CICS transactions
Other options include: Edit the profileEdit the profile – and change your I/P address
After you reboot your machine Delete the profile Create a new profile Refresh the display of DTCN entries in the region
Note: In order to debug CICS programs you will have to launch a 3270 emulation session (next slides) to kick off the transaction

74
3. Login to your CICS Region3. Login to your CICS Region
From Remote Systems Explorer: Right-click
Select: Host Connection Emulator
Select your CICS application
Enter your Userid and Password and sign in

75
3. Setup the Debug Option Parameters using DTCN Transaction – 1 of 23. Setup the Debug Option Parameters using DTCN Transaction – 1 of 2
If you did NOT use the DTCN view to enter your DTCN properties you can do so using a CICS Transaction (green screen)
From CICS (after signing in): Clear the screen, Enter: DTCNDTCN – and press Enter Enter
From the DTCN screen Press F10 – this will fill in the Terminal Id for your workstation
Note that you can also
type an asterisk: * …as the Terminal Id
Note: You would only use the DTCN transaction to specify your Debug Option properties if you could not use the DTCN view (prior slides)

76
3. Setup the Debug Option Parameters using DTCN Transaction – 2 of 23. Setup the Debug Option Parameters using DTCN Transaction – 2 of 2
DTCNDTCN transaction data entry screen Enter the Tran-code
Transaction ID
Enter up to eight specific Program Id(s) you wish to debug through …or…
Enter wildcard text for the Program Id(s)
Ex. CD*
Enter your User-ID
Session Type: TCPTCP
Port Number: Port Number: from your Debugger look-up
Display ID: Display ID: Your TCP/IP address, from your Debugger look-up (note that you can not paste into this 3270, screen)
Press F4 to save your debug profile
Press F3 to clear the screen

77
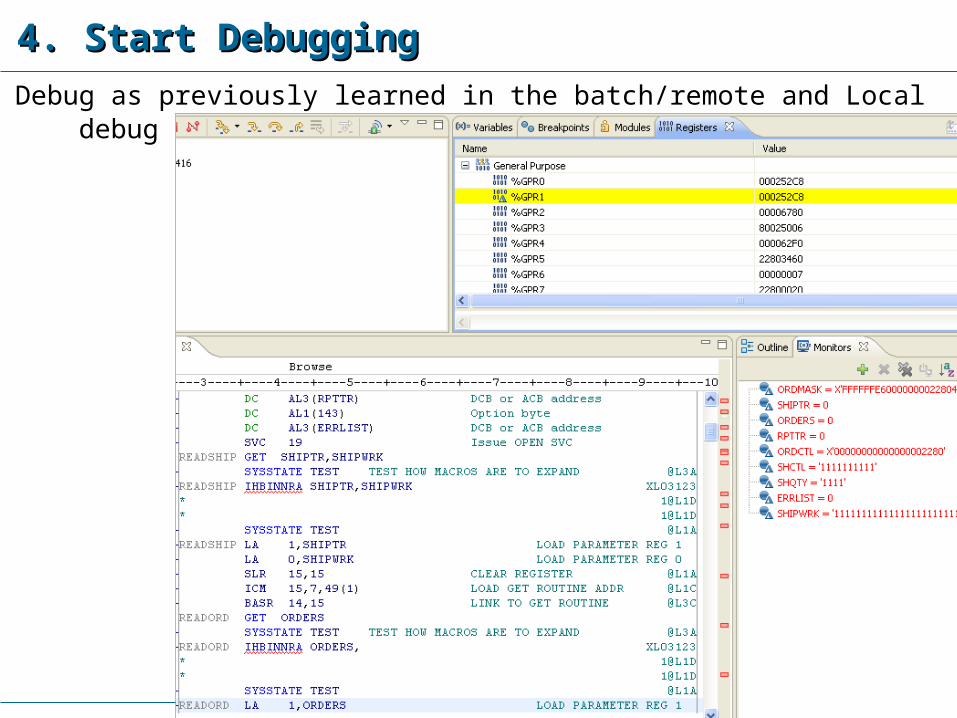
4. Start Debugging4. Start Debugging
From the CICS region Enter the Tran-code
Press Enter Enter
Click: Yes at the Click: Yes at the Confirm Confirm Perspective SwitchPerspective Switch
78
4. Start Debugging4. Start Debugging
Debug as previously learned in the batch/remote and Local debug units.

79
What Happens for Calls and Screen-IO? – 1 of 2What Happens for Calls and Screen-IO? – 1 of 2
You will be prompted, and presented with debug-run-time options

80
What Happens for Calls and Screen-IO? – 2 of 2What Happens for Calls and Screen-IO? – 2 of 2
If your current transaction ends, and a BMS or 3270 screen is sent:
You will be notified (prompted) by the debug engine
If a screen is sent, the 3270 will display in the content area

81
What About PF-Keys and Other Data Entry? You can resize the screen portion of the debugger And use the PF-Key
emulation options in the Host Connection

82
Topic ObjectivesAfter having completed this unit, you now should be able to:Using the Problem Determination Tools, Debug Option and RDz:Debug a mainframe online transaction
Describe the online transaction features for configuring your 3270 sessions with Debug Option
Debug a CICS 3270 Application
83
Larry's Notes ALC Debugging
1. GPR front and center (how??) Tabbed view - Registers If running Assembler ==> 12 points to CAA (main control block for all HLLanguages) DSA (reg. 13 points to) Dynamic Storage Area De-reference (?) Address values inside the registers "show me what this is pointing at" De-reference pointer values inside of memory Linked List Storage View - De-reference "show me storage this address is pointing at" 000123458 - go to that address, show me what's there W1 Fwd W2 Back LNAME FNAME
DSECT "structure" (like a Assembler group field - like a map over storage). C struct, PL/I Structure Technique (laborious) create XML file that mimic'd DSECT Associate DSECT with storage Can have symbolic representation as you move through the Linked List
Register Tab (%GPR1 --> F) ... can put conditionals around (break points)?