-i----.'-- a . . . - us department of energy co 80220 (303) 692-2640 or 692-2700 prepared by:...
TRANSCRIPT

, _- --..A. I
REPORT - C.2 103526
Project task 7 report : demographic and land use rec of the area surrounding the Rocky Flats Plant
~ ~ -I----.'-- I A A . ZJOOOOc(I- . . . . . . . .
m m R E P 0 R T
Demographic & Land Use. Reconstruction of the Area surrounaing the Rocky Flats Plant
R ChemRisk
Colorado De artment of Public Kealth
and Environment
Prepared by ChemRisk for the Colorado Department of Public Health and Environment


I.
PROJECT TASK 7 REPORT DEMOGRAPHIC & LAND USE RECONSTRUCTION
OF THE AREA SURROUNDING THE ROCKY FLATS PLANT
APRIL 1994
Prepared for:
Colorado Department of Health Health Studies on Rocky Flats, A-3
4300 Cherry Creek Drive South Denver, CO 80220
(303) 692-2640 or 692-2700
Prepared by:
ChemRiskQ A Division of McLaredHart
1135 Atlantic Avenue Alameda, CA 94501
ADRAIN RECORD
SW-A-005579

This document wasprepared as a team effort by the following individuals:
Project Manager:
Stephen R. Ripple, Chief Health Scientist
Administrative Support:
AngClica Perea
Principal Authors:
Susan M. Flack, Senior Associate Health Scientist
Jennifer Kathol, Demography and Land Use Subcontractor
Catherine L. DaMassa, Demography and Land Use Subcontractor
Thomas E. Widner, Principal Environmental Scientist

TABLE OF CONTENTS
1.0 INTRODUCTION . . . . . . . . . . . . . . . . . . . . . . . . . . . . . . . . . . . . . . . . . . . . 1
2.0 INFORMATION SOURCES . . . . . . . . . . . . . . . . . . . . . . . . . . . . . . . . . . . . . 5
I 2.1 LandUse . . . . . . . . . . . . . . . . . . . . . . . . . . . . . . . . . . . . . . . . . . . . . 5
2.1.1 Interviews with Landowners . . . . . . . . . . . . . . . . . . . . . . . . . . . . 5 2.1.2 Topographical Quadrangle Maps . . . . . . . . . . . . . . . . . . . . . . . . . . 7 2.1.3 Land-Ownership Records . . . . . . . . . . . . . . . . . . . . . . . . . . . . . 10 2.1.4 Other Sources of Land Use Data . . . . . . . . . . . . . . . . . . . . . . . . 10
2.2 Population . . . . . . . . . . . . . . . . . . . . . . . . . . . . . . . . . . . . . . . . . . . . 13
2.2.1 U.S. Bureau of Census Statistics . . . . . . . . . . . . . . . . . . . . . . . . 13 2.2.2 Other Sources of Population Data . . . . . . . . . . . . . . . . . . . . . . . 13
3.0 HISTORICAL LAND USE . . . . . . . . . . . . . . . . . . . . . . . . . . . . . . . . . . . . . . 15
3.1 Land Use Interviews . . . . . . . . . . . . . . . . . . . . . . . . . . . . . . . . . . . . . 15
3.1.1 Land Use Interviews . Outside Buffer Zone . . . . . . . . . . . . . . . . 15 3.1.2 Land Use Interviews . Within Buffer Zone . . . . . . . . . . . . . . . . . 19
3.2 Agricultural Land Use . . . . . . . . . . . . . . . . . . . . . . . . . . . . . . . . . . . . 23 3.3 Other LandUse . . . . . . . . . . . . . . . . . . . . . . . . . . . . . . . . . . . . . . . . 23
3.3.1 Results from Land Use Interviews . . . . . . . . . . . . . . . . . . . . . . . 23 3.3.2 Results of Analysis of USGS Quadrangle Maps . . . . . . . . . . . . . 28 3.3.3 Habitat Studies . . . . . . . . . . . . . . . . . . . . . . . . . . . . . . . . . . . . 28 3.3.4 Historical Water Use . . . . . . . . . . . . . . . . . . . . . . . . . . . . . . . . 28
4.0 HISTORICAL POPULATION . . . . . . . . . . . . . . . . . . . . . . . . . . . . . . . . . . . 31
4.1 U.S. Bureau of Census Population Statistics . . . . . . . . . . . . . . . . . . . . . 31 4.2 Analysis of Topographical Quadrangle Maps . . . . . . . . . . . . . . . . . . . . 39
5.0 REFERENCES . . . . . . . . . . . . . . . . . . . . . . . . . . . . . . . . . . . . . . . . . . . . . . 45

LIST OF FIGURES
Figure Page
1-1 2- 1 2-2 3-1 3 -2 3 -3 3 -4 3-5 4- 1 4-2 4-3 4-4 4-5 4-6 4-7 4-8 4-9
The Demography and Land Use Study Area . . . . . . . . . . . . . . . . . . . . . . . . . . . .
Topographical Map .Key, Rocky Flats Plant . . . . . . . . . . . . . . . . . . . . . . . . . . . 9
2 Historical Topographical Maps of Study Area . . . . . . . . . . . . . . . . . . . . . . . . . . 8
Properties Acquired for the Rocky Flats Plant Site . . . . . . . . . . . . . . . . . . . . . . 20 Agricultural Land Uses . 1950 . . . . . . . . . . . . . . . . . . . . . . . . . . . . . . . . . . . 24 Agricultural Land Uses . 1960 . . . . . . . . . . . . . . . . . . . . . . . . . . . . . . . . . . . 25 Agricultural Land Uses . 1970 . . . . . . . . . . . . . . . . . . . . . . . . . . . . . . . . . . . 26 Agricultural Land Uses . 1980 . . . . . . . . . . . . . . . . . . . . . . . . . . . . . . . . . . . 27 Estimated 1950 Population . . . . . . . . . . . . . . . . . . . . . . . . . . . . . . . . . . . . . . 34 Estimated 1960 Population . . . . . . . . . . . . . . . . . . . . . . . . . . . . . . . . . . . . . . 35
Estimated 1980 Population . . . . . . . . . . . . . . . . . . . . . . . . . . . . . . . . . . . . . . 37
Residential Dwellings and Schools . 1960 . . . . . . . . . . . . . . . . . . : . . . . . . . . 42 Residential Dwellings and Schools . 1970 . . . . . . . . . . . . . . . . . . . . . . . . . . . 43 Residential Dwellings and Schools . 1980 . . . . . . . . . . . . . . . . . . . . . . . . . . . 44
Estimated 1970 Population . . . . . . . . . . . . . . . . . . . . . . . . . . . . . . . . . . . . . . 36
Estimated 1990 Population . . . . . . . . . . . . . . . . . . . . . . . . . . . . . . . . . . . . . . 38 Residential Dwellings and Schools . 1950 . . . . . . . . . . . . . . . . . . . . . . . . . . . 41
Table
LIST OF TABLES
Page
2-1 Landowners Interviewed . . . . . . . . . . . . . . . . . . . . . . . . . . . . . . . . . . . . . . . . 6 3-1 Deeds of Sale for Buffer Zone Land . . . . . . . . . . . . . . . . . . . . . . . . . . . . . . . 21 4-1 U.S. Census Statistics for Minor Civil Divisions and Census Tracts Located
Partially or Completely Within the Study Area . . . . . . . . . . . . . . . . . . . . . . . . 33
APPENDICES
Appendix A Land Use Questionnaire and Response Summaries Appendix B Topographical Quadrangle Map Analysis Appendix C Information Request Letter and List of Persons Contacted Appendix D Resolution of Comments on the Draft Task 7 Report

I .
Introduction
TASK 7 REPORT April 1994
Page 1
1.0 INTRODUCTION
A key factor in dose reconstruction involves the historical characterization of demography and land use in the area of interest. The purpose of Task 7 of the Toxicologic Review and Dose Reconstruction Project was to identify the locations of persons/populations who might have been impacted by potential releases of chemicals and radionuclides from the Rocky Flats plant during the period of plant activities from 1950 to present. In addition to population characterization, land uses in the surrounding area were investigated to identify the potential exposure pathways required to estimate doses to off-site populations.
The Task 7 Plan (ChemRisk, 1991) presented a global, staged approach to characterizing demography and land use within 50 miles of the Rocky Flats plant, a typical distance used in radiological dose assessment. In the Task 7 Plan, common sources of population and land use information, including census data and county agricultural statistics, were cited as potential sources of population and land use data for the area surrounding the Rocky Flats plant.
A major step in this staged approach was to define historical locations of residents and land uses that could be maximally impacted by releases from the plant site. Therefore, the Task 7 study focused on the area within five miles of the plant, referred to as the study area for Task 7. Specifically, extensive interviews with long-term landowners and ranch managers and detailed searches for information on land use, emphasizing agricultural land use, were conducted.
Figure 1-1 shows the five-mile-radius study area for Task 7. Between 1951 and approximately 1974, the Rocky Flats plant included only about one square mile at the center of the study area. Between 1974 and 1976, the federal government purchased additional land surrounding the original plant boundary. This additional land became part of the Rocky Flats plant, and is referred to as the "buffer zone". The buffer zone is shown in Figure 1-1.
Historical statistics on land use and populations were not as readily available for rural areas as for the Denver Metropolitan area, for example. Therefore, multiple sources of information were researched and data were collected to describe as accurately as possible the demography and land use of the area within a five-mile radius. Typically, data prior to 1970 were difficult to locate or unavailable. For example, no census block group data were available for the study area in 1950 or 1960 due to the low population density during those time periods. Available population and land use data were primarily county-wide, however, some population data were available at the municipality level. Therefore, specific population and land use information for the sections of Jefferson and Boulder Counties within the five-mile radius required that several sources of information be utilized in order to construct the most accurate representation.
0202ALR2

- SCALE: l " m 1 . 7 5 Miles
0' SCALE 9.240
ChW?&b A cmrlm d kU?UVM
FIGURE 1-1 THE DEMOGRAPHY AND LAND
USE STUDY AREA

TASK 7 REPORT April 1994
Introduction Page 3
This report summarizes all research and data collection activities completed as part of Task 7. All sources of demographic and land use information that were reviewed as part of Task 7 are described, with the most useful sources discussed in some detail. All population and land use data collected for this study are currently catalogued in the repository documents cited in this report. Results characterizing the historical population and agricultural land use for the area within a five-mile radius of the plant are summarized in three sets of population and land use maps.
Actual population and land use for the study area between 1950 and 1990 were very difficult to estimate due to limitations of available information. The estimates in this report were derived using best available data and professional judgement. Estimates have not been rigorously reviewed for consistency with all data sources.
0202ALR2

TASK 7 REPORT April 1994 Page 4 Introduction
This page intentionally IeJi blank
0202ALRZ

In formation Sources
TASK 7 REPORT April 1994
Page 5
2.0 INFORMATION SOURCES
In order to reconstruct the demography and land use in the area adjacent to the Rocky Flats plant within the five-mile-radius study area, various data were collected from several sources. The description of those sources and their relative value for demographic reconstruction is presented in this section.
2.1 Land Use
Land use information for specific areas within Jefferson and Boulder Counties was not generally available, except on a county-wide level. Because the study area included only a small portion of north Jefferson County and the southern border of Boulder County, the assumption that county-wide data reflected actual land use in the five-mile study area may not have been valid. Therefore, personal interviews with long-term landowners were conducted and historical topographical maps of United States Geological Survey (USGS) quadrangles were reviewed to get an indication of historical land use in the study area and to identify other potential sources of land use information.
2.1.1 Interviews with Landowners
Personal interviews with several long-term landowners, ranch managers, and residents were conducted in mid- 199 1. These interviews were initiated with a survey to identify, to the best of the respondents’ knowledge, the land uses that existed within the five-mile-radius study area between 1950 and 1990. A copy of the survey and detailed summaries of the interviews can be found in Appendix A. These interviews represent the most useful information on historical land uses, although they do not characterize the entire study area. The interviews provided specific information on residences and land uses primarily in the southeastern and western portions of the area within a five-mile radius of the plant site.
In some cases, respondents differed on the exact locations of certain agricultural activities, or could not recall the exact time period in which the specific agricultural operations occurred. Therefore, some actual uses and time periods shown on the agricultural land use maps presented in Section 3 are only approximations based on information gathered during the interviews. Table 2-1 lists the persons interviewed regarding land use in the five-mile-radius study area.
0202ALR2

TABLE 2-1
LANDOWNERS INTERVIEWED
II Name I Summary of Information Provided ~
Mrs. Bini Abbott Arvada, CO
Mr. & Mrs. Karl Brauch Arvada, CO
Owned land in area since 1960. Identified landowners and land uses in the study area.
Owned land in area since 1939. Cattle operation until 1982.
~
Mr. Albert Hogan Boulder, CO
Mr. & Mrs. Ed Hogan Boulder, CO since 1940.
Leased Church Ranch land for cattle operation prior to 1950.
Family has owned land in area since 1890. Lived or worked land
Mr. John Lutz Golden. CO
Mr. Charles Church McKay Westminster, CO
Lindsay Ranch manager.
Descendent of Marcus Church. Operates portion of Church Ranch.
Mr. Joe Meininger Broomfield, CO
Church Ranch manager since 1942.
Mr. Roland Vacher Golden, CO
Mrs. Jean Woodis t- Arvada, CO
Owns and farms land in area. Familiar with wheat production. Committeeman with Agricultural Stabilization Conservation Service (ASCS) from 1950 to mid 1980s.
Former dairy operator (1948-1974). Family has owned land since 1913.
Information Sources
TASK 7 REPORT April 1994
Page 7
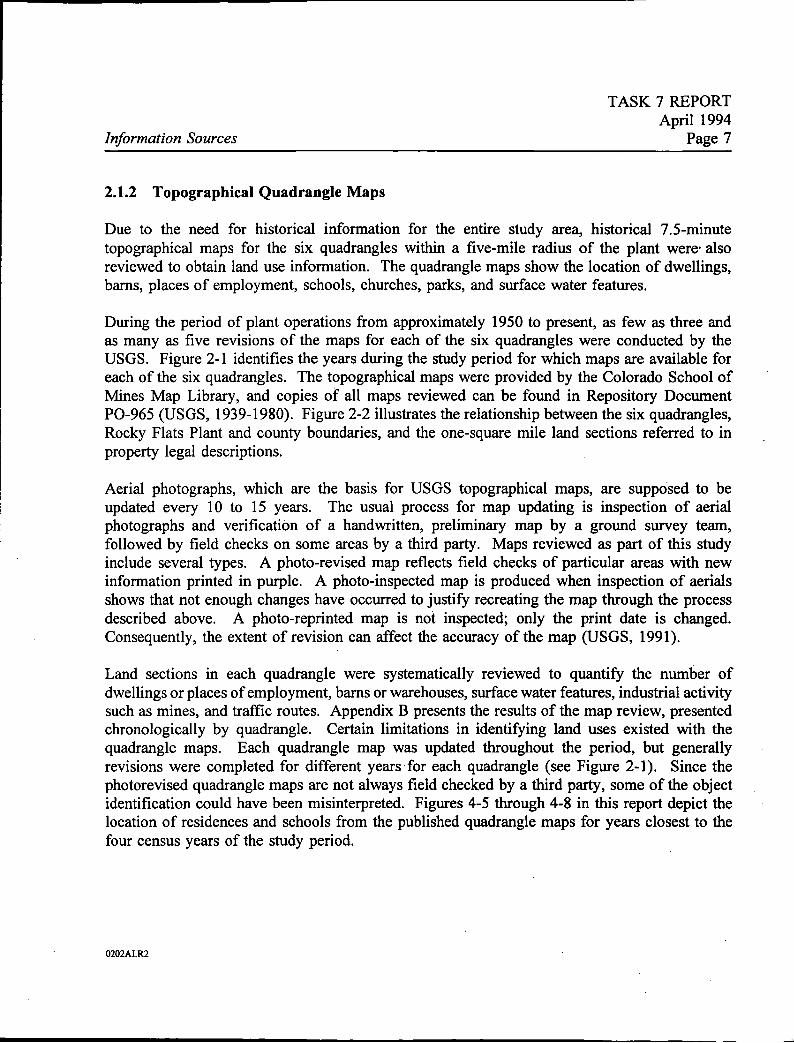
2.1.2 Topographical Quadrangle Maps
Due to the need for historical information for the entire study area, historical 7.5-minute topographical maps for the six quadrangles within a five-mile radius of the plant were also reviewed to obtain land use information. The quadrangle maps show the location of dwellings, barns, places of employment, schools, churches, parks, and surface water features.
During the period of plant operations from approximately 1950 to present, as few as three and as many as five revisions of the maps for each of the six quadrangles were conducted by the USGS. Figure 2-1 identifies the years during the study period for which maps are available for each of the six quadrangles. The topographical maps were provided by the Colorado School of Mines Map Library, and copies of all maps reviewed can be found in Repository Document PO-965 (USGS, 1939-1980). Figure 2-2 illustrates the relationship between the six quadrangles, Rocky Flats Plant and county boundaries, and the one-square mile land sections referred to in property legal descriptions.
Aerial photographs, which are the basis for USGS topographical maps, are supposed to be updated every 10 to 15 years. The usual process for map updating is inspection of aerial photographs and verification of a handwritten, preliminary map by a ground survey team, followed by field checks on some areas by a third party. Maps reviewed as part of this study include several types. A photo-revised map reflects field checks of particular areas with new information printed in purple. A photo-inspected map is produced when inspection of aerials shows that not enough changes have occurred to justify recreating the map through the process described above. A photo-reprinted map is not inspected; only the print date is changed. Consequently, the extent of revision can affect the accuracy of the map (USGS, 1991).
Land sections in each quadrangle were systematically reviewed to quantify the number of dwellings or places of employment, barns or warehouses, surface water features, industrial activity such as mines, and traffic routes. Appendix B presents the results of the map review, presented chronologically by quadrangle. Certain limitations in identifying land uses existed with the quadrangle maps. Each quadrangle map was updated throughout the period, but generally revisions were completed for different years for each quadrangle (see Figure 2-1). Since the photorevised quadrangle maps are not always field checked by a third party, some of the object identification could have been misinterpreted. Figures 4-5 through 4-8 in this report depict the location of residences and schools from the published quadrangle maps for years closest to the four census years of the study period.
0202ALl72

STUDY PERIOD I " " " " I " " ' " ' I " ' ' " " I " " ' " ' I " "
FIGURE 2-1 HISTORICAL TO POGRAPH ICAL
MAPS OF STUDY AREA I Olulilsn s r MCL omn/Hort
WlShTLIR-1 hoyJ(ypI
Quadrangle I

LEGEND - QUADRANGLE BOUNDARIES
3 1 SECTION NUMBER .\.\\\\,\\. .\\\\\\\\\. ... \\\...\. .\.\\\ ,.. .\\\\\\\.
:;::::::::: ROCKY FLATS PLANT PROPERTY (POST 1974) . . . . . . ..
R Dlulslan el McLomn/Hart
FIGURE 2-2 TOPOGRAPHICAL
MAP KEY ROCKY FLATS PLANT

TASK 7 REPORT April 1994 Page 10 Information Sources
2.1.3 Land-Ownership Records
The original sale of land to the U.S. Government for the Rocky Flats Plant in 1951 was researched to determine original land-ownership and neighboring landowners. This information was useful for identifying land uses of the site prior to acquisition, and additional historical residents of the study area.
As discussed in Section 1, additional land surrounding the original prope.rty acquired in 195 1 was purchased by the U.S. Government between 1974 and 1976. This land is referred to as the buffer zone. To determine land ownership and land use of the buffer zone prior to acquisition, deed books at the Jefferson County Assessor’s Office were reviewed to locate the specific deeds of sale.
2.1.4 Other Sources of Land Use Data
Due to the lack of land use information specific to the sections of Jefferson and Boulder Counties within the five-mile radius, a search for additional sources of land use information was conducted. The search produced the following ,potential sources of land use data:
County Assessor Files
Additional land use information was obtained from the Jefferson and Boulder County Assessor’s Offices. A land use inventory identifying land uses within a five-mile radius of the plant by section, township, range, and acreage was printed from county assessor records. The resulting printout shows the current (1990) use of the land by county land use codes. The classification of land by the assessor’s office is used for taxing purposes and in some cases has not been updated recently. The land use classifications include grazing, hay meadow, dryland farm, agribusiness, commercial, industrial, residential, mineral reserve, vacant, and exempt (usually publicly held properties). Many of the land uses classified for tax purposes have not changed over time. This source of information can be useful for cross-checking identified historical and current land uses described in the interviews. However, the assessors’ data did not prove to be very accurate in describing acreages and dates of ownership for the 1950s and 196Os, or current land uses. Results of the land use database searches from both Boulder and Jefferson Counties are located in Repository Documents PO-962 (Boulder County, 1991) and PO-963 (Jefferson County, 1991a).
0202ALR2

TASK 7 REPORT April 1994
Information Sources Page 1 1
County and Local Governments
Jefferson County, Boulder County, and local municipality records were reviewed to identify land uses within the five-mile radius. Each county and municipality in the 50 mile radius of the plant was contacted about the imminent collection of information on land use, zoning, annexation, recreational use, population, water sources, agriculture use, and growth trends in their respective jurisdiction. Again, most municipal and county land use information addresses only incorporated areas or is county-wide, which is not useful in the demographic characterization of the specific area within a five-mile radius. Most of the study area is unincorporated. Records of correspondence with counties and municipalities are included in Repository Document PO-967 (Kathol, 1991). The request letter and contact list can be found in Appendix C.
Some historical data on grazing land and other non-irrigated land north of the plant was provided in the Boulder County Comprehensive Plan (1983) and from conversations with the Boulder County Open Space Planner (Wheeler, 1991).
Agricultural Sources
The Colorado State University (CSU) Agronomy Department (Eckles, 1991) and the CSU Agricultural Economics Department (Spencer, 199 1) were consulted to determine possible sources of information on crop production and consumption in the region and export/ consumption ratios of local products. The Colorado Crop and Livestock Reporting Services provide estimates on crop and livestock production by county on an annual basis but do not provide information on a more detailed level. Actual crop and livestock production specific to the five-mile radius was unavailable.
Another source of agricultural information is the Colorado Census of Agriculture (USDOC, 1950- 1987). The Census of Agriculture provided data on crops and livestock produced county-wide in Jefferson and Boulder Counties. However, specific information was not available for the five- mile study area. The study area is a relatively insignificant portion of overall Jefferson and Boulder County agricultural production.
The Agricultural Stabilization and Conservation Service (ASCS) for Boulder and Jefferson Counties was also contacted to identify agricultural land uses in the study area (Williams, 1991 and Vacher, 1991). The Jefferson County ASCS is combined with the Boulder County office. This ASCS office has maps showing the acreages and crop production of farms in the area surrounding the plant. The oldest maps (aerial photographs) available were for 1978 and 1983.
0202ALR2

TASK 7 REPORT April 1994 Page 12 In formation Sources
Recreational Sources
Fishing information was available for each county from the Colorado Division of Wildlife (Polisky, Weber and Satterfield, 1990). Specific data in the five-mile radius around the plant have not been collected. Broad-based habitat information was available from 1968 stream and lake surveys, which included sampling for fish, water chemistry, insect life, and flow, but did not include any statistics on the numbers of fish caught (creel data). Creel data were not available prior to the 1980s. From the mid 1980s on, there were creel data for Standley Lake, Arvada Reservoir, Ralston Reservoir, Boulder Creek, and Clear Creek.
Hunting information was available from a Colorado Division of Wildlife Annual Report titled Colorado Big Game Harvest, which has been published annually throughout the study period. The report describes all game harvested by county and game management unit. Specific harvest data for part of the five-mile radius around Rocky Flats is available for Game Management Unit 29 (Schoonveld, 1992). The report includes information on game harvests, number of hunters, and recreational visitor days.
In addition to the Colorado Big Game Harvest information, several habitat studies have been completed in the Rocky Flats area (Alldredge, 1990); pertinent results .of these studies are summarized in Section 3.3.
Information on historical water usage for Great Western Reservoir, Standley Lake, and Mower Reservoir has been collected (Schnoor, 1991 ; Tipton and Kalmbach, 1989; and State of Colorado, 1973) and is briefly summarized in Section 3.3.
Aerial PhotograDhv
Several sources of aerial photography were reviewed to identify land uses in the area, including the Landis aerial photos from 1973 and from 1978 to the present. The aerial photos covered the area to the north, east, and south of the plant, including photos of the plant. Rural residential areas, waterways, cultivated land, mining activity, and industrial and commercial developments were all discernible in the 1:1200 scale photos. Individual residential units could not be accurately counted at the 1 : 1200 scale. All Landis aerial photos can be blown up to a 1 :200 scale (Chad, 1991). These photos are available for cross-referencing with information obtained from the personal interviews.
Jefferson County Planning Department also had a number of aerial photographs at scales of 1 :200 and 1500 for the 197Os, and 1:lOOO for 1950, 198Os, and 1990 for portions of the area within a five-mile radius. Residences are not discernible at the 1 : 1000 scale, which was the only scale
OZOZALRZ

Information Sources
TASK 7 REPORT April 1994
Page 13
available for years other than the 1970s. Although topographical quadrangle maps are shown at a scale of 1 :24,000, they are professionally interpreted.
2.2 Population
Population data for the study area were obtained primarily from U.S. Census data (USDOC, 1950-1 990). Reports obtained included selected Population and Housing Characteristics for 1950, 1960, 1970, 1980, and 1990 for the DenverBoulder Standard Metropolitan Statistical Area (SMSA) census tracts within the five-mile radius of the Rocky Flats plant. Additional sources of population data reviewed include local government and suburban phone directories.
2.2.1 U.S. Bureau of Census Statistics
In 1950, populations of counties were identified by minor civil divisions, which correspond somewhat to census tracts of later years. These divisions identified population in a more detailed manner than later census tract estimates. Population data obtained from the 1960 Census included only tract data for the study area. This data does not accurately represent the study area due to the large geographical area included in the census tracts. Census block data are available for the 1970 and 1980 Census of Population and Housing Characteristics for the DenverBoulder SMSA and Selected Areas. Block data encompasses most of the eastern portion of the study area, adjacent to the Denver SMSA, for these years.
In the 1990 Census, block data are available for the entire United States. For the 1990 population estimates, data were used from the U.S. Census Bureau automated geographic data base, known as the TIGER (Topologically Integrated Geographic Encoding and Referencing) System, that allows production of various geographical products using 1990 Census block data.
The specific locations of persons are difficult to identify in the rural areas, therefore cross-checks with USGS topographical quadrangle maps may be used to identify the locations of residences and population centers. Quadrangle maps show the locations of individual residences and major population centers. Because historical census tracts typically include areas outside the five-mile radius, it was necessary to make best estimates on the size of the population that actually lived within the study area. This was done for the years 1950 and 1960, for which block data were not available.
2.2.2 Other Sources of Population Data
If additional research on historical populations in the study area is required, sources such as annexation information from local governments and old Jefferson and Boulder County records can be reviewed.
0202ALR2

TASK 7 REPORT April 1994 Page 14 Information Sources
Local Governments
Local government annexation maps and land use maps identify new subdivisions or employment centers which were located in the study area throughout the study period. Building permits are another source of information which will require researching archived files. This source is available, if necessary, to produce more accurate population counts for specific areas within a five-mile radius of Rocky Flats plant.
Directories
Other sources of information available to estimate study area population include historical suburban phone directories for the suburban areas around Denver City located in the Denver Public Library’s Western History Section. The directories identify a few residences, primarily in the southeastern portion of the study area nearest to the plant, for years between 1952 and 1964 when directories were published.
0202ALR2

Historical Land Use
TASK 7 REPORT April 1994
Page 15
3.0 HISTORICAL LAND USE
Land uses in the vicinity of the Rocky Flats plant are generally of a rural agricultural character. Most of the area within the five-mile radius is agricultural land with interspersed industrial uses and some residential development. The prevalent agricultural uses for the period 1950 through the present include the following: grazing of livestock, primarily cattle, hay production, wheat production, some corn, barley, and rye production, and some dairy farms. The land in the area would not be considered prime agricultural land due to the rocky, shallow, soil conditions. Other uses include: some clay, sand, and gravel mining, mini-farms or smaller acreage ranchettes with horses and other farm animals such as chickens, pigs, sheep, etc., rural residences, suburban residences, mountain and county parkland or open space, recreational, irrigation, and municipal water supplies, and some industrial manufacturing uses.
3.1 Land Use Interviews
Nine individuals, including land owners and ranch managers within a five-mile radius of the Rocky Flats plant, were interviewed for their knowledge of land use, additional landowners, and residents. The purpose of the interviews was to identify typical agricultural practices during the study period specific to the five-mile study area. Appendix A includes a copy of the survey questions and summaries of each interview, including the individual responses to the survey questions and any additional information provided by those interviewed. Copies of the completed questionnaires and land use maps, and notes taken during interviews, are contained in Repository Document PO-967 (Kathol, 1991). The following sections summarize the historical land use information provided by each respondent.
3.1.1 Land Use Interviews - Outside Buffer Zone
The following individuals were interviewed for their knowledge of historical land use activities outside the buffer zone, but within a five-mile radius of the Rocky Flats plant.
Ed Hoaan
The Hogan family has owned property in the area since 1890. Ed Hogan has lived on the 600 acres his family owns, off and on since 1940. Key aspects of the Hogan land use interview were:
0 Farm animals were raised and consumed throughout the period 1950 to 1990.
0 A large garden was maintained most years from 1950 to present.
0 Fished and hunted deer occasionally from 1950 to present.
0202ALR2

TASK 7 REPORT April 1994 Page 16 Historical Land Use
0 Consumed water from a groundwater well.
0 Adjacent property owners to the north and east of the Hogan property were the Van Vleets, who used the land for summer grazing.
0 Most of the land in the study area has historically been used for grazing and some wheat production.
Roland Vacher
Although Mr. Vacher does not live within the five-mile radius of the plant, he still owns 300 acres and farms 558 acres in the area. Key aspects of the Vacher interview included:
0 Wheat production since 1941; most of the grain is sold at elevators in Denver and shipped out of the area for processing.
0 Vacher was an elected committeeman with the Jefferson County Agricultural Stabilization Conservation Service (ASCS) from 1950 into the early 1980s.
0 The major crop produced in the area was dryland wheat.
e Other wheat producers in the study area include:
- The T.G. Nies Ranch, until the land was sold to Jefferson County Airport. The Ketner Ranch just north of Standley Lake, until it was developed into
The Brauch property near Alkire and 100th from 1950 through the mid-
The McKay (Church) land just west of Indiana and north of 96th was in
Some irrigated farms in the area just southeast of Superior.
- a residential subdivision, Countryside Estates.
1980s.
wheat production throughout the study period.
-
-
-
0 Suggested contacting the Denver Milk Producers (now Western Dairy Co-op) for information on historical dairies in the area.
0202ALRZ

Historical Land Use
TASK 7 REPORT April 1994
Page 17
Bini Abbott
Bini Abbot and her husband have lived on their property since 1960. The former owners, the Moores, grew winter wheat on the property. Key aspects of Abbott interview were:
e Only farm animals are horses and donkeys.
e Grow hay for feed and for sale.
0 Had a garden in the past and consumed the vegetables during the growing season.
e Two water wells (30 feet deep and 155 feet deep) were used for everything including drinking water.
e Do not fish or hunt locally.
Mrs. Abbott is very familiar with the area and was able to provide additional names of landowners and past and current land uses.
e Most of the properties are small acreage (2 to 12 acres) ranchettes.
e Larger landowners in the area are the Brauchs, the Ladwigs and the Woodises.
Charles Church McKay
Charles McKay is one of the two descendants of Marcus Church, one of the original owners of the land on which the Rocky Flats plant was built. The first parcel was sold in 1950, and additional acreage was sold in 1974. Mr. McKay never lived within the five-mile radius, however the Church family has grazed cattle and grown hay and wheat in the area for the past 40 years. Key points of the Church land use interview included:
e Grazing rights existed on certain parts of the plant lands including much of the buffer zone.
e A maximum of 200 head of cattle grazed on the land within the five-mile radius, and some were consumed by the Church family.
e Consumed two to three fish per year from Rocky Flats Lake (Smart Reservoir).
0202ALRZ

TASK 7 REPORT April 1994 Page 18 Historical Land Use
0 Perry S. McKay, the brother of Charles McKay, also owns land in the five-mile radius.
0 Potential contacts who have either owned land in the five-mile radius or lived in the area as foremen on ranches, or lessees include:
- Albert and Leo Hogan purchased Church Ranch steers and heifers and
Joe Meininger, the Church Ranch manager, plowed ground and would
Wayne Harkness grew up in area and raised Angus cattle. John Lutz was the Lindsay Ranch manager. John Boyle sold land to Jefferson Center Project. Howard Lacy and Bruce Nickerson are Jefferson Center Developers.
leased land from the McKays.
know when the land was in wheat. -
- - - -
Karl Brauch
Although Mr. and Mrs. Brauch were not interviewed personally, they returned a questionnaire. The Brauchs have lived at their current address for 52 years. Land use information from the Brauch interview included the following key points:
0 Maintained herd of 100 herefords from 1942 through 1982; retired in 1982.
e Approximately 50 percent of their meat intake came from their cattle from 1942 to 1982; cattle grazed on the ranch pasture grasses.
0 Currently lease their land as pasture for 78 head of cattle.
0 Did not have a garden.
0 Used their groundwater well for drinking and all other uses.
0 Do not hunt or fish locally.
Jean Woodis
The family of Mrs. Jean Woodis (the Zehnders) has owned land within the five-mile radius since 1913. Mrs. Woodis has lived on the 79 acres (now 39 acres) since 1948. Information provided on these operations and other land uses include:
0202ALRZ

Historical Land Use
TASK 7 REPORT April 1994
Pane 19
Operated a dairy farm (ranged from 50-100 cows) from before 1950 until 1974.
Started a cowkalf operation (50 head) in 1974.
Sold milk to the Denver Milk Producers, which supplied milk to the Denver Metropolitan area.
Sold cattle in the Denver market.
Both dairy cows and beef cattle grazed on the Woodis property, but also were fed hay bought from various producers (generally from outside the five-mile radius).
Consumed both beef and dairy products primarily from animals grown on the farm.
Have grown a garden throughout the period and have consumed the vegetables.
Have three wells (two old and one new); two wells are used for drinking water, one well is for livestock.
Identified a number of former dairies and owners within the five-mile radius.
3.1.2 Land Use Interviews - Within Buffer Zone
Deed books and legal descriptions of both the original purchase in 195 1 and the expansion of the buffer zone in 1974-76 were reviewed at the Jefferson County Clerk and Recorder Office to identify potential land uses within the current buffer zone boundary before the included land was purchased by the U.S. Government in 1951 and in 1974-76. Figure 3-1 illustrates areas and dates of prior ownership of land within the Rocky Flats plant boundary. Copies of the actual deed legal descriptions from both the original purchase in 1951 and the 1974-76 purchases can be found in Repository Document PO-964 (Jefferson County, 1991 b).
In addition to the deed search to determine land ownership within the buffer zone, several individuals were specifically interviewed to determine historical uses of land. These interviews are summarized below.
0202ALR2

LEGEND Welke FIGURE 3-1 PROPERTIES ACQUIRED FOR THE
ROCKY FLATS PLANT SITE
1969-74. Young - - - - CURRENT PLANT BOUNDARY
---I- PROPERTY BOUNDARY I nlulslan or Mcl#mn/Hart
cLl.II+l R.roYww

TABLE 3-1
DEEDS OF SALE FOR BUFFER ZONE LAND
1 Date
12- 13-5 1
6-6-74 I 16114 1) 6-21-74
11-20-74
1-30-75
2-25-75
6-2 1-76
7-23-76
Owner Acres
George Lindsay Katherine Church Frank Rodgers
960 1200 - 400 2560
H. Sol Cersonsky 318
D.O.M. Acres (a limited 142 partnership)
~~~ ~~
Anne Straub 1 60
A. Reamer Patten 446 (Colorado Investment Services, IllC.)
McClintic & McGeorge 151 (of Virginia)
Anne Church 1451
Robert Young 18
Sam and Bette Rudd and 160 Robert Pierce
Harold Spicer and Kenneth and Dorothy Wilshusen
Susan Lindsay 513
619
Public Service Co. of Colorado 28
Adolph Coors Company 2

TASK 7 REPORT April 1994 Page 22 Historical Land Use
Charles Church McKav
e Marcus F. Church sold approximately 2880 acres to the Atomic Energy Commission (AEC) in 1950; AEC did not allow any of this land to be grazed or put into crop production.
.
e Indicated land outside the original plant boundary which was grazed or in crop production (See Section 3.2).
Albert Hogan
e Leased land around the Church ranch from 1950 to present.
e Grazed under 200 head of cattle which were sold in major markets.
e Has not produced hay, wheat or other crops, or had a garden.
Joe Meininger
e Started working in the area in 1942, but has never lived on the property.
e Identified 100 acres of irrigated crop land and 300 acres of dryland, west of Indiana St., that was in wheat, corn, or barley throughout the study period. The corn and barley were used as feed for the cattle, and the wheat was often sold in town.
e Indicated 110 acres of dryland wheat on Highway 72.
e Indicated 1500 acres of land between the southern plant boundary and Highway 72 that has always been used for grazing.'
e Suggested contacting the following people: Karl Brauch, Jean Woodis, Bini Abbott, Ed Ladwig, John Lutz, John Boyle, Ranson, Bill and Ed Hogan.
John Lutz
e Lindsay Ranch Manager; grazes cattle from plant boundary to Highway 128.
e Land west and north of the plant has always been used for grazing (160 head of cattle).
0202ALR2

Historical Land Use
TASK 7 REPORT April 1994
Page 23
e A 160-acre tract within the plant boundary was used for hay production until 1950; hay fed to the ranch cattle; calves were sold in Longmont.
e In recent years they have started grazing north of Highway 128, since land became Boulder County Open Space.
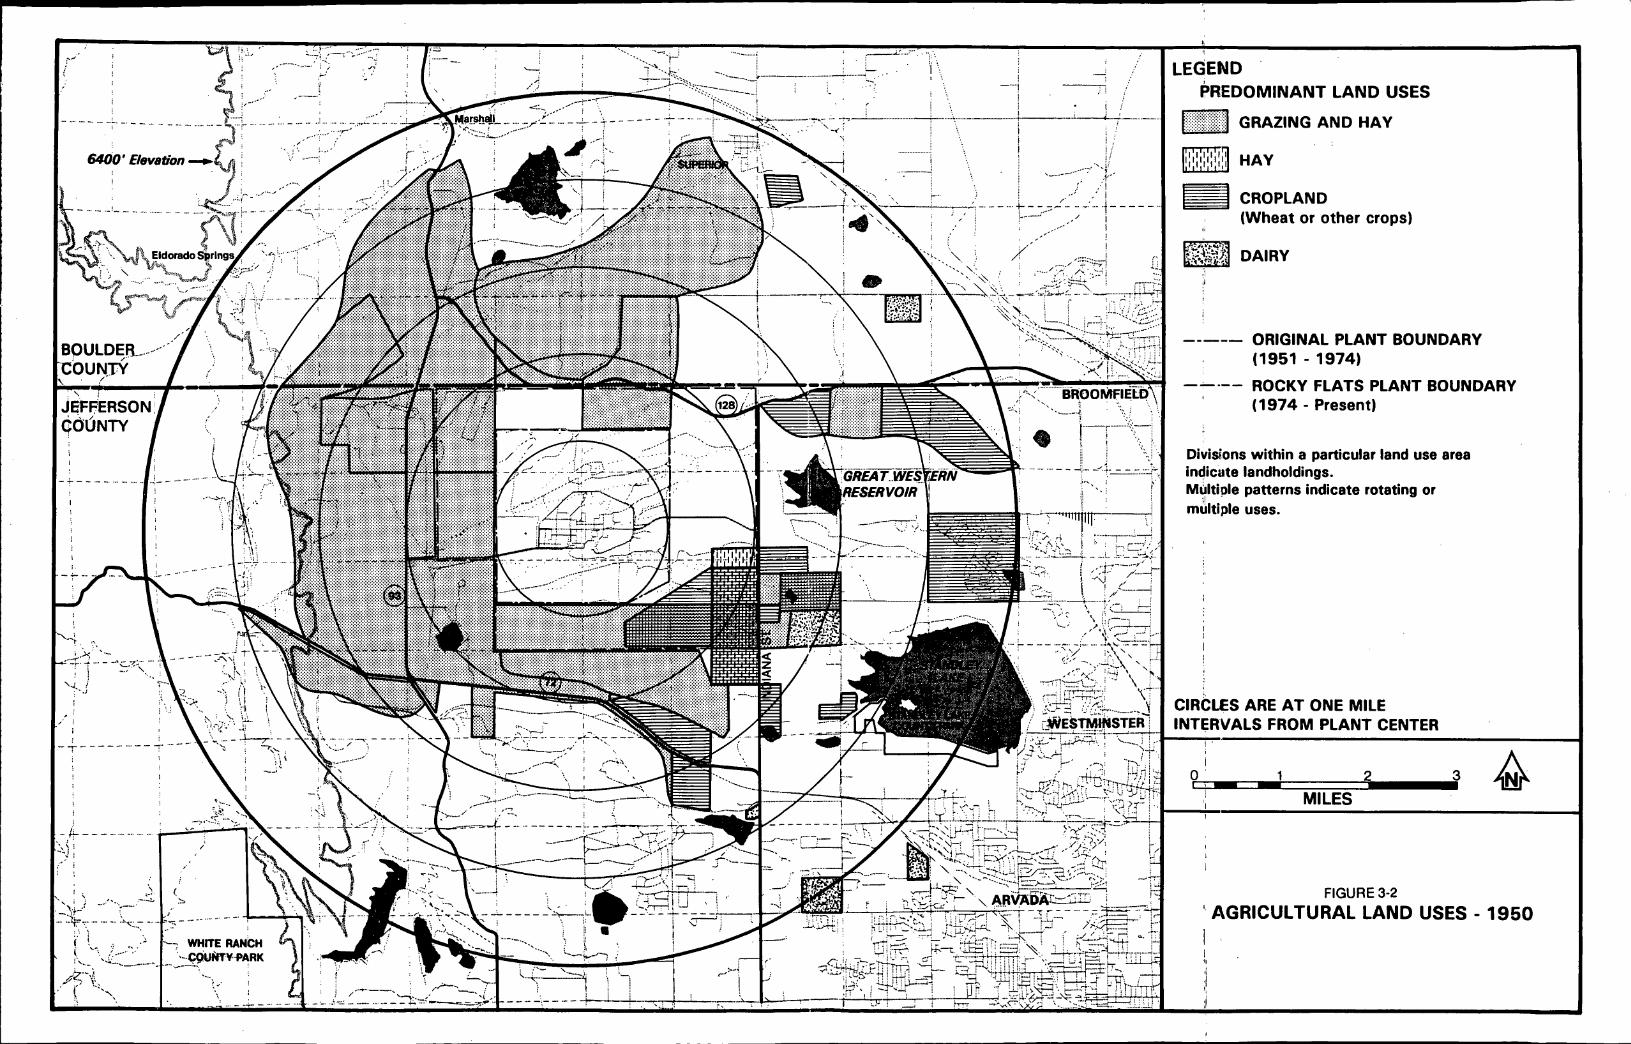
3.2 Agricultural Land Use
Figures 3-2 through 3-5 graphically present all agricultural land use information provided by landowners for all portions of the study area covered in the interviews. Agricultural land use was emphasized because historically it has been the predominant land use, and because it represents plausible exposure pathways.
The only major differences in agricultural land use from 1950 to 1980 are that dairies were not operating after the mid- 1970s, and the southern portion of the buffer zone was no longer grazed after acquisition of that land by the U.S. Government in 1974-76. Much of the grazing land and other non-irrigated land north of the plant was purchased by Boulder County for use as open space. Boulder County continues to lease this land for grazing, which has historically been the principal use of the land (Wheeler, 1991).
3.3 Other Land Use
Some information on land uses other than agriculture was collected in the land use interviews, from USGS quadrangle map review, and from other sources including contact with government agencies.
3.3.1 Results from Land Use Interviews
Information obtained from the land use interviews for land uses other than agriculture are summarized below:
e Some residents fished and hunted deer for personal consumption within the study area from 1950 to the present.
e Some of the residents within the study area consumed water from ground water wells.
e The area around Alkire and Standley Lake is designated bald eagle habitat. ,
0202ALR2
u. -', . . . . .
LEGEND PREDOMINANT LAND USES
......................... .................. ..................
............. .................
........ K l .............. GRAZING AND HAY
mj HAY
ml CROPLAND (Wheat or other crops)
1,
----- ORIGINAL PLANT BOUNDARY (1951 - 1974)
ROCKY FLATS PLANT BOUNDARY (1974 - Present)
t
Divisions within a particular land use area indicate landholdings. Multiole patterns indicate rotating or mhtiple uses.
CIRCLES ARE AT ONE MILE INTERVALS FROM PLANT CENTER
I
I 0 1 2
MILES I
FIGURE 3-2 ' AGRICULTURAL LAND USES - 1950

......... .... . . . . . . . . . ...... ....... . . . . . 1 ............... :: , ‘W ; ! +..: !...’? ,__..-I : i , ?..- .! I -
LEGEND I PREDOMINANT LAND USES
.......................... .......................... ..................... .................. ............. cl .......................... .................. GRAZING AND HAY
p q CROPLAND 1 (Wheat or other crops)
ORIGINAL PLANT BOUNDARY (1951 - 1974)
ROCKY FLATS PLANT BOUNDARY (1974 - Present)
-- --
Divisions within a particular land use area indicate landholdings. Multiple patterns indicate rotating or multiple uses.
I
CIRCLES ARE AT ONE MILE INTERVALS FROM PLANT CENTER
I - 0 , 1 2
(I MILES I I
FIGURE 3-3 AGRICULTURAL LAND USES - 1960

LEGEND PREDOMINANT LAND USES
............. ............. .......................... .......................... [-I GRAZING AND HAY
mj CROPLAND ' (Wheat or other crops)
!I I
-e--- ORIGINAL PLANT BOUNDARY (1951 - 1974)
---- ROCKY FLATS PLANT BOUNDARY (1974 - Present)
Divisions within a particular land use area indicate landholdings. M;ultiple patterns indicate rotating or multiple uses.
CIRCLES ARE AT ONE MILE INTERVALS FROM PLANT CENTER
~
01 1 2 MILES I1
I
I
FIGURE 3-4 AGRICULTURAL LAND USES - 1970
' I
it

LEGEND 1 PREDOMINANT LAND USES
.............. ............. ............. ............. ............. ............. ............ ............. r-1 ............. ............. ............. GRAZING AND HAY
HAY
m] CROPLAND 1 I (Wheat or other crops)
----- ORIGINAL PLANT BOUNDARY
---- ROCKY FLATS PLANT BOUNDARY
(1951 - 1974)
(1974 - Present)
Divisions within a particular land use area indicate landholdings. Multiple patterns indicate rotating or multiple uses.
I
I 'I
CIRCLES ARE AT ONE MILE INTERVALS FROM PLANT CENTER
0 1 2 I MILES
FIGURE 3-5 ' AGRICULTURAL LAND USES - 1980
I

TASK 7 REPORT April 1994 Page 28 Historical Land Use
e Along the south side of Highway 72, within the study area, are located the Great Western Inorganics and Thoro Chem Superfund Site, and the former Tosco Oil and Gas site, later the proposed site for the Jefferson Center Planned Unit Development (PUD) offices.
3.3.2 Results of Analysis of USGS Quadrangle Maps
As discussed in Section 2.1.2, maps of land sections in each USGS topographic quadrangle within .the study area were reviewed to quantify the number of dwellings or places of employment, barns or warehouses, surface water features, industrial activities such as mines, and traffic routes.
Appendix B presents the result of map review, chronologically by quadrangle. To simplify the review process, a compass direction of NW, NE, SE, or SW was added to the land section number to define relative direction from the plant within the five-mile-radius study area. As shown in Figure 2-2, four sections designated as 19 are within the five-mile study area because the complete numbering system includes a range, township, and section number. Since only two sections are numbered 7, a direction code of E, W, N or S was included to define location within the study area.
Appendix B can be referred to for specific information related to historical land use.
3.3.3 Habitat Studies
Several habitat studies have been completed in the Rocky Flats area. Results show that most deer in the area tend to stay within the plant boundary. Of the tagged deer followed in one study, only two deer left the site. It appears that there is not a measurable game harvest within the study area (Alldredge, 1990).
3.3.4 Historical Water Use
Information on historical water usage for Great Western Reservoir was collected. Great Western was constructed in 1904 and used for irrigation until 1955. Since 1955, the treated water has been the City of Broomfield’s municipal water supply. Public access to Great Western has been limited since at least 1971. Recreational activities such as fishing and boating have not been permitted. Presently, the area is fenced and posted to exclude the public (Schnoor, 1991).
Standley Lake was constructed between 1907 and 1912. From 1914 to 1966, water from Standley Lake was used only for irrigation. In 1966, the water was first used for drinking by the City of Westminster. Presently, the cities of Westminster, Northglenn, and Thornton own two-
0202ALR2

TASK 7 REPORT April 1994
Historical Land Use Page 29
thirds of the water rights. Water used for domestic purposes is conventionally treated. The other third is transported via irrigation ditches to agricultural areas northeast of Standley Lake between Broomfield and Fort Lupton (Tipton and Kalmbach, 1989).
Water from Mower Reservoir was first used for irrigation in 1872. The current uses of the water are agricultural, stock watering, domestic lawn watering, and irrigation of 80 acres. Mower Reservoir water has never been treated (State of Colorado, 1973).
0202ALR2
TASK 7 REPORT April 1994 Page 30 Historical Land Use
This page intentionally left blank.
0202ALR2

TASK 7 REPORT April 1994
Page 31 Historical Population Within the Study Area -D
4.0 HISTORICAL POPULATION
Population was estimated for the period 1950 through 1990 based primarily on U.S. Department of Commerce, Bureau of the Census data. Because of limitations of census data for rural areas such as the area within five miles of the Rocky Flats plant, other information sources used included historical topographical quadrangle maps, local growth rates, household size data, and geographical and local historical data.
4.1 U.S. Bureau of Census Population Statistics
Most of the study area was located on the fringe of the Denver SMSA throughout the period 1950-1990. Population in the Denver SMSA has increased throughout the period, putting more development pressure on areas near the foothills. The population within five miles of the Rocky Flats plant primarily consists of rural residents. Since population data in low-density areas are consolidated into geographically large tracts for enumeration purposes, population distribution is difficult to estimate for small, low-density areas.
In addition, the format of census data has changed throughout the study period. Various reporting units include county, city, census tract, minor civil division, enumeration district, and census block. For the purposes of this study, the most detailed data format available for each census year was used to identify population within the area. In every census year, the geographical boundaries of some census units (tracts, blocks, etc.) were changed, especially in response to growth within a unit. Therefore, it is difficult to accurately determine changes in the study area population over time.
In 1950, the study area was divided into minor civil divisions, which were slightly more detailed than census tract data. Census tracts have an upper population limit of 4000 if they are not divided into enumeration districts or blocks. In 1960, census data were provided by census tracts, which represented areas extending well beyond the study area.
As populations in portions of the study area further increased, more specific population data were presented by census block. Census block information did not become available until 1970 in the area, and was available for only the eastern portion of the study area. In addition to limited census block information, enumeration districts also provided a more detailed look at population in the area in the 1970 and 1980 census years. It was not until 1980 that census block statistics became available for a large portion of the study area. However, census data for the western half of the study area still were only available in census tract and enumeration district formats, which represented an area from the Jefferson CountyA3oulder County line to the city limits of Golden. For the 1990 census, the entire United States was divided into blocks.
0202ALR2

TASK 7 REPORT April 1994 Page 32 Historical Population Within the Study Area
Table 4-1 illustrates the difficulty in assigning tract population to smaller areas when no block groups exist. The table presents population statistics for each minor civil division or census tract even partially included in the study area. In this table, the entire census unit population is presented, with no adjustments, from block data or topographical maps.
Minor census divisions or census tracts with large portions located outside the study area are indicated in the Table by an asterisk. For example, census tract 98 in 1960 is geographically much larger than the study area, and no block data exist for 1960. Therefore, the 1960 total population in the five mile vicinity of Rocky Flats in 1960 is grossly inflated if the entire tract population is included. Population in tracts 98.20, 98.21 and 98.15 for 1990 includes growth in incorporated areas outside the Smile study area, also inflating the total population in 1990.
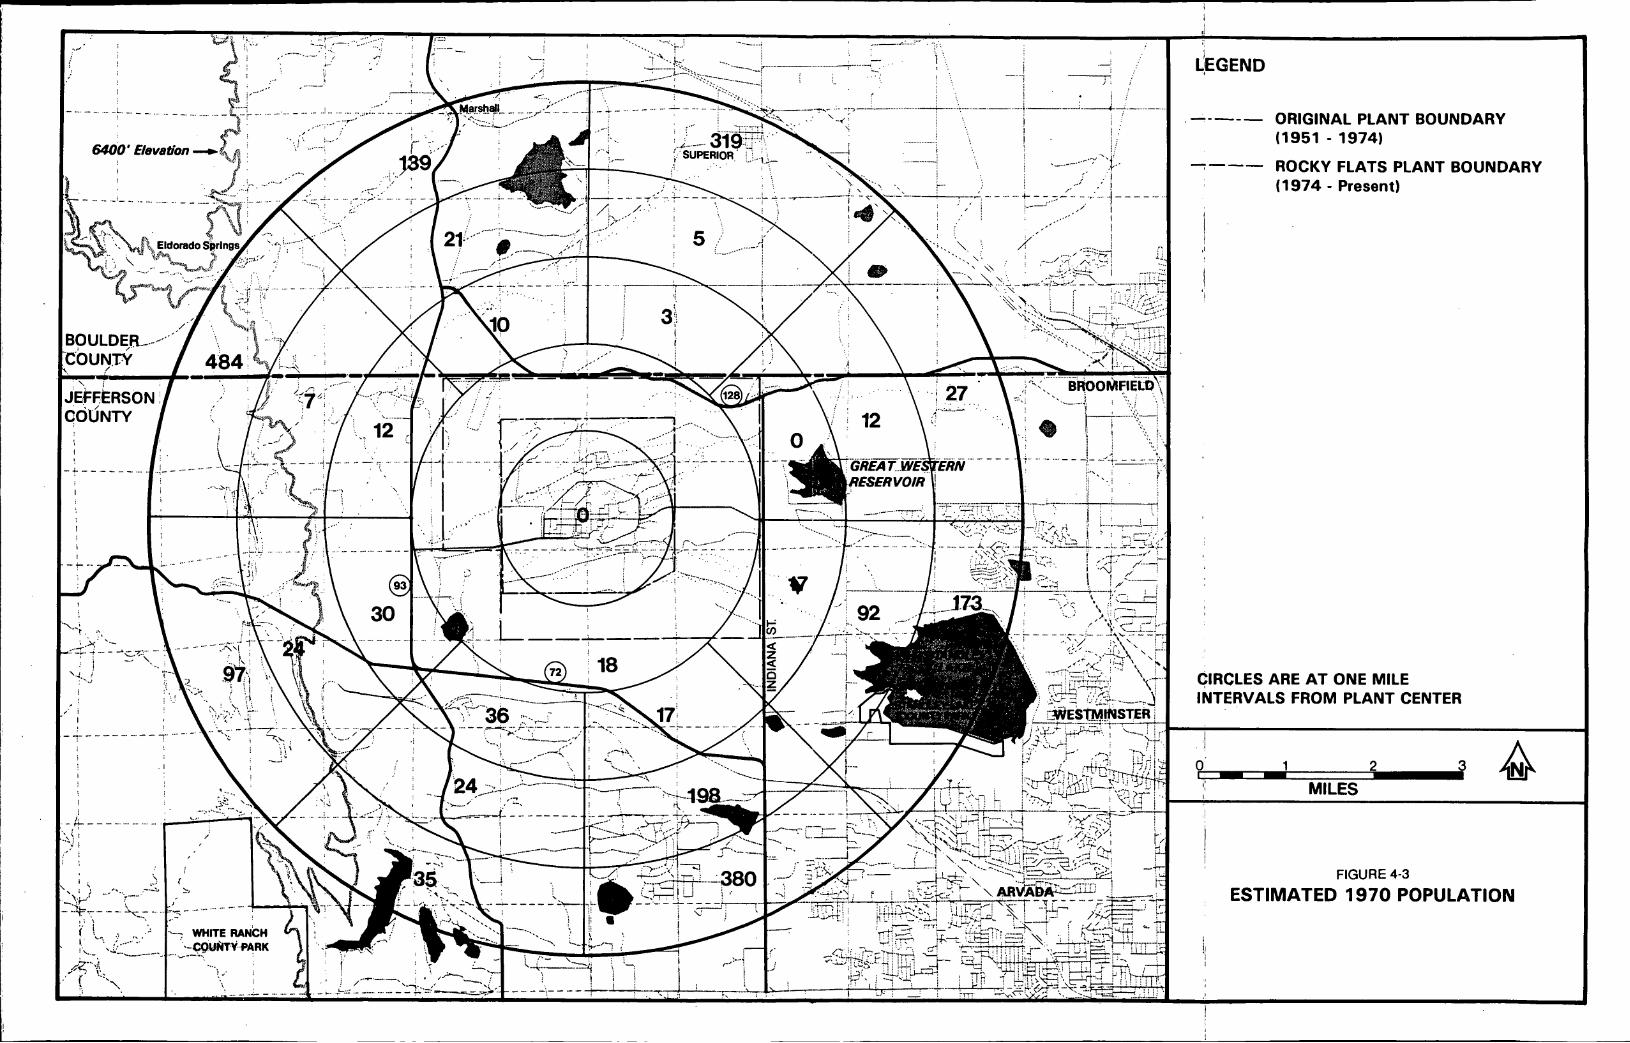
Because of the difficulty in estimating historical population within the study area using census data alone, a best estimate approach was taken using a combination of available statistical information and professional judgement for the census years 1950 through 1980. In addition to the most detailed level of U.S. Census of Population data available for each census year (USDOC, 1950-1980), three other information sources were used to estimate population: 1) USGS 7.5-minute quadrangle maps showing residential units, for the years closest to each census year, 2) annualized growth rates, projected from local area growth rates and overall population increases in the area, and 3) professional judgement using topographical information, geographical limitations, and historical information.
Figures 4-1 through 4-5 present the estimated numbers of persons living within a five-mile radius of the Rocky Flats plant for the years 1950, 1960, 1970, 1980, and 1990. For the years 1950 through 1980, a map of the study area showing the five concentric rings at one-mile intervals was manually overlaid on the 1950 minor civil divisions-election precinct map, the 1960 census tract map, and the 1970 and 1980 census block maps. In most cases, the concentric rings of the study area did not coincide with the census defined areas, therefore assumptions regarding the population within each segment of the study area were devised.
In some cases where no detailed census information was available for a study area segment, topographical maps were used to identify clusters of residences or sole family farms. A household size factor was then applied to the total number of residences based on historical household size statistics.
In cases where no information was available for an area, but population within that area during a previous decade was shown, a growth factor was applied and the previous population figure was compounded.
0202ALR2

TABLE 4-1
Date County Division Population
1950 Jefferson
Boulder
13 19 1
26 11 12 14
27 28
364 52 1 934 723
1,072 933 90
97 250
7 465 1950 TOTAL 5,449
Tract
1960 Jefferson (98*) 8,885
Boulder
1960 TOTAL
7 8 11
6,534 1,859 4.677
21,955
1970 Jefferson 98.02 (98.03*) (98.08*)
1,461 2,543 2,248
Boulder 125.06 6,486 127.04 492 131.02 159
1970 TOTAL 12.389
1980 Jefferson
Boulder
1980 TOTAL
98.13 98.15 98.03
(98.08*)
125.10 127.04 131.02
1,094 750
2,025 2,092
3,787 519 174
10,441
1990 Jefferson
Boulder
1990 TOTAL
98.20 (98.21 *) 98.15 98.19
(98.08*)
125.10 127.04 131.02
10,438 8,042 2,725 7,666 3,560
4,385 509
* Large portions of this census unit are located outside the study area.
U2D2ALR3

.--.I ........... - ....... -. .... ._ -. ...
6400' Elevation
: . . . . . . . . , . . . . i . . . . . . .
.. ................... ......... . _,_._._. -*,- i;- . . i : - . 1 . . . 2
i !
: ! . . . . : . . . . .
. . i . : : . .
.. \ ' : . .. - < I
LEGEND
ORIGINAL PLANT BOUNDARY ----- I (1951 - 1974)
-I-- ROCKY FLATS PLANT BOUNDAY (1 974 - Present)
CIRCLES ARE AT ONE MILE INTERVALS FROM PLANT CENTER
I I - 0 ' 1 2
I MILES
FIGURE 4-1
j ESTIMATED 1950 POPULATION
,i

LEGEND
*I
ORIGINAL PLANT BOUNDARY (1951 - 1974)
ROCKY FLATS PLANT BOUNDARY (1 974 - Present)
CIRCLES ARE AT ONE MILE INTERVALS FROM PLANT CENTER
1 2 MILES
I 0 '
1
FIGURE 4-2 : ESTIMATED 1960 POPULATION
I
GEGEND
ORIGINAL PLANT BOUNDARY (1951 - 1974)
ROCKY FLATS PLANT BOUNDARY (1 974 - Present)
CIRCLES ARE AT ONE MILE INTERVALS FROM PLANT CENTER
I
I 0 1 2
1: MILES
FIGURE 4-3
ESTIMATED 1970 POPULATION

. . -7 :
,; : :
I : 4-
. . : . _ ......... i .-. i . .
! ! ._.___.. -. ,
.........
, . ..I _ I
," _. ........ +. - - ~- ..... .-: .... : .I, ;__.._., /
,.,I'
. . . . . . t : . . : . . . . . , i: i . .r '
' I I
i ..I - -
1
- ....
& - - - .................. ( i , .
i i
, ' i . . . . . :-....I,
Yi.7 -" .~ .::
i'\.,- ..i: .
\ ,: . ..;I- ..........
, > 5. , I
.,., :: ,.:: ......... . .
LEGEND
ORIGINAL PLANT BOUNDARY (1951 - 1974)
, ---- I
! ROCKY FLATS PLANT BOUND-RY (1 974 - Present)
CIRCLES ARE AT ONE MILE INTERVALS FROM PLANT CENTER
I
1 MILES
I 04 1 2 9
FIGURE 4-4
I ESTIMATED 1980 POPULATION

. . ........ i L A
. .
. .
......... _..__-.- ' ' . f ' : ' > . . , .,, , ' ,
.... ........... 1.- - - - - c- - _ _ - ..... ,**' I __--
_.,'I I
I QEGEND
I
ORIGINAL PLANT BOUNDARY (1951 - 1974)
ROCKY FLATS PLANT BOUNDARY (1 974 - Present)
I
CIRCLES ARE AT ONE MILE INTERVALS FROM PLANT CENTER
I
0 : 1 2 MILES I
FIGURE 4-5 I ESTIMATED 1990 POPULATION
!

Historical Population Within the Study Area
TASK 7 REPORT April 1994
Page 39
In other cases where specific information from census statistics was not available, an arbitrary allocation of census tract population was distributed within the study area segment, based on geographical limitations and historical information, personal interviews, or professional judgement.
The 1950-1980 population estimates shown in Figures 4-1 through 4-4 have not been closely cross-checked with all available population data, including the USGS topographic maps. These estimates are preliminary and are likely to have large margins of error.
For the 1990 population estimates, a computerized Geographic Information System (GIS) was used to develop a map of the study area, with TIGER System census block data overlaid (Geoquest, 1993). The total population of each segment of the study area was determined by totaling the population of all of the blocks within each segment. Where census block boundaries did not coincide with study area boundaries, an allocation of the population was made according to the percentage of the census block geographically within the study area. In other words, if 75 percent of the census block fell within a study area segment, then 75 percent of the population of that census block was allocated to that segment. Over 460 census blocks fell either partially or completely within the five-mile-radius study area. The 1990 population estimates are considered fairly accurate, because of the level of detail available and relative ease in handling the 1990 census data.
I
Throughout the years 1950- 1990, the five-mile-radius study area around the Rocky Flats plant has changed little, except for the eastern area near the incorporated cities of Westminster, Arvada, Broomfield, Lafayette, and Louisville. The study area around the plant has retained its rural character, except for two high-density subdivisions, Countryside and Walnut Creek, on the eastern boundary, and some higher density residential areas in the southeastern quarter of the study area. The Countryside subdivision was platted from 1974 through July of 1975 by Witkin Homes, Jack Witkin, President. Walnut Creek was platted in March of 1970 by Walnut Creek Development, Thomas G. Bonar, President (Reed, 1992).
4.2 Analysis of Topographical Quadrangle Maps
Because of the limited availability of detailed Census Bureau statistics for the study area, another source of information was used to provide an indication of the population in rural areas. USGS topographical quadrangle maps were reviewed to determine the historical numbers and locations of residences, in an effort separate from the development of population estimates presented in Figures 4-1 through 4-5. Topographical maps were not reviewed for years after 1980 due to the availability of detailed 1990 census block data. As discussed in Section 2.1.2, Appendix B documents the topographical map review process. Appendix B also includes land use information derived from the topographical maps, including the presence of surface water features, streets,
0202ALR2

TASK 7 REPORT April 1994 Page 40 Historical Population Within the Study Area
schools, churches, cemeteries, industrial facilities, and railroad stations within each section of land.
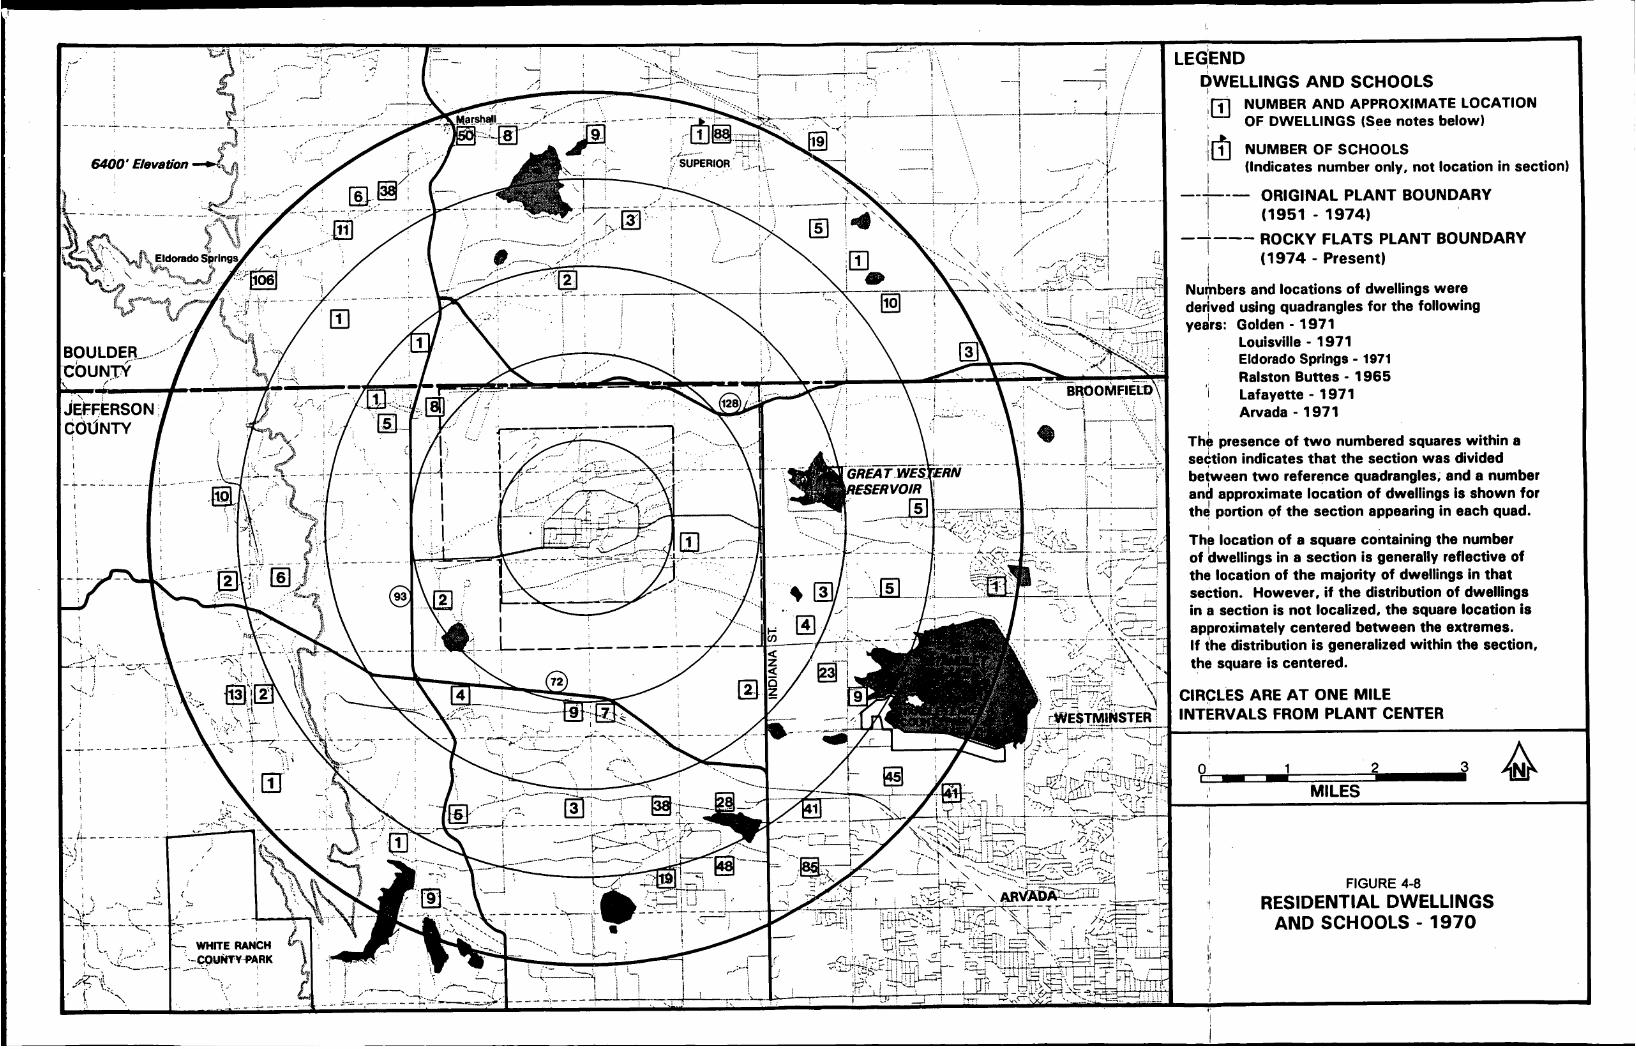
Figure 4-6 through 4-9 present the numbers and approximate locations of dwellings and schools for 1950 through 1980, as indicated on the USGS maps. It is important to note that population estimates that might be derived from Figure 4-6 through 4-9, for instance by multiplying a likely number of persons per household by the number of residences in an area, may not agree with the estimates derived from census data and presented in Figures 4-1 through 4-4. Further refinement of estimates would be required to resolve these discrepancies. Census data, USGS quadrangle maps, annexation maps, and county records could be reviewed in more detail, and additional residents interviewed, in any future demographic reconstruction efforts.
0202ALRZ
I ~<

3
LEGEND DWELLINGS AND SCHOOLS
NUMBER AND APPROXIMATE LOCATION I
'Q NUMBER OF SCHOOLS
OF DWELLINGS (See notes below)
(Indicates number only, not location in section) i
ORIGINAL PLANT BOUNDARY
ROCKY FLATS PLANT BOUNDARY (1974 - Present)
----- I (1951 - 1974) (I I ----- I
Numbers and locations of dwellings were derived using quadrangles for the following years: Golden - 1939
l Louisville - 1950 ; Eldorado Springs - 1942
Ralston Buttes - 1948 r Lafayette - 1956
Arvada - 1950
The presence of two numbered squares within a section indicates that the section was divided between two reference quadrangles, and a number and approximate location of dwellings is shown for the portion of the section appearing in each quad.
The location of a square containing the number of dwellings in a section is generally reflective of the location of the majority of dwellings in that sectibn. However, if the distribution of dwellings in a section is not localized, the square location is approximately centered between the extremes. If the distribution is generalized within the section, the square is centered.
CIRCLES ARE AT ONE MILE INTERVALS FROM PLANT CENTER
- I
I MILES
11
01 1
I FIGURE 4-6
I , RESIDENTIAL DWELLINGS AND SCHOOLS - 1950

LEGEND DWELLINGS AND SCHOOLS
NUMBER AND APPROXIMATE LOCATION OF DWELLINGS (See notes below)
(Indicates number only, not location in section) fi NUMBER OF SCHOOLS
ORIGINAL PLANT BOUNDARY
ROCKY FLATS PLANT BOUNDARY
'i I
----- (1951 - 1974)
I ----- I (1974 - Present)
Numbers and locations of dwellings were derived using quadrangles for the following years: Golden - 1957
Louisville - 1957 Eldorado Springs - 1942 Ralston Buttes - 1965 Lafayette - 1956 Arvada - 1957
The presence of two numbered squares within a section indicates that the section was divided between two reference quadrangles, and a number and approximate location of dwellings is shown for the portion of the section appearing in each quad.
The location of a square containing the number of, dwellings in a section is generally reflective of the location of the majority of dwellings in that sechon. However, if the distribution of dwellings in a section is not localized, the square location is approximately centered between the extremes. If the distribution is generalized within the section, the square is centered.
CIRCLES ARE AT ONE MILE INTERVALS FROM PLANT CENTER
I
0" - - 1
MILES
FIGURE 4-7 I RESIDENTIAL DWELLINGS
AND SCHOOLS - 1960
1
I.
,EG:END DWELLINGS I AND SCHOOLS lm NUMBER AND APPROXIMATE LOCATION
, OF DWELLINGS (See notes below)
NUMBER OF SCHOOLS (Indicates number only, not location in section)
I
I (1951 - 1974) ORIGINAL PLANT BOUNDARY
ROCKY FLATS PLANT BOUNDARY (1974 - Present)
NuLbers and locations of dwellings were derived using quadrangles for the following years: Golden - 1971
I -----
1 ----- I
Louisville - 1971 Eldorado Springs - 1971 Ralston Buttes - 1965 Arvada Lafayette - 1971 - 1971 ' 1
The presence of two numbered squares within a section indicates that the section was divided between two reference quadrangles, and a number and approximate location of dwellings is shown for thd portion of the section appearing in each quad.
The location of a square containing the number of 'dwellings in a section is generally reflective of the location of the majority of dwellings in that section. However, if the distribution of dwellings in a section is not localized, the square location is approximately centered between the extremes. If the distribution is generalized within the section, the square is centered.
I
CIRCLES ARE AT ONE MILE INTERVALS FROM PLANT CENTER
I I
0 1 I MILES
I FIGURE 4-8 I RESIDENTIAL DWELLINGS
AND SCHOOLS - 1970

LEGEND I
DWELLINGS AND SCHOOLS ' NUMBER AND APPROXIMATE LOCATION
OF DWELLINGS (See notes below)
' @ NUMBER OF SCHOOLS I (Indicates number only, not location in section) I
I ORIGINAL PLANT BOUNDARY I I -----
(1951 - 1974) I
ROCKY FLATS PLANT BOUNDARY ----- I (1974 - Present)
Numbers and locations of dwellings were derived using quadrangles for the following years: Golden - 1980
Louisville - 1979 Eldorado Springs - 1975 Ralston Buttes - 1976
Arvada - 1980 I Lafayette - 1979
The presence of two numbered squares within a section indicates that the section was divided between two reference quadrangles, and a number and approximate location of dwellings is shown for the portion of the section appearing in each quad.
T(e location of a square containing the number of 'dwellings in a section is generally reflective of the location of the majority of dwellings in that section. However, if the distribution of dwellings in a section is not localized, the square location is approximately centered between the extremes. If the distribution is generalized within the section, the square is centered.
CIRCLES ARE AT ONE MILE INTERVALS FROM PLANT CENTER
I
I
2 3 0 ' 1 , MILES
FIGURE 4-9 RESIDENTIAL DWELLINGS
I
I AND SCHOOLS - 1980 I
1,

References
TASK 7 REPORT April 1994
Page 45
5.0 REFERENCES
Alldredge (1 990). Department of Radiology.
Boulder County (1 991). Boulder County Assessor’s Office. Boulder Assessor S-T-R List of Tax Class as an Indicator of Potential Land Use. Database search performed February 28, 1991. Repository Document PO-962.
Chad (1991). Personal communication with Chad of Landis Photography, Denver.
ChemRisk (1991). ChemRisk Division of McLaren/Hart. Task 7 Draft Plan. Reconstruction of the Demography of the Area Surrounding the Rocky Flats Plant. January 1991. Repository Document TW-214.
Eckles (199 1). Personal communication with Jim Eckles, Colorado State University Department of Agronomy.
Personal communication with Bill Alldredge, Colorado State University
Geoquest (1 993). Geoquest Information Technologies, Inc. Rocky Flats Area Estimated 1990 Population. Prepared for ChemRisk Division of McLaren/Hart. Littleton, Colorado. December.
Jefferson County (1 991 a). Jefferson County Assessor’s Office. Jefferson Assessor S-T-R List of Tax Class as an Indicator of Potential Land Use. Database search performed February 28, 1991. Repository Document PO-963.
Jefferson County (1 991 b). Jefferson County Clerk and Recorder (Kathy Seawall). Deeds of Sale for Land Sections within the Current Rocky Flats Plant Buffer Zone: 1950-1976. Repository Document PO-964.
Kathol (1991). Kathol, J. Correspondence Related to the Toxicological Review and Dose Reconstruction Project for the Rocky Flats Plant. Repository Document PO-967.
Polisky, Weber, and Satterfield (1 990). Personal communications with Greg Polisky, Dave Weber, and Jim Satterfield of the Colorado Division of Wildlife.
Reed (1992). Department.
Personal communication with Doug Reed of the Jefferson County Planning
Schoonveld (1 992). Wildlife.
Personal communication with Gene Schoonveld, Colorado Division of
0202ALR2

TASK 7 REPORT April 1994 Page 46 References
Schnoor (1991). June4, 1991.
Schnoor, K. Letter from the City of Broomfield to ChemRisk dated
Spencer (1 99 1). Agricultural Economics Department.
Personal communication with Bill Spencer, Colorado State University
State of Colorado (1973). Water Rights Application. In the Water Court in and for Water Division I, State of Colorado, Case No. W-3166. October 4, 1973.
Tipton and Kalmbach (1 989). Tipton and Kalmbach, Inc. Consulting Engineers, Interim Engineering Report, Change of Water Rights for City of Westminster, Case Nos 86CW397, 88CW267, and 89CW129. Repository Document PO-638.
USDOC (1950). U.S. Department of Commerce, Bureau of the Census. U.S. Census of Pomlation: 1950. Census Tract Statistics, Denver, Colorado. Selected Population and Housing Characteristics. Repository Document PO-433.
USDOC (1950-1987). Census of Apriculture by Countv. Farms, Land in Farms, and Land Use for 1950, 1954, 1959, 1964, 1969, 1974, 1978, 1982, 1987. Repository Document PO-438.
USDOC (1954). US . Department of Commerce, Bureau of Census. 1954 Census of Agriculture.
USDOC (1960). U.S. Department of Commerce, Bureau of the Census. U.S. Census of Potmlation: 1960. Census Tract Statistics, Denver, Colorado. Age, Color, and Marital Status of the Population, by Sex, by Census Tract: 1960. Repository Document PO-434.
USDOC (1964). U.S. Department of Commerce, Bureau of Census. 1964 Census of Agriculture.
USDOC (1 969). U.S. Department of Commerce, Bureau of Census. 1969 Census of Agriculture.
USDOC (1970). U.S. Department of Commerce, Bureau of the Census. Census of Population and Housing. General Characteristics of the Pomlation: 1970. Repository Document PO-435.
Census Tract Statistics, Denver, Colorado.
USDOC (1974). U.S. Department of Commerce, Bureau of Census. 1974 Census of Agriculture.
USDOC (1978). U.S. Department of Commerce, Bureau of Census. 1978 Census of Agriculture.
0202ALR2

References
TASK 7 REPORT April 1994
Page 47
USDOC (1980a). US. Department of Commerce, Bureau of the Census. Census of PoDulation and Housing. Census Tract Statistics Denver, Colorado SMSA. Characteristics of Persons: 1980. Repository Document PO-436.
USDOC (1980b). U.S. Department of Commerce, Bureau of the Census. 1980 Census of Housing. Block Statistics Denver, Colorado Urbanized Area and Block Statistics Selected Areas in Colorado. Characteristics of PoDulation and Housing; Units, by Block. Repository Document PO-436.
USDOC (1990). U.S. Department of Commerce, Bureau of the Census. 1990 Census of Population. Census Tract Statistics, Denver, Colorado SMSA. Housing Characteristics by Census Tract and Population by 5 Year Age Groups for Census Tracts. Repository Document PO-437.
USGS (1939-1 980). U.S. Geological Survey. Topographical Quadrangle Maps Covering the Area Within Five Miles of the Rocky Flats Plant: 1939-1980. Repository Document PO-965.
USGS (1991). U.S. Geological Survey. National Mapping Program Topographical Map Symbols. National Mapping Division. Repository Document PO-966.
Vacher (1991). Personal communication with Roland Vacher, combined Jefferson and Boulder County Agricultural Stabilization and Conservation Service.
Wheeler (1991). Personal communication with Delani Wheeler, Boulder County Open Space Planner.
Williams (1 991). Personal communication with Ardy Williams, combined Jefferson and Boulder County Agricultural Stabilization and Conservation Service.
0202ALR2


QUESTIONNAIRE FOR NEARBY RESIDENTS OF ROCKY FLATS
NAME(S) DATE
ADDRESS INTERVIEWER
PHONE
1.
2.
3.
4.
5 .
6.
How long have you lived at the current address? In the vicinity of Rocky Flats? What was your previous address?
Do you know who lived here (or owned the land) before you? Do you know how we could contact them?
What has your occupation been between 1950 and 1990?
Do you have any farm animals (cows, pigs, chickens, sheep)? How many of each?
Have you had any farm animals since 1950? From when to when?
Did you or anyone else drink their milk or eat their meat? If yes, did you drink milk and eat meat from other sources (e.g. ,store bought)? What percentage of each (home grown vs. store bought)?
7. Did the cows graze on your property? Nearby property? Was the cow feed grown on your property? Nearby property? bchased locally?

8.
9.
10.
11.
Do you have a garden? What type of vegetables do you grow? [Looking for root @otato,carrot), stalky (celery, wild asparagus), and leafy (lettuce)]. What is the growing season here? How many of each vegetable do you grow per season? If you do not grow a garden now, did you ever have a garden between 1950 and the present?
Is there a ground water well on your property? Nearby? How is it used (e.g, for drinking, farm animals, water garden)? Do you tap water from surface water sources?
Do you hunt or fish locally? What animals/fish? Where? Do you eat what you hunt or catch?
Do you have any information on what the land around the Rocky Flats Plant, now called the Buffer Zone, was used for prior to 1974?
0202ALR4


APPENDIX B TOPOGRAPHICAL QUADRANGLE MAP ANALYSIS

.....
2 mile radius 3 16W 9 w
3 mile radius 18 E
4 mile radius 8 E 27 N 26 N
24 N (Superior) 17 E
30 NE 23 N 22 N
5 mile radius 19 NE 29 NE 32 NE
2 1 ow( Marshall) 20NW
APPENDIX B Topographical Quadrangle
Map Analysis
1 ( 0 ) sw unimproved dirt 2 (1) S unimproved dirt
1 ( 1 ) SE unimproved dirt
3 (1) E Simms 2 (1) SE unimproved dirt 3 (3) NE/W imp/unimp dirt
2 (1) SE unimproved dirt 5 (2) E S. 88th St.
53 (2) NE improved dirt 2 & 1
5 (0) NW Hwy 170
10 (2) N & E Alkire & Dillon 1 ( 2 ) W S. 88th St.
15 (0) NE Hwys 170 & 93 4 (0) SE Hwy 398
1

2 mile radius 3 4
5 w 16W
3 mile radius 18 E 33NW
4 mile radius 8E 27 N 26 N
24 N (Superior) 17 E
30 NE 23 N 22 N
5 mile radius 19 NE 29 NE 32 NE
21 nw(Marshal1) 20 NW
1 (0) sw unimproved dirt
1(1) SE 3 (1) center unimproved dirt
1(1) SE unimproved dirt 1(1) NW Hwy 93
3 (5) E Simms 2 (1) SE unimproved dirt 2 (3) NE/W unimproved dirt
W/E unimproved dirt E S. 88th St.
57 (10) NE improved dirt 2 & 1 4 (3) 3 (5)
6 (0) NW Hwy 170
8 (16) N and E Dillon & Alkire 1(2 ) W S. 88th St. 7 (0) N Coalton Drive
23 (1) NE 11 (0) SE Hwy 398
2

2 mile radius 3 4
5w 11 12 14
16W
3 mile radius 6E 7E
18 E 33N
I 4 mile radius 8E 27 N 26 N
24 N (Superior) 28NW 17 E
30 NE 23 N 22 N
5 mile radius 19 N E 29 N E 32 NE
2 1 nw(Marshal1) 20 NW
s w unimproved dirt 0 (3) 5 (4) NW Hwy 93 3 (0) SE
center by claypit 0 (2)
1 (3) SE unimproved dirt 1 ( 1 ) NW Hwy 93
2 (4) NE/E Simms 1 ( 1 ) SE 2 (2) N unimproved dirt
64 (10) NE
5 ( 6 ) E and W 3 (4) E 88th
7 (0) NW
2 &1
N and E 9 (10) 1 (3) W 88th 4 (3) N Hwy 128
38 (1) N E & NW Hwys 398 & 170 28 (0) SE Hwy 398
3

2 mile radius 3 4
5w 11 12 14
16W
3 mile radius 6E 7E
18 E 33N
4 mile radius 8E 27 N 26 N
24 N (Superior) 28NW 17 E
30 NE 23 N 22 N
5 mile radius 19 NE 29 NE 32 NE
21 nw( Marshall) 2 0 N W
0 (3) sw ’ unimproved dirt 8 (4) NW Hwy. 93 5 (0) W off Hwy. 93
1 ( 0 ) sw unimproved dirt
2 (2) NW&cntr. W. gate & claypit
NE NE shoreline 1 ( 0 )
1 ( 1 ) NW 93 3 (3) E unimpr. & Alkire
5 (4) NE&SE light duty roads 2 (1) SE 3 (3) N
88 (8) NE l & l
5 (5) W/E 5 (4) N/E 9 (2) center unimproved dirt 8 (0) NW Hwy. 170
19 (10) N and E 1 ( 3 ) s w
10 (2) N 50 (1) NW&NE 38 (0) SE Hwy. 398
4
i

I 2 mile radius 3 11 12 14
1 6 W 4 w 5w 13E
3 mile radius 6E 7E
18 E 33N
4 mile radius 8E( West mins t) 27 N 26 N
24 N (Superior) 28NW 17 E
30 NE 23 N 22 N
5 mile radius 19 NE 29 NE 32 NE
2 1 nw( Marshall) 20NW
0 (3) s w plant property
1 (0) sw unimpr off Indiana
3 (2) W & cntr. w. gate road/claypit 26 (4) N impr betw 93 & 128 6 (1) W off Hwy. 93 2 (0) S unimpr off Indiana
1 (0) NE G.Western shore 3 (3) SE Alkire 1(1) W Hwy. 93
NE&SE SE N N
sw W and E N and E
NW NW
impr off 8:9 border along Coal Creek along Coal Creek
unimpr off Hwy. 93 Alkire/17:16 border
Alkire/unimpr off Alk unimpr off Hwy. 170
off Hwy. 170
21 (10) N and E Alk/Dillon/Superior 1 (3) W Alkire
10 (3) N W. 128th 50 (1) NW & NE Hwy.398/Marshall 42 (0) SE Hwy.398
5

3 mile radius 16W 13E
18SE 24SE 2 l S W
4 mile radius 2OSE 19SE 28SW 27s
26s (Leyden) 25s
5 mile radius 30SE 29SE (Thompson)
31SE 36s 33s
32SW
1 (0) unimproved dirt 4 (0) unimproved dirt 1 (0) unimpr 1 (0) unimpr
1 (0) unimpr
W. 82nd 2 (0) 5 (0) 3 (0) W. 8 2 n d
26 (2) W. 82nd 1 10 (0) W. 82nd
96 & Alkire/unimpr Wagner School
R R tracks/unimpr W. 82nd Denver View School
Hwy.72/unimpr Ralston Church Hwy.72/ W.72nd
unimpr off Hwy.93
6 mile radius 16sE
6
Hwy. 7 2 Ralston School

3 mile radius 16W 13E
18SE 24SE 2 1 s w
4 mile radius 2OSE 19SE 28SW 2 7 s
2 6 s (Leyden) 2 5 s
5 mile radius 30SE 29SE (Thompson)
31SE 36s 33s 35s
32SW
96th & Indiana 96th & Indiana/Alkire
unimpr off Indiana unimpr off Hwy.93
W.88th off Alkire unimpr/W.88th
unimpr off Hwy.93 W. 02nd W. 82nd
Hwy.72/unimpr
11 (3) 38 (20) 25 (25) 15 (16) 5 (4) 1(1)
W.82nd/Ind, Alk W.82nd/ W.80 th Indiana/W.72nd Indiana/ W.72nd
unimpr off Hwy.93 Tucker Lake
7

3 mile radius 16 W 13 E 18SE 23SE 24SE 2 l S W
4 mile radius 20SE 19SE 28SW 27s
26s (Leyden) 25s
5 mile radius 30SE 29SE (Thompson)
31SE 36s 33s 3 4 s 35s
32SW
Indiana/ AI kire
off Indiana off Hw93/off Hw72 by lake
2 (2) off Alkire 15 (5) U.Twln Lk/Alkire 4 (10) 1 (3) W. 8 2 n d
33 (2) W. 82nd 18 (17) W.82/Indiana/Hw72
off H w 93/off W82nd
W. 82nd W. 82nd/W. 80th Ind/Alk/W.72nd
Ind/W. 72nd off Hwy. 93
unimpr off Hwy. 93 Tucker Lake
8

3 mile radius 16W 13E
18SE 24SE 23SE 22SE 2lSW
4 mile radius 2OSE 19SE 28SW 27s
26s (Leyden) 25s
5 mile radius 30SE 29SE (Thompson)
31SE 36s 33s 35s
32SW
Indiana/Alkire off Indiana off Hw. 72 off Hw. 72
off Hw.93/off 72by lake
off Alkire and W.88th Alkire/U.Twin Lake off W.82/off Hw.93
W. 82nd W. 82nd
off W.82/Hw.72/Ind
W.82nd/off W.88th W.80/W.82/unimpr Ind/W.72/W. 78th
Indiana/off Quaker off Hw.93
off Quaker/Tuc. Lk. off Hwy. 93
9

3 mile radius 16W 13E
18SE 24SE 22s 23s
21sw
4 mile radius 2OSE 19SE 28SW 27s
26s (Leyden) 25s
5 mile radius 30SE 29se(Thompsn)
31SE 36s 33s 35s
32SW 34s
4 (7) S W & SE Indiana/ AI kire 2 (3) E off Indiana 11 (0) SE off Hwy.72 12 (0) sw off Hwy.72 4 (2) N and S off 93/72 by lake
9 (2) sw 88th and Alklre 23 (5) NE & S 96&Alk/U.Twin Lk. 6 (9) S off 82nd/off Hwy.93 3 (2) SE W. 82nd 38 (2) SE W. 82nd 30 (18) NE,E,S 82nd./Hw72/Indiana
S all
N &SW NE &SW
sw E
NE W
82nd/88th 80th/82nd/88th Ind/72nd/78 th Indiana/Quaker
off Hwy.93 Quaker/Tucker Lk.
off Hwy.93 off Hw93/off Quaker
10

3 mile radius 8W 5 w
32NW
unimpr off Hw.72 unimpr off Hw.93
unimpr off Hw.398
4 mile radius 18SW 4 (0) Hw72/unimp off72 Plainview School
5 mile radius 29NW 13W
12 W( Plainview) 1w
30nw( EldSpr) 20NW
31
Hw.398 Hawthorne School
unimpr off RR track far off Hw.93 off Hw.398
unimpr off Hw.398 S.Bldr. Div. Canal
11

3 mile radius 8W 5W
32NW
4 mile radius 18SW
5 mile radius 29NW 13W
1 2W(Plainview) 1w
30nw(EldSpr) 2ONW
31
unimpr off Hw.72 unimpr off Hw.93
unimpr off Hw.398
4 (3) Hw72/unimp off72
Hw.398
unimpr off RR track f a r off Hw.93 off Hw.398
unimpr off Hw.398 S.Bldr. Div. Canal
1 2


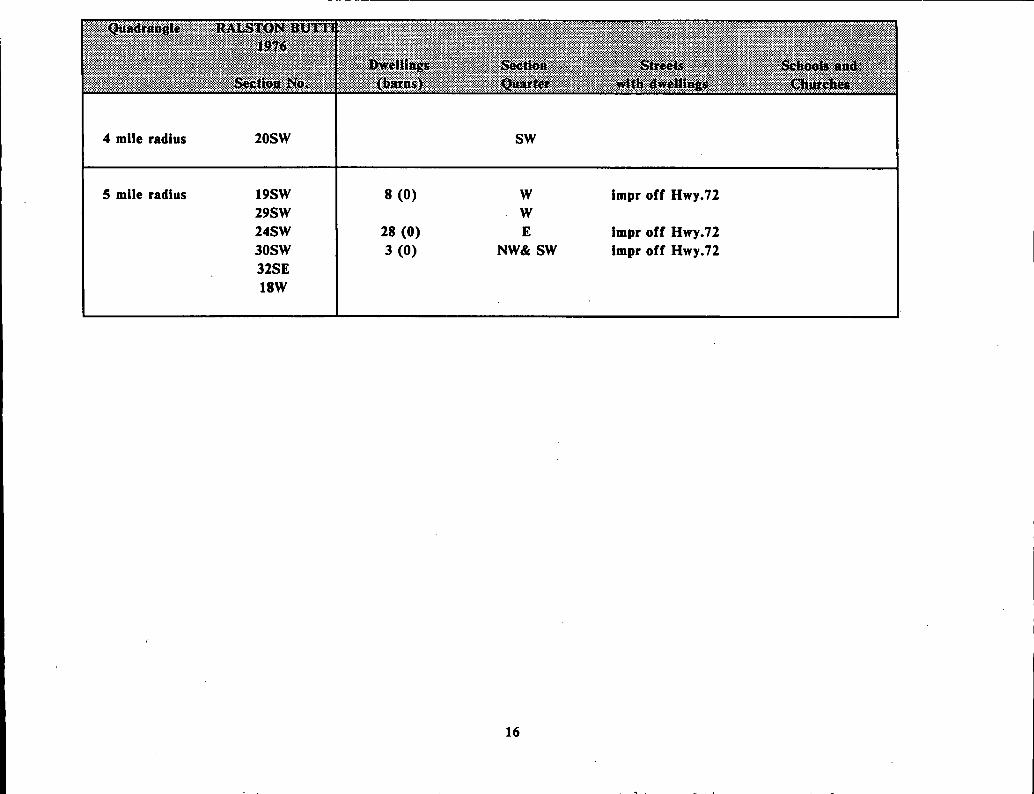

... .... ... ... . ...
5 mile radius 28NE 33NE
4E 9E 16E
5 mile radius 28NE 33NE
4E 9E 16E
along RR tracks
W. 100th
W. 108th Ave. shown W. 100th
17 .

5 mile radius 28NE 33NE
4E 9E 16E
5 mile radius 28NE 33NE
4E 9E 16E
W. 120th Aye.
W. 100th
0 (9) 5 W. 120th
streets w/no dwells 1 x 2 ) E W. 100th
18

0
0
u P)
u
Y
Y v)
a
0
0
P)
c.
v! w
d E a
n
00
E 0
0
a4
.I
Y
Y (A
s a 4
Y
B a v)
.I
0
2 n
2
In VI

a 0
0
a#
.- CI Y cn
rc, 0
00
L4 a z e

2 mile radius 3 16W 9 w
3 mile radius 18 E
4 mile radius 8 E 27 N 26 N
24 N (Superior) 17 E
30 NE 23 N 22 N
5 mile radius 19 NE 29 NE 32 NE
2lnw(Marshall) 2ONW
Capitol Mine 93 is med. duty road
Sang’s Ditch
Pluto No. 2 Mine 100th Ave. is impr dirt
2 aban’d mines Cracker Jack No. 2 Mine vlarshail Lake
Superior Cemetary
Coalton Dr is impr dirt
21
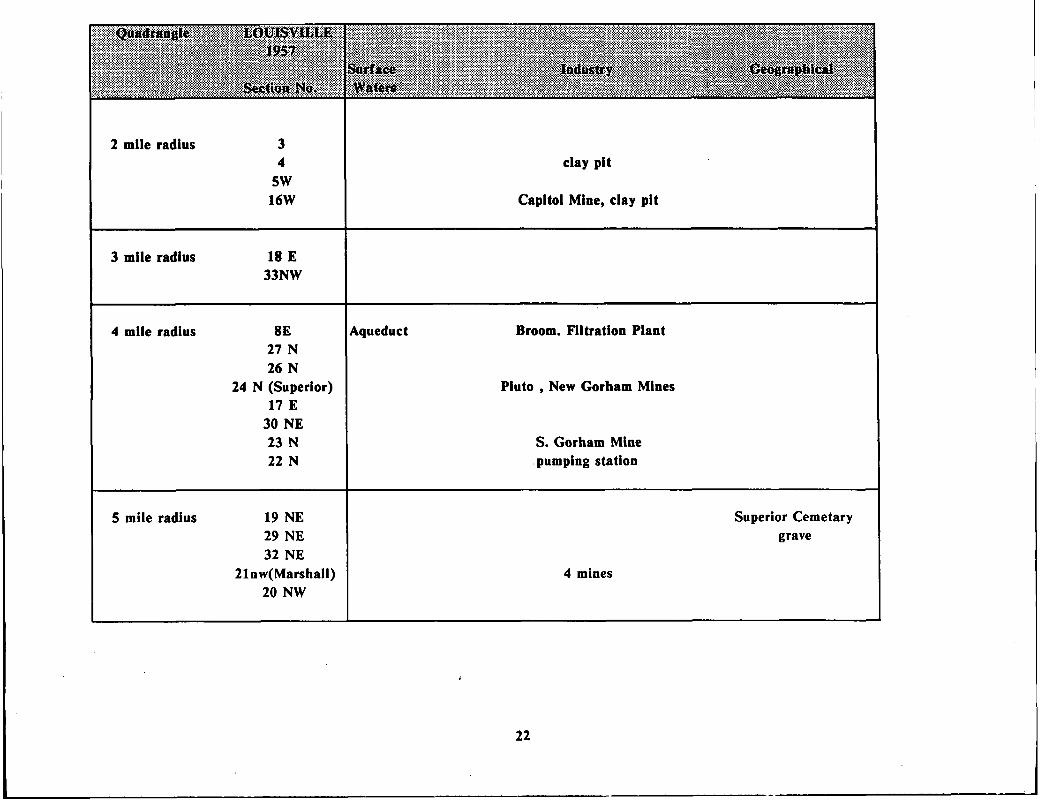
2 mile radius 3 4 5w 16W
3 mile radius 18 E 33NW
4 mile radius 8E 27 N 26 N
24 N (Superior) 17 E 30 NE 23 N 22 N
5 mile radius 19 NE 29 NE 32 NE
21nw( Marshall) 20 NW
clay pit
Capitol Mine, clay pit
tqueduct Broom. Filtration Plant
Pluto , New Gorham Mines
S. Gorham Mine pumping station
4 mines
Superior Cemetary grave

2 mile radius 3 4
5w 11 12 14
16W
3 mile radius 6E 7E
18 E 33N
4 mile radius 8E 27 N 26 N
24 N (Superior) 28NW 17 E 30 NE 23 N 22 N
5 mile radius 19 NE 29 NE 32 NE
21 nw(Marshal1) 20 NW
3 gravel pits Indiana St. (med. duty)
gravel pit clay pit
:r.Western R. Hwy128 is med. duty
gravel pit
pumping station gravel pit
9 Ig. warehouses
landing area off Hwy 93
no S. Gorham pump stn., gravel pit
Dillon is med. duty
JeffCo. Airport shown
23

5 w 11 12 14
16W
3 mile radius 6E 7E
18 E 33N
4 mile radius 8E 27 N 26 N
24 N (Superior) 28NW 17 E
30 NE 23 N 22 N
5 mile radius 19 NE 29 NE 32 NE
2 1 nw( Marshall) 20 NW
3 gravel pits
gravel pit
W. 120th
gravel pit
warehouses gone
landing area
24

2 mile radius 3 11 12 14
16W 4 w 5w 13E
3 mile radius 6E 7E
18 E 33N
4 mile radius 8E( Wes tmins t) 27 N 26 N
24 N (Superior) 28NW 17 E
30 NE 23 N 22 N
5 mile radius 19 NE 29 NE 32 NE
21 nw( Marshall) 2ONW
3 gravel pits
gravel pit
W.12Oth
Westminster Corp. Boundary
Louisville Corp. Boundary
25

16W 13E
18SE 24SE 2 1 s w
4 mile radius 2OSE 19SE 28SW 2 7 s
2 6 s (Leyden) 2 5 s
5 mile radius 30SE 29SE (Thompson)
31SE 3 6 s 3 3 s
32SW
6 mile radius 6SE
Rocky Flats Lake/Smart Ditch
%Boulder canal to Ralston Res.
Standley Lake
Leyden Lake
Denver &Salt Lake Intermtn. RR
Ralston Reservoir
26

3 mile radius 16W 13E
18SE 24SE 2lSW
4 mile radius 2OSE 19SE 28SW 27s
26s (Leyden) 25s
5 mile radius 30SE 29SE (Thompson)
31SE 36s 33s 35s
32SW
clay pit
2 clay pits
Denver&Rio Grande Western RR
27

Y a h
cd 0
N
.I
v) a B
E 8
.I
‘Ei m
b
c
8
cd it
I I
8
n
s
.. v1 W
N
a E - a
n
0
a
s w N
v) a B
E 8 I
.d
B In

3 mile radius 16W 13E
18SE 24SE 23SE 22SE 2lSW
I 4 mile radius 2OSE
19SE 28SW 27s
26s (Leyden) 25s
gravel pit substation
5 mile radius 30SE 29SE (Thompson)
31SE 36s 33s 35s
32SW
29

3 mile radius 16W 13E
18SE 24SE 2 2 s 2 3 s
2 1 s w
4 mile radius 2OSE 19SE 28SW 2 7 s
2 6 s (Leyden) 2 5 s
5 mile radius 30SE 29se(Thompso)
31SE 3 6 s 3 3 s 3 5 s
32SW 3 4 s
Rocky Flats Lake
Standley Lake Country Park Arv&Wstm Corp Boundari
30
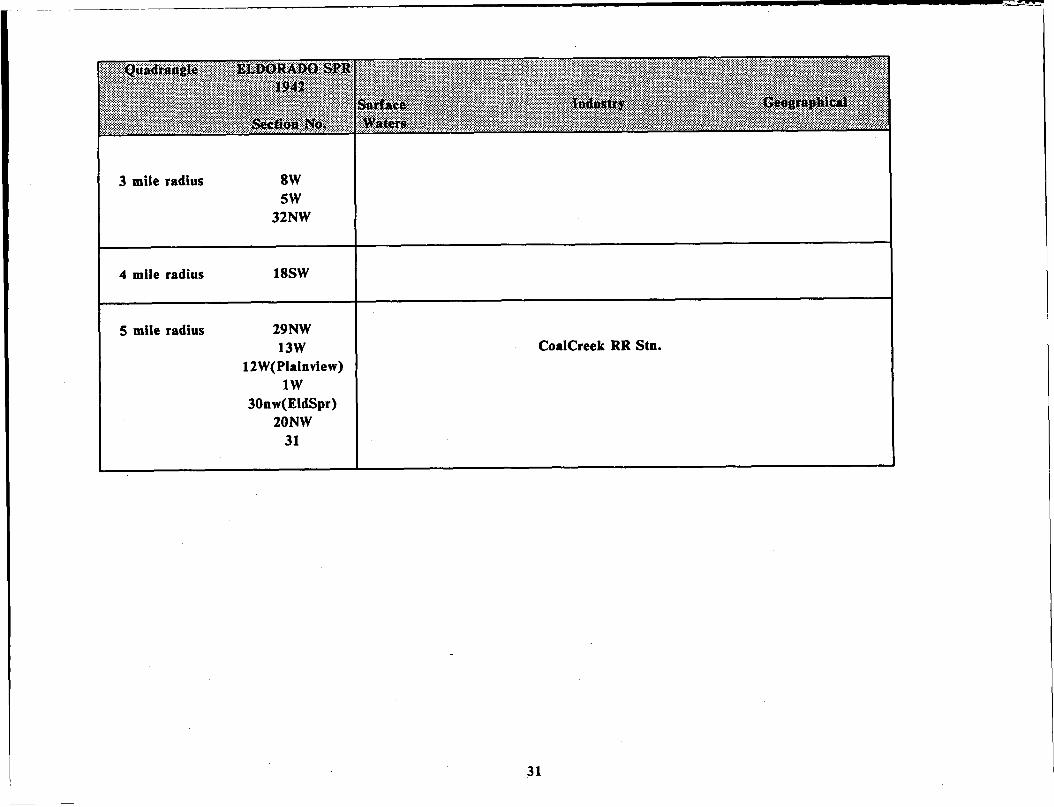
3 mile radius 8W 5W 32NW
4 mile radius 185w
5 mile radius 29NW 13W
12W( Plainview) 1w
30nw( EldSpr) 20NW 31
CoalCreek RR Stn.
31

3 mile radius 8W 5 w
32NW
4 mile radius 18SW
5 mile radius 29NW 13W
12 W( Plainview) 1 w
30nw(EldSpr) 20NW
31 I 3 clay pits
2 clay pits

3 mile radius 8 W 5w
32NW
4 mile radius 18SW
5 mile radius 29NW 13W
12W( Plainview) 1 w
30nw( EldSpr) 2ONW
5 clay pits 2 clay pits
33

A9 MNZf ASS I
AS AS

19SW Dnv&Salt LakeRR 20sw Arenasiding Stn.
4 mile radius
5 mile radius 24SW 29SW Fireclay Stn. 30SW
4 mile radius 20sw
5 mile radius 19SW 29SW 24SW 30SW
spring
spring 2 clay pits
clay pit and mine
35

4 mile radius 20sw
5 mile radius 19SW 29SW 24SW 30SW 32SE 18W
spring
spring 2 claypits & mine
mine mine
36

5 mile radius 28NE 33NE 4E 9E 16E
5 mile radius 28NE 33NE 4E 9E 16E
Monarch Mine gravel pit
Upper Church Ditchlaqueduct to Broomfield Walnut Creek Ketner Res/Church Ditch
2 water tanks
mine dump gravel pit
JeffCo Airport
37

5 mile radius 28NE 33NE 4E 9E 16E
JeffCo Airport larger
5 mile radius 28NE 33NE 4E
mine dump
JeffCo airport I 9E 1
16E
38
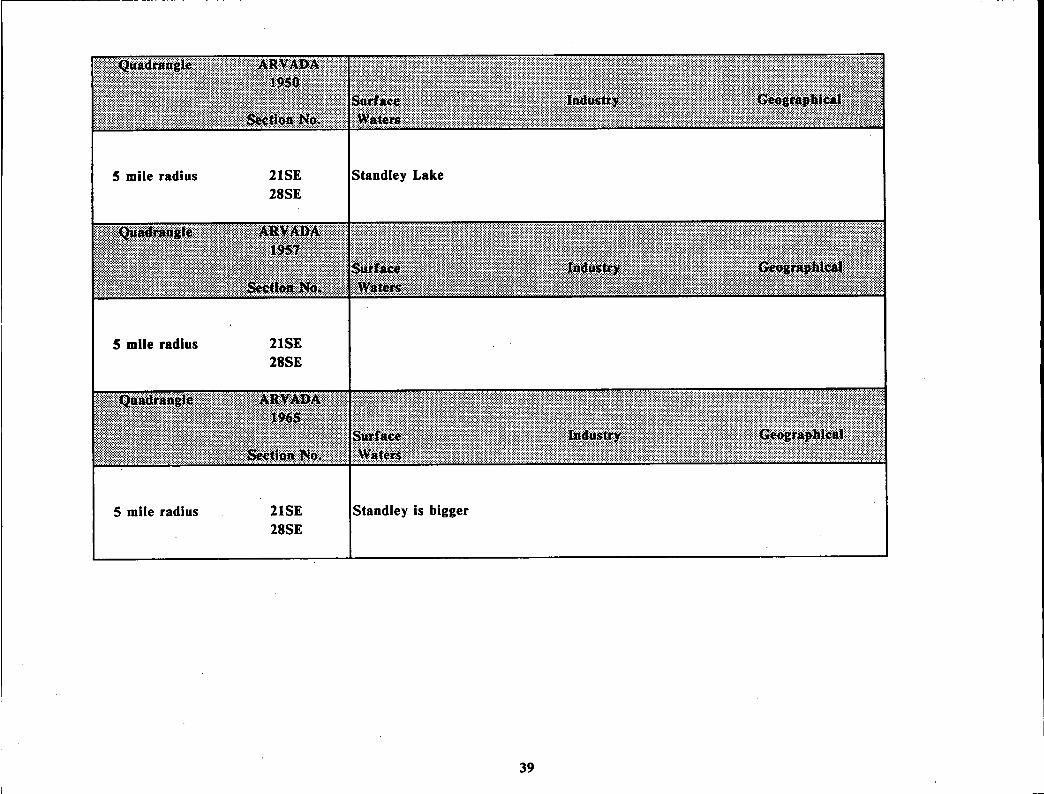
5 mile radius 215e 285e
Standley Lake
5 mile radius 215e 285e
5 mile radius 215e Standley is bigger 285e
39

w % N
ww
2%
NH

APPENDIX C
INFORMATION REQUEST LETTER AND
LIST OF PERSONS CONTACTED
0202ALR4

November 8, 1990
Dear 2 - : ChemRisk, the risk assessment division of McLaredHart Engineering is currently contracted with The Colorado Department of Health (CDH), to conduct a toxicological review and dose reconstruction study of the Rocky Flats Nuclear Weapons Facility. One of the tasks associated with the contract includes a reconstruction of the demographic characteristics and land uses in the area surrounding the Rocky Flats plant from 1952, when the plant began operations to the current time ( 1990).
Pertinent information to be collected for the study will include population within a 50 mile radius of the plant, age distribution of the population (0 to < 2 years, 2 to < 13 years, 13 to < 21 years, and 21 to 70 years), land uses and land use changes surrounding the plant, population migration rates, identification of sensitive receptors (schools, day care centers, hospitals and HMO’s, nursing homes, parks, etc.), agricultural production (crop and livestock), gave harvest levels, and drinking water sources. Information will be collected at a minimum for each census year, if possible every 5 years from 1950 to 1990.
Population, age distribution, and migration statistics will be obtained from the U.S. Census Bureau for 1950, 1960, 1970, 1980 and 1990. However, more detailed data for years between the decennial census years is not available from census sources. Therefore, it is necessary to solicit city and county assistance in collecting land use information and more detailed demographic data for each community and unincorporated area within a 50 mile radius of the plant.
At this time, I would like to determine which of the following data your office has available:
1. Land use maps for 1950, 1960, 1970, 1980 and 1990 and years in between (identify which years).
2. Zoning maps for 1950, 1960, 1970, 1980 and 1990 and years in between (identify which years).
Population estimates for 1955, 1965, 1975, 1985, or years in between census years (identify which years).
Population by age distribution between census years (identify which years).
3.
4.
5 . Information on time periods in which major changes in land use, population, economic development occurred during the period, (1950 - 1990).
0202ALR4

6.
7.
8.
9.
10.
11.
12.
13.
14.
15.
Total city/county acreage for census years.
Acres annexed between census years (identify which years).
Number of housing units within jurisdiction between census years (identify which years).
Household size between census years (identify which years).
Aerial photography of jurisdiction 1950, 1960, 1970, 1980, 1990 and/or years between census years.
Locations of sensitive receptors throughout the period.
Number of acres of agricultural land within jurisdiction.
Agricultural statistics (crop and livestock production).
Location of fishing and hunting areas.
Location of drinking water sources including wells (public or private, agricultural and depth), natural springs and surface waters (reservoirs, canals).
.I would appreciate your response regarding the availability of the data requested as soon as possible. Actual collection of the data will not begin until January of 1991. I will be making follow up phone calls after I have received your response. Thank you for your cooperation.
Sincerely,
Jennifer Kathol
0202ALR4

LIST OF PERSONS CONTACTED
Name Alldredge, Bill
Bean, Brent
Billingsley, Graham
Boss, Jackie
Chad
Coney, Rob
Dugan, Jim
Eckles, Jim
Fernandez, John
Ferris, Steve
Fox, Fred
Fraley, Les French, Peggy
Gidley, Glen
Goodenough, Neil
Gray, Frank
Harrison, Craig
Hayden, Gin
Hearn, Chuck
Mangione, J.
Mugler, Larry
Murray, David
Nicki
Nielson, Brent
Orpanization
Dept. of Radiology, Colorado State University (CSU)
City of Lafayette Planning Dept.
Boulder County Planning Dept.
Colorado Division of Wildlife, Librarian
Landis Photography of Denver
Adams County
City of Aurora Planning Dept.
Dept. of Agronomy, CSU
City of Boulder Planning Dept.
City of Sheridan Planning Dept.
Town of Superior
Dept. of Radiology, CSU
City of Federal Heights Planning Dept.
City of Wheatridge Planning Dept.
City of Commerce City Planning Dept.
CityKounty of Denver Planning Dept.
Harrison Resources
Business Research Division, Colorado University (CU)
City of Golden Planning Dept.
City of Boulder, Long Range Planner
Denver Regional Council of Governments (DRCOG)
City of Thornton Planning Dept.
USGS Map Sales, Denver
City of Westminster Planning Dept.

Name Oglesby, Kirk
Payne, Jon
Piatt, Sue
Picasso, Becky
Polisky, Greg
Reed, Doug
Reynolds, Reid
Rodriguez, Pat
Rolain, Rhonda
Sattefield, Jim
Sayre, Jim
Schoonveld, Gene
Schroder I Steve
Seiber, Phil
Sewald, Kathy
Shrup, Don
Spencer, Bill
Starling, Jerry
Weber, Dave
Wheeler, Delani
Williams, Ardy
Williamson, Jack
Wood, Paul
Ormnization
City of .Broomfield Planning Dept.
City of Littleton Planning Dept.
Denver Regional Council of Governments (DRCOG)
Colorado Dept. of Local Government
Colorado Division of Wildlife, Stream Biologist
Jefferson County Planning Department
Colorado Dept. of Local Government, State Demographer
U.S. Dept. of Commerce, U.S. Census Bureau
City of Arvada Planning Dept.
Colorado Division of Wildlife, Lake Biologist
City of Brighton Planning Dept.
Colorado Division of Wildlife
City of Greenwood Village Planning Dept.
Arapahoe County Planning Dept.
Jefferson County Assessor’s Office
Colorado Division of Wildlife, Aquatic Biologist
Agricultural Economics, CSU
City of Northglenn Planning Dept.
Colorado Division of Wildlife
Boulder County Open Space
Jefferson and Boulder County ASCS Office
Jefferson County Planning Dept.
City of Louisville Planning Dept.

APPENDIX D
RESOLUTION OF COMMENTS ON THE DIUFT TASK 7 REPORT

APPENDIX D
Resolution of Comments on the Draft Task 7 Report
Comment 1.
Response 1.
Comment 2.
Response 2.
0202ALR4
The discussion on population could be expanded to explain to the lay-person the differences between the various sources of population data. What are the characteristics of each, what are their shortcoming?
Information presented in the Task 7 report has been expanded to further explain the informution sources that were used and the methods that were used to generate historical population estimates. In the course of these discussions, information sources that were used are described in some detail. Informution sources that were not used are noted, but are not described in detail.
How large are the census tracts that are relied upon for some of the years of data presented in Table 4-l? A figure showing their boundaries for each census year would help the reader picture the extent of inaccuracy associated with the population totals presented in the table.
Copies of maps showing how boundaries of census divisions have changed over the years are presented in Figured D-1 through 0-4. Because of the poor quality of the copies, these maps were not included in the text of the Task 7 report, but are presented here to illustrate the variation in sizes of census tracts relative to the Task 7study area.
The 1950 census included civil divisions which were fairly small geographically- comparable to recent census tract sizes. Portions of 10 of these civil divisions fell within the Task 7 study area. In the 1960 census, tract 98 was very large, about three times the size of the study area. Tract 98 covered about 75 percent of the study area, which also includedportions of four other tracts in Boulder County. Since no block groups existed, 1960 population estimates for the study area were most likely overestimated. In the 1970 census, tract 98 was split up into smaller blocks, four of which fell within the study area. The uncertainty of population estimates likely decreased as a result. In the 1980 census, the trend towards splitting up of tracts into smaller blocks continued, especially in the areas to the southeast of the Rocky Flats plant. In the 1990 census, tracts 98.20, 21, and 15 were smaller than previous divisions, but included incorporated areas outside the 5-mile area. Block data from the 1990 census are available from the U.S. Census Bureau’s TIGER system, and were accessed in generating the 1990 population estimates as described in this report.

Page 0-2 Task 7 Report Comments and Responses
Comment 3.
Response 3.
Comment 4.
I
Response 4.
Comment 5 .
Response 5.
The Health Department of others have repeatedly published information that states the population in the five-mile radium was somewhere around 9,000 people in 1990. This appears to conflict with data provided in the Task 7 report. One reason is that the term "study area" is not clearly defined. The text implies a five-mile radium for the study area, but Table 4-1 gives data for census tracts much larger than that (as footnoted). This is confusing and potentially misleading. For example, the preliminary 1990 population figure presented in Table 4-1 is 40,000 people. This is a big difference, and there is no discussion in the text of how to interpret the census data.
The study area has been more clearly dejined in the text and in an added Figure 1-1. The fact that some Table 4-1 values include data for census tracts that lie largely outside of the study area has been more clearly indicated in the table and in related text.
The difference between estimates given in the tables and those shown on the figures is not well explained. Just to see how Figure 4-1 (1960) population numbers compare to the numbers in Table 4-1, we added up the population numbers presented on the figure within the study area and it came to around 1,500 people. The total population figure for the "study area" provided in Table 4-1 for 1960 was 21,955. Although the table is footnoted to indicate that a later geographic area is covered, the text does not make clear how the population estimates on the maps were extrapolated from census data provided in the table.
The fact that some Table 4-1 values include data for census tracts that lie largely outside of the study area has been more clearly indicated in the table and in related text. The text in Section 4 was expanded to further describe the methods that were used to analyze the available informution and develop the estimates of historical population in the study area that are presented in this report.
An expanded explanation should be included in the text to indicate how the population numbers on Figure 4- 1 through 4-4 were developed from census block data, what the potential "margin of error" may be.
The text in Section 4 was expanded to further describe the methods that were used to analyze the available informution and develop the estimates of historical population in the stu@ area that are presented in this report. This discussion includes the estimates produced by ChemRisk project stafs as well as the
0202ALR4

Task 7 Report Comments and Responses Pane 0-3
processing of 1990 census data files that was performed by Geoquest, Inc. of Denver to support preparation of the new Figure 4-5 (1 990population estimates).
Comment 6. The Land Use section (Section 3.0) deals primarily with agricultural land use, and provides no discussion of other uses such as residential housing, businesses, schools, parks, etc. The land use figures show the amount and type of agricultural land present in the study area but the remaining lands are not similarly identified. Some indication of residential areas and densities, commercial, recreational, and public land uses should be presented for each decade.
Response 6. A new section (Section 3.3) was added to summarize informution that was collected concerning land uses other than agriculture.
Comment 7. The interviews with landowners focused on agricultural land use as well. Although it is noted that some of the interviewees have knowledge of other types of land uses, these are not discussed in the text. The concentration on agricultural land uses may lead the reader to believe that the primary exposure pathways of concern in the 5 mile radius are limited to agricultural land use. Non-farming residents, schools, and recreational activities should also be discussed.
Response 7. As noted above, a new section (Section 3.3) was added to summarize informution that was collected concerning land uses other than agriculture. Informution from interviews of landowners is specifically summarized in Section 3.3.1.
Comment 8. Section 3.2 talks about the "Buffer Zone". What does that term mean and what area is covered? (For those that are new to Rocky Flats jargon).
The bufSer zone has been more clearly defined in several places in the text of the Task 7 report and is illustrated in a new Figure 1-1. Figure 3-1 was revised to more clearly indicate the boundaries of parcels of land that were acquired by the U.S. government for the original Rocky Flats site and for the bufer zone.
Response 8.
Comment 9. Figure 4-5 through 4-8 provide information on residential dwelling and schools within the study area. These figures are not discussed in the Land Use section of the report. Except for the notations on the maps themselves, there is no
0202ALR4

Task 7 Report Comments and Responses Page 0-4
explanation of how they were put together. Some of the population numbers indicated in Figures 4-1 through 4-4 do not logically correspond to the numbers of residential dwellings indicated on Figure 4-5 through 4-8.
For example, for 1980 a population of 2,195 is shown in the most southeastern 5-mile radius section on Figure 4-4. Only 303 residences are shown in the corresponding section of Figure 4-8, which would be 7.24 persons per household, a very unrealistic average. In the Standley Lake 5-mile sector on Figure 4-4, a population of 3,3,84 is shown, yet only 96 residences are indicated on Figure 4-8. How can these discrepancies be resolved?
Response 9. Discussion of the referencedfigures (now Figures 4-6 through 4-9) was added to Section 4.2, “Analysis of Topographical Quadrangle Maps. I‘ A statement concerning possible inconsistencies between these preliminary estimates and estimates derived by other methods war also added to Section 4.2. A more extensive investigation of the available data would be necessary to reconcile the diferences between the direrent information sources and estimation methods that were identified in the Phase I study.
Comment 10. If Figures 4-5 through 4-8 show cumulative land use data obtained for each time period, why do schools appear and disappear depending on the date of the figure? Five schools areindicated for 1950 and none are shown for 1980. With the growth in population, it’s hard to believe that they were all closed.
Response 10. The disappearance of schools from one set of USGS maps to later sets likely reflects consolidation of small, rural schools into a smaller number of larger, regional schools.
Comment 11. Appendix B obviously took a lot of work to prepare. Some additional discussion of the data presented in this table and the relationship to the data shown on Figures 4-5 through 4-8 would make it more useful to the reader.
Response 11. Appendix B is discussed in Section 3.3.2, “Results of Analysis of USGS Quadrangle Maps, and in Section 4.2, “Analysis of Topographical Quadrangle Maps. ‘I
0202ALR4

The circle represents a 5-mile radius from the center of the Rocky Flats plant.
C&rn?kk - R Olulslon or McLomn/Harl
FIGURE D-1 1950 CENSUS DIVISIONS IN OR NEAR THE TASK 7 STUDY AREA

The circle represents a 5-mile radius from the center of the Rocky Flats plant.
ChernRbk - R DIulslon of MrL an?n/Hart
FIGURE D-2 1960 CENSUS DIVISIONS IN OR
NEAR THE TASK 7 STUDY AREA

The circle represents a 5-mile radius from the center of the'Rocky Flats plant.
~
FIGURE D-3 1970 CENSUS DIVISIONS IN OR NEAR THE TASK 7 STUDY AREA

The circle represents a 5-mile radius from the center of the Rocky Flats plant.
ChemRikk - a Dlulslan ef McLaren/Hart
FIGURE D-4 1980 CENSUS DIVISIONS IN OR
NEAR THE TASK 7 STUDY AREA

The circle represents a 5-mile radius from the center of the Rocky Flats plant.
ChemRk4 - I ) Olulrlen e l Mcl amn/HaH
FIGURE 0-5 1990 CENSUS DIVISIONS IN OR
NEAR THE TASK 7 STUDY AREA

Colorado Department of Health Health Studies on Rocky Flats, A-3
4300 Cherry Creek Drive South Denver, CO 80220
(303) 692-2640 or 692-2700

REPORT
Project task 7 report : demographic and land use reconstruction . of the area surrounding the Rocky Flats Plant
103526 c.2
. ..-
Printed on Recycled Paper
~~