indonesia · hk hl hpt hp permanent hpk total forest land apl total (1000ha) 1 2 3 4 5 6 (=2+3+4+5)...
TRANSCRIPT

Forestry Department Food and Agriculture Organization of the United Nations
FRA2010/095 Rome, 2010
GLOBAL FOREST RESOURCES
ASSESSMENT 2010
COUNTRY REPORT
INDONESIA

2
The Forest Resources Assessment Programme Sustainably managed forests have multiple environmental and socio-economic functions important at the global, national and local scales, and play a vital part in sustainable development. Reliable and up-to-date information on the state of forest resources - not only on area and area change, but also on such variables as growing stock, wood and non-wood products, carbon, protected areas, use of forests for recreation and other services, biological diversity and forests’ contribution to national economies - is crucial to support decision-making for policies and programmes in forestry and sustainable development at all levels.
FAO, at the request of its member countries, regularly monitors the world’s forests and their management and uses through the Forest Resources Assessment Programme. This country report forms part of the Global Forest Resources Assessment 2010 (FRA 2010). The reporting framework for FRA 2010 is based on the thematic elements of sustainable forest management acknowledged in intergovernmental forest-related fora and includes variables related to the extent, condition, uses and values of forest resources, as well as the policy, legal and institutional framework related to forests. More information on the FRA 2010 process and the results - including all the country reports - is available on the FRA Web site (www.fao.org/forestry/fra ). The Global Forest Resources Assessment process is coordinated by the Forestry Department at FAO headquarters in Rome. The contact person for matters related to FRA 2010 is: Mette Løyche Wilkie Senior Forestry Officer FAO Forestry Department Viale delle Terme di Caracalla Rome 00153, Italy E-mail: [email protected] Readers can also use the following e-mail address: [email protected]
DISCLAIMER The designations employed and the presentation of material in this information product do not imply the expression of any opinion whatsoever on the part of the Food and Agriculture Organization of the United Nations concerning the legal status of any country, territory, city or area or of its authorities, or concerning the delimitation of its frontiers or boundaries. The Global Forest Resources Assessment Country Report Series is designed to document and make available the information forming the basis for the FRA reports. The Country Reports have been compiled by officially nominated country correspondents in collaboration with FAO staff. Prior to finalisation, these reports were subject to validation by forestry authorities in the respective countries.

FRA 2010 – Country Report, Indonesia
3
Contents
1 TABLE T1 – EXTENT OF FOREST AND OTHER WOODED LAND..................................................... 5
2 TABLE T2 – FOREST OWNERSHIP AND MANAGEMENT RIGHTS ................................................. 12
3 TABLE T3 – FOREST DESIGNATION AND MANAGEMENT .............................................................. 16
4 TABLE T4 – FOREST CHARACTERISTICS ........................................................................................... 22
5 TABLE T5 – FOREST ESTABLISHMENT AND REFORESTATION................................................... 27
6 TABLE T6 – GROWING STOCK................................................................................................................ 30
7 TABLE T7 – BIOMASS STOCK ................................................................................................................. 34
8 TABLE T8 – CARBON STOCK .................................................................................................................. 36
9 TABLE T9 – FOREST FIRES...................................................................................................................... 39
10 TABLE T10 – OTHER DISTURBANCES AFFECTING FOREST HEALTH AND VITALITY ........... 42
11 TABLE T11 – WOOD REMOVALS AND VALUE OF REMOVALS ..................................................... 46
12 TABLE T12 – NON-WOOD FOREST PRODUCTS REMOVALS AND VALUE OF REMOVALS... 50
13 TABLE T13 – EMPLOYMENT .................................................................................................................... 55
14 TABLE T14 – POLICY AND LEGAL FRAMEWORK ............................................................................. 58
15 TABLE T15 – INSTITUTIONAL FRAMEWORK ...................................................................................... 61
16 TABLE T16 – EDUCATION AND RESEARCH ....................................................................................... 63
17 TABLE T17 – PUBLIC REVENUE COLLECTION AND EXPENDITURE ........................................... 65

FRA 2010 – Country Report, Indonesia
4
Report preparation and contact persons The present report was prepared by the following person(s):
Name
(FAMILY NAME,
First name)
Institution / address E-mail Fax Tables
Hermawan Indrabudi
Directorate of Forest Resources Inventory and Monitoring, DG of Forestry Planning, Ministry of Forestry
[email protected] 62 21 5734632
Wardoyo idem [email protected]
Lely R. Siregar idem [email protected]
Anna Tosiani idem [email protected]
Netty idem [email protected]
Ipan Rangga Permana idem [email protected]
Budi Harto idem [email protected]
FX Herwirawan
idem
Krisna Dwipayana
idem [email protected]

FRA 2010 – Country Report, Indonesia
5
Table T1 – Extent of Forest and Other wooded land
1.1 FRA 2010 Categories and definitions
Category Definition
Forest Land spanning more than 0.5 hectares with trees higher than 5 meters and a canopy cover of more than 10 percent, or trees able to reach these thresholds in situ. It does not include land that is predominantly under agricultural or urban land use.
Other wooded land Land not classified as “Forest”, spanning more than 0.5 hectares; with trees higher than 5 meters and a canopy cover of 5-10 percent, or trees able to reach these thresholds in situ; or with a combined cover of shrubs, bushes and trees above 10 percent. It does not include land that is predominantly under agricultural or urban land use.
Other land All land that is not classified as “Forest” or “Other wooded land”.
Other land with tree cover (Subordinated to “Other land”)
Land classified as “Other land”, spanning more than 0.5 hectares with a canopy cover of more than 10 percent of trees able to reach a height of 5 meters at maturity.
Inland water bodies Inland water bodies generally include major rivers, lakes and water reservoirs.
1.2 National data
1.2.1 Data sources
References to sources of
information
Quality
(H/M/L)
Variable(s) Year(s) Additional comments
Final report on Indonesia Forest Resource, 1996 (In Indonesia).
H Extent 1986 – 1991
mostly 1989
Based on Landsat MSS interpretation. Reference year is 1990
Forestry Statistic Book. Ministry of Forestry, 2000 (In Indonesia)
H Land cover, extent
1999 – 2000
Landsat Imagery interpretation
Indonesia Land Cover Recalculation 2003. (In Indonesia) Forestry Planning Agency, MoF
H Land cover, extent
1999/2000 Information of land cover based on interpretation of Landsat 7 ETM+, acquired in 1999/2000 with field checking
Indonesia Land Cover Recalculation 2005. (In Indonesia) Forestry Planning Agency, MoF
H Land cover, extent
2002/2003 Information of land cover based on interpretation of Landsat 7 ETM+, acquired in 2002/2003 with field checking
Indonesia Land Cover Recalculation 2008. (In Indonesia) Forestry Planning Agency, MoF Indonesia.
H Land cover, extent
2005/2006 Information of land cover based on interpretation of Landsat 7ETM+, acquired in 2005/2006 with field checking

FRA 2010 – Country Report, Indonesia
6
1.2.2 Classification and definitions
National class Definition
Primary Forest (Hutan Primer; Ind)
Forest with no ocular evidence of disturbance
Secondary Forest (Hutan Sekunder; Ind)
Forest with ocular evidence of disturbance
Planted Forest (Hutan Tanaman; Ind)
Manmade forest within state forestland
Non- forested area (Non Hutan; Ind)
It covers bush,_shrub , agriculture crops, settlement and savanna, etc.
Forestland Land designated for forest land use
Non Forestland Land designated for non forest land use, e.g., agriculture land, settlement. Some of non forested land are covered by forest, e.g., community forest.
Forest Includes primary, secondary and planted forests. Forest and non forest are identified or mapped from Landsat images using visual interpretation. Since it is difficult to differentiate canopy cover in Landsat imageries, the forest is identified based on standard interpretation procedure in remote sensing such as tone or texture. During the mapping, the minimum interpreted area is 0.5 cm x 0.5 cm., approximately 6.25 hectars
1.2.3 Original data
Forest Land Area (in 1000 Ha) Non Forestland
( in 1000Ha) 1990
HK HL HPT HP Permanent HPK
Total
Forest Land APL
Total
(1000Ha)
1 2 3 4 5 6 (=2+3+4+5) 7 8 (=6+7) 9 10
Cloud & No Data
244 383 206 299 1,132 722 1,855 909 2,764
Forested 16,789 24,846 21,284 27,670 90,589 14,711 105,300 15,776 121,076
Non Forested
2,638 4,633 3,303 7,733 18,308 6,907 25,215 38,570 63,785
Shurbbush - - - - - - - - -
Total 19,672 29,862 24,792 35,703 110,029 22,340 132,370 55,255 187,625
Forest Land Area (in 1000 Ha) Non Forestland
( in 1000Ha) 2000
HK HL HPT HP Permanent HPK Total
Forest Land APL
Total
(1000Ha)
1 2 3 4 5 6 (=2+3+4+5) 7 8 (=6+7) 9 10
Cloud & No Data
260 431 241 327 1,258 231 1,489 111 1,600
Forested 15,671 23,771 19,320 22,359 81,123 11,313 92,436 9,500 101,936
Non Forested
2,223 3,811 3,247 7,105 16,386 7,128 23,514 37,425 60,940
Shurbbush 1,495 1,848 1,990 5,913 11,246 3,679 14,926 8,348 23,274
Total 19,649 29,861 24,798 35,705 110,013 22,351 132,364 55,385 187,750
Forest Land Area (in 1000 Ha) Non Forestland
( in 1000Ha)
2003 HK HL HPT HP Permanent HPK
Total
Forest Land APL
Total
(1000Ha)
1 2 3 4 5 6 (=2+3+4+5) 7 8 (=6+7) 9 10
Cloud & No Data
482 669 316 367 1,833 313 2,146 355 2,501
Forested 15,438 23,445 19,129 22,692 80,704 11,297 92,001 9,267 101,269
Non Forested
2,267 3,826 3,137 6,873 16,103 6,779 22,881 37,955 60,836
Shurbbush 1,516 1,931 2,207 5,784 11,439 3,965 15,404 7,844 23,248
Total 19,703 29,871 24,788 35,716 110,078 22,355 132,433 55,421 187,854

FRA 2010 – Country Report, Indonesia
7
Forest Land Area (in 1000 Ha) Non Forestland
( in 1000Ha) 2006
HK HL HPT HP Permanent HPK Total
Forest Land APL
Total
(1000Ha)
1 2 3 4 5 6 (=2+3+4+5) 7 8 (=6+7) 9 10
Cloud & No Data
712 940 454 536 2,642 344 2,986 571 3,557
Forested 15,197 23,020 18,835 22,080 79,132 11,004 90,135 8,325 98,460
Non Forested
2,385 3,965 3,337 7,665 17,353 7,170 24,523 38,850 63,373
Shurbbush 1,401 1,929 2,160 5,425 10,916 3,834 14,750 7,641 22,391
Total 19,696 29,855 24,786 35,706 110,043 22,351 132,394 55,387 187,781
Note : n.a (Not available data) The total area of Forestlands are the sum of forest functions (conservation forest, protection forest and production forest Original data after proportionate cloud cover allocation The cloud cover area is not included in forested area or non forested area, but it should be taken into consideration. The assumption was made that the cloud cover area proportionally distributed into forested, Shrub bush and non forested class.). The calculation of cloud allocation done based on forest function and then reported into forestland and non forestland
Forest Land Area (in 1000 Ha) Non Forestland
( in 1000Ha) 1990
HK HL HPT HP Permanent HPK Total
Forest Land APL
Total
(1000Ha)
1 2 3 4 5 6 (=2+3+4+5) 7 8 (=6+7) 9 10
Forested 17,001 25,169 21,462 27,904 91,535 15,203 106,738 16,040 122,777
Non Forested
2,671 4,694 3,331 7,799 18,494 7,138 25,632 39,215 64,847
Shurbbush - - - - - - - - -
Total 19,672 29,862 24,792 35,703 110,029 22,340 132,370 55,255 187,625
Forest Land Area (in 1000 Ha) Non Forestland
( in 1000Ha) 2000
HK HL HPT HP Permanent HPK Total
Forest Land APL
Total
(1000Ha)
1 2 3 4 5 6 (=2+3+4+5) 7 8 (=6+7) 9 10
Forested 15,881 24,119 19,510 22,566 82,076 11,431 93,507 9,519 103,027
Non Forested
2,253 3,867 3,279 7,171 16,569 7,202 23,772 37,501 61,272
Shurbbush 1,515 1,875 2,010 5,968 11,368 3,718 15,085 8,365 23,450
Total 19,649 29,861 24,798 35,705 110,013 22,351 132,364 55,385 187,750
Forest Land Area (in 1000 Ha) Non Forestland
( in 1000Ha) 2003
HK HL HPT HP Permanent HPK Total
Forest Land APL
Total
(1000Ha)
1 2 3 4 5 6 (=2+3+4+5) 7 8 (=6+7) 9 10
Forested 15,825 23,982 19,375 22,928 82,110 11,458 93,568 9,327 102,895
Non Forested
2,324 3,913 3,178 6,944 16,359 6,875 23,234 38,199 61,433
Shurbbush 1,554 1,975 2,235 5,844 11,609 4,022 15,631 7,894 23,526
Total 19,703 29,871 24,788 35,716 110,078 22,355 132,433 55,421 187,854

FRA 2010 – Country Report, Indonesia
8
Forest Land Area (in 1000 Ha) Non Forestland
( in 1000Ha)
2006 HK HL HPT HP Permanent HPK
Total
Forest Land APL
Total
(1000Ha)
1 2 3 4 5 6 (=2+3+4+5) 7 8 (=6+7) 9 10
Forested 15,767 23,768 19,186 22,416 81,138 11,176 92,314 8,411 100,725
Non Forested
2,475 4,094 3,400 7,782 17,751 7,282 25,033 39,254 64,287
Shurbbush 1,454 1,992 2,200 5,508 11,154 3,894 15,048 7,721 22,769
Total 19,696 29,855 24,786 35,706 110,043 22,351 132,394 55,387 187,781
In the above tables, the forested area in the non forestland includes community forests.
1.3 Analysis and processing of national data
1.3.1 Calibration
The objective of calibration in this table is the total land area for all periods should be consistent. Because of the base line of image interpretation for four periods is different. The calibration is merely for FRA 2010 reporting purpose and does not reflect the official total country area of Indonesia.
Calibration for total land area
Calibration is carried out in order to ensure that the reported area figures are consistent and the total land area/ country area must match with the official UN statistics in FAOSTAT (as recommended at page 14 of the FRA 2010 Guidelines). FAOSTAT Land area 000 ha 181 157 FAOSTAT Inland water 000 ha 9 300 FAOSTAT Country area 000 ha 190 457 Calibration factors are: 1990 0.96553 2000 0.96487 2003 0.96435 2006 0.96473
Forest Land Area (in 1000 Ha) Non Forestland
( in 1000Ha) 1990
HK HL HPT HP Permanent HPK Total
Forest Land APL
Total
(1000Ha)
1 2 3 4 5 6 (=2+3+4+5) 7 8 (=6+7) 9 10
Forested 16,415 24,301 20,722 26,942 88,380 14,678 103,058 15,487 118,545
Non Forested
2,579 4,532 3,216 7,530 17,857 6,892 24,748 37,863 62,612
Shurbbush - - - - - - - - -
Total 18,994 28,833 23,938 34,472 106,236 21,570 127,807 53,350 181,157
Forest Land Area (in 1000 Ha) Non Forestland
( in 1000Ha) 2000
HK HL HPT HP Permanent HPK Total
Forest Land APL
Total
(1000Ha)
1 2 3 4 5 6 (=2+3+4+5) 7 8 (=6+7) 9 10
Forested 15,324 23,272 18,825 21,774 79,194 11,030 90,224 9,185 99,409
Non Forested 2,174 3,731 3,164 6,919 15,987 6,949 22,937 36,184 59,121
Shurbbush 1,462 1,809 1,939 5,758 10,968 3,587 14,556 8,071 22,627
Total 18,959 28,812 23,928 34,451 106,150 21,566 127,716 53,441 181,157

FRA 2010 – Country Report, Indonesia
9
Forest Land Area (in 1000 Ha) Non Forestland
( in 1000Ha) 2003
HK HL HPT HP Permanent HPK Total
Forest Land APL
Total
(1000Ha)
1 2 3 4 5 6 (=2+3+4+5) 7 8 (=6+7) 9 10
Forested 15,261 23,127 18,684 22,110 79,183 11,049 90,232 8,994 99,227
Non Forested
2,241 3,774 3,064 6,697 15,776 6,630 22,406 36,838 59,243
Shurbbush 1,499 1,905 2,156 5,636 11,196 3,878 15,074 7,613 22,687
Total 19,000 28,806 23,905 34,443 106,154 21,558 127,712 53,445 181,157
Forest Land Area (in 1000 Ha) Non Forestland
( in 1000Ha)
2006 HK HL HPT HP Permanent HPK
Total
Forest Land APL
Total
(1000Ha)
1 2 3 4 5 6 (=2+3+4+5) 7 8 (=6+7) 9 10
Forested 15,211 22,930 18,509 21,626 78,276 10,781 89,057 8,115 97,172
Non Forested
2,388 3,950 3,280 7,507 17,124 7,025 24,150 37,870 62,020
Shurbbush 1,403 1,922 2,123 5,314 10,761 3,756 14,517 7,448 21,965
Total 19,001 28,802 23,912 34,447 106,161 21,563 127,724 53,433 181,157
1.3.2 Estimation and forecasting
Estimation and forecasting is needed to generate 2005 and 2010 data. These processes based on the 2003 data and 2006 data. 2005 data = 2003 data - [(2003 data – 2006 data)/3]*2 2010 data = 2006 data - [(2006 data – 2003 data)/3]*4 The result of estimation and forecasting are presented in the following table:
Area (in 1000 Ha) National Class
1990 2000 2003 2006 2005 2010
Forestland 127,807 127,716 127,712 127,724 127,720 127,740
Forested 103,058 90,224 90,232 89,057 89,449 87,491
Shrub mix with bush - 14,556 15,074 14,517 14,703 13,775
Not Forested 24,748 22,937 22,406 24,150 23,568 26,475
NonForestland 53,350 53,441 53,445 53,433 53,437 53,417
Forested 15,487 9,185 8,994 8,115 8,408 6,942
Shrub mix with bush - 8,071 7,613 7,448 7,503 7,228
Not Forested 37,863 36,184 36,838 37,870 37,526 39,246
Total 181,157 181,157 181,157 181,157 181,157 181,157

FRA 2010 – Country Report, Indonesia
10
1.3.3 Reclassification into FRA 2010 categories
The following table shows the percentage of national classes included into FRA 2010 categories.
Percentage allocation to FRA 2010 Categories National Class
Forest Other wooded
land
Other land Other land with tree
cover
Forestland
Forested 100
Shrub bush 100
Not Forested 100
Non Forestland
Forested 100
Shrub bush 100
Not Forested 100
Area (1000 hectares) categories
1990 2000 2005 2010
Forest 118,545 99,409 97,857 94,432
Other wooded land n.a. 22,627 22,206 21,003
Other land 62,612 59,121 61,094 65,721
Other land with tree cover n.a. n.a. n.a. n.a.
Total 181,157 181,157 181,157 181,157
1.4 Data for Table T1
Area (1000 hectares) FRA 2010 categories
1990 2000 2005 2010
Forest 118,545 99,409 97,857 94,432
Other wooded land n.a. 22,627 22,206 21,003
Other land 62,612 59,121 61,094 65,722
...of which with tree cover n.a. n.a. n.a. n.a.
Inland water bodies 9,300 9,300 9,300 9,300
TOTAL 190,457 190,457 190,457 190,457
1.5 Comments to Table T1
Variable / category Comments related to data, definitions,
etc.
Comments on the reported trend
Forest Classification of forest and non forest in this report derived from Landsat ETM image interpretation. Due to the limitation of ground resolution, any forest with area less than the resolution of this image will be ignored. On Landsat images is difficult to differentiate canopy cover. The minimum interpreted area is approximately 6.25 hectars.
Decrease in forest area is not too significant, might be caused by a balance between logging and planting Three yearly monitoring data indicates decreasing on cloud cover, it probably becomes mislead if the report just relies on single monitoring , since the percentage and distribution of cloud cover are various from each period, and the latest monitoring (2006) shows smallest percentage of cloud cover. Spatial analysis has been done to improve the data and 2006 data has been decided as reference to improve previous monitoring especially to fill cloud cover and
FRA 2010 – Country Report, Indonesia
11
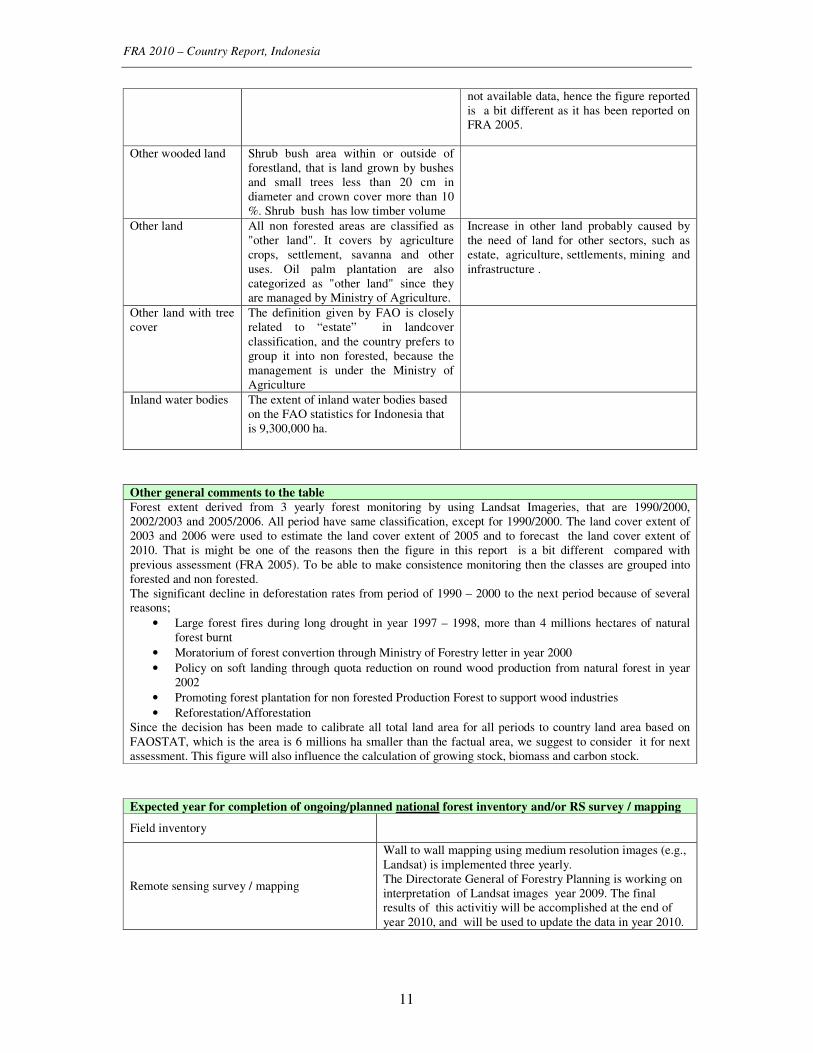
not available data, hence the figure reported is a bit different as it has been reported on FRA 2005.
Other wooded land Shrub bush area within or outside of forestland, that is land grown by bushes and small trees less than 20 cm in diameter and crown cover more than 10 %. Shrub bush has low timber volume
Other land All non forested areas are classified as "other land". It covers by agriculture crops, settlement, savanna and other uses. Oil palm plantation are also categorized as "other land" since they are managed by Ministry of Agriculture.
Increase in other land probably caused by the need of land for other sectors, such as estate, agriculture, settlements, mining and infrastructure .
Other land with tree cover
The definition given by FAO is closely related to “estate” in landcover classification, and the country prefers to group it into non forested, because the management is under the Ministry of Agriculture
Inland water bodies The extent of inland water bodies based on the FAO statistics for Indonesia that is 9,300,000 ha.
Other general comments to the table
Forest extent derived from 3 yearly forest monitoring by using Landsat Imageries, that are 1990/2000, 2002/2003 and 2005/2006. All period have same classification, except for 1990/2000. The land cover extent of 2003 and 2006 were used to estimate the land cover extent of 2005 and to forecast the land cover extent of 2010. That is might be one of the reasons then the figure in this report is a bit different compared with previous assessment (FRA 2005). To be able to make consistence monitoring then the classes are grouped into forested and non forested. The significant decline in deforestation rates from period of 1990 – 2000 to the next period because of several reasons;
• Large forest fires during long drought in year 1997 – 1998, more than 4 millions hectares of natural forest burnt
• Moratorium of forest convertion through Ministry of Forestry letter in year 2000
• Policy on soft landing through quota reduction on round wood production from natural forest in year 2002
• Promoting forest plantation for non forested Production Forest to support wood industries
• Reforestation/Afforestation Since the decision has been made to calibrate all total land area for all periods to country land area based on FAOSTAT, which is the area is 6 millions ha smaller than the factual area, we suggest to consider it for next assessment. This figure will also influence the calculation of growing stock, biomass and carbon stock.
Expected year for completion of ongoing/planned national forest inventory and/or RS survey / mapping
Field inventory
Remote sensing survey / mapping
Wall to wall mapping using medium resolution images (e.g., Landsat) is implemented three yearly. The Directorate General of Forestry Planning is working on interpretation of Landsat images year 2009. The final results of this activitiy will be accomplished at the end of year 2010, and will be used to update the data in year 2010.
FRA 2010 – Country Report, Indonesia
12
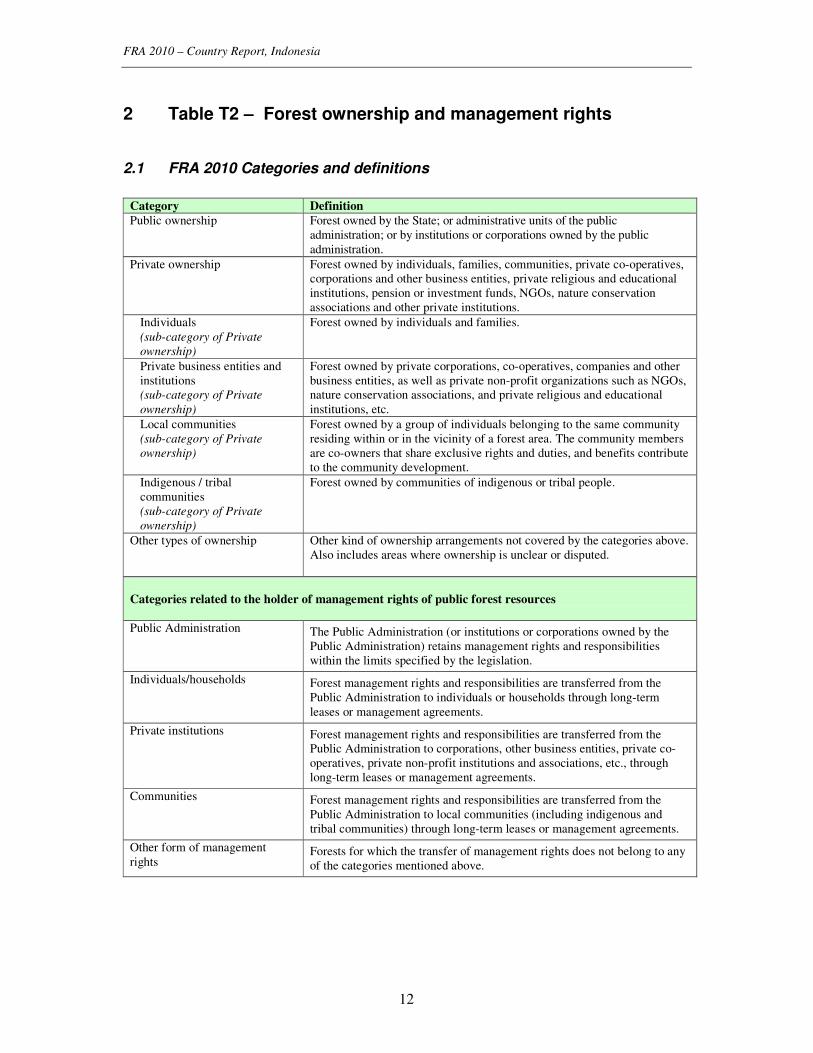
2 Table T2 – Forest ownership and management rights
2.1 FRA 2010 Categories and definitions
Category Definition
Public ownership Forest owned by the State; or administrative units of the public administration; or by institutions or corporations owned by the public administration.
Private ownership Forest owned by individuals, families, communities, private co-operatives, corporations and other business entities, private religious and educational institutions, pension or investment funds, NGOs, nature conservation associations and other private institutions.
Individuals (sub-category of Private
ownership)
Forest owned by individuals and families.
Private business entities and institutions (sub-category of Private
ownership)
Forest owned by private corporations, co-operatives, companies and other business entities, as well as private non-profit organizations such as NGOs, nature conservation associations, and private religious and educational institutions, etc.
Local communities (sub-category of Private
ownership)
Forest owned by a group of individuals belonging to the same community residing within or in the vicinity of a forest area. The community members are co-owners that share exclusive rights and duties, and benefits contribute to the community development.
Indigenous / tribal communities (sub-category of Private
ownership)
Forest owned by communities of indigenous or tribal people.
Other types of ownership Other kind of ownership arrangements not covered by the categories above. Also includes areas where ownership is unclear or disputed.
Categories related to the holder of management rights of public forest resources
Public Administration
The Public Administration (or institutions or corporations owned by the Public Administration) retains management rights and responsibilities within the limits specified by the legislation.
Individuals/households Forest management rights and responsibilities are transferred from the Public Administration to individuals or households through long-term leases or management agreements.
Private institutions
Forest management rights and responsibilities are transferred from the Public Administration to corporations, other business entities, private co-operatives, private non-profit institutions and associations, etc., through long-term leases or management agreements.
Communities
Forest management rights and responsibilities are transferred from the Public Administration to local communities (including indigenous and tribal communities) through long-term leases or management agreements.
Other form of management rights
Forests for which the transfer of management rights does not belong to any of the categories mentioned above.

FRA 2010 – Country Report, Indonesia
13
2.2 National data
2.2.1 Data sources
References to sources of
information
Quality
(H/M/L)
Variable(s) Year(s) Additional comments
Forestry Statistic Book, 1991, Ministry of Forestry
H Extent 1990/1991 Based on Forest Land Use by Consesus map and Community Forest area
Forestry Statistic Book, 2002, Ministry of Forestry
H Extent 2002 Based on Forest Land Use by Consensus map and Community Forest area
DG of Land Rehabilitation and Social Forestry Data, Ministry of Forestry
H Extent 1990 – 2004
Indonesia Land Cover Recalculation 2003. (In Indonesia) Forestry Planning Agency, MoF
H Land cover, extent
1999/2000 Information of land cover based on interpretation of Landsat 7 ETM+, acquired at 1999/2000 with field checking
Indonesia Land Cover Recalculation 2005. (In Indonesia) Forestry Planning Agency, MoF
H Land cover, extent
2002/2003 Information of land cover based on interpretation of Landsat 7 ETM+, acquired at 2002/2003 with field checking
Indonesia Land Cover Recalculation 2008. (In Indonesia) Forestry Planning Agency, MoF
H Land cover, extent
2005/2006 Information of land cover based on interpretation of Landsat 7 ETM+ that acquired at 2005/2006 with field sample plot
2008, DG of Land Rehabilitation and Social Forestry. Statistic of Land Rehabilitation and Social Forestry. MoF.
H Extent 1980-2007
This data based on the terrestrial survey by DG of Rehabilitation and Social Forestry.
2.2.2 Classification and definitions
National class Definition
Public forest Land owned by the State (national, state and regional governments) or government-owned institutions or corporations or other public bodies including cities, municipalities, villages and communes.
People forest (Hutan rakyat)
People forest is forest plantation on private land or non forestland, mainly planted with fast growing hardwood species. It’s different with agro forestry.
2.2.3 Original data
In Indonesia all forest land is owned by government. Some people grow forest in their own land, called as community forest (hutan rakyat; Ind).

FRA 2010 – Country Report, Indonesia
14
Forest ownership
Area (in 1000 Ha) National Class
1990 2000 2005 2010
Forestland 127,807 127,716 127,720 127,740
Forested 103,058 90,224 89,449 87,491
Shrub bush na 14,556 14,703 13,775
Not Forested 24,748 22,937 23,568 26,475
Non Forestland 53,350 53,441 53,437 53,417
Forested 15,487 9,185 8,408 6,942
Shrub bush Na 8,071 7,503 7,228
Not Forested 37,863 36,184 37,526 39,246
Total land area 181,157 181,157 181,157 181,157
Area (in 1000 Ha)
National categories 1990 2000 2005 2010
Production forest (HP) 62,342 51,628 51,226 49,679
Communities (HKM) inside HP 0.0 24.6 3.3
Protection forest (HL) 24,301 23,272 22,996 22,667
Conservation forest (HK) 16,415 15,324 15,228 15,145
Forested on Non Forestland (APL) 15,487 9,185 8,408 6,942
Individuals (HR) inside APL 59.6 49.8 32.2
Total Forest 118,545 99,409 97,857 94,432
2.3 Analysis and processing of national data
2.3.1 Calibration
No calibration is needed for this table.
2.3.2 Estimation and forecasting
No estimation and forecasting is needed for this table. All “non forestland”which is forested is privately owned and all the “forestland”is publicly owned. For table 2b, all Protection Forest (HL) and all Conservation Forest (HK) are managed by the Public Administration. The remaining Forestland is classified as production Forest (HP) with some sub categories. Some Production Forests are managed by communities (HKM or social forestry), but mosly by private corporations and institutions, meanwhile people forest (HR) is owned by individuals
2.3.3 Reclassification into FRA 2010 categories
National Categories Percentage allocation to FRA 2010 Categories
Private ownership Public ownership Other ownership
Forested Forestland 100 Forested Non Forestland 100

FRA 2010 – Country Report, Indonesia
15
2.4 Data for Table T2
Table 2a - Forest ownership
Forest area (1000 hectares) FRA 2010 Categories
1990 2000 2005
Public ownership 103,058 90,224 89,449
Private ownership 15,487 9,185 8,408
...of which owned by individuals
...of which owned by private business entities and institutions
...of which owned by local communities
...of which owned by indigenous / tribal communities
Other types of ownership 0 0 0
TOTAL 118,545 99,409 97,857
Note: If other types of ownership is reported, please specify details in comment to the table.
X Yes Does ownership of trees coincide with ownership of the land on which they are situated? No
If No above, please describe below how the two differ:
Table 2b - Holder of management rights of public forests
Forest area (1000 hectares) FRA 2010 Categories
1990 2000 2005
Public Administration 40,716 38,596 38,224
Individuals 0 49.8 32.2
Private corporations and institutions 62,342 51,554 51,190
Communities 0.0 24.6 3.3
Other 0 0 0
TOTAL 103,058 90,224 89,449
2.5 Comments to Table T2
Variable /
category
Comments related to data, definitions,
etc.
Comments on the reported trend
Public ownership In Indonesia all forest land is owned by government, and management right could be given to local communities, private corporations and institutions.
The figure shows the trend slightly decreased and heavily depend on the policy of government
Private ownership
People grow threes on their own land, particularly in Java
Other types of ownership
Management rights
Management right is mainly given for forest concession or forest plantation
Other general comments to the table
Public administration was included the conservation forest, protection forest and production forest.

FRA 2010 – Country Report, Indonesia
16
3 Table T3 – Forest designation and management
3.1 FRA 2010 Categories and definitions
Term Definition
Primary designated function The primary function or management objective assigned to a management unit either by legal prescription, documented decision of the landowner/manager, or evidence provided by documented studies of forest management practices and customary use.
Protected areas Areas especially dedicated to the protection and maintenance of biological diversity, and of natural and associated cultural resources, and managed through legal or other effective means.
Categories of primary designated functions
Production Forest area designated primarily for production of wood, fibre, bio-energy and/or non-wood forest products.
Protection of soil and water Forest area designated primarily for protection of soil and water.
Conservation of biodiversity
Forest area designated primarily for conservation of biological diversity. Includes but is not limited to areas designated for biodiversity conservation within the protected areas.
Social services Forest area designated primarily for social services.
Multiple use Forest area designated primarily for more than one purpose and where none of these alone is considered as the predominant designated function.
Other Forest areas designated primarily for a function other than production, protection, conservation, social services or multiple use.
No / unknown No or unknown designation.
Special designation and management categories
Area of permanent forest estate (PFE)
Forest area that is designated to be retained as forest and may not be converted to other land use.
Forest area within protected areas
Forest area within formally established protected areas independently of the purpose for which the protected areas were established.
Forest area under sustain-able forest management
To be defined and documented by the country.
Forest area with management plan
Forest area that has a long-term (ten years or more) documented management plan, aiming at defined management goals, which is periodically revised.
3.2 National data
3.2.1 Data sources
References to sources of
information
Quality
(H/M/L)
Variable(s) Year(s) Additional comments
RePProT data (Forestry Planning Agency Statistic Baplan 2000) for 1990 data for Java (In Ind.)
H Extent 1985 Based on various remote sensing data interpretation
1982/1983, Forestland Use by Concensus, DGForesry, MoA
M Extent 1982/1983 Based on map overlaying,
1990, Forestland Use Designation (Penunjukan
M Extent 1990/1992 Based on map oevrlaying

FRA 2010 – Country Report, Indonesia
17
Kawasan Hutan dan Perairan), MoF
Final report on Indonesia Forest Resource, 1996 (In Indonesian)
H Extent 1986 – 1991
mostly 1989
Based on Landsat MSS interpretation data
Forestry Statistic book, Ministry of Forestry, 2000 (In Indonesia)
H Extent 2000 Based on Landsat Imagery interpretation
Indonesia Land Cover Recalculation 2003. (In Indonesia) Forestry Planning Agency, MoF
H Land cover, extent
1999/2000 Based on interpretation of Landsat 7 ETM+, acquired in 1999/2000 with field checking
Indonesia Land Cover Recalculation 2005. (In Indonesia) Forestry Planning Agency, MoF.
H Land cover, extent
2002/2003 Based on interpretation of Landsat 7 ETM+, acquired in 2002/2003 with field checking
Indonesia Land Cover Recalculation 2008. (In Indonesia) Forestry Planning Agency, Mo F.
H Land cover, extent
2005/2006 Based on interpretation of Landsat 7 ETM+, acquired in 2005/2006 with field checking
3.2.2 Classification and definitions
National class Definition
Production Forest (HP) State Forestland designated for production purposes
Limited production forest (HPT)
State Forestland designated for limited production purposes due to the topographic and soil condition
Convertible production forest (HPK)
Forestland designated for production purposes and reserved for non forestry purposes development. Forest type is mostly dry land forest.
Total production forest (HP+HPT+HPK)
Explanation : Sum of HP, HPT and HPK
Protection forest (HL) Forestland designated for protecting soil and hydrology
Conservation forest (HK)
Forestland designated for conservation purposes. In this class include national park, nature reserved, wildlife reserved, other protected areas
Non Forestland (APL) Land outside forestland which designated for non forestry purposes. Though this is not a forestland, community forest, forests occur on this land
Social services Forest/other wooded land designated for the provision of social services, eg., religion, cultural, education.
Multiple purpose
Forest/other wooded land designated to any combination of : production of goods, protection of soil and water, conservation of biodiversity and provision of social services and where none of these alone can be considered as being significantly more important than the others.
No or unknown function
Forest/other wooded land for which a specific function has not been designated or where designated function is unknown.
Permanent Forestland (Kawasan Hutan Tetap)
Land with permanent designation of forest land use (HP+HPT+HL+HK).
FRA 2010 – Country Report, Indonesia
18
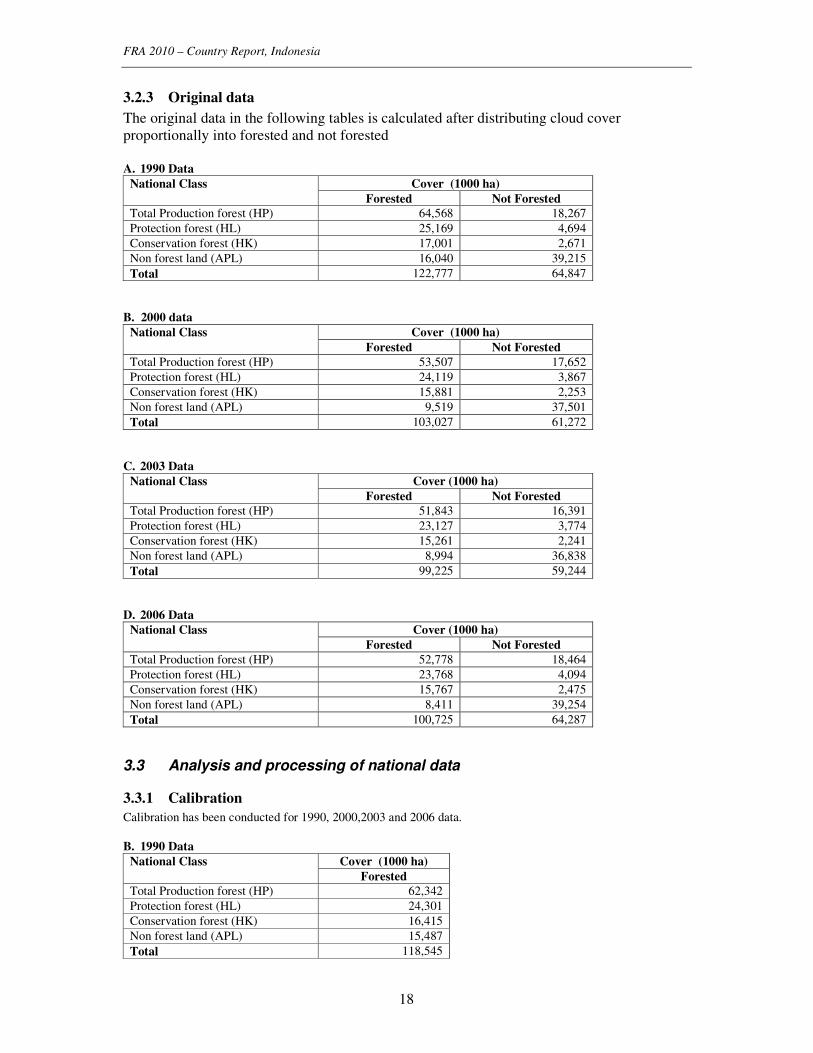
3.2.3 Original data
The original data in the following tables is calculated after distributing cloud cover proportionally into forested and not forested A. 1990 Data
Cover (1000 ha) National Class
Forested Not Forested
Total Production forest (HP) 64,568 18,267
Protection forest (HL) 25,169 4,694
Conservation forest (HK) 17,001 2,671
Non forest land (APL) 16,040 39,215
Total 122,777 64,847
B. 2000 data
Cover (1000 ha) National Class
Forested Not Forested
Total Production forest (HP) 53,507 17,652
Protection forest (HL) 24,119 3,867
Conservation forest (HK) 15,881 2,253
Non forest land (APL) 9,519 37,501
Total 103,027 61,272
C. 2003 Data
Cover (1000 ha) National Class
Forested Not Forested
Total Production forest (HP) 51,843 16,391
Protection forest (HL) 23,127 3,774
Conservation forest (HK) 15,261 2,241
Non forest land (APL) 8,994 36,838
Total 99,225 59,244
D. 2006 Data
Cover (1000 ha) National Class
Forested Not Forested
Total Production forest (HP) 52,778 18,464
Protection forest (HL) 23,768 4,094
Conservation forest (HK) 15,767 2,475
Non forest land (APL) 8,411 39,254
Total 100,725 64,287
3.3 Analysis and processing of national data
3.3.1 Calibration
Calibration has been conducted for 1990, 2000,2003 and 2006 data.
B. 1990 Data
Cover (1000 ha) National Class
Forested
Total Production forest (HP) 62,342
Protection forest (HL) 24,301
Conservation forest (HK) 16,415
Non forest land (APL) 15,487
Total 118,545

FRA 2010 – Country Report, Indonesia
19
B. 2000 data
Cover (1000 ha) National Class
Forested
Total Production forest (HP) 51,628
Protection forest (HL) 23,272
Conservation forest (HK) 15,324
Non forest land (APL) 9,185
Total 99,409
E. 2003 Data
Cover (1000 ha) National Class
Forested
Total Production forest (HP) 51884
Protection forest (HL) 23127
Conservation forest (HK) 15,261
Non forest land (APL) 8,994
Total 99,226
F. 2006 Data
Cover (1000 ha) National Class
Forested
Total Production forest (HP) 50,916
Protection forest (HL) 22,930
Conservation forest (HK) 15,211
Non forest land (APL) 8,115
Total 97,172
Note: A Calibration factor for 1990 data is:0.96553 B Calibration factor for 2000 data is:0.96487 C Calibration factor for 2003 data is:0.99067 D Calibration factor for 2006 data is:0.96473
3.3.2 Estimation and forecasting
Estimation is needed for 2005 and 2010 2005 data = 2003 data – [(2003 data – 2006 data)/3]*2 2010 data = 2006 data – [(2003 data – 2006 data)/3]*4
National categories 1990 2000 2003 2006 2005 2010
Production forest HP+HK+HPT 62342 51,628 51884 50916 51225 49680
Protection forest HL 24301 23,272 23127 22930 22996 22667
Conservation forest HK 16415 15,324 15261 15211 15228 15144
Non forest land APL 15487 9,185 8994 8115 8408 6941
Total forest 118545 99409 99226 97172 97857 94432

FRA 2010 – Country Report, Indonesia
20
3.3.3 Reclassification into FRA 2010 categories
FRA 2010 Categories National Class
Production Protection for soil and water
Conservation of biodiversity
Social services
Multiple purposes
No or unknown function
Production forest (HP)
100
Protection forest (HL)
100
Conservation forest (HK)
100
Non forestland 100
3.4 Data for Table T3
Table 3a – Primary designated function
Forest area (1000 hectares) FRA 2010 Categories
1990 2000 2005 2010
Production 62,342 51,628 51,225 49,680
Protection of soil and water 24,301 23,272 22,996 22,667
Conservation of biodiversity 16,415 15,324 15,228 15,144
Social services 0 0 0 0
Multiple use 0 0 0 0
Other (please specify in comments below the table) 0 0 0 0
No / unknown 15,487 9,185 8,408 6,941
TOTAL 118,545 99,409 97,857 94,432
Table 3b – Special designation and management categories
Forest area (1000 hectares) FRA 2010 Categories
1990 2000 2005 2010
Area of permanent forest estate 88,380 79,194 78,578 77,067
Forest area within protected areas 40,716 38,596 38,224 37,811
Forest area under sustainable forest management 59,790 43,600 33,450 n.a.
Forest area with management plan 76,205 58,924 48,678 n.a.

FRA 2010 – Country Report, Indonesia
21
3.5 Comments to Table T3
Variable /
category
Comments related to data, definitions, etc. Comments on the
reported trend
Production Most of production forest in Indonesia are managed by the private companies that controlled by Ministry of Forestry.
Protection of soil and water
It is assumed that forest areas with protection of soil and water function .
Conservation of biodiversity
The conservation of biodiversity data is the conservation forest that includes national park, nature conservation land and game preserve.
Social services
Multiple use
Other
No / unknown designation
Area of permanent forest estate
Area of permanent forest estate is the land that designated for forest land based on the forest function that include production forest (HP and HPT), conservation forest (HK) and protected forest (HL).
Forest area within protected areas
Forest area within protected areas include protected forest (HL) and conservation forest (HK)
Forest area under sustainable forest management
Forest area under sustainable forest management includes HPH and HT) HPH is forest utilization rights/ forestry concession area that hold by public or private legal entities such as nationally owned enterprises (BUMN), privately owned enterprises (BUMS), regionally owned enterprises (BUMD) and cooperative. The Minister of Forestry issues licenses for specific forested areas and also for specific periods of time. HTI is Industrial plantation forest in production forest
Forest area with management plan
Forest area with management plan includes production forest (HPH and HTI) and some conservation forests which are categorized as National Parks.
Other general comments to the table
Forest area under sustainable forest management and Forest area with management plan * base on statistic 2006 and remote sensing data. The forest based on forest function (conservation forest, production forest and protection forest) was derived from remote sensing data and designation forest land use map. Convertible Production Forest (HPK) is allocated for development of other sectors.

FRA 2010 – Country Report, Indonesia
22
4 Table T4 – Forest characteristics
4.1 FRA 2010 Categories and definitions
Term / category Definition
Naturally regenerated forest Forest predominantly composed of trees established through natural regeneration.
Introduced species A species, subspecies or lower taxon, occurring outside its natural range (past or present) and dispersal potential (i.e. outside the range it occupies naturally or could occupy without direct or indirect introduction or care by humans).
Characteristics categories
Primary forest Naturally regenerated forest of native species, where there are no clearly visible indications of human activities and the ecological processes are not significantly disturbed.
Other naturally regenerated forest Naturally regenerated forest where there are clearly visible indications of human activities.
Other naturally regenerated forest of introduced species (sub-category)
Other naturally regenerated forest where the trees are predominantly of introduced species.
Planted forest Forest predominantly composed of trees established through planting and/or deliberate seeding.
Planted forest of introduced species (sub-category)
Planted forest, where the planted/seeded trees are predominantly of introduced species.
Special categories
Rubber plantations Forest area with rubber tree plantations.
Mangroves Area of forest and other wooded land with mangrove vegetation.
Bamboo Area of forest and other wooded land with predominant bamboo vegetation.
4.2 National data
4.2.1 Data sources
References to sources of
information
Quality
(H/M/L)
Variable(s) Year(s) Additional comments
GOI. 2000. RePProT data (Forestry Planning Agency Statistic Baplan 2000) for 1990 data for Java (In Indonesian)
H Extent 1985 Based on various remote sensing data interpretation
GOI.1996. Final report on Indonesia Forest Resource (In Indonesian)
H Extent 1986 – 1991
mostly 1989
Based on Landsat MSS interpretation data
GOI. 2000. Forestry Statistic book, Ministry of Forestry (In Indonesia)
H Extent 2000 Based on Landsat Imagery interpretation
GOI, 2003. Indonesia Land Cover Recalculation 2003. (In
H Land cover, extent
1999/2000 Information of land cover based on interpretation of Landsat 7 ETM+ that acquired at 1999/2000 with

FRA 2010 – Country Report, Indonesia
23
Indonesia) Forestry Planning Agency, MoF
field sample plot
GOI, 2005. Indonesia Land Cover Recalculation 2005. (In Indonesia) Forestry Planning Agency, MoF
H Land cover, extent
2002/2003 Information of land cover based on interpretation of Landsat 7 ETM+ that acquired at 2002/2003 with field sample plot
GOI, 2008. Indonesia Land Cover Recalculation 2008. (In Indonesia) Forestry Planning Agency, MoF
H Land cover, extent
2005/2006 Information of land cover based on interpretation of Landsat 7 ETM+ that acquired at 2005/2006 with field sample plot
GOI. 2000. RePProT data (Forestry Planning Agency Statistic Baplan 2000) for 1990 data for Java (In Indonesian)
H Extent 1985 Based on various remote sensing data interpretation
GOI.1996. Final report on Indonesia Forest Resource (In Indonesian)
H Extent 1986 – 1991
mostly 1989
Based on Landsat MSS interpretation data
4.2.2 Classification and definitions
National class Definition
Primary Forest (Hutan Primer)
Explanation : Forest with no ocular evidence of disturbance. This is indicated by the occurrence of logging roads.
Secondary Forest (Hutan Sekunder)
Explanation : Forest with ocular evidence of disturbance
Planted Forest (Hutan Tanaman)
Explanation : Man made forest within legal forest boundaries
Rubber plantations Forest area with rubber tree plantations.
Mangroves Area of forest land with mangrove vegetation.
Bamboo Area of forest and other wooded land with predominant bamboo vegetation.
4.2.3 Original data
Forestland Forest classification on 1990 is different form forest classification on 2000, 2003 and 2006, which was standardized
Area (1000 ha) National Class
1990 * 2000 2003 2006
Primary Forest n.a. 45,791 44,465 44,095
Secondary Forest n.a. 43,225 44,053 42,622
Planted Forest n.a. 3,419 3,484 3,419
Total 105,300 92,435 92,001 90,136

FRA 2010 – Country Report, Indonesia
24
Non Forestland
Area (1000 ha) National Class
1990 * 2000 2003 2006
Primary Forest n.a. 1,231 1,129 1,051
Secondary Forest n.a. 6,946 6,887 6,034
Planted Forest n.a. 1,323 1,251 1,240
Total 9,500 9,267 8,325
Proportional cloud cover allocation
Forestland
Area (1000 ha) National Class
1990 2000 2003 2006
Primary Forest n.a. 46,345 45,197 45,181
Secondary Forest n.a. 43,709 44,778 43,482
Planted Forest n.a. 3,454 3,541 3,478
Total 106,737 93,507 93,517 92,142
Non Forestland
Area (1000 ha) National Class
1990 2000 2003 2006
Primary Forest n.a. 1,233 1,136 1,061
Secondary Forest n.a. 6,960 6,932 6,097
Planted Forest n.a. 1,326 1,259 1,253
Total 16,040 9,519 9,327 8,411
Area (1000 hectares) FRA 2010 Categories
1990 2000 2005 2010
Rubber plantations (Forest) n.a n.a n.a n.a
Mangroves (Forest and OWL) 3,153 3,593 3,448 3,207
Bamboo (Forest and OWL) n.a na 0.64 n.a
Mangrove area obtained from the Landsat image interpolation.
4.3 Analysis and processing of national data
4.3.1 Calibration
Calibration factors: 2000 is 0.94062 2003 is 0.94246 2006 is 0.94823

FRA 2010 – Country Report, Indonesia
25
National class Calibrated area (1000ha)
National class 1990 2000 2003 2006
Primary forest n.a. 49270 47956 47647
Secondary forest n.a. 46468 47512 45856
Planted forest n.a. 3672 3757 3668
Total 118,545 99,409 99,226 97,172
4.3.2 Estimation and forecasting
Estimation is needed for 2005. Estimation has been done using linear interpolation. Forecasting is required to predict the extent of forest based on the designated forest function in 2010. Forecasting has been done using linear extrapolation method. 2005 = 2003 - ((2003-2006)/3)*2
2010 = 2006 - ((2006-2003)/3)*4
Forest area (1000ha) 2005 2010
Primary forest 47750 47236
Secondary forest 46408 43647
Planted forest 3699 3548
Total 97857 94432
2005 data = 2003 data – [(2003 data – 2006 data)/3]*2 2010 data = 2006 data – [(2003 data – 2006 data)/3]*4
4.3.3 Reclassification into FRA 2010 categories
FRA 2010 categories National Class
Primary Other naturally
regenerated
forest
Planted forest
Primary forest 100
Secondary forest 100
Planted forest 100
4.4 Data for Table T4
Table 4a
Forest area (1000 hectares)
FRA 2010 Categories 1990 2000 2005 2010
Primary forest n.a. 49,270 47,750 47,236
Other naturally regenerated forest n.a. 46,467 46,408 43,647
...of which of introduced species n.a. n.a n.a n.a
Planted forest n.a. 3,672 3,699 3,549
...of which of introduced species n.a. n.a n.a n.a
TOTAL 118,545 99,409 97,857 94,432

FRA 2010 – Country Report, Indonesia
26
Table 4b
Area (1000 hectares)
FRA 2010 Categories 1990 2000 2005 2010
Rubber plantations (Forest) n.a n.a n.a n.a
Mangroves (Forest and OWL) 3,153 3,593 3,448 3,207
Bamboo (Forest and OWL) n.a na 0.64 n.a
4.5 Comments to Table T4
Variable /
category
Comments related to data, definitions,
etc.
Comments on the reported trend
Primary forest The extent of primary forest from 1990 until 2010 has been reduced. This caused by the land cover change from forest to other land (deforestation) and reducing of forest quality (degradation).
Other naturally regenerating forest
Other naturally regenerating forest also called secondary forest that is clearly visible indications of human activities, such as illegal logging, land occupation etc.
Planted forest Planted forest is man made forest within legal forest boundaries. This area was managed by the companies (HPH and HTI) and placed in production forest.
Rubber plantations
Mangroves
Bamboo Bamboo begins planted in 1997. For 2010 data, forecast was made by using 2000 and 2005 data
Other general comments to the table
It is difficult to match the forest classification for all assessments, since classification of forest in 1990 is different from others.

FRA 2010 – Country Report, Indonesia
27
5 Table T5 – Forest establishment and reforestation
5.1 FRA 2010 Categories and definitions
Term Definition
Afforestation Establishment of forest through planting and/or deliberate seeding on land that, until then, was not classified as forest.
Reforestation Re-establishment of forest through planting and/or deliberate seeding on land classified as forest.
Natural expansion of forest Expansion of forests through natural succession on land that, until then, was under another land use (e.g. forest succession on land previously used for agriculture).
5.2 National data
5.2.1 Data sources
References to sources of
information
Quality
(H/M/L)
Variable(s) Year(s) Additional comments
DG of Land Rehabilitation and Social Forestry. 2008. Statistic of development of land rehabilitation and social forestry. MoF
H extent 1980-2007
5.2.2 Classification and definitions
National class Definition
Afforestation The activities include urban forest, private forest, planting along the road side and environmental re-greening that was done outside forest land.
Reforestation Forest establishment include community forest and re-greening in forest land.
5.2.3 Original data
A. 1990 data
Annual forest establishment (hectares/year) National Class
1988 1989 1990 1991 1992
Afforestation 3,801 11,021 69,033 109,673 107,681
Reforestation 22,923 42,933 53,275 105,007 79,239
Total 26,724 53,954 122,308 214,680 186,920

FRA 2010 – Country Report, Indonesia
28
B. 2000 data
Annual forest establishment (hectares/year) National Class
1998 1999 2000 2001 2002
Afforestation 138,836 142,942 62,520 30,124 54,994
Reforestation 33,795 12,952 33,542 29,401 55,457
Total 172,631 155,894 96,062 59,525 110,451
C. 2005 data
Annual forest establishment (hectares/year) National Class
2003 2004 2005 2006 2007
Afforestation 241,872 376,918 60,820 300,207 272,286
Reforestation 64,359 345,850 30,217 250,813 78,468
Total 306,231 722,768 91,037 551,020 350,754
5.3 Analysis and processing of national data
5.3.1 Calibration
There is no need for calibration for processing the national data.
5.3.2 Estimation and forecasting
5.3.3 Reclassification into FRA 2010 categories
5.4 Data for Table T5
Annual forest establishment
(hectares/year)
...of which of introduced species 1)
(hectares/year) FRA 2010 Categories
1990 2000 2005 1990 2000 2005
Afforestation 60,241.8 85,883.20 250,420.6 n.a n.a n.a
Reforestation 60,675.4 33,029.4 153,941.4 n.a n.a n.a
...of which on areas previously planted n.a n.a n.a n.a n.a n.a
Natural expansion of forest n.a n.a n.a n.a n.a n.a
Note: The figures for the reporting years refer to the averages for the 5-year periods 1988-1992, 1998-2002 and 2003-2007 respectively.

FRA 2010 – Country Report, Indonesia
29
5.5 Comments to Table T5
Variable /
category
Comments related to data, definitions,
etc.
Comments on the reported trend
Afforestation The afforestation data are also based on the terrestrial survey. The afforestation activities include community forest (Hutan Rakyat), terras rehabilitation, city forest, mangrove rehabilitation and development of community forest outside forestland. Oil palms plantation do not include at this activity. Afforestation activities in Ministry of Forestry also have other activities, such as rehabilitation along river and road
Reforestation The reforestation data based on the terrestrial survey. The reforestation activities include re-greening, social forestry and community forest (HKm) in forestland.
Natural expansion of forest
Other general comments to the table
Reforestation programs and the development of plantation forests have a different target location, although both are in forestland. Plantation forests are forests established in forestland under concessions. Reforestation is carried out in forestland that are not being utilized or no utilization rights (eg. forest consessions) on that, therefore reforestation is definitely located outside of forest plantations. Many reforestation and afforestation activities could not be monitored by using Landsat imges, due to the wide spread location and only a few hectares

FRA 2010 – Country Report, Indonesia
30
6 Table T6 – Growing stock
6.1 FRA 2010 Categories and definitions
Category Definition
Growing stock Volume over bark of all living trees more than X cm in diameter at breast height (or above buttress if these are higher). Includes the stem from ground level or stump height up to a top diameter of Y cm, and may also include branches to a minimum diameter of W cm.
6.2 National data
6.2.1 Data sources
References to sources of
information
Quality
(H/M/L)
Variable(s) Year(s) Additional comments
National forest inventory (Forest Resource statistic) with 1853 plot
H Volume 1990 – 1996
Reference year become 1992.
National forest inventory (Reenumeration data) with 605 plot
H Volume 1996 – 2000
Reference year become 1998.
National forest inventory (Reenumeration data) with 91 plot
H Volume 2000 – 2005
Reference year become 2003.
6.2.2 Classification and definitions
National class Definition
Volume for all species (Volume seluruh jenis)
Volume of all species with diameter of 20 cm or more at breast height or 20 cm above buttress.
6.2.3 Original data
All Species
1992 1998 2003 National Class
Area (000 ha)
Volume m3/ha
GS 20 up ‘000 m3
Area (000 ha)
Volume m3/ha
GS 20 up ‘000 m3
Area (000 ha)
Volume m3/ha
GS 20 up ‘000 m3
All forest below 1,000 m altitude (lowland, swamp and mangrove
99,239 124.4 12,345.36 88,680 137.4 12,186.41 83,762 130.2 10,906.65
Note : GS = Growing Stock The original data for 10 most dominant species and others as the result of re enumeration for NFI’s PSP data. The reference year is 1998.

FRA 2010 – Country Report, Indonesia
31
No. Local Name (Botanical name) Growing stock (mill. m3)
1 Meranti (Shorea sp) 1.165,3
2 Medang (Beilschmiedia sp) 332,7
3 Keruing (Dipterocarpus sp) 316,2
4 Kelat (Eugenia sp) 118,7
5 Bintangur (Terminalia sp) 98,8
6 Nyatoh (Palaquium sp) 116,1
7 Jambu-jambu (Dysoxyllum sp) 71,9
8 Ubah (Eugenia sp) 81,4
9 Resak (Shorea sp) 71,9
10 Balam (Palaquium sp) 73,6
11 Others 6.608,2
Total 9.054,8
6.3 Analysis and processing of national data
6.3.1 Calibration
There is no calibration for processing the national data.
6.3.2 Estimation and forecasting
Natural forest
Estimation and forecasted by calculated using the following formula : - 1990 data = 1992 + (((1992 – 1998)/6)*2) - 2000 data = 1998 – (((1998 – 1992)/6)*2) - 2005 data = 2003 + (((2003-1998)/5)*2) - 2010 data = 2003 + (((2003-1998)/5)*7)
A. Growing Stock per hectare
Estimation of growing stock is carried out for all forest (natural forest and plantation forest)
Volume (m3/ha)
Variable
1992 1998 2003 1990 2000 2005 2010
Growing Stock per hectare
124.40 137.40 130.20 120.07 133.07 127.32 120.12
B. Growing Stock
Since the growing stock per hectare has been assumed for all forest, then the data in table 1 is used to calculate total growing stock Variables Growing Stock in million m3
1990 2000 2005 2010
Extent of forest (000 ha) 118,545 99,409 97,857 94,432
Growing stock per ha 120.07 133.07 127.32 120.12
Total Growing Stock in million m3 14,234 13,228 12,459 11,343

FRA 2010 – Country Report, Indonesia
32
C. Growing stock of the 10 most common species
Same growing stock composition in percentage has been applied to the growing stock of 1990, 2000 and 2005.
6.3.3 Reclassification into FRA 2010 categories
FRA 2010 Categories
National Class
Growing Stock
Volume for all species (Seluruh Jenis) 100
6.4 Data for Table T6
Table 6a – Growing stock
Volume (million cubic meters over bark)
Forest Other wooded land FRA 2010 category
1990 2000 2005 2010 1990 2000 2005 2010
Total growing stock 14,233 13,229 12,459 11,343 n.a. n.a. n.a. n.a.
... of which coniferous
... of which broadleaved Growing stock of commercial species
n.a. n.a. n.a. n.a. n.a. n.a. n.a. n.a.
Table 6b – Growing stock of the 10 most common species
FRA 2010 category / Species name Growing stock in forest
(million cubic meters)
Rank Scientific name Common name 1990 2000 2005
1st Shorea sp Meranti 1832 1702 1603
2nd Beilschmiedia sp Medang 523 486 458
3rd Dipterocarpus sp Keruing 497 462 435
4th Eugenia sp Kelat 187 173 163
5th Terminalia sp Bintangur 155 144 136
6th Palaquium sp Nyatoh 182 170 160
7th Dysoxyllum sp Jambu-jambu 113 105 99
8th Eugenia sp Ubah 128 119 112
9th Shorea sp Resak 113 105 99
10th Palaquium sp Balam 116 108 101
Remaining 10387 9655 9093
TOTAL 14,233 13,229 12,459
Note: Rank refers to the order of importance in terms of growing stock, i.e. 1st is the species with the highest growing stock. Year 2000 is the reference year for defining the species list and the order of the species.

FRA 2010 – Country Report, Indonesia
33
Table 6c – Specification of threshold values
Item Value Complementary information
Minimum diameter (cm) at breast height1 of trees included in growing stock (X)
This threshold is only for natural forest.
Minimum diameter (cm) at the top end of stem for calculation of growing stock (Y)
Top end of stem is the position of the first branch
Minimum diameter (cm) of branches included in growing stock (W)
Branches are not included in the growing stock calculation
Volume refers to “above ground” (AG) or “above stump” (AS)
6.5 Comments to Table T6
Variable /
category
Comments related to data, definitions,
etc.
Comments on the reported trend
Total growing stock
The growing stock for 1992 is only from natural forest, since the growing stock from plantation forest was not available. The growing stock for 1998 is taken from natural forest and from Java plantation forest. The growing stock for 2003 data to estimate 2005 and 2010 figures were taken from natural forest data of NFI 1996 – 2006.
Growing stock of broadleaved / coniferous
Growing stock of commercial species
Growing stock composition
Other general comments to the table
Total growing stock calculated for all species includes commercial and non commercial species. Growing stock for year 2005 is calculated based on inventory data between 1998 – 2003
1 Diameter at breast height (DBH) refers to diameter over bark measured at a height of 1.30 m above ground level or 30 cm above buttresses if these are higher than 1 m.
FRA 2010 – Country Report, Indonesia
34
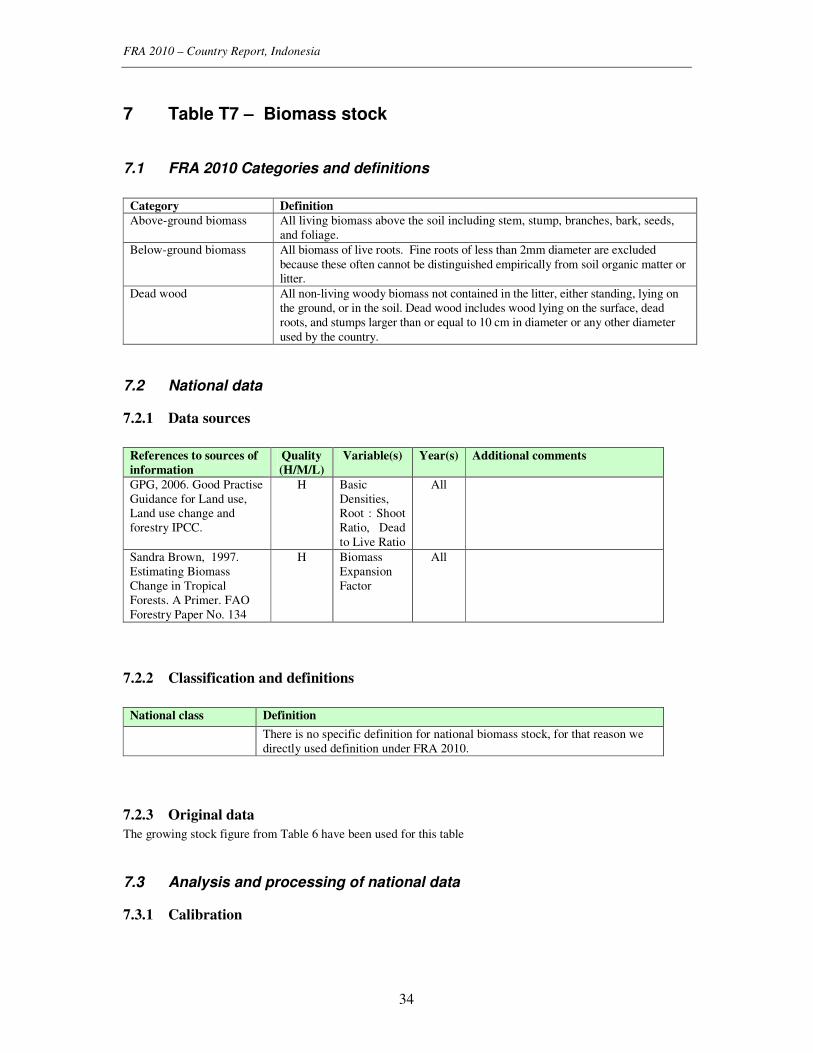
7 Table T7 – Biomass stock
7.1 FRA 2010 Categories and definitions
Category Definition
Above-ground biomass All living biomass above the soil including stem, stump, branches, bark, seeds, and foliage.
Below-ground biomass All biomass of live roots. Fine roots of less than 2mm diameter are excluded because these often cannot be distinguished empirically from soil organic matter or litter.
Dead wood All non-living woody biomass not contained in the litter, either standing, lying on the ground, or in the soil. Dead wood includes wood lying on the surface, dead roots, and stumps larger than or equal to 10 cm in diameter or any other diameter used by the country.
7.2 National data
7.2.1 Data sources
References to sources of
information
Quality
(H/M/L)
Variable(s) Year(s) Additional comments
GPG, 2006. Good Practise Guidance for Land use, Land use change and forestry IPCC.
H Basic Densities, Root : Shoot Ratio, Dead to Live Ratio
All
Sandra Brown, 1997. Estimating Biomass Change in Tropical Forests. A Primer. FAO Forestry Paper No. 134
H Biomass Expansion Factor
All
7.2.2 Classification and definitions
National class Definition
There is no specific definition for national biomass stock, for that reason we directly used definition under FRA 2010.
7.2.3 Original data
The growing stock figure from Table 6 have been used for this table
7.3 Analysis and processing of national data
7.3.1 Calibration

FRA 2010 – Country Report, Indonesia
35
7.3.2 Estimation and forecasting
A. Above Ground Biomass
Variables Unit 1990 2000 2005 2010
Growing stock (Table 6) million ha 14,234 13,228 12,459 11,343
Wighted wood density 0.54 0.54 0.54 0.54
Stem Biomass million tonnes
7,686 7,143 6,728 6,125
Stem Biomass tonnes/ha 643 598 563 512
BEF 3.4 3.4 3.4 3.4
Above Ground Biomass million tonnes 26,134 24,287 22,875 20,826
Biomass expamsion factor (BEF) was calculated using the following formula: BEF = Exp{3.213-0.506*LN(BM)} (Brown, Sandra 1997. Estimating biomass change in tropical forests. A primier. FAO Forestry Paper No. 134.). B. Below Ground Biomass
Variables Unit 1990 2000 2005 2010
Default Root Shoot Ratio 0.33 0.33 0.33 0.33
Above Ground Biomass million tonnes 26,134 24,287 22,875 20,826
Below Ground Biomass million tonnes 8,624 8,015 7,549 6,872
Total live Biomass million tonnes 34,758 32,301 30,423 27,698
7.3.3 Reclassification into FRA 2010 categories
Reclassification is not needed.
7.4 Data for Table T7
Biomass (million metric tonnes oven-dry weight)
Forest Other wooded land FRA 2010 category
1990 2000 2005 2010 1990 2000 2005 2010
Above-ground biomass 26,134 24,287 22,875 20,826 n.a. n.a. n.a. n.a. Below-ground biomass 8,624 8,015 7,549 6,872 n.a. n.a. n.a. n.a. Dead wood n.a. n.a. n.a. n.a. n.a. n.a. n.a. n.a. TOTAL n.a. n.a. n.a. n.a. n.a. n.a. n.a. n.a.
7.5 Comments to Table T7
Variable / category Comments related to data, definitions, etc. Comments on the reported trend
Above-ground biomass
Below-ground biomass
Dead wood
Other general comments to the table
Biomass is only calculated for the forest, since there is inadequate data to calculate other category (other wooded land)

FRA 2010 – Country Report, Indonesia
36
8 Table T8 – Carbon stock
8.1 FRA 2010 Categories and definitions
Category Definition
Carbon in above-ground biomass Carbon in all living biomass above the soil, including stem, stump, branches, bark, seeds, and foliage.
Carbon in below-ground biomass Carbon in all biomass of live roots. Fine roots of less than 2 mm diameter are excluded, because these often cannot be distinguished empirically from soil organic matter or litter.
Carbon in dead wood Carbon in all non-living woody biomass not contained in the litter, either standing, lying on the ground, or in the soil. Dead wood includes wood lying on the surface, dead roots, and stumps larger than or equal to 10 cm in diameter or any other diameter used by the country.
Carbon in litter Carbon in all non-living biomass with a diameter less than the minimum diameter for dead wood (e.g. 10 cm), lying dead in various states of decomposition above the mineral or organic soil.
Soil carbon Organic carbon in mineral and organic soils (including peat) to a specified depth chosen by the country and applied consistently through the time series.
8.2 National data
8.2.1 Data sources
References to sources of
information
Quality
(H/M/L)
Variable(s) Year(s) Additional comments
GPG, 2006. Good Practise Guidance for Land use, Land use Change and Forestry. IPPC.
H Basic Densities, Root : Shoot Ratio, Dead to Live Ratio
All
8.2.2 Classification and definitions
National class Definition
There is no specific classes and definition relating to this table.
8.2.3 Original data
The original data to calculate carbon stock were taken from biomass stock Table 7
8.3 Analysis and processing of national data
8.3.1 Calibration
No calibration is needed.

FRA 2010 – Country Report, Indonesia
37
8.3.2 Estimation and forecasting
The default conversion factor (biomass to carbon) of 0.47 adopted from IPCC GPG, 2006 was used to estimate carbon stock in forest.
Variables Unit 1990 2000 2005 2010
Above ground biomass 26,132 24,288 22,875 20,824
Default factor 0.47 0.47 0.47 0.47
Carbon in Above ground biomass million tonnes 12,282 11,415 10,751 9,787
Below ground biomass 8,624 8,015 7,549 6,872
Default factor 0.47 0.47 0.47 0.47
Carbon in Below ground biomass million tonnes 4,053 3,767 3,548 3,230
Total million tonnes 16,335 15,182 14,299 13,017
Variables Unit 1990 2000 2005 2010
Above ground biomass 26,134 24,287 22,875 20,826
Default factor 0.47 0.47 0.47 0.47
Carbon in Above ground biomass million tonnes 12,283 11,415 10,751 9,788
Below ground biomass 8,624 8,015 7,549 6,872
Default factor 0.47 0.47 0.47 0.47
Carbon in Below ground biomass million tonnes 4,053 3,767 3,548 3,230
Total million tonnes 16,336 15,182 14,299 13,018
8.4 Data for Table T8
Carbon (Million metric tonnes)
Forest Other wooded land FRA 2010 Category
1990 2000 2005 2010 1990 2000 2005 2010
Carbon in above-ground biomass
12,282 11,415 10,751 9,787 n.a. n.a. n.a. n.a.
Carbon in below-ground biomass
4,053 3,767 3,548 3,230 n.a. n.a. n.a. n.a.
Sub-total: Living
biomass 16,335 15,182 14,299 13,017 n.a. n.a. n.a. n.a.
Carbon in dead wood
n.a. n.a. n.a. n.a. n.a. n.a. n.a. n.a.
Carbon in litter n.a. n.a. n.a. n.a. n.a. n.a. n.a. n.a.
Sub-total: Dead
wood and litter n.a. n.a. n.a. n.a. n.a. n.a. n.a. n.a.
Soil carbon n.a. n.a. n.a. n.a. n.a. n.a. n.a. n.a.
TOTAL n.a. n.a. n.a. n.a. n.a. n.a. n.a. n.a.
Soil depth (cm) used for soil carbon estimates

FRA 2010 – Country Report, Indonesia
38
8.5 Comments to Table T8
Variable / category Comments related to data, definitions, etc. Comments on the reported trend
Carbon in above-ground biomass
Carbon in below-ground biomass
Carbon in dead wood
Carbon in litter
Soil carbon
Other general comments to the table
Same as biomass stock, carbon stock for 1990 and 2005 are calculated from stocks per hectare for natural forest
and only for living biomass

FRA 2010 – Country Report, Indonesia
39
9 Table T9 – Forest fires
9.1 FRA 2010 Categories and definitions
Category Definition
Number of fires Average number of vegetation fires per year in the country.
Area affected by fire Average area affected by vegetation fires per year in the country.
Vegetation fire (supplementary term)
Any vegetation fire regardless of ignition source, damage or benefit.
Wildfire Any unplanned and/or uncontrolled vegetation fire.
Planned fire A vegetation fire regardless of ignition source that burns according to management objectives and requires limited or no suppression action.
9.2 National data
9.2.1 Data sources
References to sources of
information
Quality
(H/M/L)
Variable(s) Year(s) Additional comments
GOI. 1989. Forestry statistic 1988/1989
H/M Extent 1988
GOI. 1990. Forestry statistic 1989/1990
H/M Extent 1989
GOI. 1991. Forestry statistic 1990/1991
H/M Extent 1990
GOI. 1992. Forestry statistic 1991/1992
H/M Extent 1991
GOI. 1993. Forestry statistic 1992/1993
H/M Extent 1992
GOI. 2000. DG of Forest Area Protection Statistic
H/M Extent 2000
GOI. 2001. DG of Forest Protection and Nature Conservation Statistic
H/M Extent 2001
GOI. 2002. DG of Forest Protection and Nature Conservation Statistic
H/M Extent 2002
GOI. 2003. DG of Forest Protection and Nature Conservation Statistic
H/M Extent 2003
GOI. 2004. DG of Forest Protection and Nature Conservation Statistic
H/M Extent 2004
GOI. 2005. DG of Forest Protection and Nature Conservation Statistic
H/M Extent 2005
GOI. 2006. DG of Forest Protection and Nature Conservation Statistic
H/M Extent 2006
GOI. 2007. Regional report (Jan-Des)
H/M Extent 2007 Regularly report from regional forestry (province and district), National Park, Nature resource Conservation,HPH, communication radio.

FRA 2010 – Country Report, Indonesia
40
9.2.2 Classification and definitions
National class Definition
Kebakaran hutan (Forest fire) Wildfire in the forestland
9.2.3 Original data
A. 1990 data
Extent (Ha)
National Class 1988 1989 1990 1991 1992
Kebakaran Hutan (Forest Fire) 7,769 15,885 34,241 118,462 14,286
B. 2000 data
Extent (Ha)
National Class 1998 1999 2000 2001 2002
Kebakaran Hutan (Forest Fire) 515,026 44,090 3,017 14,330 35,497
C. 2005 data
Extent (Ha)
National Class 2003 2004 2005 2006 2007
Kebakaran Hutan (Forest Fire) 3,545.45 3,343.99 5,502.47 4,241.59 7,077.52
9.3 Analysis and processing of national data
9.3.1 Calibration
No calibration is needed for Table 9.
9.3.2 Estimation and forecasting
Average extent (1000 ha)
National class 1990 2000 2005
Kebakaran Hutan (Forest Fire) 38.129 122.39 4.74
9.3.3 Reclassification into FRA 2010 categories
National Class FRA categories
Disturbance by Fire
Disturbance by Insect
Disturbance by disease
Other disturbance
Kebakaran hutan (Forest fire)
100

FRA 2010 – Country Report, Indonesia
41
9.4 Data for Table T9
Table 9a
Annual average for 5-year period
1990 2000 2005 FRA 2010 category 1000
hectares
number
of fires
1000
hectares
number
of fires
1000
hectares
number of
fires
Total land area affected by fire n.a n.a n.a n.a n.a n.a
... of which on forest 38.129 n.a 122.39 n.a 4.74 n.a
... of which on other wooded land n.a n.a n.a n.a n.a n.a
... of which on other land n.a n.a n.a n.a n.a n.a
Table 9b
Proportion of forest area affected by fire (%) FRA 2010 category
1990 2000 2005
Wildfire 100 100 100
Planned fire 0 0 0
Note: The figures for the reporting years refer to the averages of annually affected areas for the 5-year periods 1988-1992, 1998-2002 and 2003-2007 respectively
9.5 Comments to Table T9
Variable /
category
Comments related to data, definitions,
etc.
Comments on the reported trend
Area affected by fire
Area affected by fire reported in this table was occurred in forestland. Proportion of forest area that affected by fire is 0.004% .
Data of forest fire show that the biggest forest fire occurred in the period 1998-2002. This condition was caused by forest fires in Riau (Sumatra) and East Kalimantan between 1997-1998. In the period 2003-2007, data of forest fires decreased. After 2000, Indonesia began to protect and monitor forest fire. Ministry of Forestry not only use hot spot data from satellite images but also formalize a ranger quick response unit (SPORC) to control forest fire.
Number of fires Number of fires data was not available.
Wildfire / planned fire
All forest fires in Indonesia are wildfire.
Other general comments to the table
Forest fire data is taken from Forestry Statistic, particularly for 1989, the data is calculated from reports submitted by regional offices. These reports were documented by Directorate of Forest Fire Control, Directorate General of Forest Protection and Nature Conservation.

FRA 2010 – Country Report, Indonesia
42
10 Table T10 – Other disturbances affecting forest health and vitality
10.1 FRA 2010 Categories and definitions
Term Definition
Disturbance Damage caused by any factor (biotic or abiotic) that adversely affects the vigour and productivity of the forest and which is not a direct result of human activities.
Invasive species Species that are non-native to a particular ecosystem and whose introduction and spread cause, or are likely to cause, socio-cultural, economic or environmental harm or harm to human health.
Category Definition
Disturbance by insects Disturbance caused by insect pests.
Disturbance by diseases Disturbance caused by diseases attributable to pathogens, such as bacteria, fungi, phytoplasma or virus.
Disturbance by other biotic agents
Disturbance caused by biotic agents other than insects or diseases, such as wildlife browsing, grazing, physical damage by animals, etc.
Disturbance caused by abiotic factors
Disturbances caused by abiotic factors, such as air pollution, snow, storm, drought, etc.
10.2 National data
10.2.1 Data sources
References to sources of
information
Quality
(H/M/L)
Variable(s) Year(s) Additional comments
GOI. 1989. Forestry statistic 1988/1989
H/M
Extent
1988
GOI. 1990. Forestry statistic 1989/1990
H/M
Extent
1989
GOI. 1991. Forestry statistic 1990/1991
H/M
Extent
1990
GOI. 1992. Forestry statistic 1991/1992
H/M Extent 1991
GOI. 1993. Forestry statistic 1992/1993
H/M Extent 1992
GOI. 2000. DG of Forest Area Protection Statistic
H/M Extent 2000
GOI. 2001. DG of Forest Protection and Nature Conservation Statistic
H/M Extent 2001
GOI. 2002. DG of Forest Protection and Nature Conservation Statistic
H/M Extent 2002

FRA 2010 – Country Report, Indonesia
43
GOI. 2003. DG of Forest Protection and Nature Conservation Statistic
H/M Extent 2003
GOI. 2004. DG of Forest Protection and Nature Conservation Statistic
H/M Extent 2004
GOI. 2005. DG of Forest Protection and Nature Conservation Statistic
H/M Extent 2005
GOI. 2006. DG of Forest Protection and Nature Conservation Statistic
H/M Extent 2006
GOI. 2007. Regional report (Jan-Des)
H/M Extent 2007 Regularly report from regional forestry (province and district), National Park, Nature resource Conservation, HPH, communication radio.
10.2.2 Classification and definitions
National class Definition
Hama dan penyakit (Insect and disease)
Forest disturbance due to insect or disease
Media 43hysic (Biotic agents)
Forest disturbance due to biotic agents other than insects or disases, such as wildlife browsing, grazing, physical damage by animal, etc.
10.2.3 Original data
A. 1990 data
Extent (Ha)
National Class 1988 1989 1990 1991 1992
Hama dan Penyakit (Insect and diseases) 1,230 11,883 0 490
B. 2000 data
Extent (Ha) National Class 1998 1999 2000 2001 2002
Hama dan Penyakit (Insect and diseases) n.a n.a n.a n.a n.a C. 2005 data
Extent (Ha)
National Class 2003 2004 2005 2006 2007
Hama dan Penyakit (Insect and diseases) n.a n.a n.a n.a n.a
10.3 Analysis and processing of national data
10.3.1 Calibration
No calibration is needed for Table 10.
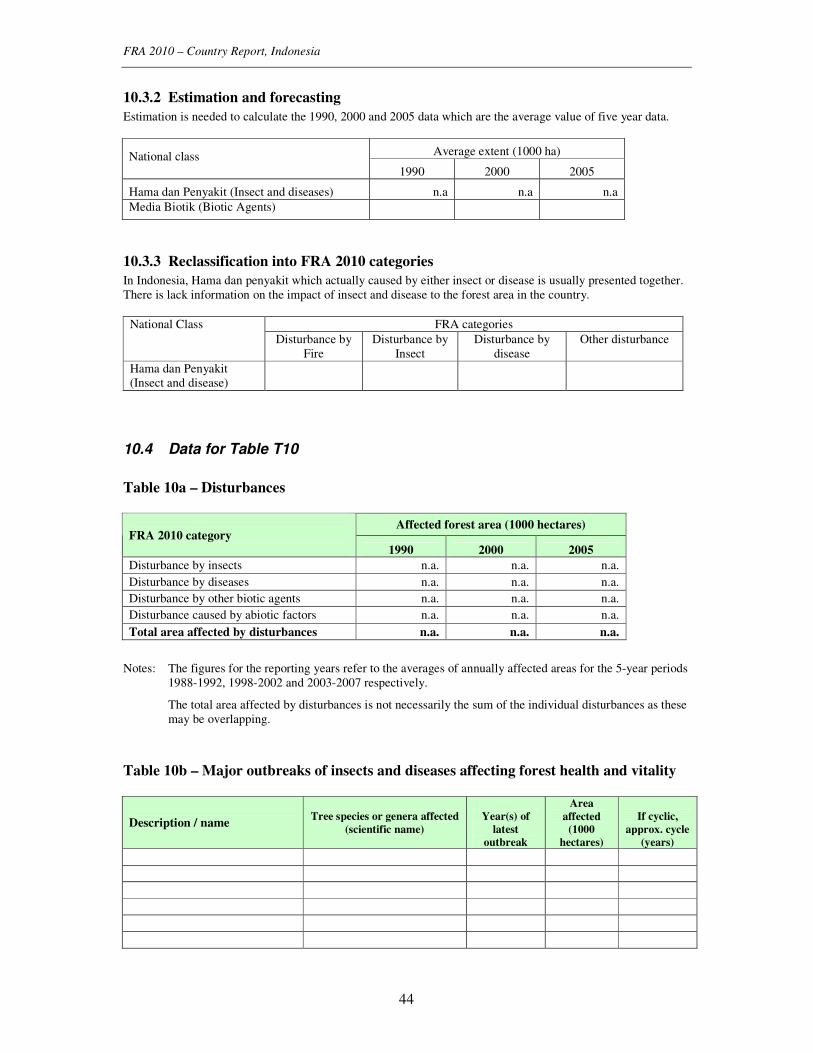
FRA 2010 – Country Report, Indonesia
44
10.3.2 Estimation and forecasting
Estimation is needed to calculate the 1990, 2000 and 2005 data which are the average value of five year data.
Average extent (1000 ha) National class 1990 2000 2005
Hama dan Penyakit (Insect and diseases) n.a n.a n.a
Media Biotik (Biotic Agents)
10.3.3 Reclassification into FRA 2010 categories
In Indonesia, Hama dan penyakit which actually caused by either insect or disease is usually presented together. There is lack information on the impact of insect and disease to the forest area in the country.
FRA categories National Class
Disturbance by Fire
Disturbance by Insect
Disturbance by disease
Other disturbance
Hama dan Penyakit (Insect and disease)
10.4 Data for Table T10
Table 10a – Disturbances
Affected forest area (1000 hectares)
FRA 2010 category
1990 2000 2005
Disturbance by insects n.a. n.a. n.a.
Disturbance by diseases n.a. n.a. n.a.
Disturbance by other biotic agents n.a. n.a. n.a.
Disturbance caused by abiotic factors n.a. n.a. n.a.
Total area affected by disturbances n.a. n.a. n.a.
Notes: The figures for the reporting years refer to the averages of annually affected areas for the 5-year periods 1988-1992, 1998-2002 and 2003-2007 respectively.
The total area affected by disturbances is not necessarily the sum of the individual disturbances as these may be overlapping.
Table 10b – Major outbreaks of insects and diseases affecting forest health and vitality
Description / name Tree species or genera affected
(scientific name)
Year(s) of
latest
outbreak
Area
affected
(1000
hectares)
If cyclic,
approx. cycle
(years)

FRA 2010 – Country Report, Indonesia
45
Note: Area affected refers to the total area affected during the outbreak.
Table 10c – Area of forest affected by woody invasive species
Scientific name of woody invasive species
Forest area
affected 2005
(1000 hectares)
Total forest area affected by woody invasive species
Note: The total forest area affected by woody invasive species is not necessary the sum of the values above, as
these may be overlapping.
10.5 Comments to Table T10
Variable /
category
Comments related to data, definitions,
etc.
Comments on the reported trend
Disturbance by insects
No available data of insects type that affecting forest health and vitality.
Disturbance by diseases
Disturbance by other biotic agents
Disturbance caused by abiotic factors
Major outbreaks
Invasive species
Other general comments to the table
The disturbances reported in this table were disturbances which occurred in the forestland. n.a. : data is not available from the regional offices.

FRA 2010 – Country Report, Indonesia
46
11 Table T11 – Wood removals and value of removals
11.1 FRA 2010 Categories and definitions
Category Definition
Industrial roundwood removals
The wood removed (volume of roundwood over bark) for production of goods and services other than energy production (woodfuel).
Woodfuel removals
The wood removed for energy production purposes, regardless whether for industrial, commercial or domestic use.
11.2 National data
11.2.1 Data sources
References to sources of
information
Quality
(H/M/L)
Variable(s) Year(s) Additional comments
GOI. 1990. Directorate general of Forest Utilization
M
Volume of industrial
roundwood
1990
GOI. 2000. Directorate of Natural Forest Development
M
Volume of industrial
roundwood
2000
GOI. 1994. Pocket Statistic Book of Perum Perhutani
H
Volume of industrial
roundwood
1990
Year 1990-1994
GOI. 2001. Perum Perhutani Statistic 2001
H Volume of industrial
roundwood
2000
GOI. 2005. DG of Forest Production Development
H Volume of industrial
roundwood
2005 Data source: Directorate-NFD, Directorate of Forest Product Distribution, TIU
GOI. 2006. DG of Forest Production Development
H Volume of industrial
roundwood
2006 Data source: Directorate General of Forest Production Development and Forestry Provincial Office of Central Sulawesi
FAO STAT Volume of woodfuel
1990-2006
11.2.2 Classification and definitions
National class Definition
Industrial roundwood removals
The wood removed (volume of roundwood over bark) for production of goods and services other than energy production (woodfuel).
Woodfuel removals
The wood removed for energy production purposes, regardless whether for industrial, commercial or domestic use.

FRA 2010 – Country Report, Indonesia
47
11.2.3 Original data
A.1990 data
Natural Forest (1000m3) Plantation forest (1000m3) National Class
1988 1989 1990 1991 1992 1988 1989 1990 1991 1992
Industrial roundwood (bahan baku industry; Ind)
27,566 27,760 22,165 26,127 23,809 0 0 0 0 0
Production of woodfuel (1000 m3 under bark)
National Class
1988 1989 1990 1991 1992
Fuel wood (kayu bakar; Ind) 135,748 130,814 126,043 120,776 115,666
(Source: FAOSTAT | © FAO Statistics Division 2008 | 29 January 2008)
A. 2000 data
Natural Forest (1000m3) Plantation forest (1000m3) National Class
1998 1999 2000 2001 2002 1998 1999 2000 2001 2002
Industrial roundwood (bahan baku industry; Ind)
25,636 16,236 17,646 4,133 3,203 3,514 2,791 2,974 7,023 5,802
Production of woodfuel (1000 m3 under bark)
National Class
1998 1999 2000 2001 2002
Fuel wood (kayu bakar; Ind) 91,892 90,417 88,981 85,712 82,555
(Source: FAOSTAT | © FAO Statistics Division 2008 | 29 January 2008)
B. 2005 data
Natural Forest (1000m3) Plantation forest (1000m3) National Class 2003 2004 2005 2006 2007 2003 2004 2005 2006 2007
Industrial roundwood (bahan baku industri; Ind)
5,061 5,143 9,335 9,021 634 6,362 8,406 14,888 12,771 521
Production of woodfuel (1000 m3 under bark)
National Class
2003 2004 2005 2006 2007
Fuel wood (kayu bakar; Ind) 79,508 76,564 73,720 70,719 n.a
(Source: FAOSTAT | © FAO Statistics Division 2008 | 29 January 2008)
Production of woodfuel (1000 m3 under bark)
1988 1989 1990 1991 1992 1998 1999
135748.0 130814.4 126043.5 120775.6 115665.9 91892.0 90416.9
2000 2001 2002 2003 2004 2005 2006
88981.1 85712.1 82555.8 79507.7 76563.8 73719.9 70719.2
(Source: FAOSTAT | © FAO Statistics Division 2008 | 29 January 2008)

FRA 2010 – Country Report, Indonesia
48
11.3 Analysis and processing of national data
11.3.1 Calibration
No calibration is needed
11.3.2 Estimation and forecasting
Estimation is needed to calculate the 1990, 2000 and 2005 data which are the average value of five year data.
Natural Forest (1000m3) Plantation forest (1000m3) National class
1990 2000 2005 1990 2000 2005
Industrial roundwood (bahan baku industri; Ind)
25.485 13,371 5,839 n.a 4,421 8,590
Production of woodfuel (1000 m3 under bark)
National class 1990 2000 2005
Fuel wood (kayu bakar; Ind)
125,809 87,911 75,128
The Woodfuel removal is estimated by following method using the original data mentioned above.
Average removal of Woodfuel (under bark) The average figure (1988 - 1992) are 125809.50 (1000 m3) and used for 1990. The average figure (1998 - 2002) are 87911.58 (1000 m3) and used for 2000. The average figure (2003 - 2006) are 75127.65 (1000 m3) and used for 2005.
The reported figures on woodfuel removals above are volume under bark while FRA 2010 requests information on removal as volume over bark. In order to use the data to make estimations for table T11, the figures are converted to volume over bark by applying a bark factor. A global default conversion factor of 1.15 is used for converting volume under bark to volume over bark.
For 1990: 125809.50 * 1.15 = 144680.9 For 2000: 87911.58 * 1.15 = 101098.3 For 2005: 75127.65 * 1.15 = 86396.8
11.3.3 Reclassification into FRA 2010 categories
11.4 Data for Table T11
Industrial roundwood
removals Woodfuel removals
FRA 2010 Category
1990 2000 2005 1990 2000 2005
Total volume (1000 m3 o.b.) 25,485 17,792 14,428 144,680 101,098 86,396
... of which from forest 25,485 17,792 14,428 n.a n.a n.a
Unit value (local currency / m3 o.b.) n.a n.a n.a n.a n.a n.a
Total value (1000 local currency) n.a n.a n.a n.a n.a n.a
Note: The figures for the reporting years refer to the averages of annually affected areas for the 5-year periods 1988-1992, 1998-2002 and 2003-2007 respectively.

FRA 2010 – Country Report, Indonesia
49
1990 2000 2005
Name of local currency na na Rupiah
11.5 Comments to Table T11
Variable /
category
Comments related to data, definitions,
etc.
Comments on the reported trend
Total volume of industrial roundwood removals
Total volume of industrial roundwood removals was industrial round wood that yield from natural forest (kayu rimba) and plantation forest (such as jati). On 1990, source of data is not separated, whether it came from natural forest or plantation forest, but mostly from natural forest. In this period, plantation forest has not been developed widely.
Total volume of woodfuel removals
Unit value
Total value
Other general comments to the table
Unit value is not presented because its value fluctuated over time, even in the same year.

FRA 2010 – Country Report, Indonesia
50
12 Table T12 – Non-wood forest products removals and value of removals
12.1 FRA 2010 Categories and definitions
Term Definition
Non-wood forest product (NWFP)
Goods derived from forests that are tangible and physical objects of biological origin other than wood.
Value of NWFP removals For the purpose of this table, value is defined as the market value at the site of collection or forest border.
NWFP categories
Category
Plant products / raw material
1. Food 2. Fodder 3. Raw material for medicine and aromatic products 4. Raw material for colorants and dyes 5. Raw material for utensils, handicrafts & construction 6. Ornamental plants 7. Exudates 8. Other plant products
Animal products / raw material 9. Living animals 10. Hides, skins and trophies 11. Wild honey and bee-wax 12. Wild meat 13. Raw material for medicine 14. Raw material for colorants 15. Other edible animal products 16. Other non-edible animal products
12.2 National data
12.2.1 Data sources
References to sources of
information
Quality
(H/M/L)
Variable(s) Year(s) Additional comments
GOI. 1990. DG of Forest Utilization
M
Volume
GOI. 2000. DG Natural Forest Development
M
Volume
GOI. 1994. Pocket Statistic Book of Perum Perhutani
H
Volume
Year 1990-1994
GOI. 2001. Perum Perhutani Statistic 2001
H Volume 2000
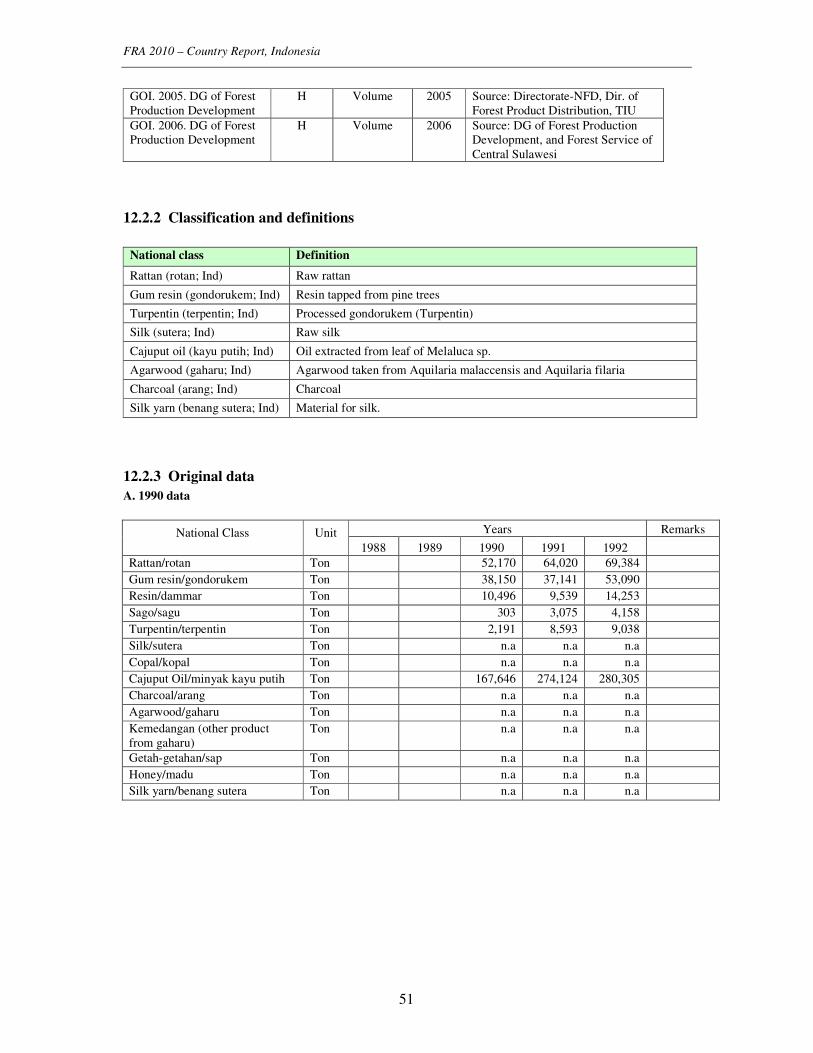
FRA 2010 – Country Report, Indonesia
51
GOI. 2005. DG of Forest Production Development
H Volume 2005 Source: Directorate-NFD, Dir. of Forest Product Distribution, TIU
GOI. 2006. DG of Forest Production Development
H Volume 2006 Source: DG of Forest Production Development, and Forest Service of Central Sulawesi
12.2.2 Classification and definitions
National class Definition
Rattan (rotan; Ind) Raw rattan
Gum resin (gondorukem; Ind) Resin tapped from pine trees
Turpentin (terpentin; Ind) Processed gondorukem (Turpentin)
Silk (sutera; Ind) Raw silk
Cajuput oil (kayu putih; Ind) Oil extracted from leaf of Melaluca sp.
Agarwood (gaharu; Ind) Agarwood taken from Aquilaria malaccensis and Aquilaria filaria
Charcoal (arang; Ind) Charcoal
Silk yarn (benang sutera; Ind) Material for silk.
12.2.3 Original data
A. 1990 data
Years Remarks National Class
Unit
1988 1989 1990 1991 1992
Rattan/rotan Ton 52,170 64,020 69,384
Gum resin/gondorukem Ton 38,150 37,141 53,090
Resin/dammar Ton 10,496 9,539 14,253
Sago/sagu Ton 303 3,075 4,158
Turpentin/terpentin Ton 2,191 8,593 9,038
Silk/sutera Ton n.a n.a n.a
Copal/kopal Ton n.a n.a n.a
Cajuput Oil/minyak kayu putih Ton 167,646 274,124 280,305
Charcoal/arang Ton n.a n.a n.a
Agarwood/gaharu Ton n.a n.a n.a
Kemedangan (other product from gaharu)
Ton
n.a n.a n.a
Getah-getahan/sap Ton n.a n.a n.a
Honey/madu Ton n.a n.a n.a
Silk yarn/benang sutera Ton n.a n.a n.a

FRA 2010 – Country Report, Indonesia
52
B. 2000 data
Years Remarks National Class
Unit
1998 1999 2000 2001 2002
Rattan/rotan Ton 62,644 38,417 94,752 23,836 17,779
Gum resin/gondorukem Ton 43,785 24,025 n.a 580 n.a
Resin/dammar Ton 7,887 6,310 3,342 2,921 1,131
Sago/sagu Ton 1,479 585 114 n.a n.a
Turpentin/terpentin Ton 7,633 2,667 n.a n.a n.a
Silk/sutera Ton 13,279 1,911 n.a n.a n.a
Copal/kopal Ton 516 114 647 428 442
Cajuput Oil/minyak kayu putih Ton 357,035 63,465 n.a n.a 27,925
Charcoal/arang Ton n.a n.a n.a n.a n.a
Agarwood/gaharu Ton n.a n.a n.a n.a n.a
Kemedangan (other product from gaharu)
Ton n.a n.a n.a n.a n.a
Getah-getahan/sap Ton n.a n.a n.a n.a n.a
Honey/madu Ton 1,519 2,019 1,862 2,112 1,932
Silk yarn/benang sutera Ton 136 64 71 110 91
C. 2005 data
Years Remarks National Class
Unit 2003 2004 2005 2006 2007
Rattan/rotan Ton 127,295 1,880,503 221,381 24,554 n.a
Gum resin/gondorukem Ton 4,592 38,435 27,098 3,210 n.a
Resin/damar Ton 4,401 2,722,866 9,131 11,087 n.a
Sago/sagu Ton n.a n.a n.a n.a n.a
Turpentin/terpentin Ton 544 7,684 36,958 5,152 n.a
Silk/sutera Ton n.a n.a n.a n.a n.a
Copal/kopal Ton 403 318 320 149 n.a
Cajuput Oil/minyak kayu putih Ton 28,138 31,978 275,192 20,010 n.a
Charcoal/arang Ton n.a 5,057,390 33,117 n.a n.a
Agarwood/gaharu Ton n.a 6,175 231 668 n.a
Kemedangan (other product from gaharu)
Ton
n.a 394 4,424 252 n.a
Getah-getahan/sap Ton n.a 87,170 45,465 556 n.a
Honey/madu Ton 1,949 3,841 1,568 1,421 n.a
Silk yarn/benang sutera Ton 89 55 69 14 n.a
Note: n.a : Not available data
12.3 Analysis and processing of national data
12.3.1 Calibration
12.3.2 Estimation and forecasting
Years National Class
Unit 1990 2000 2005
Rattan/rotan Ton 61,858 47,486 563,433
Gum resin/gondorukem Ton 42,794 22,797 18,334

FRA 2010 – Country Report, Indonesia
53
Resin/damar Ton 11,429 4,318 686,871
Sago/sagu Ton 2,512 726 n.a
Turpentin/terpentin Ton 6,607 5,150 12,585
Silk/sutera Ton n.a 7,595 n.a
Copal/kopal Ton n.a 429 298
Cajuput Oil/minyak kayu putih Ton 240,692 149,475 88,830
Charcoal/arang Ton n.a n.a 2,545,254
Agarwood/gaharu Ton n.a n.a 2,358
Kemedangan (other product from gaharu)
Ton n.a n.a 1,690
Getah-getahan/sap Ton n.a n.a 44,397
Honey/madu Ton n.a 1,889 2,195
Silk yarn/benang sutera Ton n.a 94 57
Note : n.a : Not available data. Data 2005 is averaged from 2003, 2004, 2005 and 2006 data.
12.3.3 Reclassification into FRA 2010 categories
12.4 Data for Table T12
NWFP removals 2005
Rank Name of product Key species Unit Quantity
Value
(1000
local
currency)
NWFP
category
1st Resin/damar n.a Ton 686,871 7
2nd Rattan/rotan n.a Ton 563,433 5
3rd Cajuput oil Melaluca sp. Ton 88,830 3
4th Getah-getahan/sap n.a Ton 44,397 8
5th Gum resin/Gondorukem n.a Ton 18,334 7
6th Turpentin n.a Ton 12,585 7
7th Honey/madu Apies dorsata Ton 2,195 11
8th Agarwood/gaharu Aquilaria
malaccensis and Aquilaria filaria
Ton 2,358 3
9th Kemedangan (other product from gaharu)
n.a Ton 1,690 5
10th Copal/Kopal n.a Ton 298 8
All other plant products
All other animal products 57 16
TOTAL 1,421,048
2005
Name of local currency Rupiah

FRA 2010 – Country Report, Indonesia
54
12.5 Comments to Table T12
Variable / category Comments related to data, definitions, etc.
10 most important products The 10 most important products based on the rank of products quantity. These products divided by 6 category that are other plant product, exudates, raw material for utensils, handicrafts & construction, raw material for medicine and aromatic products, and wild honey & bee-wax.
Other plant products The products that include in other animal products are silk and silk yarn.
Other animal products The value by product used rupiah (local currency). This value based on the rate of exchange of rupiah to US$ in 2005 that 1 US$ is Rp. 9,500,00. This value was calculated by ton unit.
Value by product
Total value
Other general comments to the table
Unit value is not presented because its value fluctuated over time, even in the same year.

FRA 2010 – Country Report, Indonesia
55
13 Table T13 – Employment
13.1 FRA 2010 Categories and definitions
Category Definition
Full-time equivalents (FTE)
A measurement equal to one person working full-time during a specified reference period.
Employment Includes all persons in paid employment or self-employment.
Paid employment Persons who during a specified reference period performed some work for wage or salary in cash or in kind.
Self-employment Persons who during a specified reference period performed some work for profit or family gain in cash or in kind (e.g. employers, own-account workers, members of producers' cooperatives, contributing family workers).
13.2 National data
13.2.1 Data sources
References to sources of
information
Quality
(H/M/L)
Variable(s) Year(s) Additional comments
GOI. 2000. DG of Forest Production Development. MoF (in Indonesian)
H Number of persons
2000 Will be used as 2000 data for company employment
GOI. 2005. DG of Forest Production Development. MoF(in Indonesian)
H Number of persons
2005 Will be used as 2005 data for company employment
GOI. 2000. DG of Protection and Nature Conservation Statistic
H Number of persons
2000 Will be used as 2000 data for National Park employment
GOI. 2005. DG of Forest Protection and Nature Conservation Statistic
H Number of persons
2005 Will be used as 2005 data for National Park employment
Statistic of Timber Culture Estate
H Number of persons 2002
Will be used as 2000 data for Company employment
Statistic of Forest Consession Estate
H Number of persons
2005 Will be used as 2005 data for Company employment
13.2.2 Classification and definitions
National class Definition
Company employment Persons who work for Forest Production (Forest Concessionaires or Forest Plantation). It can be permanent/certain period base on the skill
National Park employment
Persons who work for National Park (Forest Protection or Forest Conservation)

FRA 2010 – Country Report, Indonesia
56
13.2.3 Original data
National class Number of persons
2000 2005
Company employment 133,576 54,140
Temporary employment na na
National Park employment 2,826 3,270
Total 42,199 19,836
The number of employment in the above table are permanent workers involved in wood production, i.e., Forest Concessionaires or Forest Plantation) excluding Java (no data is available), as well as government officials who work in the National Park. For certain activities, concessions, often hire temporary workers, but the data is not yet available. The data are available for years 2000 and 2005.
13.3 Analysis and processing of national data
13.3.1 Calibration
No calibration is required
13.3.2 Estimation and forecasting
No estimation or forecasting is required.
13.3.3 Reclassification into FRA 2010 categories
FRA categories National Class
Primary production of goods
Company employment 100
National Park employment 100
Total
13.4 Data for Table T13
Employment (1000 years FTE)
FRA 2010 Category 1990 2000 2005
Employment in primary production of goods na 39.4 16.6
...of which paid employment na na na
...of which self-employment na na na
Employment in management of protected areas na 2.8 3.3

FRA 2010 – Country Report, Indonesia
57
13.5 Comments to Table T13
Variable /
category
Comments related to data, definitions,
etc.
Comments on the reported trend
Employment in primary production of goods
The employees recorded in this table are only the ones working for wood production from natural forest and plantation forest concessionaires
Compared with 2000 period, employment in primary production of goods in 2005 was decreased as critically concurrent with the decrease of the number of the companies.
Paid employment / self-employment
Employment in management of protected areas
Forest protection and conservation activities are mainly done by government. The employees reported in this table reflected the government officials who are directly involved in the national park management.
Employment in 2005 in management of conservation areas was increased. It purposes to increase protection of forest concurrent with the increase of the unit/coverage of the National Park area.
Other general comments to the table

FRA 2010 – Country Report, Indonesia
58
14 Table T14 – Policy and legal framework
14.1 FRA 2010 Categories and definitions
Term Definition
Forest policy A set of orientations and principles of actions adopted by public authorities in harmony with national socio-economic and environmental policies in a given country to guide future decisions in relation to the management, use and conservation of forest and tree resources for the benefit of society.
Forest policy statement
A document that describes the objectives, priorities and means for implementation of the forest policy.
National forest programme (nfp)
A generic expression that refers to a wide range of approaches towards forest policy formulation, planning and implementation at national and sub-national levels. The national forest programme provides a framework and guidance for country-driven forest sector development with participation of all stakeholders and in consistence with policies of other sectors and international policies.
Law (Act or Code) on forest
A set of rules enacted by the legislative authority of a country regulating the access, management, conservation and use of forest resources.

FRA 2010 – Country Report, Indonesia
59
14.2 Data for Table T14
Indicate the existence of the following (2008)
√ Yes Forest policy statement with national scope
No
Year of endorsement 2006
If Yes above, provide: Reference to document
Permenhut No. 26 Tahun 2006 tentang Rencana Pembangunan Jangka Panjang Kehutanan 2006-2025 (Minister of Forestry Decree No. 27 Year 2006 on Long Term Forestry Development Planning Year 2006-2025)
√ Yes National forest programme (nfp)
No
Name of nfp in country Program Kehutanan Nasional
Starting year 2000
In formulation
√ In implementation
Under revision Current status
Process temporarily suspended
If Yes above, provide:
Reference to document or web site
Q/A of NFP Website address : www.nfp-indonesia.org
√ Yes, specific forest law exists
Yes, but rules on forests are incorpo-rated in other (broader) legislation Law (Act or Code) on forest with national scope
No, forest issues are not regulated by national legislation
Year of enactment 1999
Year of latest amendment 2004 If Yes above, provide:
Reference to document In Indonesian language : UU Kehutanan No. 41 Tahun 1999 (Act on Forestry Number 41 Year 1999)
In case the responsibility for forest policy- and/or forest law-making is decentralized, please indicate
the existence of the following and explain in the comments below the table how the responsibility for
forest policy- and law-making is organized in your country.
Yes Sub-national forest policy statements
√ No
If Yes above, indicate the number of regions/states/provinces with forest policy statements
Yes Sub-national Laws (Acts or Codes) on forest
√ No
If Yes above, indicate the number of regions/states/provinces with Laws on forests

FRA 2010 – Country Report, Indonesia
60
14.3 Comments to Table T14
Variable / category Comments related to data, definitions, etc.
Forest policy statement with national scope
The national scope of forest policy statement is stated in the first part of document of the Long Term Forestry Development Planning Year 2006-2025 which endorsed through Minister of Forestry Decree No. 26 Year 2006
National forest programme (nfp)
All information of the implementation of the Indonesian National Forest Programme has been addressed at the website (www.nfp-indonesia.org) which launched in February 2009. For example, the website user can download the Indonesian National Forestry Statement (http://nfp-indonesia.org/download/NationalForestry Statement.pdf)
Law (Act or Code) on forest with national scope
In Indonesia, the forestry management must be based on Undang-Undang Kehutanan No. 41 Tahun 1999 (Act on Forestry Number 41 Year 1999)
Sub-national forest policy statements
Sub-national Laws (Acts or Codes) on forest
Other general comments to the table

FRA 2010 – Country Report, Indonesia
61
15 Table T15 – Institutional framework
15.1 FRA 2010 Categories and definitions
Term Definition
Minister responsible for forest policy-making
Minister holding the main responsibility for forest issues and the formulation of the forest policy.
Head of Forestry The Head of Forestry is the Government Officer responsible for implementing the mandate of the public administration related to forests.
Level of subordination Number of administrative levels between the Head of Forestry and the Minister.
University degree Qualification provided by University after a minimum of 3 years of post secondary education.
15.2 Data for Table T15
Table 15a – Institutions FRA 2010 Category 2008
Minister responsible for forest policy formulation : please provide full title
Ministry of Forestry of Republic of Indonesia
√ 1st level subordination to Minister
2nd level subordination to Minister
3rd level subordination to Minister
Level of subordination of Head of Forestry within the Ministry
4th or lower level subordination to Minister Other public forest agencies at national level
Exclude Inhutani and Perum Perhutani
Institution(s) responsible for forest law enforcement
Ministry of Forestry (DG of Forest Protection and Nature Conservation), Indonesian Police, the Indonesian Court and Justice (Kejaksaan) and Indonesian Military (if necessary)
Table 15b – Human resources
Human resources within public forest institutions
2000 2005 2008 FRA 2010 Category
Number %Female Number %Female Number %Female
Total staff
14,809 13 15,548 17.6 16,803 18
...of which with university degree or equivalent
n.a n.a 4,550 25.2 5,183 26.3
Notes: 1. Includes human resources within public forest institutions at sub-national level 2. Excludes people employed in State-owned enterprises, education and research, as well as temporary /
seasonal workers.

FRA 2010 – Country Report, Indonesia
62
15.3 Comments to Table T15
Variable / category Comments related to data, definitions, etc. Comments on the
reported trend
Minister responsible for forest policy formulation
National Act No. 39 year 2009 states that in Indonesia, Forestry is under the Ministry of Forestry’ jurisdiction.
Level of subordination of Head of Forestry within the Ministry
Ministry of Forestry consists of Director General (including FORDA) and Senior Advisors. The second level consist of Directors The third level consists of Deputy Directors and Head of Regional Offices.
Other public forest agencies at national level
There is no agencies with direct access/authority to forest area others than the Ministry of Forestry
Institution(s) responsible for forest law enforcement
The Ministry of Forestry has its own forestry police forces under the DG of Forest Protection and Nature Conservation. Besides, there are forestry police forces under the provincial forestry services
Human resources within public forest institutions
Human resources recorded in this table are only the ones working as government official at national level.
Other general comments to the table
Recapitulation of human resources based on gender and education degree just began on year 2001 and have been published in Forestry Statistics of Indonesia since year 2001.

FRA 2010 – Country Report, Indonesia
63
16 Table T16 – Education and research
16.1 FRA 2010 Categories and definitions
Term Definition
Forest-related education Post-secondary education programme with focus on forests and related subjects.
Doctor’s degree (PhD) University (or equivalent) education with a total duration of about 8 years.
Master’s degree (MSc) or equivalent
University (or equivalent) education with a total duration of about five years.
Bachelor’s degree (BSc) or equivalent
University (or equivalent) education with a duration of about three years.
Technician certificate or diploma
Qualification issued from a technical education institution consisting of 1 to 3 years post secondary education.
Publicly funded forest research centers
Research centers primarily implementing research programmes on forest matters. Funding is mainly public or channelled through public institutions.
16.2 National data
16.2.1 Data sources
References to sources of
information
Quality
(H/M/L)
Variable(s) Year(s) Additional comments
GOI.2007. Forestry Statistics of Indonesia 2006
H Number of persons
2007
Bureau of Human Resources Development, Secretariat General, MoF
H Number of persons
2000, 2005 and
2007
Graduation of students in forest related education and working at MoF.
Forest Research and Development
H Number of persons
2000, 2005 and
2007
16.2.2 Original data
16.3 Analysis and processing of national data
16.3.1 Estimation and forecasting

FRA 2010 – Country Report, Indonesia
64
16.4 Data for Table T16
Graduation
1) of students in forest-related education
2000 2005 2008 FRA 2010 Category
Number %Female Number %Female Number %Female
Master’s degree (MSc) or equivalent - - - - 1 -
Bachelor’s degree (BSc) or equivalent 4 25.0 179 28.5 307 46.6 Forest technician certificate / diploma 341 9.0 80 10.0 126 26.2
Professionals working in publicly funded forest research centres 2)
2000 2005 2008 FRA 2010 Category
Number %Female Number %Female Number %Female
Doctor’s degree (PhD) 73 n.a 37 21.6 42 23.8
Master’s degree (MSc) or equivalent 224 n.a 157 28.0 223 34.5
Bachelor’s degree (BSc) or equivalent 544 n.a 526 39.4 523 37.9
Notes:
1. Graduation refers to the number of students that have successfully completed a Bachelor’s or higher degree or achieved a certificate or diploma as forest technician.
2. Covers degrees in all sciences, not only forestry.
16.5 Comments to Table T16
Variable / category Comments related to data,
definitions, etc.
Comments on the reported trend
Graduation of students in forest-related education
Professionals working in public forest research centres
Other general comments to the table

FRA 2010 – Country Report, Indonesia
65
17 Table T17 – Public revenue collection and expenditure
17.1 FRA 2010 Categories and definitions
Category Definition
Forest revenue All government revenue collected from the domestic production and trade of forest products and services. For this purpose, forest products include: roundwood; sawnwood; wood-based panels; pulp and paper; and non-wood forest products. As far as possible, this should include revenue collected by all levels of government (i.e. central, regional/provincial and municipal level), but it should exclude the income of publicly owned business entities.
Public expenditure All government expenditure on forest related activities (further defined below).
Operational expenditure (sub-category to Public
expenditure)
All government expenditure on public institutions solely engaged in the forest sector. Where the forest administration is part of a larger public agency (e.g. department or ministry), this should only include the forest sector component of the agency’s total expenditure. As far as possible, this should also include other institutions (e.g. in research, training and marketing) solely engaged in the forest sector, but it should exclude the expenditure of publicly owned business entities.
Transfer payments (sub-category to Public
expenditure)
All government expenditure on direct financial incentives paid to non-government and private-sector institutions, enterprises communities or individuals operating in the forest sector to implement forest related activities.
Domestic funding
Public expenditure funded from domestic public financial resources, including: retained forest revenue; forest-related funds; and allocations from the national budget (i.e. from non-forest sector public revenue sources).
External funding
Public expenditure funded from grants and loans from donors, non-governmental organisations, international lending agencies and international organisations, where such funds are channelled through national public institutions.
17.2 National data
17.2.1 Data sources
References to sources of
information
Quality
(H/M/L)
Variable(s) Year(s) Additional comments
Secretariat General MoF. 2005. Financial Report 2004
H value 2004 Government revenue and expenditure budget on 2004
Secretariat General MoF. 2006. Financial Report 2005
H value 2005 2005 Audited Financial Report
17.2.2 Classification and definitions
National class Definition
Non tax state revenue (Penerimaan Negara Bukan Pajak, Indonesian)
Income of forest provision and reforestation, ecotourism, wildlife exploitation, forest exploitation penalty
Forestry expenditure Budget realization at national level (includes regional office) and province level, and national movement on forestland and plant rehabilitation.

FRA 2010 – Country Report, Indonesia
66
17.2.3 Original data
Total
(1000 local currency)
National class
2004 2005
Non tax state revenue (Penerimaan Negara Bukan Pajak, Indonesian)
3,424,681,476 3,248,817,024
Forestry expenditure 841,186,545 959,875,419
17.3 Data for Table T17
Table 17a - Forest revenues
Revenues
(1000 local currency) FRA 2010 Categories
2000 2005
Forest revenue n.a. 3,248,817,024

FRA 2010 – Country Report, Indonesia
67
Table 17b - Public expenditure in forest sector by funding source
Domestic funding
(1000 local currency)
External funding
(1000 local currency)
Total
(1000 local currency) FRA 2010 Categories
2000 2005 2000 2005 2000 2005
Operational expenditure n.a n.a n.a n.a n.a n.a
Transfer payments n.a n.a n.a n.a n.a n.a
Total public expenditure n.a n.a n.a n.a n.a. 959,875,419
Reforestation
Afforestation
Forest inventory and/or planning
Conservation of forest biodiversity
Protection of soil and water
Forest stand improvement
Establishment or maintenance of protected areas
If transfer payments are made for forest management and conservation, indicate for what specific objective(s) - Please tick all that apply.
Other, specify below
17.4 Comments to Table T17
Variable / category Comments related to data,
definitions, etc.
Comments on the reported trend
Forest revenue Available data only for 2004 and 2005 years
The value only shows the income received by MoF. The additional incomes resulted by wood processing and exports are not included here.
Operational expenditure Available data only for 2004 and 2005 years
Transfer payments
Other general comments to the table