˘ ˇ ˇˆ˙ - fnf.org.ph on business outsourcing.pdf · achievement levels in hekasi nat grade six...
TRANSCRIPT

Are We Ready to Compete?
�������������� ��������������������������������� �������������������
���������������� �������������������������� ������������������������
������������ ������������
���������������������������� ������������
����������������������������������������������������������

Achievement Levels in MathematicsNAT Fourth Year (SY2004-2005)
52.28536,439 No MasteryBelow 50
100%1,026,115 Total
31.31321,305 Near Mastery50-74
16.41168,371 Mastery75-100
%NAchievement Level
Percentage Score

Achievement Levels in EnglishNAT Fourth Year (SY2004-2005)
44.25454,098 No MasteryBelow 50
100%1,026,115 Total
49.16504,429 Near Mastery50-74
6.5967,588 Mastery75-100
%NAchievement Level
Percentage Score

Achievement Levels in ScienceNAT Fourth Year (SY2004-2005)
74.26761,987 No MasteryBelow 50
100%1,026,115 Total
23.99246,207 Near Mastery50-74
1.7517,921 Mastery75-100
%NAchievement Level
Percentage Score

Achievement Levels in Filipino SubjectNAT Fourth Year (SY2004-2005)
72.631745,274 No MasteryBelow 50
100%1,026,115 Total
27.368280,823 Near Mastery50-74
0.00218 Mastery75-100
%NAchievement Level
Percentage Score
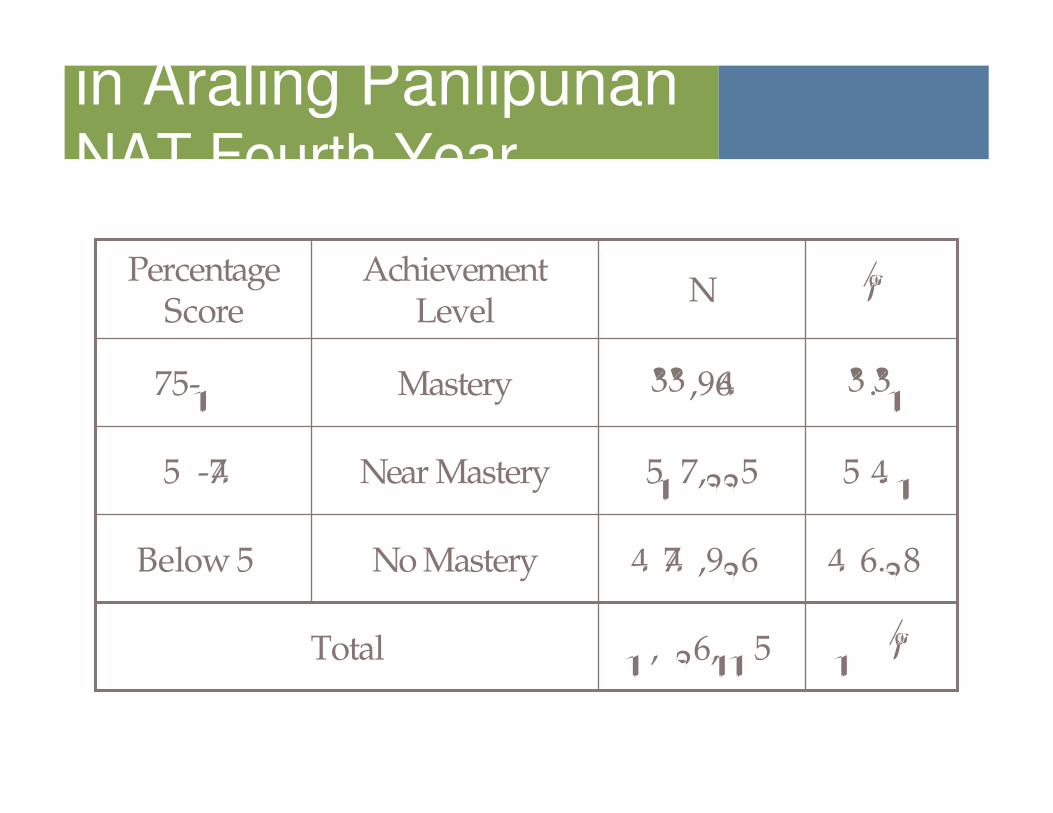
in Araling PanlipunanNAT Fourth Year (SY2004-2005)
46.28474,926 No MasteryBelow 50
100%1,026,115 Total
50.41517,225 Near Mastery50-74
3.3133,964 Mastery75-100
%NAchievement Level
Percentage Score

Achievement Levels in Total TestNAT Fourth Year (SY2004-2005)
58.75602,874No MasteryBelow 50
100%1,026,115 Total
40.77418,339Near Mastery50-74
0.484,902Mastery75-100
%NAchievement Level
Percentage Score

Distribution of Schools by Achievement Level NAT Fourth Year (SY2004-2005)
60.533,273No MasteryBelow 50
100%5,407Total
39.322,126Near Mastery50-74
0.158Mastery75-100
%No. of Schools
Achievement Level
Percentage Score
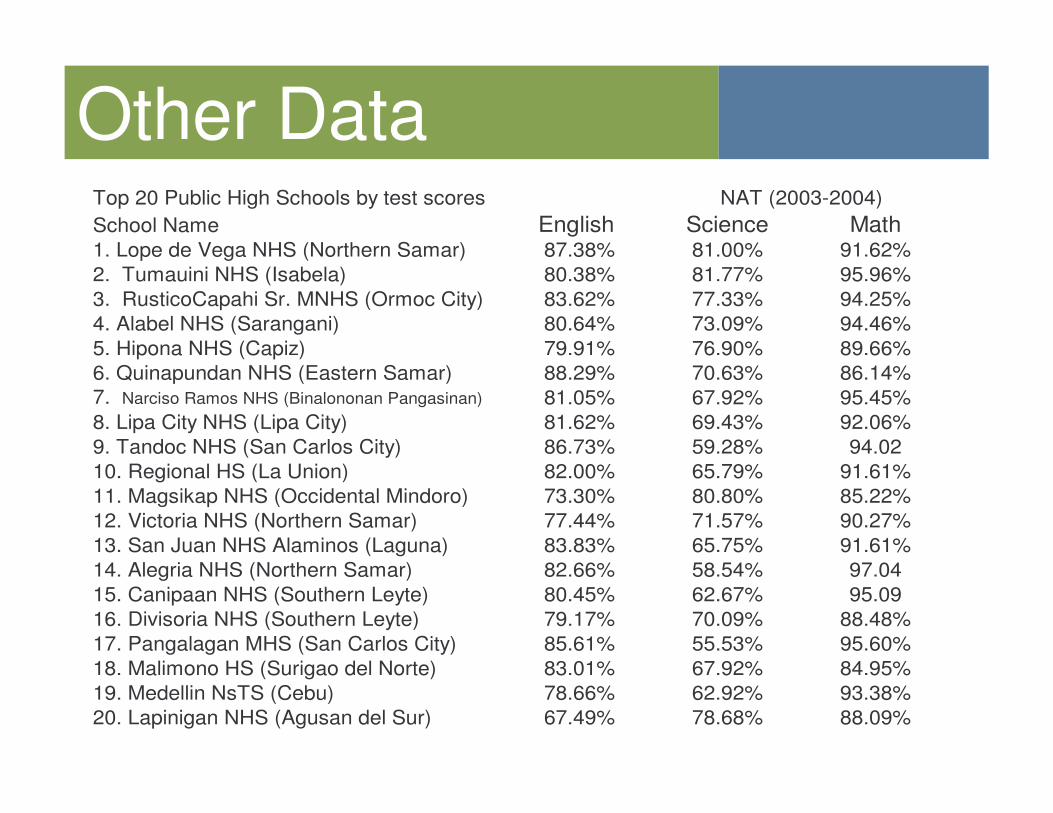
Other DataTop 20 Public High Schools by test scoresSchool Name English Science Math1. Lope de Vega NHS (Northern Samar) 87.38% 81.00% 91.62%2. Tumauini NHS (Isabela) 80.38% 81.77% 95.96%3. RusticoCapahi Sr. MNHS (Ormoc City) 83.62% 77.33% 94.25%4. Alabel NHS (Sarangani) 80.64% 73.09% 94.46%5. Hipona NHS (Capiz) 79.91% 76.90% 89.66%6. Quinapundan NHS (Eastern Samar) 88.29% 70.63% 86.14%7. Narciso Ramos NHS (Binalononan Pangasinan) 81.05% 67.92% 95.45%8. Lipa City NHS (Lipa City) 81.62% 69.43% 92.06%9. Tandoc NHS (San Carlos City) 86.73% 59.28% 94.0210. Regional HS (La Union) 82.00% 65.79% 91.61%11. Magsikap NHS (Occidental Mindoro) 73.30% 80.80% 85.22%12. Victoria NHS (Northern Samar) 77.44% 71.57% 90.27%13. San Juan NHS Alaminos (Laguna) 83.83% 65.75% 91.61%14. Alegria NHS (Northern Samar) 82.66% 58.54% 97.0415. Canipaan NHS (Southern Leyte) 80.45% 62.67% 95.0916. Divisoria NHS (Southern Leyte) 79.17% 70.09% 88.48%17. Pangalagan MHS (San Carlos City) 85.61% 55.53% 95.60%18. Malimono HS (Surigao del Norte) 83.01% 67.92% 84.95%19. Medellin NsTS (Cebu) 78.66% 62.92% 93.38%20. Lapinigan NHS (Agusan del Sur) 67.49% 78.68% 88.09%
NAT (2003-2004)
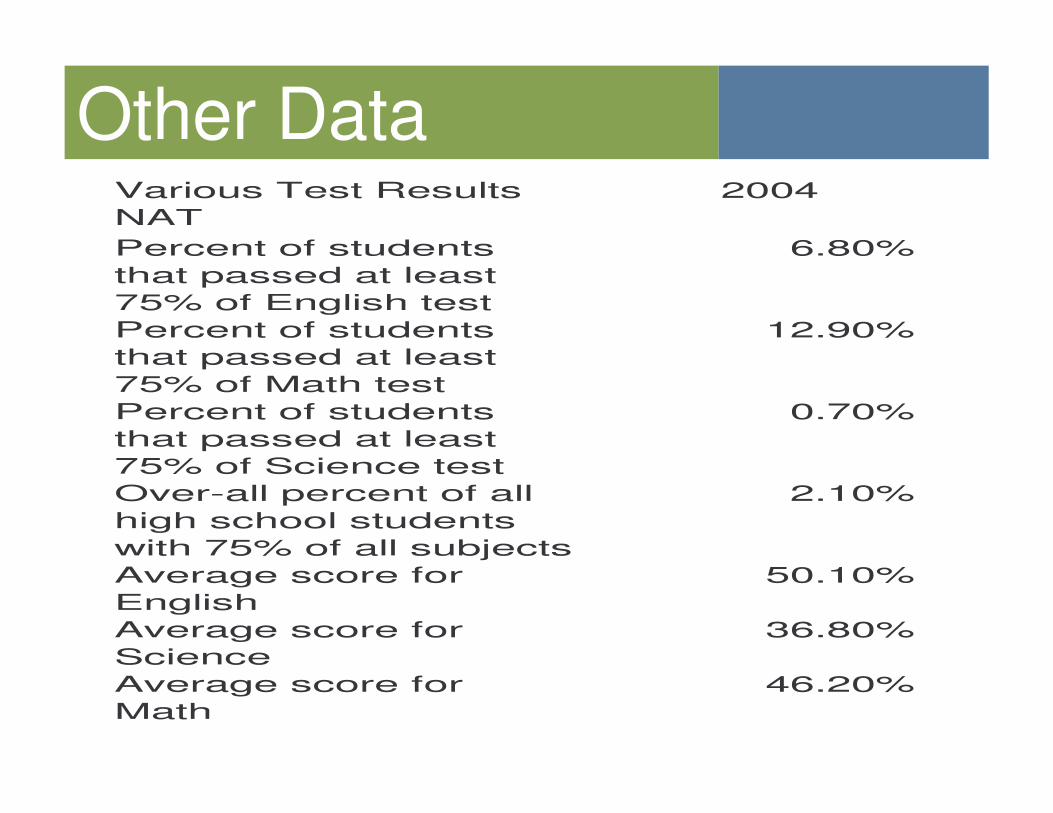
Other DataVarious Test Results 2004NATPercent of students 6.80%that passed at least75% of English testPercent of students 12.90%that passed at least75% of Math testPercent of students 0.70%that passed at least75% of Science testOver-all percent of all 2.10%high school studentswith 75% of all subjectsAverage score for 50.10%EnglishAverage score for 36.80%ScienceAverage score for 46.20%Math

Other DataHSRT - 2004 # of StudentsStudents with at least 0.52% 1.3 million75% or better in English,Science and MathPercent of students 7.40%that passed if 50% wasthe passing gradeMedian score 30%Passing grade for at least half of the studentsentering HS:English 34%Math 25-29%Science 30-34%Entire test 30%
TIMSS1998-2003 #36 out of 39 lower than
countries internationalstandards
2003 #41 out of 45 lower than countries international
standards

Achievement Levels in MathematicsNAT Grade Six (SY2004-2005)
33.90% 542,911 No MasteryBelow 50
100% 1,601,549 Total
35.59% 569,939 Near Mastery50-74
30.51% 488,699 Mastery75-100
%NAchievement Level
Percentage Score
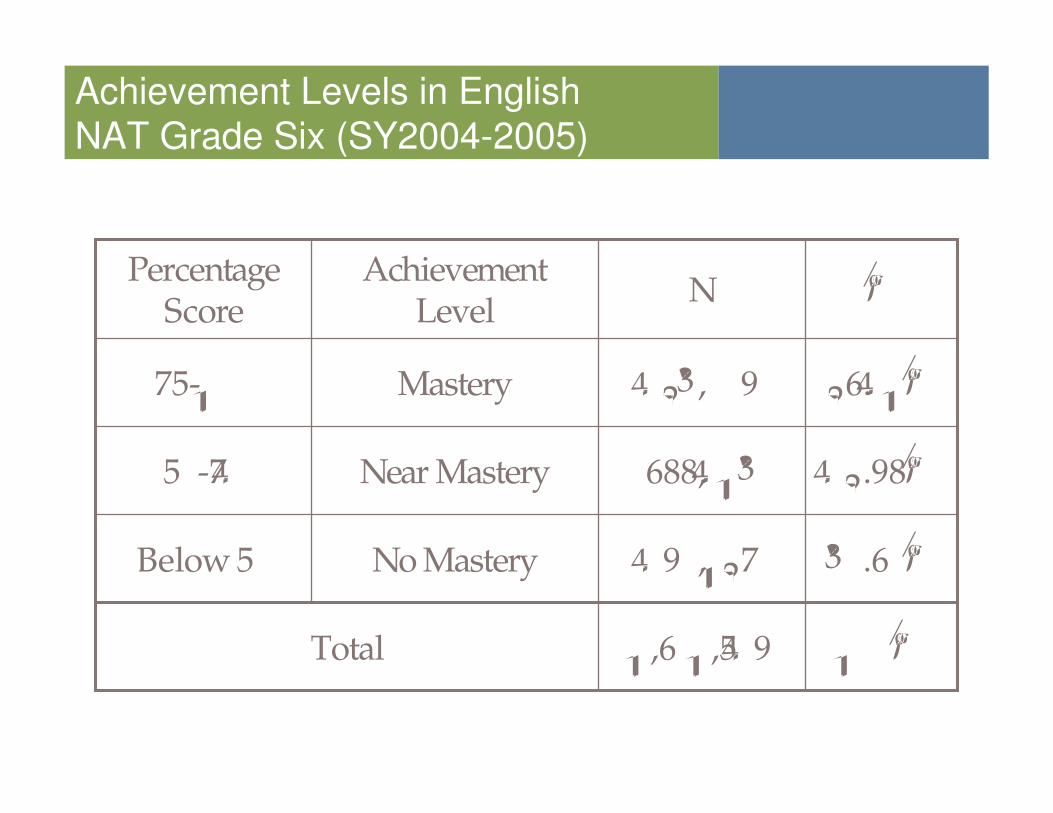
Achievement Levels in EnglishNAT Grade Six (SY2004-2005)
30.60% 490,127 No MasteryBelow 50
100% 1,601,549 Total
42.98% 688,413 Near Mastery50-74
26.41% 423,009 Mastery75-100
%NAchievement Level
Percentage Score

Achievement Levels in ScienceNAT Grade Six (SY2004-2005)
38.21% 611,951 No MasteryBelow 50
100% 1,601,549 Total
47.04% 753,334 Near Mastery50-74
14.75% 236,264 Mastery75-100
%NAchievement Level
Percentage Score

Achievement Levels in Filipino SubjectNAT Grade Six (SY2004-2005)
25.21% 403,752 No MasteryBelow 50
100% 1,601,549 Total
44.66% 715,245 Near Mastery50-74
30.13% 482,552 Mastery75-100
%NAchievement Level
Percentage Score

Achievement Levels in HeKaSiNAT Grade Six (SY2004-2005)
30.07% 481,532 No MasteryBelow 50
100% 1,601,549 Total
40.77% 653,030 Near Mastery50-74
29.16% 466,987 Mastery75-100
%NAchievement Level
Percentage Score

Achievement Levels in Total TestNAT Grade Six (SY2004-2005)
29.45% 471,624 No MasteryBelow 50
100% 1,601,549 Total
50.51% 808,916 Near Mastery50-74
20.04% 321,009 Mastery75-100
%NAchievement Level
Percentage Score

Distribution of Schools by Achievement Level NAT Grade Six (SY2004-2005)
30.69%8,853No MasteryBelow 50
100%28,845Total
56.84%16,396Near Mastery50-74
12.47%3,596Mastery75-100
%No. of Schools
Achievement Level
Percentage Score
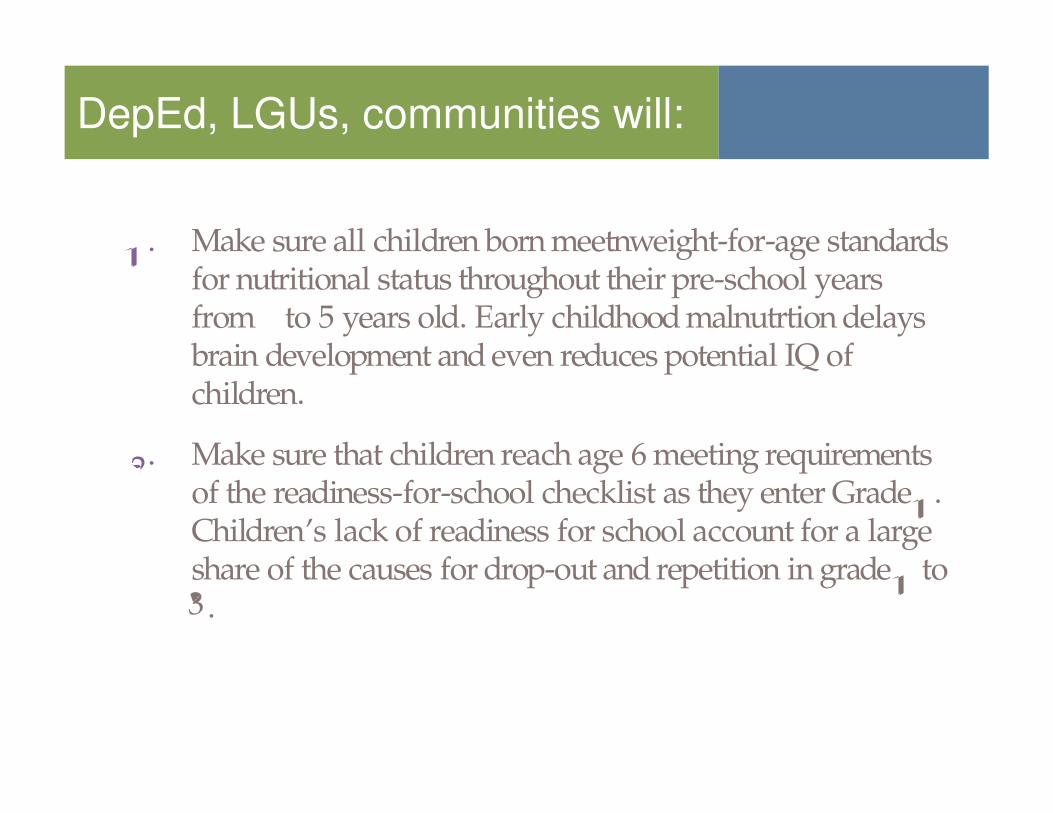
DepEd, LGUs, communities will:
1. Make sure all children born meetnweight-for-age standards for nutritional status throughout their pre-school years from 0 to 5 years old. Early childhood malnutrtion delays brain development and even reduces potential IQ of children.
2. Make sure that children reach age 6 meeting requirements of the readiness-for-school checklist as they enter Grade 1. Children’s lack of readiness for school account for a large share of the causes for drop-out and repetition in grade 1 to 3.

Nutrition Status
Out of 10,457,156 children assessed at the start of SY 2002-2003:
153,175 or 1.46% - severely underweight
1,156,711 or 11.06% - moderately underweight
2,257,363 0r 21%.59% -mildly underweight
6,321,248 or 60.45% - normal
586,599 or 5.44% - overweight

Nutrition Status
Nutrition affcts learning by providing the necessary and the right amount of nutrients needed by the body and the brain for learning to take place.
Poor nutrition affects brain development and can lead to poorer intellectual performance.
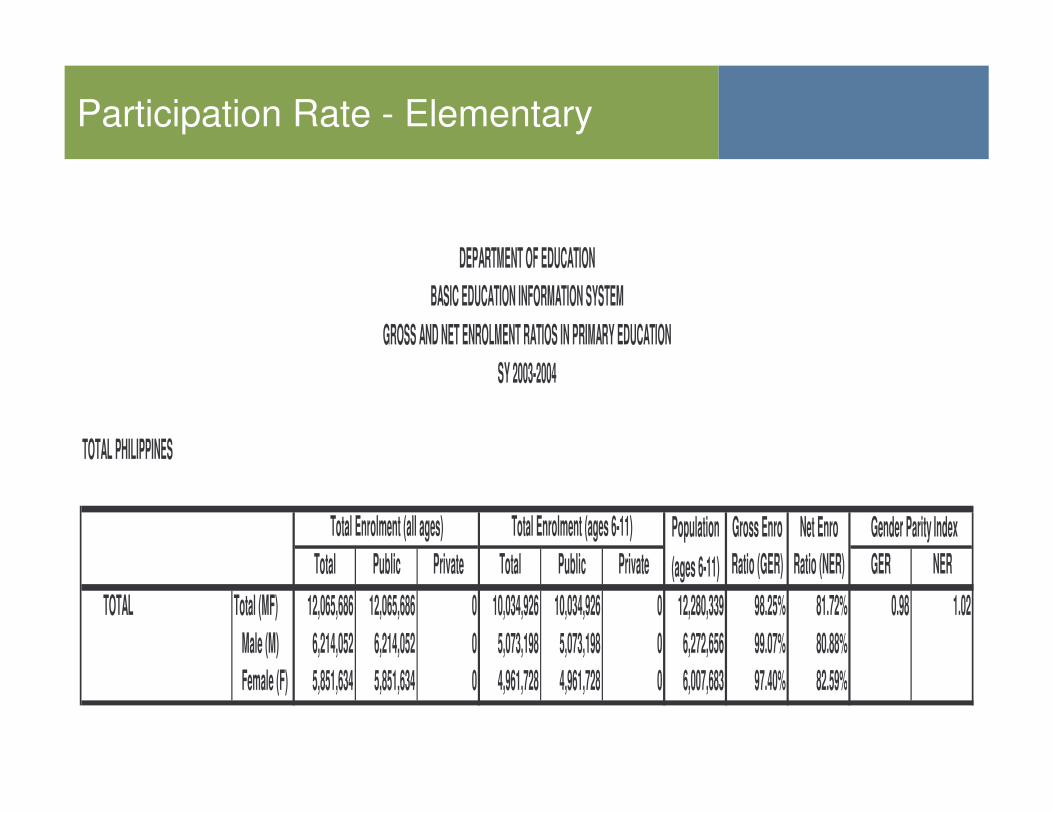
Participation Rate - Elementary
TOTAL PHILIPPINES
Population Gross Enro Net EnroTotal Public Private Total Public Private (ages 6-11) Ratio (GER) Ratio (NER) GER NER
TOTAL Total (MF) 12,065,686 12,065,686 0 10,034,926 10,034,926 0 12,280,339 98.25% 81.72% 0.98 1.02 Male (M) 6,214,052 6,214,052 0 5,073,198 5,073,198 0 6,272,656 99.07% 80.88% Female (F) 5,851,634 5,851,634 0 4,961,728 4,961,728 0 6,007,683 97.40% 82.59%
Region Total Enrolment (all ages) Total Enrolment (ages 6-11) Gender Parity Index
DEPARTMENT OF EDUCATIONBASIC EDUCATION INFORMATION SYSTEM
GROSS AND NET ENROLMENT RATIOS IN PRIMARY EDUCATIONSY 2003-2004

Survival Rate-Elementary
TOTAL PHILIPPINES
Completion Coefficient Years Input GenderGrade I Grade II Grade III Grade IV Grade V Grade VI Rate of Efficiency Per Graduate Parity Index
TOTAL Total (MF) 100.00% 83.09% 76.94% 72.09% 67.79% 63.57% 62.06% 78.41% 7.65 1.10 Male (M) 100.00% 81.31% 74.63% 69.06% 64.31% 59.50% 57.76% 74.83% 8.02 Female (F) 100.00% 85.10% 79.54% 75.49% 71.69% 68.13% 66.86% 82.19% 7.30
Region Cohort Survival
DEPARTMENT OF EDUCATIONBASIC EDUCATION INFORMATION SYSTEM
RECONSTRUCTED COHORT SURVIVAL (PUBLIC SCHOOLS ONLY)SY 2003-2004
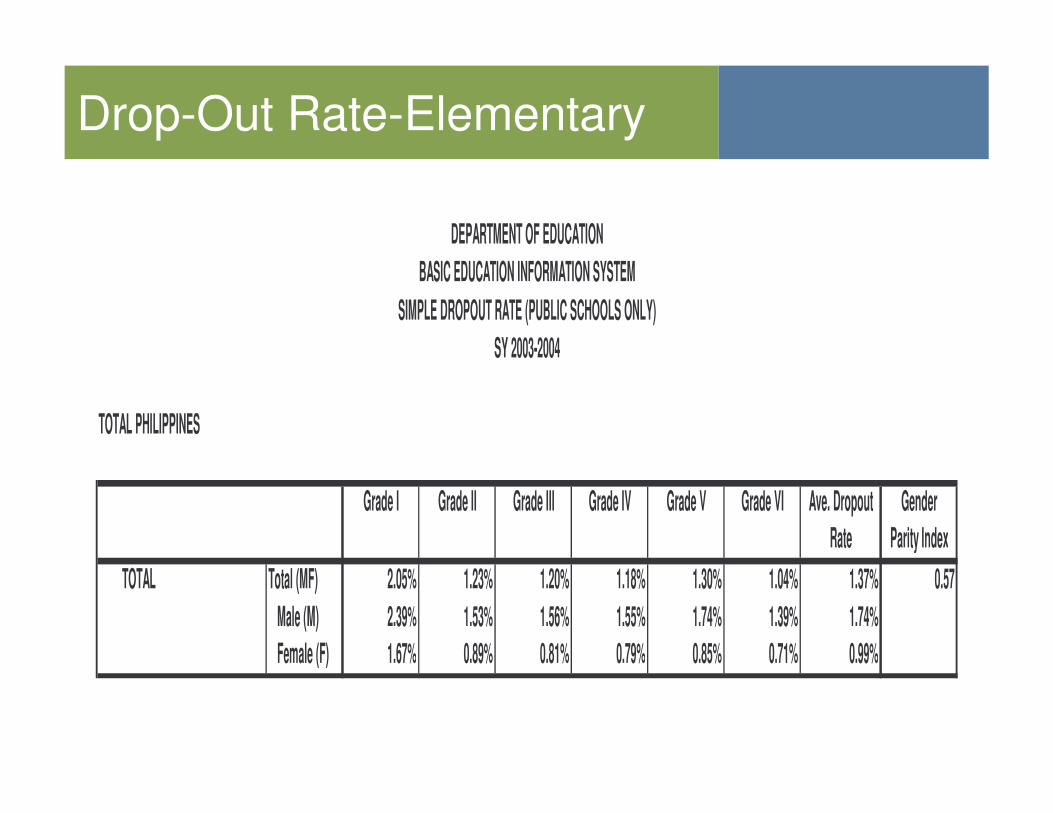
Drop-Out Rate-Elementary
TOTAL PHILIPPINES
Grade I Grade II Grade III Grade IV Grade V Grade VI Ave. Dropout GenderRate Parity Index
TOTAL Total (MF) 2.05% 1.23% 1.20% 1.18% 1.30% 1.04% 1.37% 0.57 Male (M) 2.39% 1.53% 1.56% 1.55% 1.74% 1.39% 1.74% Female (F) 1.67% 0.89% 0.81% 0.79% 0.85% 0.71% 0.99%
Region
DEPARTMENT OF EDUCATIONBASIC EDUCATION INFORMATION SYSTEM
SIMPLE DROPOUT RATE (PUBLIC SCHOOLS ONLY)SY 2003-2004
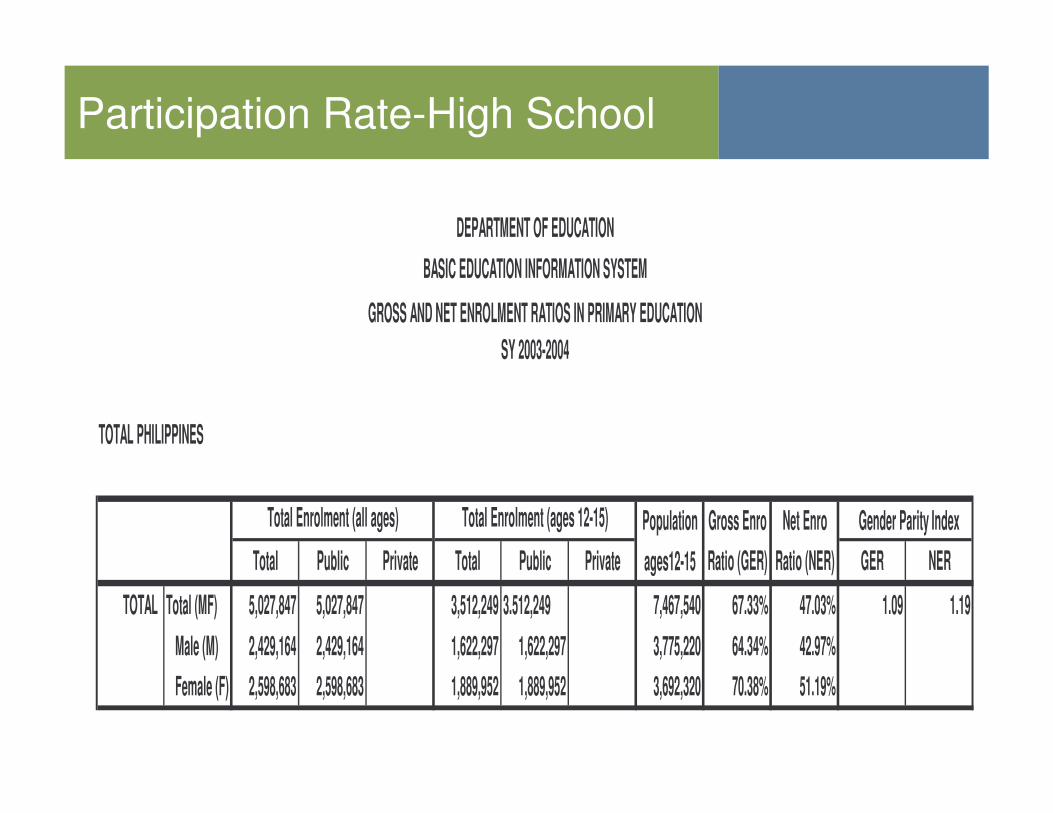
Participation Rate-High School
TOTAL PHILIPPINES
Population Gross Enro Net EnroTotal Public Private Total Public Private ages12-15 Ratio (GER) Ratio (NER) GER NER
TOTAL Total (MF) 5,027,847 5,027,847 3,512,249 3.512,249 7,467,540 67.33% 47.03% 1.09 1.19 Male (M) 2,429,164 2,429,164 1,622,297 1,622,297 3,775,220 64.34% 42.97% Female (F) 2,598,683 2,598,683 1,889,952 1,889,952 3,692,320 70.38% 51.19%
Region Total Enrolment (all ages) Total Enrolment (ages 12-15) Gender Parity Index
DEPARTMENT OF EDUCATIONBASIC EDUCATION INFORMATION SYSTEM
GROSS AND NET ENROLMENT RATIOS IN PRIMARY EDUCATIONSY 2003-2004

Survival-High School
DEPARTMENT OF EDUCATIONBASIC EDUCATION INFORMATION SYSTEM
RECONSTRUCTED COHORT SURVIVAL (PUBLIC SCHOOLS ONLY)SY 2003-2004
TOTAL PHILIPPINES
Completion Coefficient Years Input GenderYear I Year II Year III Year IV Rate of Efficiency Per Graduate Parity Index
Total (MF) 100.00% 82.45% 70.12% 60.14% 56.07% 69.95% 5.72 1.20 Male (M) 100.00% 78.17% 63.84% 53.42% 48.77% 63.60% 6.29 Female (F) 100.00% 86.85% 76.57% 67.68% 63.70% 76.08% 5.26
Region Cohort Survival

Drop Out-High School
DEPARTMENT OF EDUCATIONBASIC EDUCATION INFORMATION SYSTEMSIMPLE DROPOUT RATE (PUBLIC SCHOOLS ONLY)SY 2003-2004
TOTAL PHILIPPINES
Year I Year II Year III Year IV Ave. TotalDropput Dropouts
TOTAL Total (MF) 8.18% 6.61% 5.90% 3.56% 6.40% 0.4800 Male (M) 11.23% 9.06% 7.74% 4.40% 8.70% Female (F) 4.94% 4.26% 4.22% 2.82% 4.18%
Region

DepEd, LGUs, communities will:
3. Help public schools deliver good foundation instruction in the native language for early reading with comprehension at Grade 1 and 2. Children are able to read with comprehension sooner when what they read can be reinforced by what they hear at home and in the community.
4. Help the local schools division maintain teaching staff in all schools comprising of English language proficient teachers. Variations in teaching capacity and practice accounts for at least 40% of variations in student achievements.

DepEd, LGUs, communities will:
5. Support school heads and superintendents working to assure that students get high levels of engaged time and learning tasks in public schools. Time spent on instruction and on instructionally meaningful activities in the key factor why schooling contributes to learning.
6. Demand that only competent, dedicated and effective heads serve in all public schools in the locality. The critical environment for teaching and learning is determined by the work of the school head or principal.

DepEd, LGUs, communities will:
7. Encourage people from the immediate community of each public school to support and participate in the governance of the school in their neighborhood. School heads, teachers, and students tend to all do their respective work better when parents and the community support and participate in the governance of the school.
8. Support regular testing of all students’ academic achievements and use the results to inform parents and teachers about the quality of education in the locality. Test data and their meaning communicate the important notion that quality education is principally defined by levels of student learning.

DepEd, LGUs, communities will:
9. Emphasize local attention, effort and achievement in English, Science and Math as central to good elementary and secondary education. English, science and math are the most economically viable competencies that public schools can provide to poor students and communities.
10. Make books, magazines, newspapers and other reading materials in the native language, in Pilipino and English widely available to all children to develop their reading and writing skills. Reading is a crucial skill and habit for efficient learning.
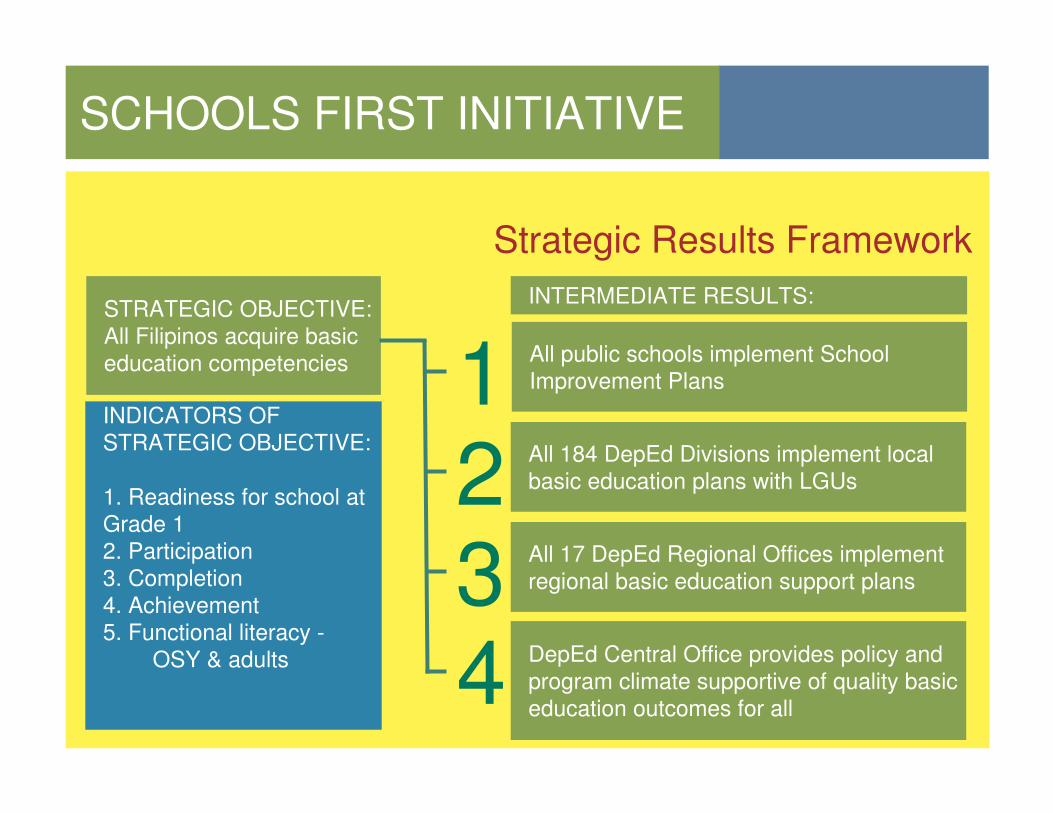
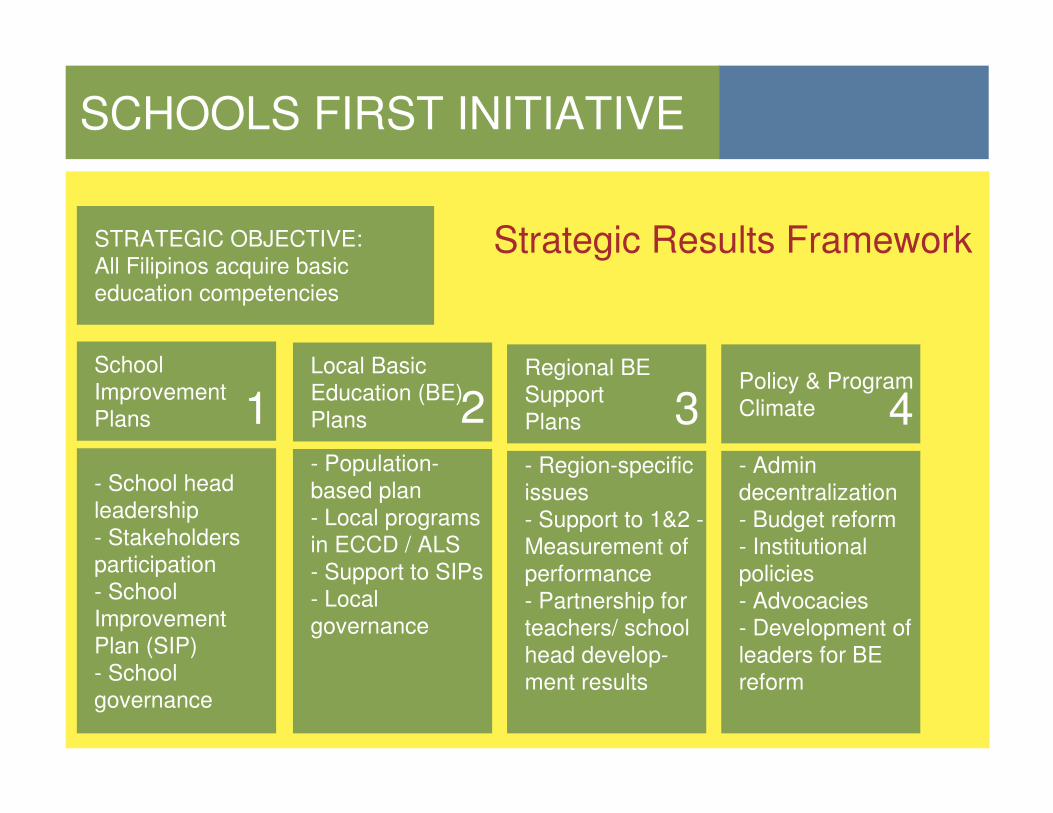
SCHOOLS FIRST INITIATIVE
Strategic Results Framework
STRATEGIC OBJECTIVE:All Filipinos acquire basic education competencies
INDICATORS OF STRATEGIC OBJECTIVE:
1. Readiness for school at Grade 12. Participation3. Completion4. Achievement5. Functional literacy -
OSY & adults
INTERMEDIATE RESULTS:
All public schools implement School Improvement Plans1All 184 DepEd Divisions implement local basic education plans with LGUs2All 17 DepEd Regional Offices implement regional basic education support plans3DepEd Central Office provides policy and program climate supportive of quality basic education outcomes for all4

SCHOOLS FIRST INITIATIVE
Strategic Results FrameworkSTRATEGIC OBJECTIVE:All Filipinos acquire basic education competencies
School Improvement Plans 1- School head leadership- Stakeholders participation- School Improvement Plan (SIP)- School governance
Local Basic Education (BE) Plans 2- Population-based plan- Local programs in ECCD / ALS- Support to SIPs- Local governance
Regional BE Support Plans 3- Region-specific issues- Support to 1&2 -Measurement of performance- Partnership for teachers/ school head develop-ment results
Policy & Program Climate 4- Admin decentralization- Budget reform- Institutional policies- Advocacies- Development of leaders for BE reform

SCHOOLS FIRST INITIATIVE
implementing the Schools First Initiative
Action 1: public discussion of basic education outcomes, broad consensus on goals, “education summit”
Action 2: active engagement of DepEd with LGU
Action 3: active engagement of DepEd with other partners and potential allies in community
Action 4: process is brought down to schools
Action 5: core group of DepEd staff forms that internalizes and articulates reform process and learns its application and practice
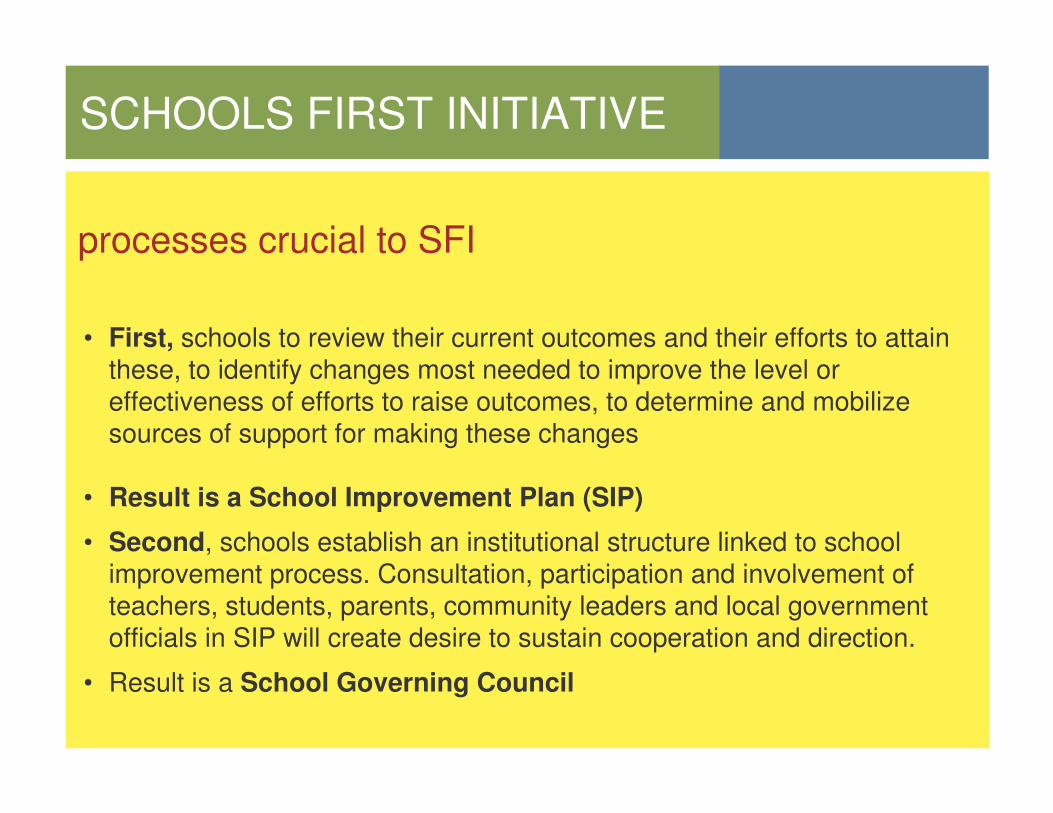
SCHOOLS FIRST INITIATIVE
processes crucial to SFI
• First, schools to review their current outcomes and their efforts to attain these, to identify changes most needed to improve the level or effectiveness of efforts to raise outcomes, to determine and mobilize sources of support for making these changes
• Result is a School Improvement Plan (SIP)
• Second, schools establish an institutional structure linked to school improvement process. Consultation, participation and involvement of teachers, students, parents, community leaders and local government officials in SIP will create desire to sustain cooperation and direction.
• Result is a School Governing Council

SCHOOL GOVERNING COUNCIL
what is SGC?
>Structure organized by the school head, with support of the superintendent, and concurrence of school’s stakeholders (teachers, students, parents, community leaders and local government officials) according to administrative guidance to be issued by DepEd
>School head decides how to proceed based on guidance from all concerned.

SCHOOL GOVERNING COUNCIL
Co-chairs: school head and LGU representative (designated by LCE with concurrence of local council)
Members:
(2) parents, male and female (designated by PTCA)(1) teacher (elected by teaching staff)(1)student (student council head)(1) a local businessman or professional (1) an educator from academe, retired, NGO or private school (both
nominated by school head with concurrence of teaching staff)
composition of SGC
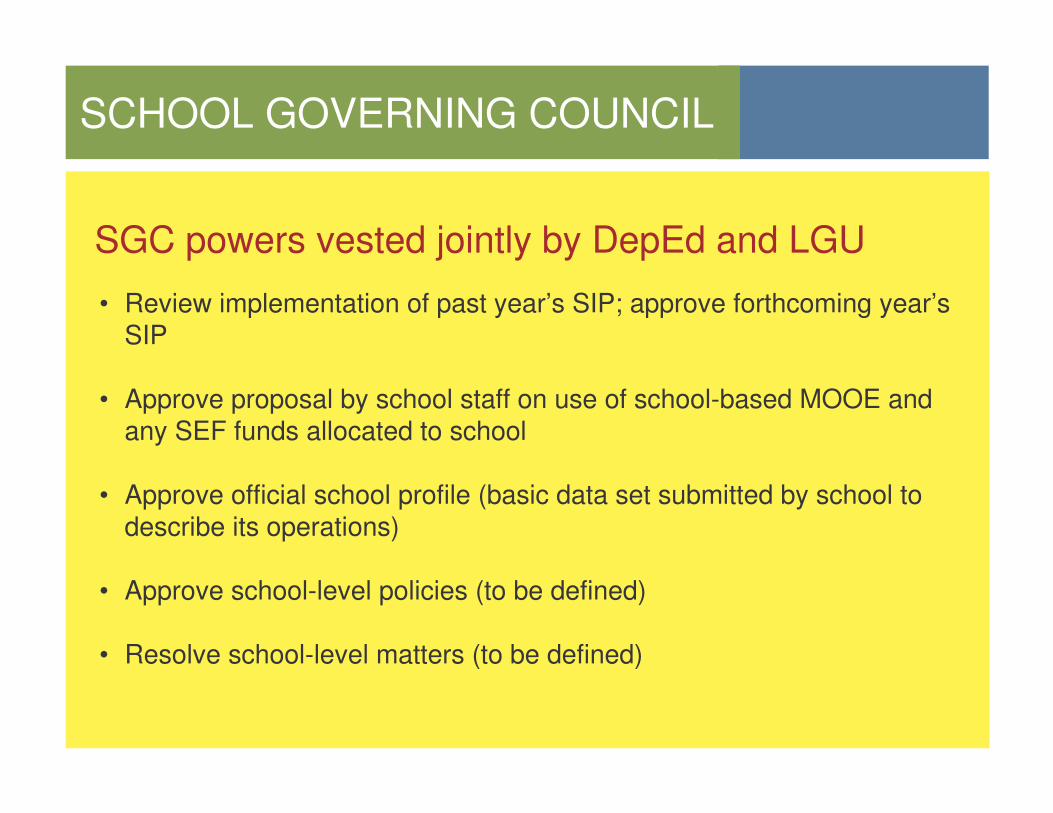
SCHOOL GOVERNING COUNCIL
• Review implementation of past year’s SIP; approve forthcoming year’s SIP
• Approve proposal by school staff on use of school-based MOOE and any SEF funds allocated to school
• Approve official school profile (basic data set submitted by school to describe its operations)
• Approve school-level policies (to be defined)
• Resolve school-level matters (to be defined)
SGC powers vested jointly by DepEd and LGU
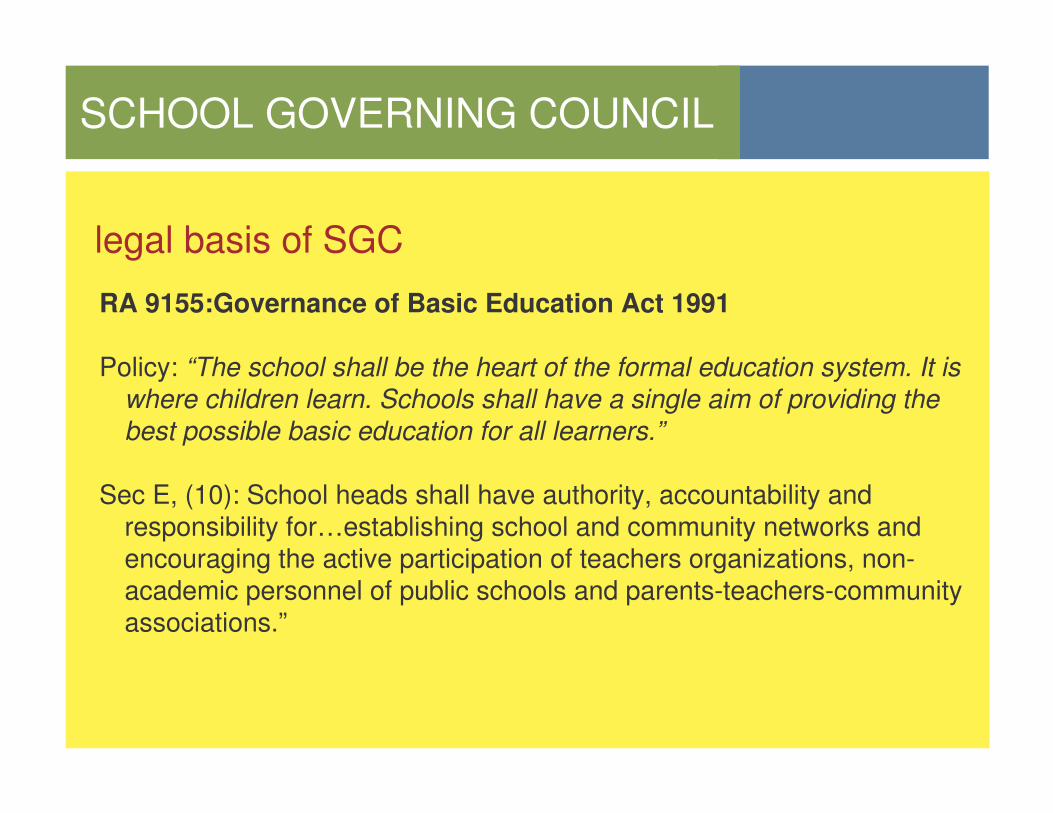
SCHOOL GOVERNING COUNCIL
RA 9155:Governance of Basic Education Act 1991
Policy: “The school shall be the heart of the formal education system. It is where children learn. Schools shall have a single aim of providing the best possible basic education for all learners.”
Sec E, (10): School heads shall have authority, accountability and responsibility for…establishing school and community networks and encouraging the active participation of teachers organizations, non-academic personnel of public schools and parents-teachers-community associations.”
legal basis of SGC

SCHOOL GOVERNING COUNCIL
• SGC does not raise funds, nor receive funds, nor disburse funds. School funds remain in DepEd system; LGU funds remain in LGU system.
• SGC does not oversee the school head but provides the school head with a forum to discuss school improvement.
• School head remains the chief administrator of school operations and the head of instructional activities of the school.
clarifications

SCHOOLS FIRST INITIATIVE
Strategic Results Framework
STRATEGIC OBJECTIVE:All Filipinos acquire basic education competencies
INDICATORS OF STRATEGIC OBJECTIVE:
1. Readiness for school at Grade 12. Participation3. Completion4. Achievement5. Functional literacy -
OSY & adults
INTERMEDIATE RESULTS:
All public schools implement School Improvement Plans1All 184 DepEd Divisions implement local basic education plans with LGUs2All 17 DepEd Regional Offices implement regional basic education support plans3DepEd Central Office provides policy and program climate supportive of quality basic education outcomes for all4
SCHOOLS FIRST INITIATIVE
Strategic Results FrameworkSTRATEGIC OBJECTIVE:All Filipinos acquire basic education competencies
School Improvement Plans 1- School head leadership- Stakeholders participation- School Improvement Plan (SIP)- School governance
Local Basic Education (BE) Plans 2- Population-based plan- Local programs in ECCD / ALS- Support to SIPs- Local governance
Regional BE Support Plans 3- Region-specific issues- Support to 1&2 -Measurement of performance- Partnership for teachers/ school head develop-ment results
Policy & Program Climate 4- Admin decentralization- Budget reform- Institutional policies- Advocacies- Development of leaders for BE reform