gladys.emlweb...eml-598 pilot test of ansi draft standard n13.29 environmental dosimetry –...
TRANSCRIPT

EML-598
PILOT TEST OF ANSI DRAFT STANDARD N13.29 ENVIRONMENTAL DOSIMETRY– PERFORMANCE CRITERIA FOR TESTING
G. Klemic,1 J. Shobe,2 S. Sengupta,3 P. Lamperti,2 C. Soares,2 P. Shebell,1 M. Monetti,1 F. Raccah1
1Environmental Measurements Laboratory, U. S. Department of Energy,201 Varick Street, 5th Floor, New York, NY 10014-4811
2National Institute of Standards and Technology, Gaithersburg, MD 20899
3Brookhaven National Laboratory, Upton, NY 11973
September 1998
DISCLAIMER
"This report was prepared as an account of work sponsored by an agency of the United States Government. Neitherthe United States Government nor any agency thereof, nor any of their employees, makes any warranty, express orimplied, or assumes any legal liability or responsibility for the accuracy, completeness, or usefulness of anyinformation, apparatus, product, or process disclosed, or represents that its use would not infringe privately ownedrights. Reference herein to any specific commercial product, process, or service by trade name, trademark,manufacturer, or otherwise, does not necessarily constitute or imply its endorsement, recommendation, or favoring bythe United States Government or any agency thereof. The views and opinions of authors expressed herein do notnecessarily state or reflect those of the United States Government or any agency thereof."
This report has been reproduced directly from the best available copy.
Available to DOE and DOE Contractors from the Office of Scientific and Technical Information, P. O. Box 62, OakRidge, TN 37831; prices available from (423) 576-8401.
Available to the public from the U.S. Department of Commerce, Technology Administration, National TechnicalInformation Service, 5285 Port Royal Road, Springfield, Virginia 22161, (703) 487-4650.

i
ABSTRACT
American National Standards Institute Draft N13.29 describes performance tests forenvironmental radiation dosimetry providers. If approved, it would be the first steptoward applying the types of performance testing now required in personnel dosimetry toenvironmental radiation monitoring. The objective of this study was to pilot test the draftstandard, before it undergoes final balloting, on a small group of dosimetry providers thatwere selected to provide a mix of facility types, thermoluminescent dosimeter designs andmonitoring program applications. The first phase of the pilot test involved exposingdosimeters to laboratory photon, beta, and x-ray sources at routine and accident doselevels. In the second phase, dosimeters were subjected to ninety days of simulatedenvironmental conditions in an environmental chamber that cycled through extremes oftemperature and humidity. Two out of seven participants passed all categories of thelaboratory testing phase, and all seven passed the environmental test phase. While somerelatively minor deficiencies were uncovered in the course of the pilot test, the resultsshow that draft N13.29 describes useful tests that could be appropriate for environmentaldosimetry providers. An appendix to this report contains recommendations that shouldbe addressed by the N13.29 working group before draft N13.29 is submitted for balloting.

ii
TABLE OF CONTENTS
Introduction . . . . . . . . . . . . . . . . . . . . . . . . . . . . . . . . . . . . . . . . . . . . . . . . . . . . . . . . . . . 1
Participant Selection . . . . . . . . . . . . . . . . . . . . . . . . . . . . . . . . . . . . . . . . . . . . . . . . . . . 1
Phase 1. Laboratory Testing . . . . . . . . . . . . . . . . . . . . . . . . . . . . . . . . . . . . . . . . . . . . . 2
Methods . . . . . . . . . . . . . . . . . . . . . . . . . . . . . . . . . . . . . . . . . . . . . . . . . . . . . . . 2
Quantities . . . . . . . . . . . . . . . . . . . . . . . . . . . . . . . . . . . . . . . . . . . . . . . . . . . . . . 3
Phase 1. Results . . . . . . . . . . . . . . . . . . . . . . . . . . . . . . . . . . . . . . . . . . . . . . . . . . . . . . . 4
Participant Reports . . . . . . . . . . . . . . . . . . . . . . . . . . . . . . . . . . . . . . . . . . . . . . 4
Calculation of Performance . . . . . . . . . . . . . . . . . . . . . . . . . . . . . . . . . . . . . . . 4
Phase 1. Discussion . . . . . . . . . . . . . . . . . . . . . . . . . . . . . . . . . . . . . . . . . . . . . . . . . . . . 6
Phase 2. Field Testing . . . . . . . . . . . . . . . . . . . . . . . . . . . . . . . . . . . . . . . . . . . . . . . . . . 7
Methods . . . . . . . . . . . . . . . . . . . . . . . . . . . . . . . . . . . . . . . . . . . . . . . . . . . . . . . 8
Phase 2. Results . . . . . . . . . . . . . . . . . . . . . . . . . . . . . . . . . . . . . . . . . . . . . . . . . . . . . . . 9
Phase 2. Discussion . . . . . . . . . . . . . . . . . . . . . . . . . . . . . . . . . . . . . . . . . . . . . . . . . . . 10
Summary and Conclusions . . . . . . . . . . . . . . . . . . . . . . . . . . . . . . . . . . . . . . . . . . . . . 10
References . . . . . . . . . . . . . . . . . . . . . . . . . . . . . . . . . . . . . . . . . . . . . . . . . . . . . . . . . . . 12
Tables 1-13 . . . . . . . . . . . . . . . . . . . . . . . . . . . . . . . . . . . . . . . . . . . . . . . . . . . . . . . . . . 13
Figures 1-16 . . . . . . . . . . . . . . . . . . . . . . . . . . . . . . . . . . . . . . . . . . . . . . . . . . . . . . . . . . 26
Appendix A. Recommended Modifications to Draft N13.29 . . . . . . . . . . . . . . . . . . 36
Appendix B. Examples of Instructions and Response Forms . . . . . . . . . . . . . . . . . 41

1
INTRODUCTION
Passive environmental dosimeters are widely used to assess the radiation dose to the generalpublic from nuclear or radiological facilities and to demonstrate compliance with regulations onpublic dose limits. Over 21,000 sites worldwide are currently being monitored with such devices,including U. S. Department of Energy (DOE) facilities and Nuclear Regulatory Commission(NRC) licensed sites (Klemic et al. in press). There is presently no required performance testingor accreditation program in the U. S. for environmental dosimetry providers, a potential weaknessshould the estimates for radiation dose to the general public from a radiological facility bechallenged. In contrast, personnel dosimetry providers for DOE sites are required to passperformance tests in the DOE Laboratory Accreditation Program (DOELAP), and thoseproviders for NRC sites must pass the National Voluntary Laboratory Accreditation Program(NVLAP).
American National Standards Institute (ANSI) Draft Standard N13.29 provides the criteriaand procedures for determining performance of processors engaged in environmental radiationdosimetry using passive dosimeters. It is analogous to ANSI N13.11 (ANSI 1993), which is thebasis for personnel dosimetry testing. ANSI Draft N13.29 was developed by a group of expertsappointed by the Health Physics Society Standards Committee in 1991. It was approved for pilottesting in February 1996 and an independent panel reviewed three proposals submitted to theDOE Office of Environment, Safety and Health (EH). The Environmental MeasurementsLaboratory’s (EML) proposal for collaboration between EML, the National Institute of Standards(NIST) and Brookhaven National Laboratory (BNL) was selected in March 1997.
The objective of this pilot study is to test the draft standard on a small group of processorsbefore it undergoes final balloting to become an American National Standard. The standard callsfor two phases of testing. Phase one is the laboratory testing of the dosimeters and consists ofthree categories: accident (using 137Cs and 90Sr/90Y sources), routine (137Cs and 90Sr/90Y), andenergy (H40 and H100 x-ray sources). Phase two involves testing the dosimeters under real andsimulated field conditions. We report here on the results of the pilot test, and our recommendedmodifications are presented in Appendix A.
PARTICIPANT SELECTION
Seven participants were selected to provide a mix of facility types, thermoluminescentdosimeter (TLD) designs, environmental monitoring program applications, and experience levels.The participants represented three DOE national laboratories, the NRC, one nuclear power plant,and two commercial dosimetry providers. They routinely perform fence-line, off-site, on-site,and/or remediation monitoring. TLDs used were LiF:Mg,Ti, CaF:Dy, Li2B4O7, CaSO4, andAl2O3:C. Dosimeter designs included five commercially available badge-type dosimeters (three

2
manufactured by Panasonic and two by Harshaw), and two “in-house” designed packagescontaining loose chips. The dosimeter types are summarized in Table 1. The letters A-Gidentified participants throughout the pilot test.
PHASE 1. LABORATORY TESTING
METHODS
Each participant submitted a total of 34 dosimeters to EML in August 1997. These includedtwo control dosimeters to measure the dose accumulated in transit and storage, two sparedosimeters, and five dosimeters to be irradiated in each of the following subcategories: accidentphoton, accident beta, routine photon, routine beta, energy H40 x-ray, and energy H100 x-ray.Draft N13.29 allows the processor to choose which subcategories to be tested in, but for purposesof the pilot test all participants were tested in all categories. There were no mixture categories,but the radiation sources were not revealed except for the accident category.
Upon receipt at EML, all dosimeters were stored in a steel vault where the backgroundradiation was reduced by about 75% to an air-kerma level of 14 nGy h-1. Dosimeters were loggedin and scanned for surface contamination, sorted and tagged. Doses to be delivered wereassigned by generating a random number using the log of the dose between 0.01 to 0.5 Gy for theaccident category, and 0.2 to 10.0 mSv for the other categories. Five separate randomly selecteddoses were required for each category, with no more than one per category being < 0.3 mSv.
Five packets were made up for each subcategory, each containing one dosimeter from eachof the participants. Forty-one EML LiF:Mg,Ti quality control (QC) dosimeters (Klemic 1996)were prepared to provide verification of photon and x-ray irradiations and were included in thepackets. Separate packets containing the control and spare dosimeters were kept with thedosimeters at all times. In October, all of the dosimeters were transported by car to NIST. Dosesthat may have been received in transit would be recorded on the control dosimeters also, and,consequently, subtracted out at the end of the test.
Irradiations for the laboratory phase were performed at NIST during the week of October20th-24th, 1997. For the 137Cs irradiations, two horizontal-beam sources were used. Radiationfrom both units was collimated into a circular beam. The first unit delivered an air-kerma rate of3.459 µGy s-1 at 195 cm with a useful beam diameter of 37 cm. Irradiations were performed onthe second unit at both 195 cm, air-kerma rate of 33.145 µGy s-1, and at 300 cm, air-kerma rate of13.93 µGy s-1. The useful beam diameters were 31 cm and 50 cm, respectively. For the 90Sr/90Yirradiations, a collimated point-like source delivered an absorbed-dose rate of 1.854 mrad s-1,which had a uniform (± 5%) circular beam diameter of 15 cm at 50 cm. The 100 kV and 300 kVx-ray generators were used for the energy category, with uniform circular beam diameters of

3
15 cm and 50 cm at 100 cm and 220 cm, respectively. The combined total uncertainty fordelivered dose or exposure was estimated at 1.0%, 3.2%, and 1.0% for the 137Cs, 90Sr/90Y and x-ray sources, respectively. Uncertainty statements are on file at the NIST.
Five of the seven participant dosimeters in each packet were irradiated simultaneously alongwith an EML QC dosimeter. They were mounted on a single-plane, low-mass fixture usingdouble-sided adhesive tape, and distances were measured to the front face of the fixture (seeFigure 1). Two of the dosimeters in each packet were large cylindrical environmental packagesthat proved problematic for laboratory irradiations. Their large size necessitated separateirradiations and unique fixtures. Since the position of the dosimeter inside these packages wasnot fixed, special care was used in their setup. Distances were measured to the approximatecenter of these dosimeters (see Figure 2).
Seventy-five separate shots were required to irradiate all dosimeters in all categories. The QCdosimeters were read out and analyzed at EML. Results for all but one of the subcategories wereas expected. The QC TLDs for a few of the H40 x-ray shots were lower than expected, indicatinga possible problem with some of the H40 x-ray irradiations. When two of the participants alsoreported questionable results for the H40 irradiations, it was decided that it was in the bestinterest to repeat that subcategory test.
NIST installed a new 100 kV x-ray generator in November of 1997. The H40 irradiationswere repeated in February 1998 after the beam was mapped with film and an ion chamber. Eachparticipant submitted nine dosimeters to EML where the same procedures were followed to scan,sort, and tag the dosimeters. They were shipped to NIST along with EML QC dosimeters forirradiation on February 20th. Sixteen shots were required to irradiate all the dosimeters. Theywere returned to EML and then to the participants on February 26th. EML QC TLDs showed nounexpected results for the retest.
QUANTITIES
For the routine and energy categories, Draft N13.29 uses the quantities ambient doseequivalent H*(10) and directional dose equivalent H’(0.07). H*(10) is defined as the dose to anICRU tissue sphere at a depth of 10 mm, and H’(0.07) is the dose at a depth of 0.07 mm (refer toDraft N13.29 for precise definitions). Conversion factors given in the draft were used to convertthe NIST delivered air-kerma Ka in Gy to the appropriate quantities in Sv. For the 137Cssubcategories, H* (10) and H’ (0.07) are equal. For the x-ray categories, H*(10) and H’(0.07) arenot equal but both are applicable. For the routine beta irradiations, only the quantity H’(0.07) isdefined.
For the accident categories, Draft N13.29 uses the quantities penetrating absorbed dose intissue, D(10), and the shallow absorbed dose in tissue, D(0.07), since it is recognized that for

4
high (accident level) doses the dose-equivalence is not applicable. The conversion factors are thesame ones used for H*(10) and H’(0.07), but the units are Gy.
PHASE 1. RESULTS
PARTICIPANT REPORTS
Along with their dosimeters, participants received a response form and the option to reportresults electronically. Only those dosimeters used in the accident category and as controls wereidentified. Apparent inconsistencies in one report prompted a request that all participants rechecktheir results. In an actual performance test such corrections would not be solicited, emphasizingthe need for a careful evaluation of results prior to submission.
Some confusion was shown with regard to reporting quantities. Because dose-equivalentquantities are not used routinely by all the participants, the response form allowed air-kerma to bereported along with ambient and directional dose equivalent if needed. It was recognized thatsince the irradiation source is not revealed in the routine categories, it might not be possible todetermine the appropriate conversion factor. However, for the dosimeters exposed to betairradiations only H’(0.07) or D(0.07) are defined. Out of the seven participants, four reportedD(0.07) for the accident beta subcategory, and three reported H’(0.07) for the routine betasubcategory. Another participant reported H’(0.07) for the H40 x-ray but not for the routine betasubcategory. One participant (A) reported air kerma and also used the 137Cs conversion factor toreport “cesium dose equivalent” in mSv for all dosimeters.
CALCULATION OF PERFORMANCE
The pilot test investigators subtracted control results for three participants who had notalready done so, another action that would not be performed during formal testing. Results wereevaluated according to the N13.29 performance criteria, which states that to pass the followingconditions must be met:
35.0
35.0
50.0
≤
≤
≤+
S
B
SB

5
In the above equations, B is the “bias” of the values of the “performance quotient” Pi,defined as:
dosedelivered
dosedelivereddosemeasuredPi
_
__ −≡ (of the ith of n=5 test dosimeters)
with
∑=
=
=≡5
1
n
i
i
n
PPB
where the sum is extended over all five (n) values of Pi for a given subcategory.
The standard deviation, S, is defined as:
)1(
)(1
2
−
−∑≡ =
n
BPn
i
i
S
For a laboratory to pass the first phase, its bias and standard deviation must each be less thanor equal to 0.35, while their sum must be less than or equal to the tolerance level 0.50.
A summary of the performance results is shown in Table 2 and Figure 3 for all categories. Inthe figure, points within the dashed triangle meet the tolerance level of 0.50 on the sum of thebias and standard deviation. The additional separate limit of 0.35 on both the bias and standarddeviation corresponds to the vertical and horizontal lines at the corners of the triangle. To pass,both criteria must be met.
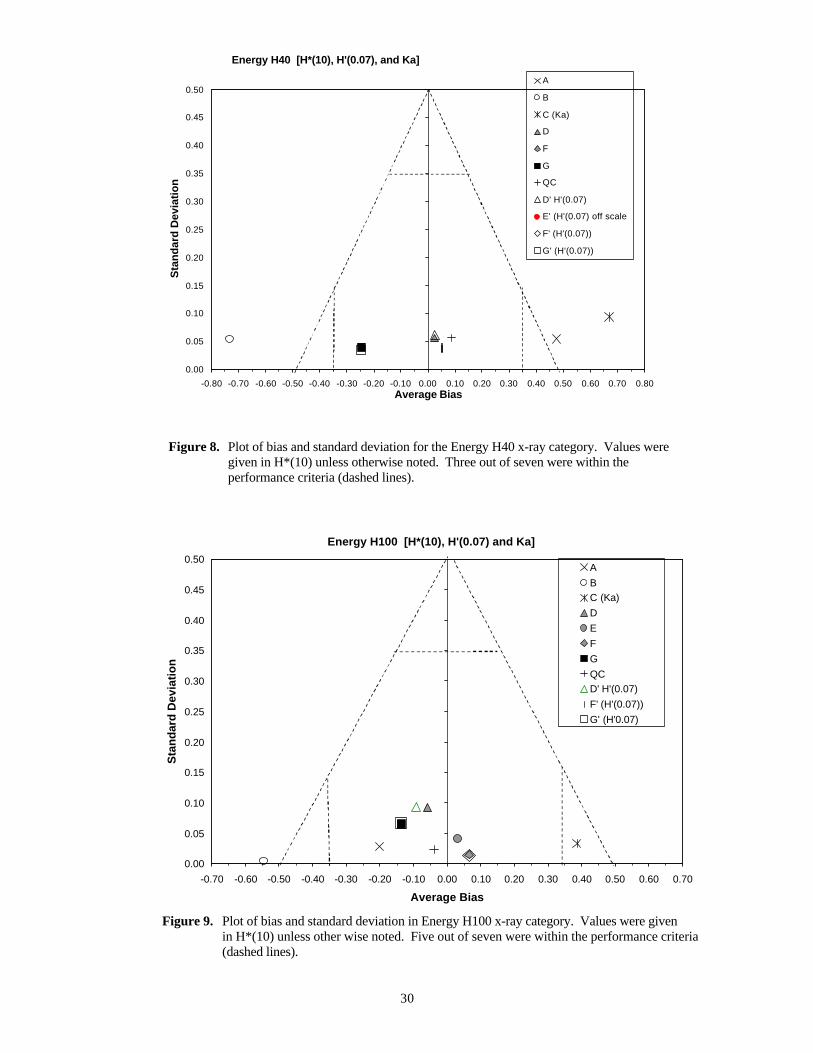
Results for the individual subcategories are tabulated in Tables 3-10 and are shown visuallyin Figures 4-9. In the tables, the NIST delivered doses are shown in the first two rows in terms ofthe appropriate quantities. The participants’ reported results are shown in the next seven rows.When both air-kerma (Ka) and dose equivalent values were reported, the dose equivalent valueswere used for the calculations and are shown in the tables. Values reported only in air-kerma areshown in italics. The performance quotient, bias, and standard deviation were calculated for eachparticipant and are shown in the next three columns. The overall performance rating of “pass” or“fail” is shown in the last column, applying the tolerance levels 0.50 (L1) and 0.35 (L2) describedabove. An asterisk indicates cases where there was no reported value in a particular quantity.There are two tables for each of the x-ray categories since both H*(10) and H’(0.07) areappropriate and are not equal.

6
PHASE 1. DISCUSSION
The laboratory tests described in N13.29 cover a range of sources and dose levels that someenvironmental dosimetry providers may not have experience in. In an actual performance test,participants would probably choose to omit those categories that are not relevant to theirapplications. For purposes of pilot testing the draft standard as thoroughly as possible, alldosimeters were subjected to every test. This must be taken into consideration when analyzingperformance in this pilot test. As Table 2 shows, there was only one category where all of theparticipants passed. Two participants passed in all categories.
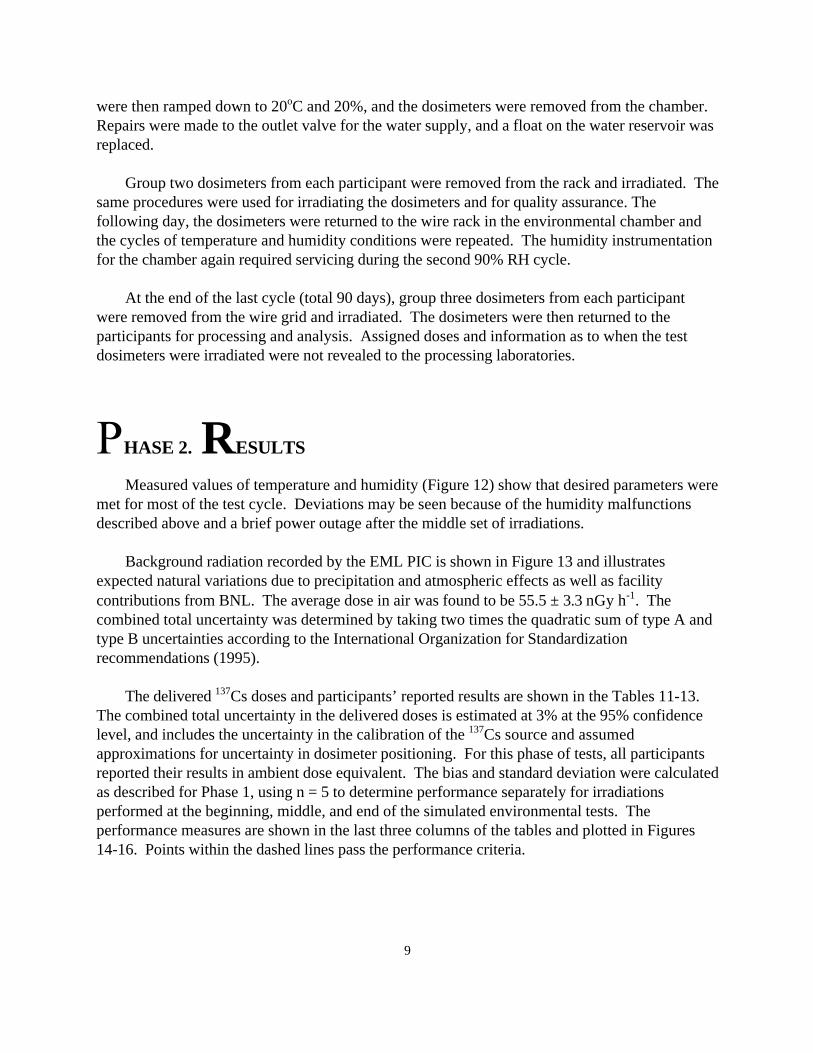
The routine photon category corresponds to the source and dose levels most often used forcalibrating environmental dosimeters. This category is also the closest to the laboratory testsapplied in the International Intercomparisons of Environmental Dosimeters (Klemic et al. 1995),which many of the participants have experience in. Perhaps for these reasons, this category is theone all of the participants passed. In the accident photon category, while the source is familiar,the doses delivered are much higher than those encountered in most environmental monitoringprograms and high readings and possible residual signals may have presented a new challenge tosome participants. In the accident photon category, six participants passed. (It should be notedthat without the request to recheck results, in both the routine and accident photon categoriesthere would have been one additional failure. One participant made a transcription error andanother made an error in applying conversion factors. No changes were permitted after apreliminary report revealed the delivered doses, although participant B determined that theywould have passed the accident category if they had not transposed some dosimeter results intheir report.)
The x-ray irradiations are new to most participants, and it is known that the response of mostTLDs to very low energy photons is significantly different from the higher energies routinelyused for calibration. To accurately measure low energy photons, a low-energy calibration sourcecould be used or correction factors applied. However, this requires knowledge of the irradiationsource which is not divulged according to the procedures of Draft N13.29.
The three dosimeters that passed the H40 x-ray category were capable of energydiscrimination by using element ratios with filters in a badge-type design. For these participants,it was possible to deduce the irradiation source and then apply appropriate correction orconversion factors. Two of the dosimeters that did not pass also apparently had this capability,but the processors do not routinely apply these techniques, presumably because they are notrequired for their applications. Dosimeters using loose chips without special filters did not passthe H40 x-ray category.
In the H100 x-ray category, the performance of the loose chip dosimeters was different.Both of the loose chip dosimeters that failed in H40 passed in H100. The two badge-type

7
dosimeters with unused energy discrimination capabilities, which failed the H40 irradiations, alsodid not pass in the H100 x-ray test. The rest of the badge-type dosimeters passed the H100 test.
Beta irradiations are new to many participants, and in the routine category many did notreport the appropriate quantity. Of the three who did report directional dose equivalent for theroutine beta case, all passed. Among the others, two were dosimeters that were not designed tomeasure beta and had never been tested with beta irradiations, and two were apparently capableof beta discrimination in theory. Measured values were reported in these cases but they were notin directional dose equivalent quantities, so they could not be compared to the delivered dose,and, therefore, could not pass the performance criteria. However, this suggests that performancemay be improved with appropriate calibrations or procedural modifications. For the accidentbeta category, the source was revealed and five participants were able to report the shallowabsorbed dose; of these, three passed.
The choice of quantities remains a difficult issue in the field of environmental dosimetry.Based on data from the International Intercomparisons of Environmental Dosimeters, mostprocessors prefer physical quantities to dose-equivalent quantities. ANSI Draft N13.29 usesdose-equivalent quantities since the purpose of environmental dosimetry is ultimately to assessthe dose to a person. Furthermore, environmental dosimetry programs may be used to verifycompliance with regulations on dose limits to the public, which are specified in terms of dose-equivalent values.
Most of the participants in the pilot test are not routinely using dose-equivalent quantities intheir environmental monitoring programs. Since the sources in the routine and energy categoriesof Draft N13.29 are not revealed, the selection of the appropriate conversion factor could be aproblem. For some of the participants, deducing the irradiation source with a dosimeter designedfor energy and beta discrimination solved this problem. Among the participants using dosimeterswithout this capability, one simply chose to apply the 137Cs factor in all cases, while another waslimited to reporting in air kerma for the routine and energy categories. Perhaps in a realperformance test a participant using a dosimeter without energy discrimination would elect to betested only in the 137Cs categories and the problem would be solved.
PHASE 2. FIELD TESTING
The second phase of ANSI Draft 13.29 involves exposing dosimeters to simulated fieldconditions, using an environmental chamber, and actual environmental conditions at an outdoorfield site. Because of limited funding, only the environmental chamber tests were included in thispilot test. Draft N13.29 requires that a dosimetry provider pass the Laboratory Test Phase priorto beginning the second phase of tests. However, for purposes of the pilot test, this was notenforced.
8
The simulated field tests require exposing dosimeters to extremes of temperature (-20 and+50oC) and relative humidity (RH, 20% and 90%) in an environmental chamber using 15-daycycles for a total period of 90 days. Lighting is to be provided by two 40-W fluorescent bulbs.The environmental test dosimeters are removed from the chamber and irradiated at the beginning,middle, and end of the 90-day period using a 137Cs source. The value of interest is the delivered137Cs dose. The natural environmental radiation field (measured by control dosimeters) issubtracted as background.
METHODS
Each participant submitted 22 dosimeters to EML in December 1997. These included twospare dosimeters and five control dosimeters. The remaining 15 dosimeters from each laboratorywere divided into three groups of five dosimeters, designated for irradiation at the beginning,middle (45 days) and end (90 days) of the environmental tests. Each dosimeter was assigned adifferent dose between 0.5 and 10.0 mSv, based on a random selection of the logarithm of theambient dose equivalent. As in the first phase of tests, dosimeters were logged in, scanned forsurface contamination, sorted and tagged. Dosimeters were transported to BNL, about 70 mileseast of EML.
In January 1998, group one dosimeters from each participant were irradiated using BNL’s137Cs point source. Dosimeters were mounted on a thin Lucite track at a distance of 1.0 m fromthe center of the dosimeters to the source (see Figure 10). Dosimeters assigned to each dose levelwere irradiated in a single shot. EML QC dosimeters and a NIST calibrated reference ionizationchamber verified each irradiation. The QC TLDs were not subjected to the environmentalchamber tests and were read out within a few days of the irradiations.
All 22 dosimeters from each participant were suspended from a steel rack using plastic cableties and placed in a 91 x 91 x 101 cm environmental chamber, where lighting was provided bytwo 40-W fluorescent bulbs. The distance from the lamp to the dosimeters was about 0.3 m,resulting in an illuminance to the dosimeters of about 2500-2800 lux. Two EML pressurizedionization chambers (PICs) continuously monitored the background radiation dose near theenvironmental chamber, with servicing required every 2 weeks. A microprocessor-based digitalcontrol system was used to control the temperature and humidity in the chamber (see Figure 11).The set point and actual parameters were logged on a PC and recorded on 12-day chart paper.Cycling between the extremes of temperature and humidity occurred over a period of 24 h.
For the first test cycle, the temperature in the chamber was reduced to –20oC (humiditycontrols were turned off). During this time the fluorescent bulbs dimmed considerably. After 15days at –20oC, conditions were ramped up to +50oC and 20% RH, where they were held constantfor 15 days. The RH was then ramped up to 90% and held for 15 days at +50oC. After about7 days at these settings, the outlet valve for the water supply became blocked and the humidityconditions did not meet the set point; for the second half of the 15-day period the humidityaveraged 72% rather than the desired value of 90% (see Figure 12). The temperature and RH
9
were then ramped down to 20oC and 20%, and the dosimeters were removed from the chamber.Repairs were made to the outlet valve for the water supply, and a float on the water reservoir wasreplaced.
Group two dosimeters from each participant were removed from the rack and irradiated. Thesame procedures were used for irradiating the dosimeters and for quality assurance. Thefollowing day, the dosimeters were returned to the wire rack in the environmental chamber andthe cycles of temperature and humidity conditions were repeated. The humidity instrumentationfor the chamber again required servicing during the second 90% RH cycle.
At the end of the last cycle (total 90 days), group three dosimeters from each participantwere removed from the wire grid and irradiated. The dosimeters were then returned to theparticipants for processing and analysis. Assigned doses and information as to when the testdosimeters were irradiated were not revealed to the processing laboratories.
PHASE 2. RESULTS
Measured values of temperature and humidity (Figure 12) show that desired parameters weremet for most of the test cycle. Deviations may be seen because of the humidity malfunctionsdescribed above and a brief power outage after the middle set of irradiations.
Background radiation recorded by the EML PIC is shown in Figure 13 and illustratesexpected natural variations due to precipitation and atmospheric effects as well as facilitycontributions from BNL. The average dose in air was found to be 55.5 ± 3.3 nGy h-1. Thecombined total uncertainty was determined by taking two times the quadratic sum of type A andtype B uncertainties according to the International Organization for Standardizationrecommendations (1995).
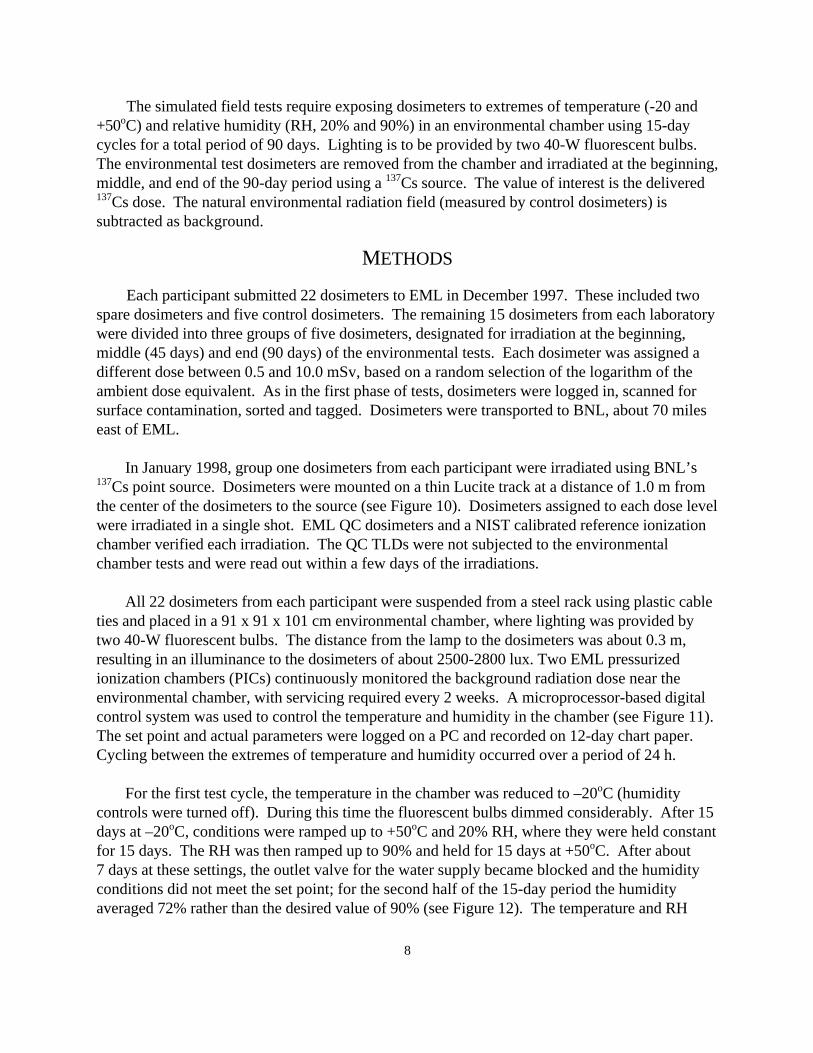
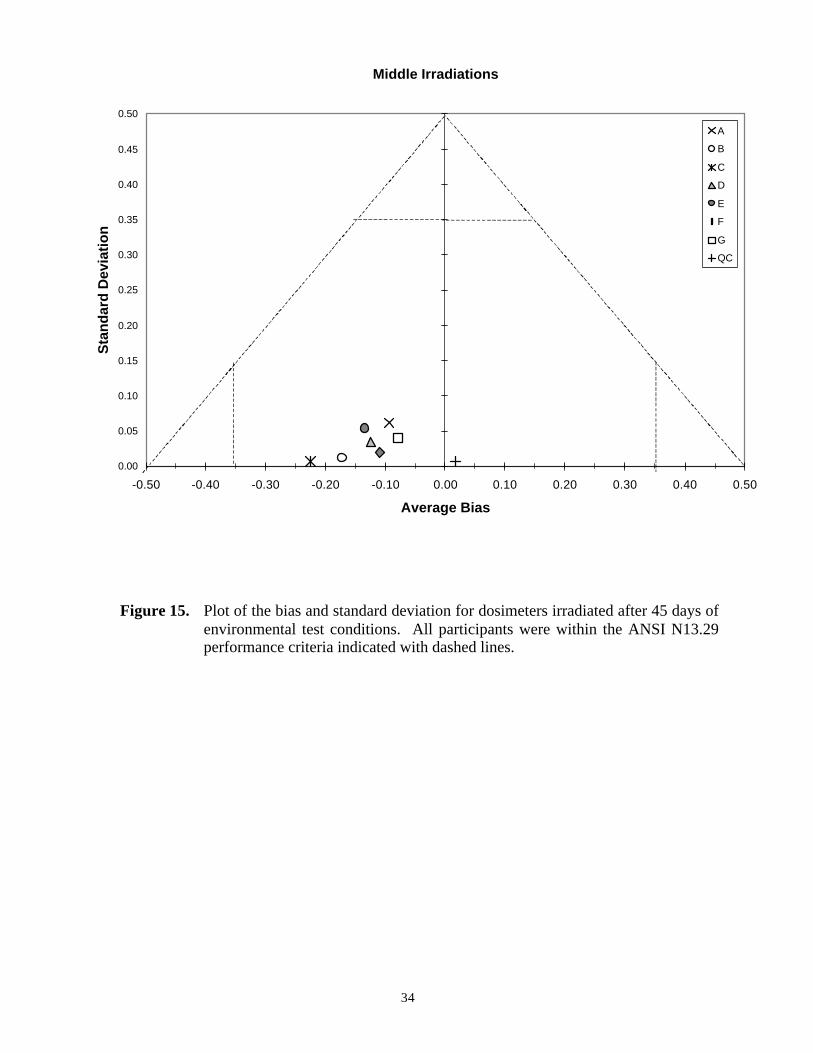
The delivered 137Cs doses and participants’ reported results are shown in the Tables 11-13.The combined total uncertainty in the delivered doses is estimated at 3% at the 95% confidencelevel, and includes the uncertainty in the calibration of the 137Cs source and assumedapproximations for uncertainty in dosimeter positioning. For this phase of tests, all participantsreported their results in ambient dose equivalent. The bias and standard deviation were calculatedas described for Phase 1, using n = 5 to determine performance separately for irradiationsperformed at the beginning, middle, and end of the simulated environmental tests. Theperformance measures are shown in the last three columns of the tables and plotted in Figures14-16. Points within the dashed lines pass the performance criteria.

10
PHASE 2. DISCUSSION
All participants passed the second phase of simulated environmental tests. As Figures 14-16show, in all but one case the participants’ dosimeters showed a negative average bias while theQC dosimeters are in good agreement with the delivered doses. Since phase one tests showedboth positive and negative bias, it appears that the environmental chamber conditions resulted insome signal and/or trap fading that would not occur under laboratory conditions. However, in allcases the fading was less than 25% and all participants easily passed this phase of testing.
SUMMARY AND CONCLUSIONS
American National Standards Institute Draft N13.29 describes performance tests forenvironmental dosimetry processors using passive dosimeters. If approved it would be the firststep toward applying the types of performance testing now required in personnel radiationmonitoring to the field of environmental dosimetry. The purpose of this project was to pilot testDraft N13.29 on a small group of dosimetry providers in order to uncover potential deficienciesbefore it undergoes final balloting. The processors participating in the test represented a widerange of facility types and thermoluminescent dosimeter designs.
The first phase of the pilot test involved laboratory testing categories using photon, beta, andx-ray sources and routine and accident dose levels. Two out of seven participants passed in allcategories, and there was one category where everyone passed. The low energy x-ray (H40) andbeta categories had the lowest passing rate. The second phase of the pilot test involvedsubjecting dosimeters to simulated environmental conditions using an environmental chamber.All participants passed the second phase of tests. Another set of tests required by the standardthat would involve an outdoor field exposure was not included in the pilot study.
The results indicate that Draft N13.29 describes useful and rigorous tests that would beappropriate for the testing of environmental dosimetry providers. Such tests would provideverification for programs that assess radiation dose to the general public. Appendix A containsrecommendations that should be addressed before Draft N13.29 is submitted for final balloting.

11
Acknowledgments --The investigators acknowledge the important contributions made by: M.Moscovitch (Georgetown University), D. Armstrong (Los Alamos National Laboratory), C. Chan(Commonwealth Edison), S. Cooper (FluorDaniel Fernald), W. Mickey (ThermoNUtech), C.Ochampaugh (Landauer, Inc.), B. Rathbone (Pacific Northwest National Laboratory), R.Struckmeyer (NRC), S. Kendall (EML), N. Chieco (EML), L. Michel (BNL), S. Smith (BNL), V.Casella (BNL), and F. Stepnoski (BNL).
This study was funded by the Department of Energy Office of Environment, Safety andHealth, Project No. 97ES0007053.

12
REFERENCES
American National Standards InstitutePersonnel Dosimetry Performance – Criteria for TestingANSI Report N13.11-1993, New York, NY (1993)
International Organization for StandardizationGuide to the Expression of Uncertainty in Measurements, ISBN 92-67-10188-9 (1995)
Klemic, G., J. Shobe, S. Sengupta, P Shebell, K. Miller, P.T. Carolan, G. Holeman, H. Kahnhauser, P. Lamperti, C. Soares, N. Azziz, and M. MoscovitchState of the Art of Environmental Dosimetry: 11th International Intercomparison and Proposed Performance TestsProceedings of the 12th International Conference on Solid State Dosimetry, Burgos, Spain (inpress)
Klemic, G.Thermoluminescence DosimetryIn: EML Procedures Manual, HASL-300, 28th Edition, Vol. 1, New York, NY [available at: www.eml.doe.gov, NTIS, Springfield, VA, Product No. PB97-162549LTN] (1997)
Klemic, G., J. Shobe, T. Gesell, and P. ShebellResults of the Tenth International Intercomparison of Environmental DosimetersRadiat. Protection Dosim. 58:133-142 (1995)

13
TABLE 1
DOSIMETER TYPES USED IN PILOT TEST OF ANSI DRAFT N13.29
ParticipantIdentification Dosimeter Type Manufacturer TLD Material
A Loose chips inunique design
Harshaw TLD100 natLiF:Mg,Ti
B Commercial badge Panasonic 814Li2B4O7,
CaSO4, CaSO4*
C Commercial badge Harshaw 8807CaF:Dy
7LiF:Mg,Ti
D Commercial badge Panasonic 814 Li2B4O7, CaSO4, CaSO4 *
ELoose chips inunique design
Victoreen 2600-80 Al2O3:C
F Commercial badge Harshaw 8807CaF:Dy
7LiF:Mg,Ti
G Commercial badge Panasonic 801Li2B4O7 (2) **
CaSO4 (2) *
*Behind lead filter **Behind plastic window

14
TABLE 2
SUMMARY OF PERFORMANCE IN LABORATORYTESTING PHASE
Category Number Who Passed (out of 7 total)
Accident: Photon Beta
63
Routine: Photon Beta
73
Energy: x-ray H40 x-ray H100
35

15
TABLE 3
PHOTON ACCIDENT CATEGORY (in absorbed dose)
AccidentCs 1
(mGy)
AccidentCs 2
(mGy)
AccidentCs 3
(mGy)
AccidentCs 4
(mGy)
AccidentCs 5
(mGy) Bias S B+S
Performance(L1=0.5
L2=0.35)
NIST Delivered Dose
D(10)=D(0.07) 32.4 219.6 373.2 19.2 72.0
Ka 27.0 183.0 311.0 16.0 60.0
Participants Reported Results
A* 32.5 218 358 18.4 68.9 -0.027 0.022 0.049 pass
B* 28.08 0.51 216.52 2.23 369.6 0.340 2.149 2.489 fail
C* 40.397 277.129 481.210 24.197 85.588 0.249 0.037 0.287 pass
D 29.03 208.50 359.58 16.56 63.06 -0.091 0.045 0.135 pass
E 28.88 192.51 327.94 16.11 61.52 -0.132 0.021 0.153 pass
F 33.086 230.033 389.171 19.763 74.088 0.034 0.011 0.045 pass
G 42.6 294 498 22.8 92 0.291 0.062 0.353 pass
QC 32.01 202.30 331.14 19.57 70.02 -0.042 0.053 0.095 pass
*Investigators subtracted control-dosimeter results.

16
TABLE 4
BETA ACCIDENT CATEGORY (in shallow absorbed dose)
AccidentBeta 1(mGy)
AccidentBeta 2(mGy)
AccidentBeta 3(mGy)
AccidentBeta 4(mGy)
AccidentBeta 5(mGy) Bias S B+S
Performance(L1=0.5L2=0.35)
NIST Delivered
D(0.07) 55.8 227.8 51.2 117.1 23.3
Participants Reported Results
A ** ** ** ** ** ** ** ** fail
B ** ** ** ** ** ** ** ** fail
C* 44.185 182.92 39.714 98.535 18.427 -0.199 0.025 0.224 pass
D 50.73 189.55 53.21 116.11 24.82 -0.033 0.096 0.129 pass
E 27.31 106.2 25.55 52.21 12.00 -0.517 0.027 0.544 fail
F 53.476 206.071 47.489 107.265 22.086 -0.069 0.022 0.091 pass
G 10.4 165 34.6 85.2 17.2 -0.390 0.238 0.628 fail
*Investigators subtracted control-dosimeter results.** No values reported in D(0.07).

17
TABLE 5
PHOTON ROUTINE CATEGORY (in ambient dose equivalent, withair kerma, Ka, shown in italics)
RoutineCs 1
RoutineCs 2
RoutineCs 3
RoutineCs 4
RoutineCs 5 Bias S B+S
Performance(L1=0.5L2=0.35)
NIST Delivered
H*(10) =H(0.07)(mSv)
2.35 0.40 0.80 0.32 5.30
Ka
(mGy)1.96 0.33 0.67 0.27 4.42
Participants Reported Results
A* (mSv)
2.28 0.38 0.80 0.32 5.07 -0.030 0.019 0.049 pass
B*(mSv)
2.09 0.36 0.70 0.28 4.60 -0.120 0.019 0.139 pass
C*(mGy)
2.254 0.378 0.783 0.318 5.635 -0.183 0.053 0.236 pass
D(mSv)
2.07 0.36 0.74 0.28 4.75 -0.106 0.022 0.129 pass
E(mSv)
2.58 0.427 0.846 0.298 5.923 0.053 0.078 0.131 pass
F(mSv)
2.356 0.412 0.798 0.326 5.486 0.015 0.021 0.036 pass
G(mSv)
2.42 0.420 0.864 0.330 5.72 0.052 0.027 0.079 pass
QC(mSv)
2.43 0.42 0.82 0.34 5.61 0.044 0.017 0.061 pass
*Investigators subtracted control-dosimeter results.

18
TABLE 6
BETA ROUTINE CATEGORY (in directional dose equivalent)
RoutineBeta 1
RoutineBeta 2
RoutineBeta 3
RoutineBeta 4
RoutineBeta 5 Bias S B+S
Performance(L1=0.5L2=0.35)
NIST Delivered
H'(0.07)(mSv) 0.34 6.54 0.62 9.02 0.91
Participants Reported Results
A * * * * * * * * fail
B * * * * * * * * fail
C * * * * * * * * fail
D (mSv)
0.38 6.45 0.64 8.53 0.83 -0.001 0.080 0.081 pass
E * * * * * * * * fail
F(mSv)
0.315 5.782 0.554 8.180 0.808 -0.100 0.017 0.117 pass
G(mSv)
0.386 5.82 0.501 7.51 0.703 -0.112 0.145 0.257 pass
* No values reported in H’(0.07)

19
TABLE 7
ENERGY CATEGORY H40 X-RAY, (in ambient dose equivalent,with air-kerma, in italics)
H40 1 H40 2 H40 3 H40 4 H40 5 Bias S B+S
Performance(L1=0.5L2=0.35)
NIST Delivered
H*(10)(mSv)
0.29 4.86 1.16 3.80 1.29
Ka
(mGy)0.25 4.15 0.99 3.25 1.10
Participants Reported Results
A* (mSv)
0.45 7.2 1.7 5.6 1.8 0.47 0.056 0.529 fail
B*(mSv)
0.102 1.015 0.314 1.043 0.298 -0.73 0.055 0.787 fail
C*(mGy)
0.454 6.992 1.652 5.149 1.747 0.67 0.094 0.763 fail
D(mSv)
0.28 5.25 1.26 3.86 1.26 0.02 0.056 0.081 pass
E ** ** ** ** ** ** ** ** **
F(mSv)
0.296 4.889 1.272 4.056 1.379 0.05 0.037 0.089 pass
G(mSv)
0.238 3.67 0.867 2.77 0.927 -0.25 0.040 0.286 pass
QC(mSv)
0.32 4.84 1.32 4.27 1.38 0.09 0.057 0.143 pass
*Investigators subtracted control-dosimeter results.** No values reported in H*(10) or Ka..

20
TABLE 8
ENERGY CATEGORY H40 X-RAY (in directional dose equivalent)
H40 1 H40 2 H40 3 H40 4 H40 5 Bias S B+S
Performance(L1=0.5L2=0.35)
NIST Delivered
H'(0.07)(mSv)
0.32 5.23 1.25 4.10 1.39
Ka
(mGy)0.25 4.15 0.99 3.25 1.10
Participants Reported Results
A * * * * * * * * *
B * * * * * * * * *
C * * * * * * * * *
D (mSv) 0.30 5.67 1.36 4.17 1.36 0.025 0.061 0.087 pass
E(mSv)
0.81 14.47 3.74 12.44 9.49 2.644 1.800 4.445 fail
F(mSv)
0.319 5.265 1.370 4.368 1.486 0.051 0.040 0.091 pass
G(mSv)
0.256 3.96 0.934 2.99 1.00 -0.246 0.036 0.282 pass
*No values reported in H’(0.07).

21
TABLE 9
ENERGY CATEGORY H100 X-RAY (in ambient dose equivalent,with air-kerma, in italics)
H100 1 H100 2 H100 3 H100 4 H100 5 Bias S B+SPerformance
(L1=0.5L2+0.35)
NIST Delivered
H*(10)(mSv)
5.39 1.56 1.83 1.03 0.22
Ka
(mGy)3.15 0.91 1.07 0.60 0.13
Participants Reported Results
A*(mSv)
4.38 1.27 1.51 0.80 0.17 -0.202 0.028 0.231 pass
B*(mSv)
2.43 0.71 0.84 0.47 0.10 -0.545 0.004 0.549 fail
C* (mGy)
4.528 1.25 1.483 0.832 0.175 0.386 0.033 0.419 fail
D (mSv)
5.55 1.59 1.73 0.92 0.18 -0.059 0.092 0.151 pass
E(mSv)
5.319 1.536 1.936 1.099 0.234 0.031 0.041 0.072 pass
F(mSv)
5.807 1.671 1.937 1.100 0.232 0.065 0.014 0.079 pass
G(mSv)
4.67 1.22 1.58 0.857 0.214 -0.138 0.065 0.203 pass
QC (mSv)
5.13 1.51 1.7 0.99 0.22 -0.039 0.022 0.061 pass
*Investigators subtracted control-dosimeter results.

22
TABLE 10
ENERGY CATEGORY H100 X-RAY (in directional dose equivalent)
H100 1 H100 2 H100 3 H100 4 H100 5 Bias S B+S
Performance(L1=0.5
L2=0.35)
NIST Delivered
H'(0.07)(mSv)
5.01 1.45 1.70 0.95 0.21
Ka
(mGy)3.15 0.91 1.07 0.60 0.13
Participants Reported Results
A * * * * * * * * -
B * * * * * * * * -
C * * * * * * * * -
D (mSv)
4.99 1.43 1.56 0.82 0.16 -0.093 0.093 0.186 pass
E * * * * * * * *
F(mSv)
5.400 1.554 1.802 1.023 0.216 0.066 0.014 0.079 pass
G(mSv)
4.34 1.13 1.47 0.797 0.199 -0.138 0.066 0.204 pass
* No values reported in H’(0.07).

23
TABLE 11
ENVIRONMENTAL CHAMBER: BEGINNING 137Cs IRRADIATIONS (mSv)
Beg. 1(mSv)
Beg. 2(mSv)
Beg. 3(mSv)
Beg. 4(mSv)
Beg. 5(mSv)
Bias S B+SPerformance
(L1=0.5L2=0.35)
Delivered Dose (mSv)
DeliveredH*(10) 0.61 1.25 0.85 3.18 0.51
Participants Reported Values and Performance Test Results
A 0.73 1.3 0.98 3.1 0.59 0.105 0.095 0.201 pass
B 0.507 1.069 0.708 2.652 0.398 -0.173 0.025 0.198 pass
C 0.466 0.984 0.673 2.548 0.412 -0.209 0.017 0.226 pass
D 0.526 1.062 0.739 2.796 0.452 -0.130 0.016 0.146 pass
E 0.47 1.055 0.682 2.51 0.388 -0.206 0.030 0.236 pass
F 0.581 1.170 0.772 2.781 0.457 -0.086 0.032 0.118 pass
G 0.544 1.140 0.731 2.780 0.446 -0.117 0.021 0.138 pass
QC 0.61 1.28 0.87 3.24 0.52 0.018 0.007 0.025 pass
24
TABLE 12
ENVIRONMENTAL CHAMBER: MIDDLE 137Cs IRRADIATIONS (mSv)
Mid 1(mSv)
Mid 2(mSv)
Mid 3(mSv)
Mid 4(mSv)
Mid 5(mSv)
Bias S B+SPerformance
(L1=0.5L2=0.35)
Delivered Dose (mSv)
DeliveredH*(10) 1.80 4.52 0.56 1.13 0.98
Participants Reported Values and Performance Test Results
A 1.6 3.7 0.54 1.1 0.88 -0.093 0.061 0.155 pass
B 1.512 3.785 0.459 0.935 0.803 -0.173 0.011 0.184 pass
C 1.390 3.549 0.438 0.876 0.754 -0.225 0.006 0.231 pass
D 1.567 3.909 0.525 0.996 0.819 -0.124 0.034 0.158 pass
E 1.582 3.874 0.496 1.051 0.768 -0.135 0.053 0.188 pass
F 1.590 4.077 0.489 1.036 0.871 -0.109 0.020 0.129 pass
G 1.550 4.260 0.517 1.040 0.950 -0.079 0.040 0.119 pass
QC 1.83 4.57 0.57 1.16 1.00 0.016 0.007 0.023 pass

25
TABLE 13
ENVIRONMENTAL CHAMBER: END 137Cs IRRADIATIONS (mSv)
End 1(mSv)
End 2(mSv)
End 3(mSv)
End 4(mSv)
End 5(mSv)
Bias S B+SPerformance
(L1=0.5L2=0.35)
Delivered Dose (mSv)
DeliveredH*(10)
0.88 1.66 1.33 2.85 1.88
Participants Reported Values and Performance Test Results
A 0.87 1.5 1.3 2.6 1.8 -0.053 0.039 0.092 pass
B 0.763 1.465 1.132 2.512 1.705 -0.123 0.020 0.143 pass
C 0.715 1.357 1.098 2.404 1.547 -0.177 0.012 0.189 pass
D 0.800 1.455 1.160 2.496 1.680 -0.116 0.015 0.131 pass
E 0.845 1.528 1.269 2.950 1.894 -0.026 0.046 0.071 pass
F 0.803 * 1.295 2.695 1.794 -0.054 0.027 0.081 pass
G 0.863 1.500 1.250 2.770 1.720 -0.059 0.034 0.093 pass
QC 0.92 1.75 1.37 3.01 1.98 0.047 0.009 0.056 pass
*Dosimeter missing

27
Figure 3. Plot of bias and standard deviation for all participants and all categories. Points withinthe dashed triangle meet the tolerance level of 0.50 on the sum of the bias andstandard deviation. The additional limit of 0.35 in the bias and standard deviationcorresponds to the vertical and horizontal lines at the corners of the triangle. To pass,both criteria must be met. Two points that are off-scale are indicated with arrows.
0.00
0.05
0.10
0.15
0.20
0.25
0.30
0.35
0.40
0.45
0.50
-0.8 -0.7 -0.6 -0.5 -0.4 -0.3 -0.2 -0.1 0.0 0.1 0.2 0.3 0.4 0.5 0.6 0.7 0.8
Bias
Sta
nd
ard
Dev
iati
on
Photon Accident
Beta Accident
Photon Routine
Beta Routine
x-ray H40
x-ray H100
(0.34, 2.15)
(2.6, 1.8)
28
Figure 4. Plot of bias and standard deviation in Accident Photon category. Six out of sevenwere within the performance criteria (dashed lines).
Figure 5. Plot of bias and standard deviation for those reporting D(0.07) in the Accident Betacategory. Three out of five were within the performance criteria (dashed lines), andthe two other participants did not report the appropriate quantity.
Photon Accident [D(10)]
0.00
0.05
0.10
0.15
0.20
0.25
0.30
0.35
0.40
0.45
0.50
-0.50 -0.40 -0.30 -0.20 -0.10 0.00 0.10 0.20 0.30 0.40 0.50
Average Bias
Sta
nd
ard
Dev
iati
on
AB (off scale)CDEFGQC
Beta Accident [D(0.07)]
0.00
0.05
0.10
0.15
0.20
0.25
0.30
0.35
0.40
0.45
0.50
-0.60 -0.50 -0.40 -0.30 -0.20 -0.10 0.00 0.10 0.20 0.30 0.40 0.50 0.60
Average Bias
Sta
nd
ard
Dev
iati
on
CDE
FG

29
Figure 6. Plot of bias and standard deviation in the Routine Photon category. All seven werewithin the performance criteria (dashed lines).
Figure 7. Plot of bias and standard deviation for participants reporting H’(0.07) in theRoutine Beta category. Three were within the performance criteria (dashed lines),while the other four participants did not report the appropriate quantity.
Photon Routine [H*(10) and Ka]
0.00
0.05
0.10
0.15
0.20
0.25
0.30
0.35
0.40
0.45
0.50
-0.50 -0.40 -0.30 -0.20 -0.10 0.00 0.10 0.20 0.30 0.40 0.50
Average Bias
Sta
nd
ard
Dev
iati
on
A
B
C
D
E
F
G
QC
Beta Routine [H'(0.07)]
0.00
0.05
0.10
0.15
0.20
0.25
0.30
0.35
0.40
0.45
0.50
-0.60 -0.50 -0.40 -0.30 -0.20 -0.10 0.00 0.10 0.20 0.30 0.40 0.50 0.60
Average Bias
Sta
nd
ard
Dev
iati
on
D
F
G
30
Figure 8. Plot of bias and standard deviation for the Energy H40 x-ray category. Values weregiven in H*(10) unless otherwise noted. Three out of seven were within theperformance criteria (dashed lines).
Figure 9. Plot of bias and standard deviation in Energy H100 x-ray category. Values were givenin H*(10) unless other wise noted. Five out of seven were within the performance criteria(dashed lines).
Energy H40 [H*(10), H'(0.07), and Ka]
0.00
0.05
0.10
0.15
0.20
0.25
0.30
0.35
0.40
0.45
0.50
-0.80 -0.70 -0.60 -0.50 -0.40 -0.30 -0.20 -0.10 0.00 0.10 0.20 0.30 0.40 0.50 0.60 0.70 0.80Average Bias
Sta
nd
ard
Dev
iati
on
A
B
C (Ka)
D
F
G
QC
D' H'(0.07)
E' (H'(0.07) off scale
F' (H'(0.07))
G' (H'(0.07))
Energy H100 [H*(10), H'(0.07) and Ka]
0.00
0.05
0.10
0.15
0.20
0.25
0.30
0.35
0.40
0.45
0.50
-0.70 -0.60 -0.50 -0.40 -0.30 -0.20 -0.10 0.00 0.10 0.20 0.30 0.40 0.50 0.60 0.70
Average Bias
Sta
nd
ard
Dev
iati
on
A
BC (Ka)
D
E
F
G
QCD' H'(0.07)
F' (H'(0.07))
G' (H'0.07)

32
Figure 12. Plot of conditions in the environmental test chamber logged hourly on a PC. The measuredand set point temperature is plotted on the left axis and the relative humidity is on the rightaxis. Asterisks on the x-axis indicate when 137Cs irradiations were performed. Open circlesare values taken from circular chart paper since the log file was incomplete.
Environmental Chamber Parameters
-30
-20
-10
0
10
20
30
40
50
60
Days
Tem
per
atu
re (
oC
)
-20
0
20
40
60
80
100
Rel
ativ
e H
um
idit
y (%
)
T measured
T setpoint
R.H. measured
RH setpoint
* * *
PIC Record of Hourly Dose Rate at Environmental Chamber
0 . 0 0
1 0 . 0 0
2 0 . 0 0
3 0 . 0 0
4 0 . 0 0
5 0 . 0 0
6 0 . 0 0
7 0 . 0 0
8 0 . 0 0
2 9 - J a n 1 2 - F e b 2 6 - F e b 1 2 - M a r 2 6 - M a r 9 - A p r 2 3 - A p r 7 - M a y
Date
Ab
sorb
ed D
ose
in A
ir (
nG
y/h
)
Figure 13. Plot of absorbed dose rate in air measured by an EML pressurized ionizationchamber located near the environmental test chamber.

33
Figure 14. Plot of the bias and standard deviation for dosimeters irradiated before theenvironmental chamber test began. All participants were within the ANSIN13.29 performance criteria indicated with dashed lines.
Begining Irradiation
0.00
0.05
0.10
0.15
0.20
0.25
0.30
0.35
0.40
0.45
0.50
-0.50 -0.40 -0.30 -0.20 -0.10 0.00 0.10 0.20 0.30 0.40 0.50
Average Bias
Sta
nd
ard
Dev
iati
on
A
B
C
D
E
F
G
QC
34
Figure 15. Plot of the bias and standard deviation for dosimeters irradiated after 45 days ofenvironmental test conditions. All participants were within the ANSI N13.29performance criteria indicated with dashed lines.
Middle Irradiations
0.00
0.05
0.10
0.15
0.20
0.25
0.30
0.35
0.40
0.45
0.50
-0.50 -0.40 -0.30 -0.20 -0.10 0.00 0.10 0.20 0.30 0.40 0.50
Average Bias
Sta
nd
ard
Dev
iati
on
A
B
C
D
E
F
G
QC

35
Figure 16. Plot of the bias and standard deviation for dosimeters irradiated after 90days of environmental test conditions. All participants were within theANSI N13.29 performance criteria indicated with dashed lines.
End Irradiations
0.00
0.05
0.10
0.15
0.20
0.25
0.30
0.35
0.40
0.45
0.50
-0.50 -0.40 -0.30 -0.20 -0.10 0.00 0.10 0.20 0.30 0.40 0.50
Average Bias
Sta
nd
ard
Dev
iati
on
A
B
C
D
E
F
G
QC
36
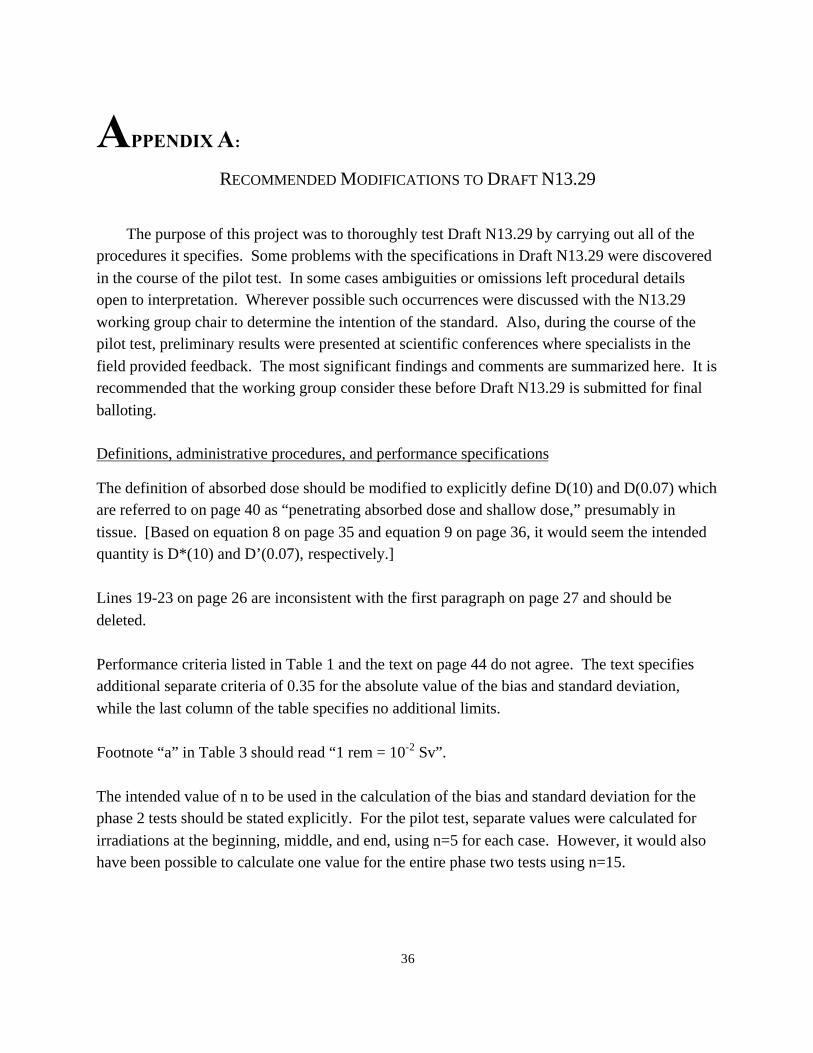
APPENDIX A:
RECOMMENDED MODIFICATIONS TO DRAFT N13.29
The purpose of this project was to thoroughly test Draft N13.29 by carrying out all of theprocedures it specifies. Some problems with the specifications in Draft N13.29 were discovered
in the course of the pilot test. In some cases ambiguities or omissions left procedural detailsopen to interpretation. Wherever possible such occurrences were discussed with the N13.29
working group chair to determine the intention of the standard. Also, during the course of thepilot test, preliminary results were presented at scientific conferences where specialists in the
field provided feedback. The most significant findings and comments are summarized here. It isrecommended that the working group consider these before Draft N13.29 is submitted for final
balloting.
Definitions, administrative procedures, and performance specifications
The definition of absorbed dose should be modified to explicitly define D(10) and D(0.07) whichare referred to on page 40 as “penetrating absorbed dose and shallow dose,” presumably in
tissue. [Based on equation 8 on page 35 and equation 9 on page 36, it would seem the intendedquantity is D*(10) and D’(0.07), respectively.]
Lines 19-23 on page 26 are inconsistent with the first paragraph on page 27 and should be
deleted.
Performance criteria listed in Table 1 and the text on page 44 do not agree. The text specifiesadditional separate criteria of 0.35 for the absolute value of the bias and standard deviation,
while the last column of the table specifies no additional limits.
Footnote “a” in Table 3 should read “1 rem = 10-2 Sv”.
The intended value of n to be used in the calculation of the bias and standard deviation for thephase 2 tests should be stated explicitly. For the pilot test, separate values were calculated for
irradiations at the beginning, middle, and end, using n=5 for each case. However, it would alsohave been possible to calculate one value for the entire phase two tests using n=15.
37
Draft N13.29 does not address what instructions are to be given to the test participants. Some
participants did not subtract control dosimeter results in the first phase of tests or had problemswith the dose equivalent quantities. For the energy x-ray categories the quantities H’(0.07) and
H*(10) are not equal but both are applicable; it is not clear if participants are required to reportboth or what the passing requirements are. A sample of the instructions and response forms
given to the pilot test participants is included in Appendix B. It is recommended that theworking group use these as a reference to clarify the intent of the standard.
Table 3 should include units (presumably Sv Gy-1).
Based on the results of the performance tests in all categories, the working group may wish to
reconsider the tolerance levels that are required. The pilot test results show that while there wasa greater spread in the bias, in all but one case the standard deviation was less than 15%.
Laboratory test protocol
Laboratory test protocol on page 30 states that for collimated beams the central beam axis shall
coincide with a line through the center of the face of the dosimeter. This does not allow for themost likely possibility of irradiating more than one dosimeter at a time, or for positioning an
assymetrical dosimeter off-center. It is also not clear how the testing laboratory could verify thatmutual interference between dosimeters is <2% since the geometry would be dependent on the
test dosimeters received.
Some dosimetry providers use additional packaging during field deployment for protection fromenvironmental insults and vandalism. Draft N13.29 does not specify if such environmental
packages should be used during laboratory tests. After consultation with the ANSI N13.29 chairthe environmental packages were included in the pilot test; the standard should be modified to
clarify the procedure.
On page 35, lines 17-19 state that 3 mm of PMMA is needed for charged particle equilibrium.However, it is not clear if the testing laboratory is to add 3 mm if the submitted dosimeters do
not have it or if this is to be taken as an instruction to the dosimetry provider being tested. Onpage 35, line 15, “the 137Cs source” should be replaced with “all photon sources,” and if it is
appropriate, “for the 137Cs source” could be inserted at the end of the sentence in line 19.
Environmental test protocol
On page 32 Draft N13.29 requires that at least two environmental monitoring instruments be
maintained at the environmental chamber to continuously measure and record a quantity from

38
which ambient dose rates may be determined. This represents a large commitment of resources
for data that is not used since the control dosimeters account for all background including anyunplanned doses. It is recommended that the working group consider deleting the following
lines from N13.29 or specify how this data is to be used:
Page 32, lines 12-14Page 32, lines 19-23
Page 33, lines 23-25Page 34, lines 4-6
Page 33 lines 9-13 call for an illumination of 3000 lux, to be provided by two 40-watt
fluorescence (cool white) bulbs placed 1 m above the dosimeters in the environmental chamberfor the entire 90-day cycle. Attempts to implement these lighting specifications showed they
were ambiguous and problematic. Light intensity is an important factor in environmentaldosimetry performance, as was demonstrated during the 11th International Intercomparison of
Environmental Dosimeters when one dosimeter failed the field test because of light leakage butwas able to pass the laboratory tests (Klemic et al. in press). It is recommended that the working
group re-evaluate its specifications for lighting parameters in consideration of the followingfindings:
• Illuminance measurements with a light meter revealed that two bare 40-watt cool white
fluorescent bulbs provide about 1300 lux at a distance of 1 m. A special fixture required foroperation in wet environments reduced the intensity further.
• Bulb manufacturers that were consulted warned that fluorescent bulbs might not operate at
low temperatures. Measurements showed that at -20oC the intensity drops by a factor of 2.7,and returns to full brightness at 0oC.
• Furthermore, an illumination of 3000 lux does not approximate outdoor conditions; at noonon a cloudy day the outdoor illuminance was found to be five times higher.
• Table 2 footnote “b” uses a different quantity for light intensity.
Draft N13.29 specifies a low humidity setting of 10% RH that proved difficult to achieve in
practice. The working group chair approved of using 20% RH for the pilot test, and it issuggested that the standard be modified to 20% RH.
39
The RH for the –20oC cycle is left unspecified without explanation. It may be worth noting in
the standard that the humidity control on an environmental chamber is shut off for the lowtemperature setting.
The first paragraph on page 34 should be rewritten to clarify if the doses delivered at the middle
and end of the environmental tests are the same or different from those used at the beginning.Different doses were used for the pilot test.
The pilot test only included the environmental chamber tests. The outdoor test was not
performed because of limited funding. Performing both tests in an actual accreditation testwould require a significant commitment of time and resources and would involve some
redundancy. It is recommended that the working group reconsider the goals of each test andaddress the needs for both types of test.
COMMENTS FROM OTHERS
The following comments were received from environmental dosimetry providers at conferences
and users meetings where preliminary results of the pilot test were presented.
The definition of “environment” given in ANSI Draft N13.29 is limiting and is inconsistent withthat used in federal regulations. That is, it should explicitly include indoor areas where the
public has access.
Beta irradiations are not appropriate for this standard since dose limits to the public are definedin terms of total effective dose equivalent (TEDE) which does not include a shallow dose.
Delivered doses should be extended to lower values to reflect realistic environmental levels.
A neutron category should be included because neutron sky-shine is the biggest contribution to
the boundary dose at accelerator facilities.
The word “radiological” should be removed from the definition of environment to be consistentwith 10CFR834.

40
To be consistent with ANSI N13.11, “all known sources of error” should exclude the error of
conversion factors (see page 40, line 20; page 41, line 13; page 42, lines 2 and 20; page 43, line15).
Acknowledgements: Thanks to the following specialists who were among those that provided
comments: J. Liu (Stanford Linear Accelerator), S. Walker (Los Alamos National Laboratory),M. Lantz (Arizona Power).

41
APPENDIX B
EXAMPLES OF INSTRUCTIONS AND RESPONSE FORMS
Instructions for reporting results
Please read out your dosimeters according to your usual procedures. The net results are to be
reported on the enclosed forms Table B1 and Table B2. With the exception of the AccidentCategory, the sources used for irradiation are not to be divulged to the participants until the test
results are reported. The sources and dosimeters used for the Accident Category are shown inTable 2.
If you prefer to submit your results electronically, please create an Excel file that exactly
corresponds to Tables B1 and B2, with a separate worksheet for each table. The Excel file maybe submitted by email or diskette, but please mail or fax a hard copy for verification. Results
should be reported to EML within 30 days of receipt of dosimeters.
Reporting quantities
ANSI N13.29 uses the quantities ambient dose equivalent, H*(10), and directional doseequivalent, H’(0.07) for all categories except the accident category. If possible, participants
should report their results in these quantities. However, it is recognized that some of theparticipants in this pilot study are not presently using dose equivalent quantities, and for
categories where the irradiation sources are not divulged, it will not be possible for thoseparticipants to convert to the dose equivalent quantities.
Therefore, participants should report their results for Tables 1 and 2 in the column corresponding
to the quantity that their dosimeters measure. Results may be reported in more than one columnwhere applicable.
(The accident category uses the quantity absorbed dose, D(10) and D(0.07). All participants
should be able to report this quantity using the conversion factors given in ANSI Draft N13.29sections 3.7.1, 3.7.2 and Table 3.)
Additional comments
Please include any comments you have on your experience in this test, or on the content orwording of the Draft Standard N13.29. If you have any questions feel free to contact Gladys
Klemic at (630) 252-2440 or (630) 252-2374 or [email protected].

42
Table B1. All Categories Except Accident Category
Participant A Lab IDNumber
H*(10)(mSv)
H=(0.07)(mSv)
Air Kerma(mGy)
275CONTROL
691CONTROL
542
568
354
235
390
593
316
500
552
619
241
351
393
736
215
505
387
533
374
626
389
583

43
Table B2. Accident Category
Participant A Lab ID
Number Source
D(10)
(mGy)
D(0.07)
(mGy)
Air kerma
(mGy)
406 137Cs
431 137Cs
292 137Cs
399 137Cs
318 137Cs
411 90Sr/90Y
405 90Sr/90Y
438 90Sr/90Y
458 90Sr/90Y
747 90Sr/90Y

44
Pilot Test ANSI Draft N13.29 -- Phase 2 -- Environmental Chamber Tests
Instructions for reporting results
Please read out your dosimeters according to your usual procedures. Please be sure to
subtract the controls from the other results. The net results are to be reported on the
enclosed form Table B3. If you prefer, results may be submitted electronically. Results
should be reported to as soon as possible, and within 30 days of receipt of dosimeters.
Please use the address or fax number below for reporting results.
Reporting Quantities
Since for this phase of the pilot test the source is 137Cs it should be possible for everyone
to report results in H*(10). (The results in air kerma may also be reported if desired.)
Additional Comments
Please include any comments you have on your experience in this test, or on the content
or wording of the Draft Standard N13.29. If you have any questions feel free to contact
Gladys Klemic at (630) 252-2440 or (630) 252-2374 or [email protected].
Send Results to:
Ms. Gladys Klemic
c/o U.S. Department of Energy
New Brunswick Laboratory
9800 South Cass Avenue, Bldg. 350
Argonne, IL 60439-4899
Fax: (630) 252- 6256

45
Table B3. Environmental Chamber Test Results
Participant A ID # H*(10) (mSv) Air Kerma (mGy)
691control
701control
316control
321control
708control
609
771
634
715
460
562
722
336
346
385
313
782
375
795
755
760
418