downloads.hindawi.comdownloads.hindawi.com/journals/specialissues/741625.pdf · editorial board...
TRANSCRIPT

Nonlinear Fibre-Based Photonic TechnologiesGuest Editors: Sonia Boscolo, Juan Diego Ania Castañón, Christophe Finot, and Miguel González Herráez
International Journal of Optics

Nonlinear Fibre-Based Photonic Technologies

International Journal of Optics
Nonlinear Fibre-Based Photonic Technologies
Guest Editors: Sonia Boscolo, Juan Diego Ania Castanon,Christophe Finot, and Miguel Gonzalez Herraez

Copyright © 2012 Hindawi Publishing Corporation. All rights reserved.
This is a special issue published in “International Journal of Optics.” All articles are open access articles distributed under the CreativeCommons Attribution License, which permits unrestricted use, distribution, and reproduction in any medium, provided the originalwork is properly cited.

Editorial Board
Alejandro Aceves, USAFortunato Tito Arecchi, ItalyVictor Arrizon, MexicoGaetano Assanto, ItalyJose Azana, CanadaOle Bang, DenmarkRandy A. Bartels, USAAugusto Belendez, SpainE. Bernabeu, SpainLe Nguyen Binh, GermanyKeith J. Blow, UKA. D. Boardman, UKWojtek J. Bock, CanadaNeil Broderick, UKHrvoje Buljan, CroatiaA. Cartaxo, PortugalGiulio Cerullo, ItalyK. S. Chiang, Hong KongW. C. H. Choy, Hong KongDavid Coutts, AustraliaIlaria Cristiani, ItalyMichael J. Damzen, UKVittorio Degiorgio, ItalyCornelia Denz, GermanyIvan Djordjevic, USANiloy K. Dutta, USARobert G. Elliman, Australia
Charles M. Falco, USAMahmoud Fallahi, USAPietro Ferraro, ItalyMario F. Ferreira, PortugalRashid A. Ganeev, UzbekistanHooshang Ghafouri-Shiraz, UKIvan Glesk, UKQihuang Gong, ChinaN. A. Halliwell, UKSang-Kook Han, Republic of KoreaSulaiman Wadi Harun, MalaysiaW. F. Hsieh, TaiwanMark Humphrey, AustraliaNicusor Iftimia, USAMohammed N. Islam, USAChennupati Jagadish, AustraliaWonho Jhe, KoreaMirosław A. Karpierz, PolandYu S. Kivshar, AustraliaWieslaw Krolikowski, AustraliaNayot Kurukitkoson, ThailandR. Leitgeb, SwitzerlandGong Ru Lin, TaiwanMichael E. Marhic, UKLorenzo Marrucci, ItalyJohn McInerney, IrelandAndrea Melloni, Italy
Adam Miranowicz, PolandRoberto Morandotti, CanadaUwe Morgner, GermanyDragomir Neshev, AustraliaJean-Michel Nunzi, CanadaTakashige Omatsu, JapanWolfgang Osten, GermanyBen Ovryn, USANicolae C. Panoiu, UKVittorio M. N. Passaro, ItalyGang-Ding Peng, AustraliaReji Philip, IndiaArmando Nolasco Pinto, PortugalAdrian Podoleanu, UKJianan Qu, Hong KongChenggen Quan, SingaporeMarek Samoc, PolandJohn T. Sheridan, IrelandPing Shum, SingaporeMohammad Taghizadeh, UKR. P. Tatam, UKMarkus E. Testorf, USAMustapha Tlidi, BelgiumStefano Trillo, ItalyStefan Wabnitz, ItalyBoris Y. Zeldovich, USA

Contents
Nonlinear Fibre-Based Photonic Technologies, Sonia Boscolo, Juan Diego Ania Castanon,Christophe Finot, and Miguel Gonzalez HerraezVolume 2012, Article ID 530648, 2 pages
Nonlinear Pulse Shaping in Fibres for Pulse Generation and Optical Processing, Sonia Boscolo andChristophe FinotVolume 2012, Article ID 159057, 14 pages
In-Fiber Subpicosecond Pulse Shaping for Nonlinear Optical Telecommunication Data Processing at 640Gbit/s, J. Azana, L. K. Oxenløwe, E. Palushani, R. Slavık, M. Galili, H. C. H. Mulvad, H. Hu, Y. Park,A. T. Clausen, and P. JeppesenVolume 2012, Article ID 895281, 16 pages
Bragg-Scattering Four-Wave Mixing in Nonlinear Fibers with Intracavity Frequency-Shifted LaserPumps, Katarzyna Krupa, Michela Bettenzana, Alessandro Tonello, Vincent Couderc, Philippe Di Bin,Stefan Wabnitz, and Alain BarthelemyVolume 2012, Article ID 263828, 7 pages
Multiple-Pulse Operation and Bound States of Solitons in Passive Mode-Locked Fiber Lasers,A. Komarov, F. Amrani, A. Dmitriev, K. Komarov, D. Meshcheriakov, and F. SanchezVolume 2012, Article ID 418469, 13 pages
The Proper Orthogonal Decomposition for Dimensionality Reduction in Mode-Locked Lasers andOptical Systems, Eli Shlizerman, Edwin Ding, Matthew O. Williams, and J. Nathan KutzVolume 2012, Article ID 831604, 18 pages
Nonlinear Optical Signal Processing for Tbit/s Ethernet Applications, L. K. Oxenløwe, M. Galili,H. C. Hansen Mulvad, H. Hu, J. L. Areal, E. Palushani, H. Ji, A. T. Clausen, and P. JeppesenVolume 2012, Article ID 573843, 14 pages
Amplification of Frequency-Modulated Similariton Pulses in Length-Inhomogeneous Active Fibers,I. O. Zolotovskii, D. I. Sementsov, A. A. Sysolyatin, A. S. Belanov, and M. S. YavtushenkoVolume 2012, Article ID 979632, 6 pages
Manipulating the Propagation of Solitons with Solid-Core Photonic Bandgap Fibers, O. Vanvincq,A. Kudlinski, A. Betourne, A. Mussot, Y. Quiquempois, and G. BouwmansVolume 2012, Article ID 157319, 12 pages

Hindawi Publishing CorporationInternational Journal of OpticsVolume 2012, Article ID 530648, 2 pagesdoi:10.1155/2012/530648
Editorial
Nonlinear Fibre-Based Photonic Technologies
Sonia Boscolo,1 Juan Diego Ania Castanon,2
Christophe Finot,3 and Miguel Gonzalez Herraez4
1 Institute of Photonic Technologies, School of Engineering and Applied Science, Aston University, Birmingham B4 7ET, UK2 Instituto de Optica, CSIC, Serrano 121, 28006 Madrid, Spain3 Laboratoire Interdisciplinaire Carnot de Bourgogne, Unite Mixte de Recherche CNRS 5209, 9 avenue Alain Savary,21078 Dijon, France
4 Departamento de Electronica, Universidad de Alcala de Henares, Alcala de Henares, 28871 Madrid, Spain
Correspondence should be addressed to Sonia Boscolo, [email protected]
Received 6 March 2012; Accepted 6 March 2012
Copyright © 2012 Sonia Boscolo et al. This is an open access article distributed under the Creative Commons Attribution License,which permits unrestricted use, distribution, and reproduction in any medium, provided the original work is properly cited.
The field of photonics is one of the fastest growing researchareas in modern science, having a direct and almost immedi-ate impact on the development of new technologies in fieldsranging from telecommunications to the biosciences. Pho-tonics, effectively an interdisciplinary field at the interface ofphysics, material science, and engineering, is very stronglylinked to the field of nonlinear science. Though nonlinearphysics has a rather long history, beginning with the worksof Newton and Huygens, science and technologies of the19th and most of the 20th century have been dominated bylinear mathematical models and linear physical phenomena.Over the last decades, there has been growing recognitionof physical systems in which nonlinearity introduces a richvariety of fundamentally new properties that can never beobserved in linear models or implemented in linear devices.
From a practical standpoint, nonlinearity adds to thedifficulty of understanding and predicting the system proper-ties. However, with suitable design and control, it is possibleto master and exploit nonlinear physical interactions andprocesses to yield tremendous benefits. The understandingand mastering of nonlinear optical systems has the potentialto enable a new generation of engineering concepts.
Although silica exhibits much lower optical nonlinearitythan crystals of such materials as lithium niobate or betabarium borate, silica fibres can provide a comparativelyenormous interaction length (more than 1 km) and tightconfinement (less than 2 μm2 mode area), which offers thelong-recognized possibility of using optical fibres for non-linear interactions. In high-speed optical communicationssuch nonlinear effects generally degrade the integrity of
the transmitted signal, but the same effects can be usedto realize a variety of optical functions that have practicalapplications in the field of light-wave technology. Nonlin-ear processes that have been exploited in demonstrationsand applications include stimulated Brillouin and Ramanscattering, as well as aspects of the Kerr effect variouslycalled self-phase modulation, cross-phase modulation, four-photon (four-wave) mixing, cross-polarization modulation,and parametric gain. Important examples of establishedand new emerging nonlinear fibre-based photonic technolo-gies essentially relying on nonlinear phenomena includeall-optical signal processing and regeneration in ultrafasttelecommunications, optical gating, switching and frequencyconversion, optical waveform generation and pulse shap-ing, optical parametric amplification, Raman amplifiersand lasers, high-power pulsed and continuous-wave lasers,broadband and supercontinuum (SC) light sources, andother applications. This is the area which is addressed in thisspecial issue: the development of novel photonic approaches,techniques, systems, and devices exploiting nonlinear effectsin optical fibres.
The use of nonlinear photonic technologies for managingsignals in the all-optical domain has enabled applications insuch diverse areas as optical telecommunications, metrology,optical sensing, microwave engineering, image processing,and optical computing, to name a few. Advantages ofprocessing the information in the all-optical domain includethe large available bandwidth and the parallelism intrinsicto the optical approach, which translate into high process-ing speeds. Although photonic technologies already play

2 International Journal of Optics
an important role in the context of high-speed communica-tions networks, their scope is, at present, largely restrictedto the transport layer rather than being used for complexrouting, processing and switching tasks which are performedin the electronic domain after an optical to electricalconversion which is costly and reduces system speed andlatency. Today, electronic techniques of signal manipulationare advanced compared to all-optical processing deviceswhich are still at the research stage rather than undercommercial development. Hence, considerable knowledgestill has to be accumulated, and new methodologies needto be explored before a true breakthrough can be achievedin this field, allowing the range of functions and operationscurrently accomplished electronically to be performed inthe optical domain. Furthermore, by using optical ratherthan electronic processing, additional functionality may bepossible.
Several textbooks exist that cover various aspects ofnonlinear fibre-based optical technology. There are alsoseveral tutorial and invited papers devoted to the topic.The purpose of this special issue is to provide a flavor ofthe state-of-the-art, recent developments and trends in thefield from both theoretical and experimental perspectives.The issue comprises eight papers submitted by distinguishedresearchers and their colleagues in their respective fields, whowere invited to contribute with an overview of the latestadvances in their own research area.
J. Azana et al. review recent work on the design andfabrication of all-fibre (long-period grating-based) devicesfor optical pulse shaping, particularly picosecond and subpi-cosecond flat-top pulse generation, and their application innonlinear optical telecommunication data processing, par-ticularly switching (demultiplexing) of optical time-divisionmultiplexed data signals in fibre-optic telecommunicationlinks operating at bit rates up to 640 Gbit/s. S. Boscolo et al.review recent theoretical and experimental progress on theuse of fibre nonlinearities for the generation and shaping ofoptical pulses and the applications of advanced pulse shapesin all-optical signal processing, with a focus on ultrahighrepetition rate pulse sources, parabolic and triangular pulsegeneration, coherent SC sources, and applications such asoptical regeneration, linear distortion compensation, signalpostprocessing in optical communication systems, opticalsignal doubling, and frequency conversion. I. O. Zolotovskiiet al. report theoretical predictions of the generation of stableself-similar frequency-modulated optical pulses in a length-inhomogeneous fibre gain medium, which enables subpi-cosecond pulse amplification up to the nanojoule energies.O. Vanvincq et al. review recent theoretical and experimentalwork on manipulating the Raman gain-induced solitonself-frequency shift dynamics in special solid-core photonicband-gap fibres and its impact on SC generation, withthe results showing efficient tailoring of the SC spectralextension as well as strong noise reduction at the SC long-wavelength edge. K. Krupa et al. discuss nonlinear frequencyconversion based on Bragg-scattering four-wave mixingin highly nonlinear fibre using a novel cost-effective andpartially coherent pumping scheme, with the experimen-tal results demonstrating efficient and tunable conversion
despite the large bandwidth and statistical independence ofthe pumps. E. Shlizerman et al. use the method of properorthogonal decomposition (POD) to demonstrate that low-dimensional models generated by a POD analysis provide agood framework for characterizing the underlying dynamicsand bifurcation behavior in mode-locked laser systems,and determining the optimal working regime for the laser(maximal suppression of the multipulsing instability). A.Komarov et al. present results of their research on multipulseoperation of passive mode-locked fibre lasers, addressing inparticular the formation of bound steady states of interactingsolitons in the presence of different nonlinear loss shapingmechanisms, the possibility of information coding in solitontrains with various bounds between neighboring pulses,and the formation of bound-enhancing powerful solitonwings as a result of dispersive wave emission due to lumpednonlinear losses. Finally, L. K. Oxenløwe et al. review recentexperimental advances in nonlinear optical signal processingfor Ethernet applications, with a focus on 1.28 Tb/s datageneration and demultiplexing.
Aknowledgments
We would like to thank all the authors for their invaluablecontributions and original ideas, the reviewers for providingthorough evaluations of the submitted papers, and theEditorial Staff of the International Journal of Optics forsuggesting that we organize this special issue and for theirwork in coordinating the editorial process. It has been ourpleasure putting this special issue together, and we hope thatyou enjoy reading it.
Sonia BoscoloJuan Diego Ania Castanon
Christophe FinotMiguel Gonzalez Herraez

Hindawi Publishing CorporationInternational Journal of OpticsVolume 2012, Article ID 159057, 14 pagesdoi:10.1155/2012/159057
Review Article
Nonlinear Pulse Shaping in Fibres for Pulse Generationand Optical Processing
Sonia Boscolo1 and Christophe Finot2
1 Photonics Research Group, School of Engineering and Applied Science, Aston University, Birmingham B4 7ET, UK2 Laboratoire Interdisciplinaire Carnot de Bourgogne, UMR 6303 CNRS, Universite de Bourgogne, 21078 Dijon, France
Correspondence should be addressed to Sonia Boscolo, [email protected]
Received 16 November 2011; Accepted 9 January 2012
Academic Editor: Juan Diego Ania Castanon
Copyright © 2012 S. Boscolo and C. Finot. This is an open access article distributed under the Creative Commons AttributionLicense, which permits unrestricted use, distribution, and reproduction in any medium, provided the original work is properlycited.
The development of new all-optical technologies for data processing and signal manipulation is a field of growing importance witha strong potential for numerous applications in diverse areas of modern science. Nonlinear phenomena occurring in optical fibreshave many attractive features and great, but not yet fully explored, potential in signal processing. Here, we review recent progresson the use of fibre nonlinearities for the generation and shaping of optical pulses and on the applications of advanced pulseshapes in all-optical signal processing. Amongst other topics, we will discuss ultrahigh repetition rate pulse sources, the generationof parabolic shaped pulses in active and passive fibres, the generation of pulses with triangular temporal profiles, and coherentsupercontinuum sources. The signal processing applications will span optical regeneration, linear distortion compensation, opticaldecision at the receiver in optical communication systems, spectral and temporal signal doubling, and frequency conversion.
1. Introduction
The use of photonic technologies for data processing in theall-optical domain has a strong potential for a variety ofinteresting applications in such diverse areas as optical tele-communications, metrology, optical sensing, microwaveengineering, advanced microscopy image processing, opticalcomputing, and many others. Advantages of processing theinformation in the all-optical domain include the largeavailable bandwidth and the (potential) parallelism intrinsicto the optical approach, which translate into high-processingspeeds. However, today electronic techniques of signal ma-nipulation are advanced compared to all-optical processingdevices, which are still at the research stage rather thanunder commercial development. A key feature of electronics,enabling many different applications, is the capability ofgenerating electrical waveforms with arbitrary temporalprofiles by use of simple integrated circuits. This capabilityis so far unmatched in the optical frequency range, wherebulky and complex devices are required to shape thelight fields. Hence, considerable knowledge still has to beaccumulated and new methodologies need to be explored
before a true breakthrough can be achieved in this field,allowing the range of functions and operations currentlyaccomplished electronically, to be performed in the opticaldomain. Furthermore, by using optical rather than electronicprocessing additional functionality may be possible.
In order to realize such all-optical processing, nonlinearphotonics is seen as a key technology. Optical fibre materialsexhibit a nonlinear response to strong electric fields, suchthose of optical signals confined within the small fibre core.In high-speed optical communications such nonlinear effectsgenerally degrade the integrity of the transmitted signal butthe same effects can be used to realize a variety of opticalfunctions that have practical applications in the field oflightwave technology. In this paper, we provide a snapshotof recent results and advances in the use of nonlinear effectsin optical fibres for optical waveform generation and pulseshaping and in the applications of advanced pulse profilesin all-optical signal processing. We would like to note thatthe main attention in this paper will be focused on resultsobtained in our groups, and that it is not our intention hereto comprehensively cover all the possible examples of fibre-based pulse shaping and signal processing.

2 International Journal of Optics
2. Fibre Nonlinearities
The third-order χ(3) optical nonlinearity in silica-basedsingle-mode (SM) fibres is one of the most important effectsthat can be used for all-optical signal processing. This hap-pens not only because the third-order nonlinearity providesultra-fast response times in the femtosecond range, but alsobecause it is responsible for a wide range of phenomena suchas third-harmonic generation, nonlinear refraction (Kerrnonlinearity), and stimulated Raman and Brillouin scatter-ing [1]. The rapid recent developments of microstructuredfibres with extremely small effective core areas and exhibitingenhanced nonlinear characteristics [2] and of fibres usingmaterials with refractive indexes higher than that of thesilica glass [3] have enabled dramatic reduction of therequired fibre lengths for nonlinear processing compared toconventional fibres. Such progress has paved the way for theintegration of fibre-based nonlinear processing functions onphotonic chips.
The intensity dependence of the refractive index of a fibregives rise to different effects depending on the shape of theinput signal; the most widely studied effects are self-phasemodulation (SPM) and cross-phase modulation (XPM).Considering the localized optical pulse evolution in a fibremedium and neglecting higher order effects in the fibre, pulsepropagation can be described by the nonlinear Schrodinger(NLS) equation [4]:
ψz = −i β2
2ψtt + iγ
∣∣ψ∣∣2ψ, (1)
where ψ(z, t) is the slowly varying pulse envelope in thecomoving system of coordinates, β2 and γ = 2πn2/(λAeff)are the respective group-velocity (second-order) dispersion(GVD) and Kerr nonlinearity coefficients of the fibre, n2
is the nonlinear-index coefficient, λ the central wavelengthof the pulse, and Aeff the effective core area. As a resultof the nonlinear term in (1), upon propagation in thefibre the pulse acquires an intensity-dependent nonlinearphase shift as φ(z, t) = γ|ψ(0, t)|2z, namely, the frequencychirp −φt. When the length scale associated with the pulsewhere the GVD effects take place: LD = T2
0 /|β2| (withT0 being some temporal characteristic value of the initialpulse) is much larger compared with both the fibre lengthand the nonlinear length LNL = 1/(γP0) (with P0 beingthe peak power of the initial pulse), the dispersive term in(1) can be neglected. In this case, the presence of a chirpcauses a nonlinear broadening of the pulse spectrum. Whentwo (or more) pulses copropagate inside a fibre, one stillobtains an NLS equation for each pulse but these equationsare coupled through XPM [4]. In this case, the nonlinearphase evolution for each pulse depends also on the powerof the other pulses according to the expression φi(z, t) =γi(|ψi(0, t)|2 + 2
∑j /= i |ψj(0, t)|2)z. XPM occurs only when
the pulses overlap. Similar to the SPM case, XPM leads toadditional nonlinear chirping and spectral shaping.
When the effects of chromatic dispersion are consideredin combination with the Kerr nonlinearity, rich pulsedynamics arise from the interplay between dispersive andnonlinear effects depending on the sign of the dispersion
and the relative magnitudes of the associated length scales.A well-known and fascinating example is the formation ofoptical solitons [5, 6] in the anomalous dispersion regime ofa fibre (β2 < 0) as a result of a cooperation between GVD andSPM. On the contrary, in the regime of normal dispersionpulse dynamics are highly affected by the phenomenon ofoptical wave breaking [7–9].
In the next Section we will discuss some newly emergedqualitative features of the optical pulse evolution in a fibreunder the combined action of dispersion and nonlinearity.
3. Optical Pulse Generation andShaping Using Fibre Nonlinearities
Techniques for generating, controlling, manipulating, andmeasuring ultrashort optical pulses and specialized wave-forms have become increasingly important in many sci-entific areas including, amongst others, ultrahigh-speedoptical communications [10], optical signal processing,and biophotonics. To date, conventional picosecond andfemtosecond pulse shaping in the optical domain have beenimplemented using devices, such as liquid crystal spatial lightmodulators [11, 12], wavelength-to-time mapping [13, 14],acoustooptic modulators, and electrooptical phase arrays,that impart user-specified spectral amplitude and phase tothe pulse. Though powerful and flexible, this approach hasthe drawback of requiring a rather bulky and expensiveapparatus, entailing a level of cost and complexity that isnot often commensurate to the used laser system and targetapplication. In order to fulfill telecommunication require-ments, more compact techniques for pulse shaping have beendeveloped, which include the use of super-structured fibreBragg gratings [15], long-period fibre grating filters [16],and arrayed waveguide gratings that are well suited for lineby line processing of high-repetition periodic pulse shapes[17, 18]. However, in all these pulse shapers using lineartechniques, the bandwidth of the input pulse determinesthe maximum bandwidth of the output. Indeed, a linearmanipulation cannot increase the pulse bandwidth, and soto create shorter pulses nonlinear effects must be used. Thislimitation of the linear approaches becomes very stringentwhen synthesizing advanced pulse shapes such as rectangularpulses, for which a large optical bandwidth is requiredto reproduce accurately the spectral side lobes linked tothe temporal compactness of the pulse. Moreover, in thoseapplications that require spectral narrowing, linear filteringintroduces a power penalty that is at least proportional to theratio of the target spectrum to the input one.
The combination of third-order nonlinear processes andchromatic dispersion in optical fibres can provide efficientnew solutions to overcome the aforementioned limitations.The pulse-shaping examples discussed below highlight someof the advantages offered by a passive, all-optical nonlinearfibre-based approach to pulse shaping.
3.1. Ultrahigh Repetition Rate Pulse Train Generation. Asa first illustration of the possible nonlinear pulse shapingmechanisms in optical fibres, we review here the generationof ultrashort pulse trains with very high repetition rates
International Journal of Optics 3
resulting from the passive evolution of optical pulses inan anomalously dispersive fibre in the presence of Kerrnonlinearity. As mentioned in the previous Section, in theanomalous GVD regime of a fibre, the NLS equation (1)admits families of soliton solutions. While fundamentalsolitons are characterized by an exact balance between theGVD and SPM effects (N = √
LD/LNL = 1), in the case ofhigher order solitons (N > 1) SPM dominates initially butGVD soon catches up and leads to pulse contraction. Thisstage of temporal compression can be used for generatingpulses with ultrashort durations [19–21]. However, thecompressed pulses exhibit a low-amplitude structure outsidethe central lobe. An alternative technique that preventssidelobe formation relies on the progressive evolution of thepeak power and temporal duration of a fundamental solitonin a distributed amplifier or a dispersion decreasing (DD)fibre [22, 23]. Step-like or comb-like [24] dispersion profiledstructures based on carefully chosen sets of fibres have beensuccessfully used to emulate continuous DD fibre profiles.
The generation of high repetition rate pulse sourceshas largely benefited from the nonlinear compression effecttaking place in the anomalous dispersion region, and severalworks have demonstrated the nonlinear reshaping of asinusoidal beat-signal into well-separated pulses, the pulserepetition rate being simply determined by the frequencyseparation between the two continuous-wave (CW) lasersources. This technique has been successfully demonstratedwith various experimental setups including DD fibres,adiabatic Raman compression in standard fibres, and step-like and comb-like dispersion profiled fibres. More recently,this nonlinear compression effect has been observed througha multiple four-wave mixing (FWM) process in a singleanomalously dispersive fibre, and repetition rates rangingfrom a few tens gigahertz to 1 terahertz have been achieved[25]. In the frequency domain, such nonlinear compressioncan be viewed as the result of a modulation instability [26]experienced by the initial beat signal during propagation inthe fibre, with the generation of new sidebands via FWM: twopump photons at ω1 and ω2 interact to generate two first-order sideband photons at ω1 −Ω and ω2 + Ω, Ω = ω2 − ω1
being the pump frequency detuning. High-order sidebandsare then generated due to multiple FWM interactions. Wenote that a powerful alternative technique for realizinghigh-repetition-rate short-pulse sources relies on harmonicpassive mode locking of fibre lasers [27–30]. The advantageof laser cavities as such compared to nonlinear pulse shapingin one-stage fibre systems is the possibility of achievinglower pulse train duty cycles. However, laser cavities havethe drawbacks that they require mode locking, they cannotbe referenced to an external clock directly and are not verysuitable for the generation of pulses with ultrahigh repetitionrates above a hundred gigahertz.
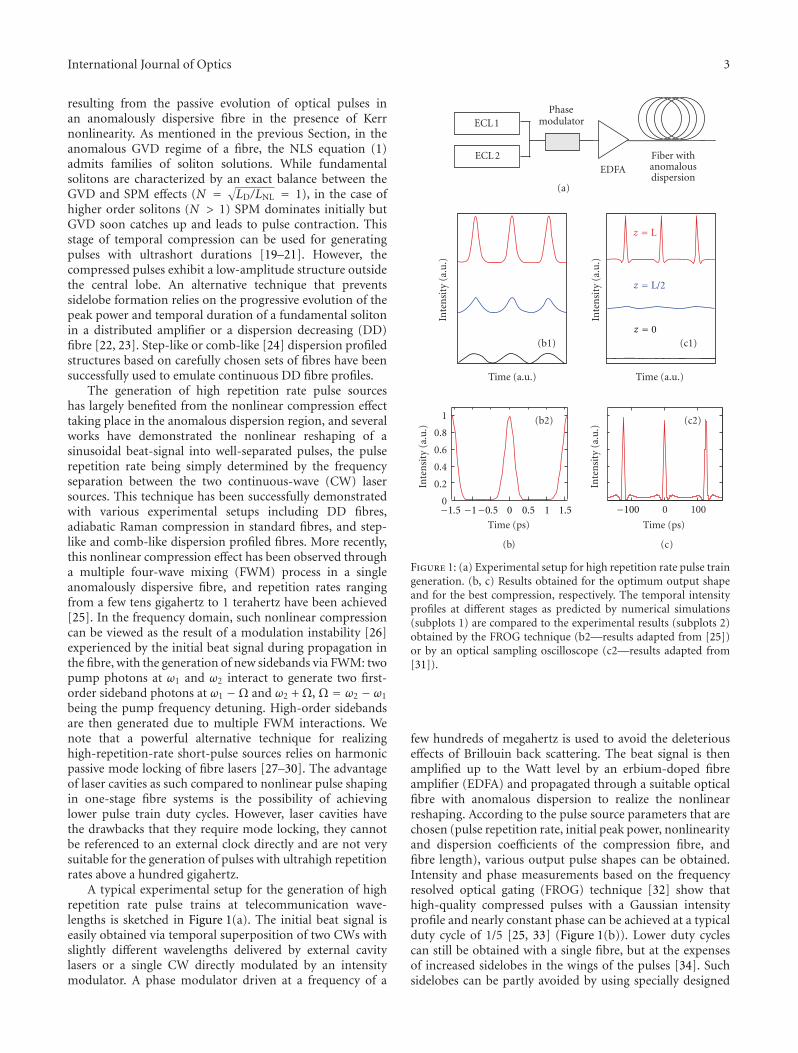
A typical experimental setup for the generation of highrepetition rate pulse trains at telecommunication wave-lengths is sketched in Figure 1(a). The initial beat signal iseasily obtained via temporal superposition of two CWs withslightly different wavelengths delivered by external cavitylasers or a single CW directly modulated by an intensitymodulator. A phase modulator driven at a frequency of a
0
0.2
0.4
0.6
0.8
1
0 100
(b2) (c2)In
ten
sity
(a.
u.)
Inte
nsi
ty (
a.u
.)
Inte
nsi
ty (
a.u
.)
Inte
nsi
ty (
a.u
.)
Time (a.u.)
Time (ps) Time (ps)
Time (a.u.)
(b1) (c1)
EDFAFiber withanomalousdispersion
ECL 1Phase
modulator
ECL 2
(a)
(b) (c)
z = L
z = L/2
z = 0
−1.5 −1 −100−0.5 0 0.5 1 1.5
Figure 1: (a) Experimental setup for high repetition rate pulse traingeneration. (b, c) Results obtained for the optimum output shapeand for the best compression, respectively. The temporal intensityprofiles at different stages as predicted by numerical simulations(subplots 1) are compared to the experimental results (subplots 2)obtained by the FROG technique (b2—results adapted from [25])or by an optical sampling oscilloscope (c2—results adapted from[31]).
few hundreds of megahertz is used to avoid the deleteriouseffects of Brillouin back scattering. The beat signal is thenamplified up to the Watt level by an erbium-doped fibreamplifier (EDFA) and propagated through a suitable opticalfibre with anomalous dispersion to realize the nonlinearreshaping. According to the pulse source parameters that arechosen (pulse repetition rate, initial peak power, nonlinearityand dispersion coefficients of the compression fibre, andfibre length), various output pulse shapes can be obtained.Intensity and phase measurements based on the frequencyresolved optical gating (FROG) technique [32] show thathigh-quality compressed pulses with a Gaussian intensityprofile and nearly constant phase can be achieved at a typicalduty cycle of 1/5 [25, 33] (Figure 1(b)). Lower duty cyclescan still be obtained with a single fibre, but at the expensesof increased sidelobes in the wings of the pulses [34]. Suchsidelobes can be partly avoided by using specially designed

4 International Journal of Optics
arrangements of segments of fibres [35–37] or other comb-like structures.
We would like to note that the reshaping of a sinusoidalbeat signal into ultrashort structures can be understood interms of the nonlinear dynamics of “Akhmediev breathers”[38, 39]. In this context, the extreme spatiotemporal localiza-tion that can be observed (see, e.g., Figure 1(c)) is explainedas a result of the formation of Peregrine solitons [31, 40],mathematical solutions of the standard NLS equation thathave been first derived in 1983 in the hydrodynamics context[41] but have never been demonstrated experimentallybefore 2010, and using experiments in optical fibres. Theseobservations offer a promising way to better understand theproblem of the occurrence of rogue waves in optics andhydrodynamics [42, 43].
3.2. Generation of Parabolic Pulses in Active and PassiveFibres. Strong pulse reshaping can also occur in the normalregime of dispersion of a fibre. An important examplethat has generated a great deal of attention in the lastdecade is the occurrence of self-similar dynamical effects inthe nonlinear propagation of ultrashort pulses in normallydispersive (ND) optical fibre amplifying media [44]. Resultshave demonstrated a fundamentally new operating regimewhere the interaction of Kerr nonlinearity, dispersion, andoptical gain is exploited to generate a particular class ofpulses with a parabolic intensity profile and a strictly linearfrequency chirp. These pulses then propagate in a self-similarmanner, holding certain relations (scaling) between pulsepower, duration, and chirp parameter. The results for theself-similar parabolic pulses are obtained by assuming thata fibre amplifier can be described by the NLS equation withgain
ψz = −i β2
2ψtt + iγ
∣∣ψ∣∣2ψ +
g
2ψ, (2)
where g is the distributed gain coefficient. Using a self-similar ansatz and standard amplitude/phase decomposition,one can find self-similar parabolic pulse solutions in thequasiclassical limit of (2) (β2|(|ψ|)tt|/(2γ|ψ|3) � 1), whosedynamic evolution is summarized as [45, 46]
∣∣ψ(z, t)∣∣ = a(z)
√1− t2/τ(z)2θ(τ(z)− |t|),
argψ(z, t) = b(z)t2 + φ0(z), a(z) = a0egz/3,
τ(z) = τ0egz/3, b(z) = − g
6β2,
(3)
in the case of constant gain. Here, θ(x) is the Heavisidefunction. The amplitude term indeed reveals a parabolicintensity profile, and the phase term a parabolic phasemodulation or linear chirp with chirp rate b/2. The peakamplitude and width of the pulse scale from their initialvalues, and the initial values depend only on the initialenergy and amplifier parameters. These solutions possessthe remarkable property of being a global attractor to thesystem for arbitrary initial conditions [47, 48]. By analogywith the well-known stable dynamics of solitary waves or
solitons, these self-similar parabolic pulses have come to beknown as “similaritons”. In contrast to solitons, similaritonscan tolerate strong nonlinearity without wave breaking. Thenormal GVD effectively linearizes the accumulated phase ofthe pulse allowing for the spectral bandwidth to increasewithout destabilizing the pulse [49]. The unique propertiesof similariton pulses have motivated many theoretical andexperimental studies (see, e.g., [46, 48, 50–53]).
Experimental demonstrations of similariton generationrelying on amplification from either rare-earth doping (withytterbium [45, 56–59] or erbium [51] dopants) or Ramanscattering [50, 54, 60] have been achieved, confirming thepotential of this method especially when dealing with thegeneration of high-power ultrashort pulses. Thanks to thehigh level of linearity of the chirp developed during parabolicamplification and as long as the impact of third-order fibredispersion is moderate [52, 61, 62], it is possible to efficientlycompensate for the chirp slope, so that compressed pulseswith very low substructures and temporal durations muchshorter than the initial seed pulse can be obtained [45, 51,56–59]. As an illustration, Figures 2(a) and 2(b) show thesetup and results of an experiment where similaritons aregenerated through Raman amplification at telecommunica-tion wavelengths [54]. Moreover, recent fibre lasers that useself-similar pulse shaping in the normal dispersion regimehave been demonstrated to achieve high-energy pulses [63–66].
In addition to fibre amplifiers and lasers, stable simi-lariton pulses can be generated in passive fibres provided asuitable longitudinal variation of the dispersion is introduced[55, 67–69] (Figure 2(c)). This approach is based on theobservation that a longitudinal decrease of the normaldispersion is formally equivalent to linear gain. Recently, asimple approach to the generation of parabolic pulses thatuses progressive nonlinear pulse reshaping in a ND fibre withfixed dispersion has been demonstrated [70]. However, incontrast with the asymptotic similariton solutions obtainedin fibre amplifiers, the generated parabolic waveforms repre-sent transient states of the nonlinear pulse evolution in thepassive fibre medium [71]. As such, they have a finite lifedistance that depends sensibly on the initial conditions (pulseshape, energy, and chirp profile). Nevertheless, stabilizationof the parabolic features is possible by use of a secondpropagation stage in a fibre with specially adjusted nonlinearand dispersive characteristics relative to the first fibre [70,71].
3.3. Generation of Triangular Pulses. Parabolic shapes arenot the only pulse waveforms that can be generated ina passive ND fibre. Recently, the combination of pulseprechirping and nonlinear propagation in a section ofND fibre has been introduced as a method for passivenonlinear pulse shaping, which provides a simple way ofgenerating various advanced field distributions, includingflat-top- and triangular-profiled pulses with a linear chirp[71]. In this scheme, Kerr nonlinearity and GVD lead tovarious reshaping processes of an initial conventional pulse(e.g., a Gaussian pulse) according to the chirping valueand power level at the entrance of the fibre. In particular,

International Journal of Optics 5
15 km fiber
Residualpump
Amplified
parabolic
pulses
ps fiber laserWDMcoupler
WDMcoupler
Signal
Raman fiber laserPump
with normal dispersion
0
5
10
Pow
er (
W)
0 100 2000.2
0
0.2
Ch
irp
(TH
z)
(b1)
(b2)
x5
(a)
(b) (c)
0
0.2
0.4
0.6
0.8
1
Inte
nsi
ty (
a.u
)
Output pulseParabolic fitInput pulse
−0.50
0.5
1 Ch
irp(T
Hz)
0 10 20
Time (ps)Time (ps)
λs = 1550 nm
λp = 1455 nm
−20−−
200 −10−100
Figure 2: (a) Experimental setup for parabolic pulse generation through Raman amplification at telecommunication wavelengths. (b)Results obtained in the Raman amplifier (adapted from [54]): temporal intensity profile (subplot b1) and chirp profile (subplot b2) ofthe output pulse from the amplifier. The experimental results (solid black lines) are compared to a parabolic and a linear fit (open blackcircles), respectively. The intensity profile of the initial pulse is also shown (solid blue line). (c) Results obtained in a ND decreasing fibre(adapted from [55]): experimental temporal intensity and chirp profiles at the fibre output (black circles) compared to a parabolic and alinear fit (solid black lines), respectively. The initial intensity profile is also shown (blue diamonds).
triangular pulses can be generated for a positive initial chirpparameter (using the definition ibt2 for the phase profile) andsufficiently high energies.
These theoretical results have been confirmed experi-mentally by intensity and phase measurements of the gen-erated pulses [72] (Figure 3(b)). In the experimental setupused (Figure 3(a)), the control of the pulse prechirping valuewas realized by propagation through different lengths ofstandard SM fibre with anomalous GVD, which imposed apositive chirp parameter on the pulse. The prechirped pulseswere amplified to different power levels using an EDFA andthen propagated through a ND fibre to realize the pulsereshaping.
Different nonlinear dynamics may lead to the generationof triangular pulses in a passive ND fibre. Indeed, it has beenrecently shown qualitatively and numerically that temporaltriangular intensity profiles can result from the progressivereshaping of initially parabolic pulses driven by the fourth-order dispersion (FOD) of the fibre [53]. The overalltemporal effect of FOD on parabolic pulse propagation is tostretch and enhance the power reduction in the pulse wings,
leading to a triangular profile. Furthermore, the possibilityof triangular pulse shaping in mode-locked ring-cavity fibrelasers has been first reported in [73]. It has been numericallydemonstrated that for normal net dispersion, formation oftwo distinct steady-state solutions of stable single pulses canbe obtained in a laser cavity in different regions of the systemparameter space: the previously known similariton [63] anda triangular-profiled pulse with a linear frequency chirp.
3.4. Coherent Continuums for Optical Telecommunications.One of the most well-known examples of pulse reshaping inthe spectral domain is in supercontinuum (SC) generation.SC generation in optical fibres, and more specifically, inphotonic crystal fibres with enhanced nonlinearity, is anestablished technique for producing broadband light sourcesin a wide range of research fields including metrology,biophotonics, and optical telecommunications [74, 75]. Intelecommunications, the broadened spectrum can be spec-trally sliced to generate wavelength multiplexed pulse trains[76–78]. The principle of operation of a multiwavelengthsource is illustrated in Figure 4(a). An initial high-power

6 International Journal of Optics
MLFL
PPG
MOD EDFA
Prechirping fiber ND fiber
10 GHz 1.25 GHz
(a)
0 200
0.2
0.4
0.6
0.8
1
Time (ps)
Tem
pora
l in
ten
sity
(a.
u.)
10
0
1
2
3
Ch
irp (TH
z)
1548 1550 15520
0.2
0.4
0.6
0.8
1
Wavelength (nm)
Spec
tral
inte
nsi
ty (
a.u
.)Numer.Exper.
Numer.Exper.
−10−20
−1
−2
−3
(b)
SHG Wavelength + 775.2 nm
Del
ay (
ps)
0 0.5 1
0
20
40
−20
−40
−1 −0.5
I (Ω,τ)1/2
(c)
Figure 3: (a) Experimental setup for triangular pulse generation. (b) Experimental and numerical temporal intensity and chirp (φt) profilesretrieved from second-harmonic generation (SHG) FROG (left) and optical spectra (right) of the generated pulses for an example length ofprechirping fibre. (c) SHG-FROG spectrogram of the pulse in (b). Results adapted from [72].
mode-locked picosecond or femtosecond pulse train with arepetition rate of several gigahertz is spectrally broadenedthrough SPM in a kilometer-long highly nonlinear (HNL)fibre. At the fibre output, the spectrum is sliced by adequatebandpass filters (BPFs) to obtain pulse trains that have thesame repetition rate as the initial train but new central fre-quencies.
Typically the broadest spectra are generated in anoma-lously dispersive fibres, where the broadening mechanismis strongly influenced by soliton dynamics [80]. However,solitonic effects and modulation instability lead to decreasedtemporal coherence and spectral flatness of the continuumgenerated in the anomalous dispersion regime [81]. Bycontrast, the nonlinear pulse evolution in ND fibres leads

International Journal of Optics 7
Wavelengthfilter
Highly nonlinear fiber with
normal dispersion
Nor
mal
ized
freq
uen
cy 12
9630
−3−6−9−12
129630
−3−6−9−12
A
(a)
Wavelength (nm)
Inte
nsi
ty (
a.u
)
1530 1540 1550 1560
1e−3
1e−4
1e−5
1e−6
1e−7
(b)
Figure 4: (a) Principle of operation of a multiwavelength picosecond source. (b) Experimental spectrum of a parabolic-shaped pulse afterpropagation in a ND-HNL fibre (black dashed line) and superposition of the measured spectra of 38 sliced channels. Results adapted from[79].
to flatter spectra and improved temporal coherence, but atthe expenses of relatively narrower spectra [82, 83]. Hencefrequency broadening using a ND fibre is an attractive choicewhenever a moderate amount of broadening alongside goodspectral and temporal stability of the output pulses aretargeted. However, the main limits to spectral pulse quality inthe normal dispersion regime are the spectral ripple arisingfrom SPM of conventional laser pulses, and the effects ofoptical wave breaking which may lead to significant changein the temporal pulse shape and severe energy transfer intothe wings of the spectrum. These effects can in principle beavoided by using preshaped input pulses with a parabolictemporal intensity profile, which would preserve their shapewhilst propagating within the fibre and, thus, result inspectrally flat, highly coherent pulses. Continuum with low-spectral ripple and high-energy density in the central partis indeed achievable through parabolic pulse propagationin ND-HNL fibre [79], and low-noise multiwavelengthpicosecond sources covering the whole C-band of opticaltelecommunications have been demonstrated based on thistechnique [12, 16, 79] (Figure 4(b)).
4. Applications of Parabolic and TriangularPulses in Signal Processing
Applications of parabolic pulses have not been limited toultrashort high-power pulse generation and highly coherentcontinuum sources, but several optical processing techniqueshave taken advantage of their specific features. These includeoptical regeneration [84, 85] including pulse retiming [86],prereceiver nonlinear processing in the optical domain [87,88], and mitigation of linear waveform distortions [89,90]. The simple intensity profile of triangular pulses isalso highly desired for a range of processing applications,including time domain add-drop multiplexing [91, 92],wavelength conversion [93–95], optical signal doubling [96],time-to-frequency mapping of multiplexed signals [97], and
enhanced spectral compression [98, 99]. In this Section, wewill review some of these applications.
4.1. 2R Regeneration. As a first example, here we discuss theusage of parabolic pulses in 2R (reamplification, retiming)signal regeneration in an extension of the technique pro-posed by Mamyshev [100]. The method relies on SPM ina nonlinear medium (fibre) and subsequent offset spectralfiltering to suppress the noise in the zero-bit slots and theamplitude fluctuations in the one-bit pulses of return-to-zero (RZ) optical data streams. In the schematic of theMamyshev regenerator depicted in Figure 5(a), the signal tobe regenerated is first amplified to the optimum power level,and an optical BPF is also used to reduce the amplified spon-taneous emission noise power. Then spectral broadening isachieved in a HNL fibre, and the broadened spectrum ispartially sliced by a second BPF, which is shifted with respectto the input signal frequency in order to transmit SPM-generated frequencies and reject the original spectrum. Thecentral frequency and output pulse shape of the regeneratedsignal are determined by the central frequency and spectralprofile of the offset filter, respectively. The SPM phase shiftexperienced in the HNL fibre depends on the instantaneouspower (cf. Section 2). Hence, a high-intensity pulse inducesmore SPM phase shift and spectrally broadens more than thelow-intensity noise [100]. Filtering the new SPM-generatedfrequencies with the offset filter leads to a power transferfunction for the pulses and the noise which is close to abinary one [101].
Spectral filtering of similariton pulses can improve theability of the Mamyshev regenerator to eliminate spuriousnoise pulses as well as to simultaneously reduce any fluctu-ations in the signal one-bit level [84]. This ability relies onthe specific features of self-similar amplification. Indeed, aspectrum broadened through self-similar amplification has asmooth profile (cf. Section 3.4), whereas a SPM-broadenedspectrum is generally accompanied by oscillatory structures

8 International Journal of Optics
EDFA HNLF
Signal to beregenerated
Regeneratedsignal
OBPF 2
0 f 0
OBPF 1
f0 1 0 0f= −
−
(a)
Autocorrelator
20 GHz laser source1550 nm
1450 nm
SMF BPF
50/50Coupler
Coupler
50/50Coupler
VA
WDMCouplerWDM
Similariton generator
EDFA
Delay line
Δτ = 25 ps
NZ-DSFβ2 > 0
Residualpump
Raman pump
(b)
Au
toco
rrel
atio
n t
race
(a.u
)
Time (ps)
Initial ghost energy (%)
Ou
put
ghos
t en
ergy
(%
)200 GHz
125 GHz
106 GHz
Initial
1
0.8
0.6
0.4
0.2
0−40 −20 0 20 40
100
80
60
40
20
0100806040200
(c)
Figure 5: (a) Schematic of an optical regenerator based on SPM and filtering (after [100]). (b) Experimental setup for 40 Gbit/s similariton-based regeneration. (c) Top, autocorrelation traces of the pulse train at the Raman amplifier input (circles) and output for different values ofthe filter offset (dashed, dotted, and solid curves). Bottom, output versus input proportion of the spurious noise pulse energy with respectto the ones energy for a fixed filter offset. Results adapted from [84].
covering the entire frequency range. Moreover, the spectrumand chirp obtained by SPM both depend on the detailsof the initial pulse (shape, chirp, and energy), leading tosome amplitude and time fluctuations of the regeneratedpulses. In contrast, the similariton-based spectral broad-ening and similariton-induced chirp depend only on theinitial pulse energy and/or amplifier parameters, respectively(cf. Section 3.2), so that both amplitude and timing jitter arereduced. In particular, the energy-dependent spectral broad-ening is responsible for efficient discrimination of high-energy pulses (ones) from low-energy pulses (zeros) withthe offset BPF. An implementation of the similariton-basedregeneration technique at 40 Gbit/s data rate where similari-ton pulses are generated through distributed Raman amplifi-cation in a ND fibre is illustrated in Figures 5(b) and 5(c). It is
worth noting here that a distributed amplification is helpfulin increasing the energy yield of the regenerator which is ahighly dissipative element [102].
4.2. Linear-Distortion Compensation. As a second exampleof the application of parabolic pulses in signal process-ing, we review here the realization of a time-domain all-optical Fourier transformation (OFT) technique. Time-domain OFT in which the spectral profile is convertedinto a waveform in the time domain makes it possible toeliminate the waveform distortion caused by linear pertur-bations in optical fibres, such as higher order dispersion,jitter and polarization-mode dispersion [103–106]. Time-domain OFT is realized ideally by applying a quadratictemporal phase modulation (time lens) to a distorted pulse:

International Journal of Optics 9
ψchirp(t) = ψ(t) exp(ibt2) and passing the linearly chirpedpulse through a dispersive medium such as a short pieceof fibre. When the accumulated dispersion of the mediumD = β2L equates the inverse of the chirp coefficient b(i.e., when the chirp is fully compensated), the outputwaveform is proportional to the spectral amplitude beforeOFT: χ(t) = √
i/(2πD) exp(−ibt2)ψ(t/D), where ψ(ω) is theFourier transform of ψ(t), and the frequency ω is convertedinto time t through the relationship ω = t/D. Since generallythe spectral envelope profile has no distortion even if itstime-domain waveform is distorted by linear perturbations,this frequency-to-time mapping indicates that a distortion-free pulse waveform can be obtained in the time domain afterOFT. In [103–106], this compensation technique was inves-tigated by using electrooptic phase modulators. But this waythe quadratic modulation region was restricted to around thecenter of the sinusoidal modulation imparted by the phasemodulator. Thus, any parts of the pulse extending beyondthe quadratic region could not be properly transformed,and only the section of the target pulse sitting within thequadratic region could be compensated (Figure 6).
The use of XPM with parabolic pulses as a time lenshas been recently proposed as a promising way to overcomethe aforementioned limitation [89, 90]. Indeed, the chirpinduced by XPM on the target pulse is proportional to thegradient of the intensity profile of the parabolic controlpulse: −φt = −2bt, b = ∓2γa2L/τ2, so it is exactly linear andthus ideal OFT can be achieved by complete chirp compen-sation. Here, a and τ are the respective peak amplitude andcharacteristic width of the parabolic pulse (cf. Section 3.2),and the sign ∓ is for either a standard “bright” or a darkparabolic pulse [17]. The parabolic XPM-based OFT tech-nique has been successfully experimentally demonstrated toachieve cancellation of the third-order dispersion-induceddistortion of short-optical pulses [89, 90].
4.3. Optical Decision at the Receiver. In this section, wereview a possible application of parabolic/flat-top pulsesto the improvement of the signal bit-error rate (BER) inan optical communication system by using optical decisionbefore the receiver. An attractive approach to the designof the optical receiver for high-speed fibre communicationsystems using RZ data formats is based on employing anadditional all-optical decision element (ODE) just before theconventional receiver [87, 107–109]. In this way, the firstdecision is carried out in the optical domain, thus improvingthe quality of the received signal. The attractive possibilityof improving the BER by using optical devices has beenstudied in some recent works [88, 110, 111]. The conceptualbasis of the BER improvement by optical devices comesfrom the information theory: an intrinsic BER improvementis possible whenever the decision performed by the devicein the optical domain is based on information that isdifferent from the information used by the decision circuitof the (suboptimal) receiver in the electrical domain. In [88]an application of this general concept was demonstrated,based on using an advanced optical receiver enhanced bya nonlinear ODE. The example of an ODE scheme usedin [88] exploits the nonlinear mechanism that leads to the
formation of parabolic pulses and the resultant flattening ofthe signal waveform (cf. Section 3.2). The method is basedon the nonlinear reshaping of a pulse towards a broad andflat temporal waveform that can occur upon propagation ina ND fibre [9] and subsequent slicing of the pulse temporalprofile by an optical temporal gate (e.g., an amplitudemodulator with a sharp nonlinear transfer function or anonlinear optical loop mirror provided with a clock) [85] orXPM-based techniques.
The basic mechanism that is responsible for BERimprovement in this scheme can be understood in thefollowing way. The pulse temporal broadening and flatteningin the ND fibre permits to recover the center of the bit slotfor those pulses that are significantly shifted from the bitslot center in the input pulse train because of timing jitter(Figure 7(a)). Such strongly time-shifted pulses, once theyare converted into electrical pulses and arrive at the decisionpoint, might be missed by the threshold detector in thoseconventional receivers that use a relatively small fraction ofthe bit period. In contrast, the bit slot recovery in the NDfibre enables such pulses to be recognized as marks in theODE-enhanced receiver. The slicing of the central portion ofthe broadened pulse temporal profile by the temporal gateenables efficient suppression of the timing jitter of the pulseswhich, in turn, improves the receiver sensitivity [87]. Thisapproach is illustrated in Figure 7(b), which shows that BERimprovement over the conventional scheme, indeed, can beachieved using nonlinear signal processing in the opticaldomain before the conventional receiver. It is worth notingthat the same processing technique based on temporal slicingof nonlinearly flattened pulse waveforms can also be used inall-optical 3R (2R + re-timing) signal regeneration [85].
4.4. Optical Signal Doubling and Frequency Conversion. Herewe discuss the use of triangular pulses in the contextof optical signal doubling and frequency conversion. Atechnique of copying optical pulses in both the frequency andtime domains based on a combination of either XPM with atriangular pump pulse or SPM of a triangular pulse in a non-linear Kerr medium and subsequent propagation in a dis-persive medium was introduced in [96] and experimentallydemonstrated in [95]. In this scheme, spectral doubling ofan optical signal is made possible by the XPM or SPM phaseshift generated by a temporal intensity profile with a lineargradient: φ(t) = φ0(1 − |t/τ|), φ0 ∝ a2γL (a and τ beingthe peak amplitude and characteristic width of a triangularpulse, resp.), which translates into a constant and distinct(opposite sign) frequency chirp induced onto the leading(downshifted) and trailing (upshifted) edges of the signalpulse. As a result of this constant and distinct chirp, undercertain conditions the pulse spectrum develops a structureconsisting of two equal peaks. The separation between thetwo spectral peaks increases with the maximum nonlinearphase shift φ0, while their form is almost preserved. Undersubsequent propagation of the modulated signal pulse in alinear dispersive medium, the produced spectral separationof the pulse components leads to their subsequent separationin time, thus allowing temporal replication of the pulse. Inthe case of normal dispersion, the pulse develops into a

10 International Journal of Optics
Dispersionmedium
Clock
PM
recovery
Bit-by-bit parabolicphase modulation
D β2L
Ψchirp (t)Ψ(t)
Ψ (ω) x (ω)
x (t)
Figure 6: Schematic diagram of time-domain OFT (after [90]).
0
1
0
1
Opt
ical
pow
er (
a.u
.)
0 31 2 4 7 8650
1
0 1 1 1 0 0 0 0
ODE
ODE
output
output
NDF
input
Time (TB)
(a)
0.2 0.4 0.6 0.8
Normalized voltage
Pro
babi
lity
den
sity
fun
ctio
n (
PD
F)
Conventional Rx
ODE-enhanced Rx
Spaces Marks
101
10−1
10−3
10−5
(b)
Figure 7: (a) Schematic illustration of the optical decision at an ODE-enhanced receiver. (b) Numerically calculated probability densityfunctions for the voltage of the marks and spaces in the conventional and ODE-enhanced receivers for a 40 Gbit/s RZ input signal with arandom jitter of the pulse temporal position. Results adapted from [88].
structure consisting of two identical pulses where the originalpulse splits down the middle. The two pulse parts separate intime while experiencing dispersive broadening. The relativevelocity of separation is proportional to the separationbetween the two peaks of the nonlinearly modulated pulsespectrum. Pulse splitting and separation occur also in thecase of anomalous dispersion after an initial stage of pulsecompression. Exact analytic expressions for the nonlinearlymodulated pulse spectrum and the pulse temporal intensitydistribution clearly show the features described above [96].Applying spectral filtering to the XPM/SPM modulatedsignal is also possible to realize efficient and clean frequencyconversion [93–95].
Figure 8 shows results of the experiment reported in[95]. Similarly to [72], triangular pulses were generated bypassive nonlinear reshaping in a ND fibre. Spectral pulsedoubling was realized through the SPM experienced by thetriangular pulses over their life distance in a HNL fibre. Theoutput SPM-shaped spectrum from the HNL fibre was sentinto either a linear standard SM fibre segment to realize
temporal pulse doubling or a wavelength demultiplexer filterfor frequency conversion processing.
5. Conclusion
We have provided an overview of several recent examplesof the use of nonlinear phenomena in optical fibres for thegeneration and shaping of optical pulses. We have discussedthe generation of ultrashort pulse trains with very high-repetition rates in the anomalous dispersion regime of afibre, the generation of parabolic-shaped pulses in active andpassive ND fibres, the generation of pulses with triangularintensity profiles in passive ND fibres, and the generationof coherent continuums for optical telecommunications inND fibres. Examples of new techniques or improvements inexisting techniques of all-optical nonlinear fibre-based signalprocessing enabled by specialized pulse waveforms have beenreviewed. Specifically, we have presented applications ofparabolic pulses in optical signal regeneration, compensationof linear waveform distortions, and signal postprocessing in

International Journal of Optics 11
1542 1552 1542 1552
Nor
mal
ized
inte
nsi
ty (
a.u
.)
0
0.2
0.4
0.6
0.8
1
Nor
mal
ized
inte
nsi
ty (
a.u
.)
0
0.2
0.4
0.6
0.8
1
Time (ps) Time (ps)
Wavelength (nm) Wavelength (nm)
0 50 0 50−50 −50
(a)
20 ps
Channel 34 Channel 42
0 200 400 600 800
0.2
0.4
0.6
0.8
1
HNLF input power (mW)
Freq
uen
cy s
paci
ng
(TH
z)
HNLF input power (dBm)
HNLF input power (dBm)
18 20 22 24 26 28
20 22 24 26 28Fr
equ
ency
(T
Hz)
Tim
e (p
s)
0
0.75
0.5
0.25
0
50
25
0
1
Nor
mal
ized
inte
nsi
ty
0
1
Nor
mal
ized
inte
nsi
ty
−50
−25
−0.25
−0.5
−0.75
(b)
Figure 8: (a) Temporal (top) and spectral (bottom) intensity profiles after the ND reshaping fibre (left) and after the HNL fibre (right). (b)Top, evolution of the output spectrum from the HNL fibre with the input power (left) and dependence of the frequency spacing between thetwo spectral peaks on the input power (right). Bottom, evolution of the temporal intensity profile at the output of the linear SM fibre withthe input power to the HNL fibre (left) and eye diagrams of a 10 Gbit/s pulse train obtained after spectral filtering for the ITU channels 34and 42. Results adapted from [95].
optical communication systems. Applications of triangularpulses in optical signal doubling and frequency conversionhave also been discussed.
Acknowledgments
The authors would like to acknowledge and thank ourcolleagues, namely, Prof. Sergei K. Turitsyn, Dr. Paul Harper,Dr. Anton I. Latkin, Prof. Keith J. Blow, Dr. Julien Fatome, Dr.Kamal Hammani, Dr. Bertrand Kibler, Prof. Guy Millot, andProf. John M. Dudley and the Optoelectronics Research Cen-ter (Southampton, UK). The authors also acknowledge sup-port from the British Council (Alliance Grant 10.002), theMinistere des Affaires Etrangeres et Europeennes (AllianceGrant 22836ZJ), the Agence Nationale de la Recherche, andthe Conseil Regional de Bourgogne (PARI Photcom).
References
[1] Y. R. Shen, Principles of Nonlinear Optics, John Wiley & Sons,New York, NY, USA, 1984.
[2] J. C. Knight, “Photonic crystal fibres,” Nature, vol. 424, no.6950, pp. 847–851, 2003.
[3] B. J. Eggleton, B. Luther-Davies, and K. Richardson, “Chalco-genide photonics,” Nature Photonics, vol. 5, no. 3, pp. 141–148, 2011.
[4] G. P. Agrawal, Nonlinear Fiber Optics, Academic Press, SanDiego, Calif, USA, 4th edition, 2006.
[5] A. Hasegawa and F. Tappert, “Transmission of stationarynonlinear optical pulses in dispersive dielectric fibers I.Anomalous dispersion,” Applied Physics Letters, vol. 23, no.3, pp. 142–144, 1973.
[6] L. F. Mollenauer and J. P. Gordon, Solitons in Optical Fibers:Fundamentals and Applications, Academic Press, San Diego,Calif, USA, 2006.
[7] W. J. Tomlinson, R. H. Stolen, and A. M. Johnson, “Opticalwave breaking of pulses in nonlinear optical fibers,” OpticsLetters, vol. 10, no. 9, pp. 457–459, 1985.
[8] D. Anderson, M. Desaix, M. Lisak, and M. L. Quiroga–Teixeiro, “Wave breaking in nonlinear-optical fibers,” Journalof the Optical Society of America B, vol. 9, no. 8, pp. 1358–1361, 1992.
[9] C. Finot, B. Kibler, L. Provost, and S. Wabnitz, “Beneficialimpact of wave-breaking for coherent continuum formationin normally dispersive nonlinear fibers,” Journal of the OpticalSociety of America B, vol. 25, no. 11, pp. 1938–1948, 2008.
[10] J. Azana, L. K. Oxenløwe, E. Palushani et al., “In-fiber sub-picosecond pulse shaping for nonlinear optical telecommu-nication data processing at 640 Gbit/s,” International Journalof Optics, vol. 2012, Article ID 895281, 16 pages, 2012.
[11] A. M. Weiner, “Femtosecond pulse shaping using spatial lightmodulators,” Review of Scientific Instruments, vol. 71, no. 5,pp. 1929–1960, 2000.

12 International Journal of Optics
[12] A. M. Clarke, D. G. Williams, M. A. F. Roelens, and B. J.Eggleton, “Reconfigurable optical pulse generator employinga Fourier-domain programmable optical processor,” Journalof Lightwave Technology, vol. 28, no. 1, pp. 97–103, 2010.
[13] D. Nguyen, M. U. Piracha, D. Mandridis, and P. J. Delfyett,“Dynamic parabolic pulse generation using temporal shap-ing of wavelength to time mapped pulses,” Optics Express, vol.19, no. 13, pp. 12305–12311, 2011.
[14] J. Ye, L. S. Yan, W. Pan et al., “Photonic generation oftriangular-shaped pulses based on frequency-to-time conver-sion,” Optics Letters, vol. 36, no. 8, pp. 1458–1460, 2011.
[15] P. Petropoulos, M. Ibsen, A. D. Ellis, and D. J. Richardson,“Rectangular pulse generation based on pulse reshapingusing a superstructured fiber Bragg grating,” Journal ofLightwave Technology, vol. 19, no. 5, pp. 746–752, 2001.
[16] D. Krcmarık, R. Slavık, Y. G. Park, and J. Azana, “Nonlinearpulse compression of picosecond parabolic-like pulses syn-thesized with a long period fiber grating filter,” Optics Express,vol. 17, no. 9, pp. 7074–7087, 2009.
[17] T. Hirooka, M. Nakazawa, and K. Okamoto, “Bright and dark40 GHz parabolic pulse generation using a picosecond opticalpulse train and an arrayed waveguide grating,” Optics Letters,vol. 33, no. 10, pp. 1102–1104, 2008.
[18] K. Kashiwagi, H. Ishizu, and T. Kurokawa, “Fiber transmis-sion characteristics of parabolic pulses generated by opticalpulse synthesizer,” Japanese Journal of Applied Physics, vol. 50,no. 9, Article ID 092501, 2011.
[19] B. Kibler, R. Fischer, P. A. Lacourt et al., “Optimised one-stepcompression of femtosecond fibre laser soliton pulses around1550 nm to below 30 fs in highly nonlinear fibre,” ElectronicsLetters, vol. 43, no. 17, pp. 915–916, 2007.
[20] A. A. Amorim, M. V. Tognetti, P. Oliveira et al., “Sub-two-cycle pulses by soliton self-compression in highly nonlinearphotonic crystal fibers,” Optics Letters, vol. 34, no. 24, pp.3851–3853, 2009.
[21] L. F. Mollenauer, R. H. Stolen, and J. P. Gordon, “Experimen-tal observation of picosecond pulse narrowing and solitonsin optical fibers,” Physical Review Letters, vol. 45, no. 13, pp.1095–1098, 1980.
[22] S. V. Chernikov and P. V. Mamyshev, “Femtosecond solitonpropagation in fibers with slowly decreasing dispersion,”Journal of the Optical Society of America B, vol. 8, no. 8, pp.1633–1641, 1991.
[23] S. V. Chernikov, D. J. Richardson, E. M. Dianov, and D. N.Payne, “Picosecond soliton pulse compressor based on dis-persion decreasing fibre,” Electronics Letters, vol. 28, no. 19,pp. 1842–1844, 1992.
[24] S. V. Chernikov, J. R. Taylor, and R. Kashyap, “Comblikedispersion-profiled fiber for soliton pulse train generation,”Optics Letters, vol. 19, no. 8, pp. 539–541, 1994.
[25] J. Fatome, S. Pitois, and G. Millot, “20-GHz-to-1-THz repe-tition rate pulse sources based on multiple four-wave mixingin optical fibers,” IEEE Journal of Quantum Electronics, vol.42, no. 10, Article ID 01703695, pp. 1038–1046, 2006.
[26] K. Tai, A. Hasegawa, and A. Tomita, “Observation of modula-tional instability in optical fibers,” Physical Review Letters,vol. 56, no. 2, pp. 135–138, 1986.
[27] B. Ortac, A. Hideur, G. Martel, and M. Brunel, “2-GHz pas-sive harmonically mode-locked Yb-doped double-clad fiberlaser,” Applied Physics B, vol. 81, no. 4, pp. 507–509, 2005.
[28] A. Komarov, H. Leblond, and F. Sanchez, “Passive harmonicmode-locking in a fiber laser with nonlinear polarizationrotation,” Optics Communications, vol. 267, no. 1, pp. 162–169, 2006.
[29] A. Komarov, A. Haboucha, and F. Sanchez, “Ultrahigh-re-petition-rate bound-soliton harmonic passive mode-lockedfiber lasers,” Optics Letters, vol. 33, no. 19, pp. 2254–2256,2008.
[30] J. Schroder, S. Coen, F. Vanholsbeeck, and T. Sylvestre, “Pas-sively mode-locked Raman fiber laser with 100 GHz repeti-tion rate,” Optics Letters, vol. 31, no. 23, pp. 3489–3491, 2006.
[31] K. Hammani, B. Kibler, C. Finot et al., “Peregrine solitongeneration and breakup in standard telecommunicationsfiber,” Optics Letters, vol. 36, no. 2, pp. 112–114, 2011.
[32] R. Trebino, Frequency-Resolved Optical Gating: The Measure-ment of Ultrashort Laser Pulses, Kluwer Academic, Norwell,Mass, USA, 2000.
[33] J. Fatome, S. Pitois, C. Fortier et al., “Multiple four-wavemixing in optical fibers: 1.5-3.4-THz femtosecond pulsesources and real-time monitoring of a 20-GHz picosecondsource,” Optics Communications, vol. 283, no. 11, pp. 2425–2429, 2010.
[34] S. Pitois, C. Finot, J. Fatome, B. Sinardet, and G. Millot,“Generation of 20-GHz picosecond pulse trains in the nor-mal and anomalous dispersion regimes of optical fibers,”Optics Communications, vol. 260, no. 1, pp. 301–306, 2006.
[35] C. Finot, J. Fatome, S. Pitois, and G. Millot, “All-fibered high-quality low duty-cycle 20-GHz and 40-GHz picosecond pulsesources,” IEEE Photonics Technology Letters, vol. 19, no. 21,pp. 1711–1713, 2007.
[36] C. Fortier, B. Kibler, J. Fatome, C. Finot, S. Pitois, andG. Millot, “All-fibered high-quality low duty-cycle 160-GHzfemtosecond pulse source,” Laser Physics Letters, vol. 5, no.11, pp. 817–820, 2008.
[37] I. E. Mansouri, J. Fatome, C. Finot, S. Pitois, and M. Lintz,“All-fibered high-quality stable 20- and 40-GHz picosecondpulse generators for 160-Gb/s OTDM applications,” IEEEPhotonics Technology Letters, vol. 23, no. 20, pp. 1487–1489,2011.
[38] N. Akhmediev and V. I. Korneev, “Modulation instability andperiodic solutions of the nonlinear Schrodinger equation,”Theoretical and Mathematical Physics, vol. 69, no. 2, pp.1089–1093, 1986.
[39] K. Hammani, B. Wetzel, B. Kibler et al., “Spectral dynamics ofmodulation instability described using Akhmediev breathertheory,” Optics Letters, vol. 36, no. 11, pp. 2140–2142, 2011.
[40] B. Kibler, J. Fatome, C. Finot et al., “The Peregrine solitonin nonlinear fibre optics,” Nature Physics, vol. 6, no. 10, pp.790–795, 2010.
[41] D. H. Peregrine, “Water waves, nonlinear Schrodinger equa-tions and their solutions,” The Journal of the AustralianMathematical Society B, vol. 25, no. 1, pp. 16–43, 1983.
[42] J. M. Dudley, C. Finot, G. Millot et al., “Extreme eventsin optics: challenges of the MANUREVA project,” EuropeanPhysical Journal, vol. 185, no. 1, pp. 125–133, 2010.
[43] D. R. Solli, C. Ropers, P. Koonath, and B. Jalali, “Opticalrogue waves,” Nature, vol. 450, no. 7172, pp. 1054–1057,2007.
[44] J. M. Dudley, C. Finot, G. Millot, and D. J. Richardson, “Self-similarity in ultrafast nonlinear optics,” Nature Physics, vol.3, no. 9, pp. 597–603, 2007.
[45] M. E. Fermann, V. I. Kruglov, B. C. Thomsen, J. M. Dudley,and J. D. Harvey, “Self-similar propagation and amplificationof parabolic pulses in optical fibers,” Physical Review Letters,vol. 84, no. 26, pp. 6010–6013, 2000.
[46] S. Boscolo, S. K. Turitsyn, V. Y. Novokshenov, and J. H.B. Nijhof, “Self-similar parabolic optical solitary waves,”

International Journal of Optics 13
Theoretical and Mathematical Physics, vol. 133, no. 3, pp.1647–1656, 2002.
[47] V. L. Kruglov and J. D. Harvey, “Asymptotically exactparabolic solutions of the generalized nonlinear Schrodingerequation with varying parameters,” Journal of the OpticalSociety of America B, vol. 23, no. 12, pp. 2541–2550, 2006.
[48] C. Finot and L. Wu, “Influence of the initial phase profileon the asymptotic self-similar parabolic dynamics,” Journalof Nonlinear Optical Physics and Materials, vol. 18, no. 4, pp.709–721, 2009.
[49] D. Anderson, M. Desaix, M. Karlsson, M. Lisak, and M. L.Quiroka-Teixeiro, “Wave-breaking-free pulses in nonlinear-optical fibers,” Journal of the Optical Society of America B, vol.10, no. 7, pp. 1185–1190, 1993.
[50] C. Finot, G. Millot, and J. M. Dudley, “Asymptotic charac-teristics of parabolic similariton pulses in optical fiber ampli-fiers,” Optics Letters, vol. 29, no. 21, pp. 2533–2535, 2004.
[51] C. Billet, J. M. Dudley, N. Joly, and J. C. Knight, “Intermediateasymptotic evolution and photonic bandgap fiber compres-sion of optical similaritons around 1550 nm,” Optics Express,vol. 13, no. 9, pp. 3236–3241, 2005.
[52] B. G. Bale and S. Boscolo, “Impact of third-order fibre dis-persion on the evolution of parabolic optical pulses,” Journalof Optics A, vol. 12, no. 1, Article ID 015202, 2010.
[53] B. G. Bale, S. Boscolo, K. Hammani, and C. Finot, “Effects offourth-order fiber dispersion on ultrashort parabolic opticalpulses in the normal dispersion regime,” Journal of the Opti-cal Society of America B, vol. 28, no. 9, pp. 2059–2065, 2011.
[54] K. Hammani, C. Finot, S. Pitois, J. Fatome, and G. Millot,“Real-time measurement of long parabolic optical similari-tons,” Electronics Letters, vol. 44, no. 21, pp. 1239–1240, 2008.
[55] C. Finot, B. Barviau, G. Millot, A. Guryanov, A. Sysoliatin,and S. Wabnitz, “Parabolic pulse generation with active orpassive dispersion decreasing optical fibers,” Optics Express,vol. 15, no. 24, pp. 15824–15835, 2007.
[56] J. P. Limpert, T. Schreiber, T. Clausnitzer et al., “High-powerfemtosecond Yb-doped fiber amplifier,” Optics Express, vol.10, no. 14, pp. 628–638, 2002.
[57] A. Malinowski, A. Piper, J. H. V. Price et al., “Ultrashort-pulseYb3+-fiber-based laser and amplifier system producing > 25-W average power,” Optics Letters, vol. 29, no. 17, pp. 2073–2075, 2004.
[58] P. Dupriez, C. Finot, A. Malinowski et al., “High-power, highrepetition rate picosecond and femtosecond sources based onYb-doped fiber amplification of VECSELs,” Optics Express,vol. 14, no. 21, pp. 9611–9616, 2006.
[59] D. N. Papadopoulos, Y. Zaouter, M. Hanna et al., “Generationof 63 fs 4.1 MW peak power pulses from a parabolic fiberamplifier operated beyond the gain bandwidth limit,” OpticsLetters, vol. 32, no. 17, pp. 2520–2522, 2007.
[60] C. Finot, G. Millot, S. Pitois, C. Billet, and J. M. Dudley,“Numerical and experimental study of parabolic pulses gen-erated via Raman amplification in standard optical fibers,”IEEE Journal on Selected Topics in Quantum Electronics, vol.10, no. 5, pp. 1211–1218, 2004.
[61] S. Zhang, C. Jin, Y. Meng, X. Wang, and H. Li, “Propagationof high-power parabolic pulses in cubicon fiber amplifiers,”Journal of the Optical Society of America B, vol. 27, no. 6, pp.1272–1278, 2010.
[62] Vladimir I. Kruglov, Claude Aguergaray, and John D. Harvey,“Propagation and breakup of pulses in fiber amplifiers anddispersion-decreasing fibers with third-order dispersion,”Physical Review A, vol. 84, no. 2, Article ID 023823, 14 pages,2011.
[63] F. O. Ilday, J. R. Buckley, W. G. Clark, and F. W. Wise, “Self-similar evolution of parabolic pulses in a laser,” Physical Re-view Letters, vol. 92, no. 21, Article ID 213902, 4 pages, 2004.
[64] F. W. Wise, A. Chong, and W. H. Renninger, “High-energyfemtosecond fiber lasers based on pulse propagation at nor-mal dispersion,” Laser and Photonics Reviews, vol. 2, no. 1-2,pp. 58–73, 2008.
[65] C. Aguergaray, D. Mechin, V. I. Kruglov, and J. D. Har-vey, “Experimental realization of a mode-locked parabolicRaman fiber oscillator,” Optics Express, vol. 18, no. 8, pp.8680–8687, 2010.
[66] B. Oktem, C. Ulgudur, and F. O. Ilday, “Soliton-similaritonfibre laser,” Nature Photonics, vol. 4, no. 5, pp. 307–311, 2010.
[67] T. Hirooka and M. Nakazawa, “Parabolic pulse generationby use of a dispersion-decreasing fiber with normal group-velocity dispersion,” Optics Letters, vol. 29, no. 5, pp. 498–500, 2004.
[68] B. Kibler, C. Billet, P. A. Lacourt, R. Ferriere, L. Larger, and J.M. Dudley, “Parabolic pulse generation in comb-like profileddispersion decreasing fibre,” Electronics Letters, vol. 42, no.17, pp. 965–966, 2006.
[69] A. Plocky, A. A. Sysoliatin, A. I. Latkin et al., “Experiments onthe generation of parabolic pulses in waveguides with length-varying normal chromatic dispersion,” JETP Letters, vol. 85,pp. 319–322, 2007.
[70] C. Finot, L. Provost, P. Petropoulos, and D. J. Richardson,“Parabolic pulse generation through passive nonlinear pulsereshaping in a normally dispersive two segment fiber device,”Optics Express, vol. 15, no. 3, pp. 852–864, 2007.
[71] S. Boscolo, A. I. Latkin, and S. K. Turitsyn, “Passive nonlinearpulse shaping in normally dispersive fiber systems,” IEEEJournal of Quantum Electronics, vol. 44, no. 12, pp. 1196–1203, 2008.
[72] H. Wang, A. I. Latkin, S. Boscolo, P. Harper, and S. K.Turitsyn, “Generation of triangular-shaped optical pulses innormally dispersive fibre,” Journal of Optics, vol. 12, no. 3,Article ID 035205, 2010.
[73] S. Boscolo and S. K. Turitsyn, “Pulse shaping in mode-locked ring-cavity fibre lasers,” in Proceedings of Lasers andElectro-Optics Europe and 12th European Quantum Elec-tronics Conference (CLEO EUROPE/EQEC ’11), Munich,German, May 2011, paper EH4.6.
[74] R. R. Alfano, The Supercontinuum Laser Source, Springer,New York, NY, USA, 2006.
[75] J. M. Dudley and J. R. Taylor, Supercontinuum Generation inOptical Fibers, Cambridge University Press, New York, NY,USA, 2010.
[76] L. Boivin and B. C. Collings, “Spectrum slicing of coherentsources in optical communications,” Optical Fiber Technol-ogy, vol. 7, no. 1, pp. 1–20, 2001.
[77] Y. Takushima and K. Kikuchi, “10-GHz, over 20-channelmultiwavelength pulse source by slicing super-continuumspectrum generated in normal-dispersion fiber,” IEEE Pho-tonics Technology Letters, vol. 11, no. 3, pp. 322–324, 1999.
[78] Z. Yusoff, P. Petropoulos, K. Furusawa, T. M. Monro, and D. J.Richardson, “A 36-Channel x 10-GHz spectrally sliced pulsesource based on supercontinuum generation in normallydispersive highly nonlinear holey fiber,” IEEE PhotonicsTechnology Letters, vol. 15, no. 12, pp. 1689–1691, 2003.
[79] F. Parmigiani, C. Finot, K. Mukasa et al., “Ultra-flat SPM-broadened spectra in a highly nonlinear fiber using parabolicpulses formed in a fiber Bragg grating,” Optics Express, vol.14, no. 17, pp. 7617–7622, 2006.

14 International Journal of Optics
[80] J. M. Dudley, G. Genty, and S. Coen, “Supercontinuum gen-eration in photonic crystal fiber,” Reviews of Modern Physics,vol. 78, no. 4, pp. 1135–1184, 2006.
[81] M. Nakazawa, K. Tamura, H. Kubota, and E. Yoshida, “Co-herence degradation in the process of supercontinuum gen-eration in an optical fiber,” Optical Fiber Technology, vol. 4,no. 2, pp. 215–223, 1998.
[82] A. M. Heidt, “Pulse preserving flat-top supercontinuumgeneration in all-normal dispersion photonic crystal fibers,”Journal of the Optical Society of America B, vol. 27, no. 3, pp.550–559, 2010.
[83] L. E. Hooper, P. J. Mosley, A. C. Muir, W. J. Wadsworth, andJ. C. Knight, “Coherent supercontinuum generation in pho-tonic crystal fiber with all-normal group velocity dispersion,”Optics Express, vol. 19, no. 6, pp. 4902–4907, 2011.
[84] C. Finot, S. Pitois, and G. Millot, “Regenerative 40 Gbit/swavelength converter based on similariton generation,” Op-tics Letters, vol. 30, no. 14, pp. 1776–1778, 2005.
[85] S. Boscolo and S. K. Turitsyn, “All-optical signal regenerationby temporal slicing of nonlinearly flattened optical wave-form,” IEEE Photonics Technology Letters, vol. 17, no. 6, pp.1235–1237, 2005.
[86] F. Parmigiani, P. Petropoulos, M. Ibsen, and D. J. Richardson,“Pulse retiming based on XPM using parabolic pulses formedin a fiber Bragg grating,” IEEE Photonics Technology Letters,vol. 18, no. 7, pp. 829–831, 2006.
[87] S. Boscolo, S. K. Turitsyn, and K. J. Blow, “Time domainall-optical signal processing at a RZ optical receiver,” OpticsExpress, vol. 13, no. 16, pp. 6217–6227, 2005.
[88] I. O. Nasieva, S. Boscolo, and S. K. Turitsyn, “Bit error rateimprovement by nonlinear optical decision element,” OpticsLetters, vol. 31, no. 9, pp. 1205–1207, 2006.
[89] T. T. Ng, F. Parmigiani, M. Ibsen, Z. Zhang, P. Petropoulos,and D. J. Richardson, “Compensation of linear distortionsby using XPM with parabolic pulses as a time lens,” IEEEPhotonics Technology Letters, vol. 20, no. 13, pp. 1097–1099,2008.
[90] T. Hirooka and M. Nakazawa, “All-optical 40-GHz time-domain Fourier transformation using XPM with a darkparabolic pulse,” IEEE Photonics Technology Letters, vol. 20,no. 22, pp. 1869–1871, 2008.
[91] J. Li, B. E. Olsson, M. Karlsson, and P. A. Andrekson, “OTDMadd-drop multiplexer based on XPM-induced wavelengthshifting in highly nonlinear fiber,” Journal of LightwaveTechnology, vol. 23, no. 9, pp. 2654–2661, 2005.
[92] F. Parmigiani, P. Petropoulos, M. Ibsen, P. J. Almeida, T. T.Ng, and D. J. Richardson, “Time domain add-drop multi-plexing scheme enhanced using a saw-tooth pulse shaper,”Optics Express, vol. 17, no. 10, pp. 8362–8369, 2009.
[93] F. Parmigiani, M. Ibsen, T. T. Ng, L. Provost, P. Petropoulos,and D. J. Richardson, “An efficient wavelength converterexploiting a grating-based saw-tooth pulse shaper,” IEEEPhotonics Technology Letters, vol. 20, no. 17, pp. 1461–1463,2008.
[94] F. Parmigiani, M. Ibsen, P. Petropoulos, and D. J. Richardson,“Efficient all-optical wavelength-conversion scheme based ona saw-tooth pulse shaper,” IEEE Photonics Technology Letters,vol. 21, no. 24, Article ID 5291729, pp. 1837–1839, 2009.
[95] N. Verscheure and C. Finot, “Pulse doubling and wavelengthconversion through triangular nonlinear pulse reshaping,”Electronics Letters, vol. 47, no. 21, pp. 1194–1196, 2011.
[96] A. I. Latkin, S. Boscolo, R. S. Bhamber, and S. K. Turitsyn,“Doubling of optical signals using triangular pulses,” Journalof the Optical Society of America B, vol. 26, no. 8, pp. 1492–1496, 2009.
[97] R. S. Bhamber, S. Boscolo, A. I. Latkin, and S. K. Turitsyn,“All-optical TDM to WDM signal conversion and partialregeneration using XPM with triangular pulses,” in Proceed-ings of the 34th European Conference on Optical Communi-cation (ECOC ’08), pp. 1–2, Brussels, Belgium, 2008, paperTh.1.B.2.
[98] E. R. Andresen, J. M. Dudley, D. Oron, C. Finot, and H.Rigneault, “Transform-limited spectral compression by self-phase modulation of amplitude-shaped pulses with negativechirp,” Optics Letters, vol. 36, no. 5, pp. 707–709, 2011.
[99] C. Finot, F. Parmigiani, P. Petropoulos, and D. J. Richardson,“Parabolic pulse evolution in normally dispersive fiberamplifiers preceding the similariton formation regime,”Optics Express, vol. 14, no. 8, pp. 3161–3170, 2006.
[100] P. V. Mamyshev, “All-optical data regeneration based on self-phase modulation effect,” in Proceedings of the 24th EuropeanConference on Optical Communication (ECOC ’98), pp. 475–476, Madrid, Spain, September 1998.
[101] L. Provost, C. Finot, P. Petropoulos, K. Mukasa, and D. J.Richardson, “Design scaling rules for 2R-optical self-phasemodulation-based regenerators,” Optics Express, vol. 15, no.8, pp. 5100–5113, 2007.
[102] C. Finot, J. Fatome, S. Pitois, G. Millot, and E. Pincemin,“Active Mamyshev regenerator,” Optical Review, vol. 18, no.3, pp. 257–263, 2011.
[103] M. Romagnoli, P. Franco, R. Corsini, A. Schiffini, and M.Midrio, “Time-domain Fourier optics for polarization-modedispersion compensation,” Optics Letters, vol. 24, no. 17, pp.1197–1199, 1999.
[104] L. A. Jiang, M. E. Grein, H. A. Haus, E. P. Ippen, and H.Yokoyama, “Timing jitter eater for optical pulse trains,” Opti-cs Letters, vol. 28, no. 2, pp. 78–80, 2003.
[105] M. Nakazawa and T. Hirooka, “Distortion-free optical trans-mission using time-domain optical Fourier transformationand transform-limited optical pulses,” Journal of the OpticalSociety of America B, vol. 22, no. 9, pp. 1842–1855, 2005.
[106] T. Hirooka and M. Nakazawa, “Optical adaptive equalizationof high-speed signals using time-domain optical Fouriertransformation,” Journal of Lightwave Technology, vol. 24, no.7, pp. 2530–2540, 2006.
[107] N. Yoshikane, I. Morita, T. Tsuritani, A. Agata, N. Edagawa,and S. Akiba, “Benefit of SPMbased all-optical reshaper forlong-haul DWDM transmission systems,” Journal of SelectedTopics in Quantum Electronics, vol. 10, pp. 412–420, 2004.
[108] M. Matsuura, N. Kishi, and T. Miki, “Performance improve-ment of optical RZ-receiver by utilizing an all-optical wave-form converter,” Optics Express, vol. 13, no. 13, pp. 5074–5079, 2005.
[109] P. Ghelfi, M. Secondini, M. Scaffardi, F. Fresi, A. Bogoni,and L. Poti, “Impact of an additional all-optical decisionelement in band-limited receivers for RZ systems,” Journal ofLightwave Technology, vol. 25, no. 7, pp. 1728–1734, 2007.
[110] M. Rochette, J. N. Kutz, J. L. Blows, D. Moss, J. T. Mok, andB. J. Eggleton, “Bit-error-ratio improvement with 2R opticalregenerators,” IEEE Photonics Technology Letters, vol. 17, no.4, pp. 908–910, 2005.
[111] M. Rochette, J. L. Blows, and B. J. Eggleton, “3R optical re-generation: an all-optical solution with BER improvement,”Optics Express, vol. 14, no. 14, pp. 6414–6427, 2006.
Hindawi Publishing CorporationInternational Journal of OpticsVolume 2012, Article ID 895281, 16 pagesdoi:10.1155/2012/895281
Review Article
In-Fiber Subpicosecond Pulse Shaping for Nonlinear OpticalTelecommunication Data Processing at 640 Gbit/s
J. Azana,1 L. K. Oxenløwe,2 E. Palushani,2 R. Slavık,3, 4 M. Galili,2 H. C. H. Mulvad,2 H. Hu,2
Y. Park,1, 5 A. T. Clausen,2 and P. Jeppesen2
1 Centre Energie, Materiaux et Telecommunications, Institut National de la Recherche Scientifique (INRS),Montreal, QC, Canada H5A 1K6
2 DTU Fotonik, Technical University of Denmark, Ørsteds Square 343, 2800 Lyngby, Denmark3 ORC, University of Southampton, Southampton SO17 1BJ, UK4 Institute of Photonic Engineering, Academy of Sciences of the Czech Republic, 18251 Prague, Czech Republic5 Automated Precision Inc., 15000 Johns Hopkins Drire, Rockville, MD 20850, USA
Correspondence should be addressed to L. K. Oxenløwe, [email protected]
Received 16 June 2011; Accepted 26 September 2011
Academic Editor: Miguel Gonzalez Herraez
Copyright © 2012 J. Azana et al. This is an open access article distributed under the Creative Commons Attribution License, whichpermits unrestricted use, distribution, and reproduction in any medium, provided the original work is properly cited.
We review recent work on all-fiber (long-period fiber grating) devices for optical pulse shaping, particularly flat-top pulsegeneration, down to the subpicosecond range and their application for nonlinear switching (demultiplexing) of optical time-division multiplexed (OTDM) data signals in fiber-optic telecommunication links operating up to 640 Gbit/s. Experiments arepresented demonstrating error-free 640-to-10 Gbit/s demultiplexing of the 64 tributary channels using the generated flat-toppulses for temporal gating in a Kerr-effect-based nonlinear optical loop mirror. The use of flat-top pulses has critical benefitsin the demultiplexing process, including a significantly increased timing-jitter tolerance (up to ∼500 fs, i.e., 30% of the bit period)and the associated improvement in the bit-error-rate performance (e.g., with a sensitivity increase of up to ∼13 dB as comparedwith the use of Gaussian-like gating pulses). Long-period fiber grating pulse shapers with reduced polarization dependence arefabricated and successfully used for polarization-independent 640-to-10 Gbit/s demultiplexing experiments.
1. Introduction
Techniques for the precise synthesis and control of the tem-poral shape of optical pulses with durations in the picosec-ond and subpicosecond regimes [1] are of fundamental im-portance for a wide range of applications in ultrahigh-bit-rate optical communications, particularly to enhance theperformance of a range of nonlinear optics-based data-pro-cessing operations [1–10]. As a very relevant example,(sub)picosecond flat-top (rectangular-like) optical pulses arehighly desired in applications requiring the use of a well-defined temporal gating window, for example, for nonlineartime-domain switching of optical telecommunication data.The use of flat-top optical pulses as control/gating pulses innonlinear time-domain optical switches translates into im-portant advantages as compared with the (more conven-tional) use of Gaussian-like optical control pulses. Figure 1
illustrates the concept of nonlinear optical switching for tem-poral demultiplexing of serial optical time-division multi-plexed (OTDM) data. For optimum performance, the gatingpulse has to be shorter than the one-bit time window and atthe same time it should have constant intensity over a timeinterval as long as possible. Both of these requirements canbe fulfilled when using flat-top pulses. Indeed, as illustratedin Figure 1, flat-top optical control pulses increase the toler-ance to timing jitter in the system, thus improving the over-all performance of the nonlinear switching scheme, for ex-ample, leading to a significantly improved receiver sensitivity(needed input signal power to achieve a bit error rate, BER <10−9) [2–6].
Flat-top optical pulse waveforms can be generated fromGaussian-like optical pulses (easily generated from mode-locked laser systems) using many different pulse-shapingtechniques [1–7, 11–15]. From a practical viewpoint, the
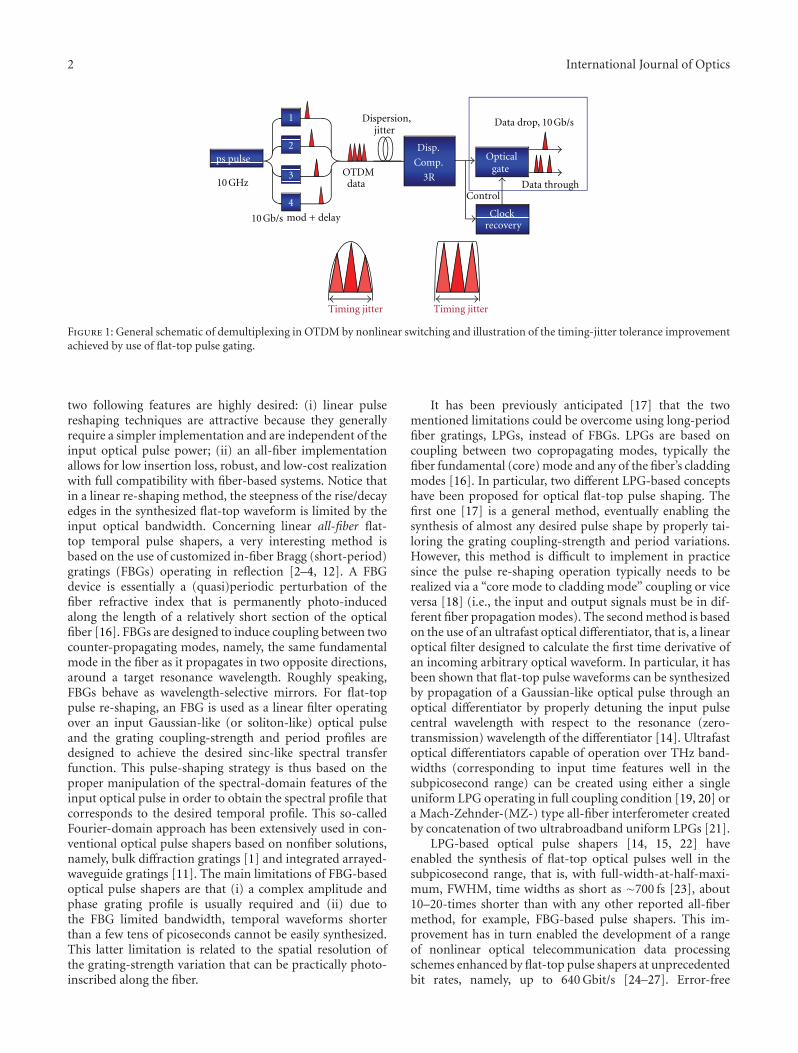
2 International Journal of Optics
OTDM data Data through
Control
mod + delay
Disp.
Comp.
3R
ps pulse
1
2
3
4Clock
recovery
Optical gate
Dispersion, jitter
Timing jitter Timing jitter
Data drop, 10 Gb/s
10 Gb/s
10 GHz
Figure 1: General schematic of demultiplexing in OTDM by nonlinear switching and illustration of the timing-jitter tolerance improvementachieved by use of flat-top pulse gating.
two following features are highly desired: (i) linear pulsereshaping techniques are attractive because they generallyrequire a simpler implementation and are independent of theinput optical pulse power; (ii) an all-fiber implementationallows for low insertion loss, robust, and low-cost realizationwith full compatibility with fiber-based systems. Notice thatin a linear re-shaping method, the steepness of the rise/decayedges in the synthesized flat-top waveform is limited by theinput optical bandwidth. Concerning linear all-fiber flat-top temporal pulse shapers, a very interesting method isbased on the use of customized in-fiber Bragg (short-period)gratings (FBGs) operating in reflection [2–4, 12]. A FBGdevice is essentially a (quasi)periodic perturbation of thefiber refractive index that is permanently photo-inducedalong the length of a relatively short section of the opticalfiber [16]. FBGs are designed to induce coupling between twocounter-propagating modes, namely, the same fundamentalmode in the fiber as it propagates in two opposite directions,around a target resonance wavelength. Roughly speaking,FBGs behave as wavelength-selective mirrors. For flat-toppulse re-shaping, an FBG is used as a linear filter operatingover an input Gaussian-like (or soliton-like) optical pulseand the grating coupling-strength and period profiles aredesigned to achieve the desired sinc-like spectral transferfunction. This pulse-shaping strategy is thus based on theproper manipulation of the spectral-domain features of theinput optical pulse in order to obtain the spectral profile thatcorresponds to the desired temporal profile. This so-calledFourier-domain approach has been extensively used in con-ventional optical pulse shapers based on nonfiber solutions,namely, bulk diffraction gratings [1] and integrated arrayed-waveguide gratings [11]. The main limitations of FBG-basedoptical pulse shapers are that (i) a complex amplitude andphase grating profile is usually required and (ii) due tothe FBG limited bandwidth, temporal waveforms shorterthan a few tens of picoseconds cannot be easily synthesized.This latter limitation is related to the spatial resolution ofthe grating-strength variation that can be practically photo-inscribed along the fiber.
It has been previously anticipated [17] that the twomentioned limitations could be overcome using long-periodfiber gratings, LPGs, instead of FBGs. LPGs are based oncoupling between two copropagating modes, typically thefiber fundamental (core) mode and any of the fiber’s claddingmodes [16]. In particular, two different LPG-based conceptshave been proposed for optical flat-top pulse shaping. Thefirst one [17] is a general method, eventually enabling thesynthesis of almost any desired pulse shape by properly tai-loring the grating coupling-strength and period variations.However, this method is difficult to implement in practicesince the pulse re-shaping operation typically needs to berealized via a “core mode to cladding mode” coupling or viceversa [18] (i.e., the input and output signals must be in dif-ferent fiber propagation modes). The second method is basedon the use of an ultrafast optical differentiator, that is, a linearoptical filter designed to calculate the first time derivative ofan incoming arbitrary optical waveform. In particular, it hasbeen shown that flat-top pulse waveforms can be synthesizedby propagation of a Gaussian-like optical pulse through anoptical differentiator by properly detuning the input pulsecentral wavelength with respect to the resonance (zero-transmission) wavelength of the differentiator [14]. Ultrafastoptical differentiators capable of operation over THz band-widths (corresponding to input time features well in thesubpicosecond range) can be created using either a singleuniform LPG operating in full coupling condition [19, 20] ora Mach-Zehnder-(MZ-) type all-fiber interferometer createdby concatenation of two ultrabroadband uniform LPGs [21].
LPG-based optical pulse shapers [14, 15, 22] haveenabled the synthesis of flat-top optical pulses well in thesubpicosecond range, that is, with full-width-at-half-maxi-mum, FWHM, time widths as short as ∼700 fs [23], about10–20-times shorter than with any other reported all-fibermethod, for example, FBG-based pulse shapers. This im-provement has in turn enabled the development of a rangeof nonlinear optical telecommunication data processingschemes enhanced by flat-top pulse shapers at unprecedentedbit rates, namely, up to 640 Gbit/s [24–27]. Error-free

International Journal of Optics 3
demultiplexing of OTDM signals with significantly improvedtiming-jitter tolerances has been demonstrated using LPG-based pulse shapers. This represents a critical advance inthe field because for high-speed serial data transmission thatoperates at rates of 160 Gbit/s and above, management ofthe timing jitter becomes extremely important while beingincreasingly challenging [28–33]. In addition, the LPG pulseshapers can be fabricated to exhibit very low polarizationsensitivity [23, 26, 27]; this latter feature can be exploitedto create polarization-independent OTDM demultiplexingsystems [27].
This work reviews recent progress on the design and fab-rication of all-fiber (LPG-based) picosecond and subpicosec-ond flat-top optical pulse shapers [14, 15, 17–22] and theirapplication to nonlinear optical telecommunication dataprocessing [23–27], particularly demultiplexing of OTDMserial data using nonlinear optical loop mirror switches withflat-top gating pulses, at bit rates up to 640 Gbit/s. Thereviewed set of experiments demonstrate error-free 640-to-10 Gbit/s data signal demultiplexing over the 64 OTDMchannels with a significantly improved performance over theuse of Gaussian-like control/gating pulses, for example, interms of receiver sensitivity (up to ∼13 dB, with a penaltyover the 10 Gbit/s back-to-back measurements as low as∼0.5 dB), time jitter tolerance (up to ∼500 fs, correspondingto ∼30% of the OTDM signal bit period), and optimizedpolarization insensitivity. The paper is structured as follows:Section 2 reviews the principle of the flat-top pulse shapingbased on ultrafast optical differentiation Section 2.1 togetherwith two different LPG-based implementations, namely, asingle-LPG filter Section 2.2 and a double-LPG MZ-typeinterferometer Section 2.3. The application of these twopulse-shaping technologies for demultiplexing of 640-Gbit/sOTDM data signals is revisited in Section 3, including themost relevant experiments based on the use of single-LPGpulse shapers Section 3.1 and those based on the use ofdouble-LPG pulse shapers Section 3.2, such as polarization-independent demultiplexing. Finally, Section 4 outlines themain conclusions and future prospects of the work reviewedhere.
2. Flat-Top Pulse-ShapingPrinciple and Long-Period FiberGrating (LPG) Implementations
2.1. Flat-Top Pulse Shaping Based on Optical Differentiation.The flat-top pulse reshaping technique used in the reviewedwork is based on a filtering scheme that employs an opticaltemporal differentiator [14]. It has been anticipated that anydesired ultrafast temporal waveform could be synthesized asa linear superposition of a Gaussian-like pulse and its succes-sive time derivatives [34]. The used flat-top pulse reshapingmethod is based on this general property and in particular,it exploits the fact that a flat-top intensity waveform can bewell approximated by only two terms of the general series,that is, by a proper combination of the input Gaussian-likepulse and its first time derivative. In what follows we describean extremely simple mechanism to implement this idea; this
mechanism is based on the use of an optical differentiatorwhere the relative weight between the two required temporalterms is easily adjusted through frequency detuning betweenthe input pulse and the differentiator resonance [14].
Optical temporal differentiation [19, 20] (that operatesover the complex time-domain envelope of an optical signal)can be realized using a linear filter that has a spectral transferfunction proportional to i(ω − ω0), where ω0 is the centralfrequency of the optical differentiator (frequency of zerotransmission), ω is the angular optical frequency variable,and i is the imaginary unit. When considering an inputoptical pulse of temporal envelope u(t) (spectrally centredat ωcar), with a resulting output optical pulse of temporalenvelope v(t), the differentiator was shown to provide thefollowing filtering function [14]
v(t) ∝ ∂u(t)∂t
+ iΔωu(t), (1)
where Δω = ωcar − ω0. Assuming that the input opticalpulse is transform limited with a real temporal envelope u(t),the temporal intensity profile of the signal at the opticaldifferentiator output can be written as follow:
|v(t)|2 ∝∣∣∣∣∂u(t)
∂t
∣∣∣∣2
+ Δω2|u(t)|2. (2)
The whole principle, described in what follows, is schemat-ically shown in Figure 2. For ωcar = ω0 (Δω = 0) thedevice operates as an optical differentiator. However, forωcar /=ω0, the output |v(t)|2 consists of a sum of the differ-entiated waveform and the original waveform, with a relativeweight given by the detuning factor Δω2. When u(t) is atemporally symmetric pulse (e.g., Gaussian-like waveform),the differentiated pulse is a symmetric double-pulse [15].Hence, the resulting output intensity waveform is a super-position of the differentiated waveform (double-pulse inten-sity profile, first term in (2)) and the original Gaussian pulseintensity profile (second term in (2)), where the Gaussianpulse intensity peak coincides with the energy valley inthe double-pulse waveform. The amount of energy of theoriginal Gaussian pulse that is present in the generated pulseis proportional to the frequency detuning factor Δω. As thefrequency detuning Δω increases, the differentiated pulse isgradually reshaped in such a way that the central valley ofthe temporal double-pulse intensity is filled by the residualoriginal Gaussian profile, leading to the formation of a singleflat-top pulse for an optimal frequency detuning. Generally,the generated flat-top optical pulse is not transform-limited,that is, the pulse temporal profile exhibits a certain nonlinearphase variation. This poses no problem with applications inwhich only the intensity profile is of interest, for example,nonlinear optical switching experiments based on the Kerr-effect (e.g., cross-phase modulation, XPM) in which the flat-top pulse waveform is used as the pump pulse.
Unlike other fiber pulse-shaping techniques, for example,based on Fourier filtering [1, 11–13], the optical differen-tiation-based scheme does not require precise control of therelation between the input pulse and the filter characteristicsin terms of bandwidth, provided the differentiator band-width is larger than that of the input pulse. This gives an

4 International Journal of Optics
Gaussian pulseDi erentiatedGaussian pulse
EE
t
t
t
t
t
t
t
E(t)
I(t)
I(t)
(a) ω = 0:
(b) ω > 0:
(c) ω >> 0:
I(t)
I(t)
E(t)
I(t) 2ω
I(t) 2ω
I(t) 2ω = 0
I = I(t) + I(t)2 ω
I = I(t) + I(t)2 ω
I = I(t) + I(t)2 ω
Figure 2: Principle of flat-top pulse generation using a frequency-detuned optical differentiator, Δω = ωcar − ω0.
Core LPG Cladding
Bandwidth S1
Bandwidth S3
Fiel
d am
plit
ude
tran
smis
sion
, abs
.P
has
e (r
ad)
Wavelength (nm)
1525 1530 1535 1540 15450
1
2
3
00.10.20.30.40.50.60.7
Figure 3: Amplitude and phase characteristics of the fiber LPGfilters. Measured field amplitude and phase characteristics of therealized long, S3 (red) and short S1 (blue) LPGs together with thetheoretical characteristics of an ideal differentiator similar to S3(green, dash-dotted lines). The S3 and S1 LPG operational band-widths (highlighted in the figure) are 5.5 nm and 19 nm, respec-tively. The inset shows a fiber uniform LPG, where the level of greencorresponds to the refractive index.
additional flexibility as a single differentiation device canbe used with different short-pulse sources emitting pulsesof various durations and shapes. The rise/fall edges of theflat-top pulse are determined by the rise/fall edges of theinput pulse (more specifically, by its differential), while theduration of the flat-top pulse is scaled with the durationof the input pulse. As a result, flat-top pulses of differentdurations can be generated from the same differentiationdevice by simply tuning the time width of the input opticalpulse (this also requires a proper adjustment of the pulse-LPG frequency detuning) [14].
2.2. Implementation Based on a Single-LPG Optical Differ-entiator. In a first implementation, we created the opticaldifferentiator using a single uniform LPG [19, 20]. As dis-cussed above, an optical temporal differentiator is essentiallya linear filtering device providing a spectral transfer functionproportional to i(ω−ω0). Consequently, the two key featuresof the filter’s transmission are (i) it depends linearly on thebase-band z frequency, and (ii) it is zero at the signal centralfrequency ω0. These two key features imply an exact π phaseshift across the central frequency ω0. The ideal complextransmission of an optical differentiator is schematicallyshown in Figure 3.
The required energy depletion at the signal centralfrequency can be produced by resonance-induced completeenergy transfer elsewhere. Specifically, in fiber optics, this canbe achieved by resonant transfer of light between two modesof the optical fiber waveguide. Resonant light couplingis induced when the light propagates through the twointeracting modes with identical speeds, which is practicallyattainable, for example, by an increase or decrease of thelight speed in one of the modes using a suitable phasediffraction grating [16]. The specific diffraction grating usedin our experiments, which is realized as a periodic change ofthe refractive index along the direction of light propagationwithin a single optical fiber, induces resonant couplingbetween two co-propagating modes and is commonly calledlong-period fiber grating (LPG) [35]. The term “long” refersto its period, which typically varies from tens to hundredsof micrometers, as opposed to short-period gratings (fiberBragg gratings, FBGs), where the light is backscattered,resulting in coupling between modes traveling in oppositedirections (in a Bragg geometry, the corrugation period isapproximately half the optical wavelength, micrometers, orless).

International Journal of Optics 5
The phase matching condition in order to achieve modecoupling between the core mode and the forward propaga-ting cladding modes is given by
β01 − β(n)cl =
2πΛ
, (3)
where β01 and β(n)cl are, respectively, the propagation con-
stants of the core and the nth-cladding mode, and Λ is the pe-riodicity of the grating. The ratio of power coupled into thenth-cladding mode to the initial power contained in the coremode is given by
P(n)cl (L)
P01(0)=
sin2[κL
√1 + (δ/κ)2
]1 + (δ/κ)2 , (4)
where δ is the detuning parameter
δ = 12
[β01 − β(n)
cl −2πΛ
], (5)
L is the grating length, and κ is the rate of the inducedcoupling per unit length between the core guided mode andcladding mode(s) [35]. To obtain efficient coupling betweenthese modes, the period of the LPG must be properly ad-justed to cause light diffraction from the core mode into thechosen cladding mode. Due to the different dispersion slopesof these two modes, the resonant coupling occurs only at aspecific frequency ω0, referred to as the LPG resonance fre-quency. It is known that if the device is designed to exactlysatisfy the condition κL = π/2 then the grating induces atotal (100%) energy coupling from the input guided coremode into the cladding mode (at ω0). An optical fiber-basedLPG specifically designed to provide 100% coupling betweenthe fiber core mode and one of its cladding modes at the res-onance frequency provides both the required π phase shiftand the transmission linear dependence that is necessary fortime differentiation (assuming that the input optical signalsare centered at the LPG resonance frequency) [19]. Such anLPG, coincidentally, has the required spectral linear responseover a bandwidth as broad as several terahertz [20].
To implement an LPG-based optical differentiator, strin-gent control of the fiber LPG coupling strength (which mustbe fixed exactly at κL = π/2) is required. The transmissionspectral responses of two LPG samples fabricated for opticaldifferentiation are reported in Figure 3. These samples weremade in a standard fiber sample (SMF-28, Corning Inc.),using the established point-by-point technique with a CO2
laser [36], and they have physical lengths of 2.6 cm (sampleS1) and 8.9 cm (sample S3), respectively, and a grating periodof 415 μm. To perform a very fine tuning of the gratingstrength (coupling coefficient), we used a technique whichtakes advantage of the coupling coefficient dependence onthe fiber longitudinal strain [37].
The amplitude and phase characteristics of the fiber LPGsamples were measured by an Optical Vector Analyzer (LunaTechnologies), and are shown in Figure 3. The linear andquadratic terms in the phase curve—caused by the delayand linear chromatic dispersion, respectively—have been
0
0.2
0.4
0.6
0.8
1
1.2
Inte
nsi
ty (
a.u
.)
20 22 24 26 28 30
Time (ps)
(a)
−2
0
2
λ = 0 nm Original pulse
20 22 24 26 28 30
Time (ps)
Ph
ase
(rad
)
λ = −0.4 nm λ = −1.3 nm
(b)
Figure 4: Experimentally generated intensity (a) and phase (b)temporal profiles of the synthesized waveforms at the uniform LPGoutput when a 1.8 ps input pulse is launched at the input fordifferent input pulse-LPG wavelength detuning (Δλ) conditions.
subtracted. We measured an exact π phase shift at the filterresonance wavelength (1535 nm for S1, 1534 nm for S3),which is an essential feature to obtain the desired filter-ing operation. The LPGs exhibited an extremely deep atten-uation, breaking the 60 dB limit, confirming operation atalmost exact full-coupling condition, as required by our ap-plication. The usable (“operational”) bandwidths of the fab-ricated LPGs were approximately 19 nm (S1) and 5.5 nm(S3). Notice that the “operational” bandwidth is the LPGresonance bandwidth over which the fiber filter providesthe desired filtering function (i.e., a linear function of fre-quency). This corresponds approximately to the bandwidthover which the LPG transmission (in intensity) is lower than10%.
As discussed in Section 2.1, for flat-top pulse generation,the LPG resonance frequency must be properly detuned fromthe carrier frequency of the input Gaussian-like pulse [14].Figure 4 shows experimental results on the formation of aflat-top optical pulse via propagation of a nearly-transform-limited Gaussian-like pulse through the LPG sample S3 re-ported above with a proper frequency (wavelength) detuning[14]. The input pulses in the experiment shown in Figure 4were Gaussian-like optical pulses generated from a passivelymode-locked wavelength-tunable fiber laser (Pritel Inc.) withfull-width-half-maximum (FWHM) pulse width of 1.8 ps.The pulses from the laser were first launched into a polariza-tion controller, as the fiber LPG was slightly birefringent [38],and were subsequently propagated through the LPG-basedpulse shaper. The output spectrum was monitored using

6 International Journal of Optics
0
0.01
0.02
0.03
0.04
0.05
0.06
1530 1532 1534 1536 1538
Wavelength (nm)
Spec
tru
m p
ower
den
sity
(μ
W/n
m)
Figure 5: Measured spectra corresponding to the synthesized wave-forms in Figure 4.
an optical spectrum analyzer (OSA). We used a fiber-basedFourier-transform spectral interferometry (FTSI) setup toretrieve the complex temporal waveform of the output pulse(in this setup, the input pulse was used as the referencepulse) [39, 40]. FTSI allowed us to monitor the obtainedtemporal waveform and optimize the experiment conditions,namely, wavelength detuning (in our experiment, this wasachieved via fiber laser tuning) and slight adjustment ofthe LPG coupling coefficient (via LPG straining), so that toachieve the desired flat-top temporal waveform. Figures 4(a)and 4(b) show the amplitude and phase temporal profilesrecorded at the LPG output for different values of the pulse-LPG wavelength detuning, Δλ = 0 (dotted, red curves),–0.4 nm (dashed, green curves), and –1.3 nm (solid, bluecurves), as well as the initial Gaussian pulse (dash-dotted,black curve). The measured spectra corresponding to thethree shown temporal waveforms are shown in Figure 5. Theestimated FWHM time width of the experimentally generat-ed flat-top waveform (for Δλ = −1.3 nm) is ≈3.2 ps. Theenergetic efficiency of the performed filtering process (ratioof the output power to the input power) was measured to be5.5%. Energetic efficiency can be increased by use of an LPGwith a narrower resonance bandwidth, that is, approachingthe input pulse bandwidth [19].
Due to the large bandwidth inherently provided by LPGs,this technique is well suited for pulse re-shaping operationsdown to the subpicosecond regime and as a result, it iseasily scalable to ultrahigh bit rates (e.g., 640 Gbit/s). In addi-tion, as mentioned above, flat-top pulses of different dura-tions can be achieved from the same LPG pulse shaper bysimply modifying the input pulse time-width and the cor-responding pulse-LPG frequency detuning. For instance, 1-ps (FWHM) flat-top pulses were generated using this sameLPG sample, S3, from ∼600 fs Gaussian-like input pulses[14]. Using numerical simulations, we have estimated thatflat-top waveforms with time widths down to ≈550 fs (from≈290-fs input Gaussian-like pulses) could be efficiently syn-thesized using this LPG sample, S3. Shorter flat-top pulsescould be generated using an LPG with a broader resonancebandwidth, for example, sample S1.
As another interesting advantage of the single LPG flat-top pulse re-shaping method, we have shown that a consid-
erable group-velocity dispersion-induced distortion on theflat-top pulse profile, for example, as caused by propagationthrough a few meters of standard SMF, can be compensatedthrough a simple axial strain applied along the LPG [15].
Notice that the above reported LPG was photo-inscribedfrom one of the sides of the optical fiber. This procedureyields nonuniform refractive index change across the fibercross-section, which typically introduces a slight photo-induced birefringence [38]. This causes the resonance fre-quency to vary depending on the polarization of the inputlight. Fiber illumination simultaneously from three sides ofthe fiber can be achieved using two-mirrors-assisted CO2
laser radiation [41]. This configuration yields azimuthallysymmetric illumination of the fiber, greatly reducing thephoto-induced birefringence in the LPG. More discussionson this important practical issue, including detailed evalu-ation of the LPG resonance birefringence, can be found inSection 3.1 below.
2.3. Implementation Based on a Double-LPG Optical Differen-tiator. Optical differentiation can be achieved using a two-arm (e.g., Mach-Zehnder, MZ-type) interferometer operatedaround any of its destructive interference frequencies [42].Such an interferometer device can be created in an all-fiberformat using two concatenated uniform LPGs [21]. This con-figuration offers an increased stability against environmentalfluctuations and the potential for ultra-broadband operationbandwidths, well in the THz range. In what follows, wereview the principle of operation of a two-arm interferom-eter as an optical differentiator and its implementation usingconcatenated LPGs.
A symmetric (splitting/coupling ratio of 50%), unbal-anced (the two interfering paths are of different lengths) in-terferometer has the following spectral transfer function:
Ht(ω−ω0)≈1+exp(iωτ)=1+exp[i(ω−ω0)τ] exp(iω0τ),(6)
where τ is the relative time delay between the two interfer-ometer arms. Setting the interferometer to operate at a min-imum transmission (Ht(ω−ω0) = 0) at the carrier frequency(ω = ω0), it follows from (6) that
τ = π(2m + 1)ω0
, (7)
where m is an arbitrary integer. Introducing this value into(6) we obtain:
Ht(ω− ω0) ≈ 1− exp[iπ(2m + 1)(ω− ω0)
ω0
]. (8)
The function in (8) can be approximated over a sufficientlynarrow bandwidth centered at ω0 by the first terms of theTaylor series expansion:
cos(π(2m + 1)(ω − ω0)
ω0
)∼= 1,
sin(π(2m + 1)(ω− ω0)
ω0
)∼= π(2m + 1)(ω − ω0)
ω0,
(9)
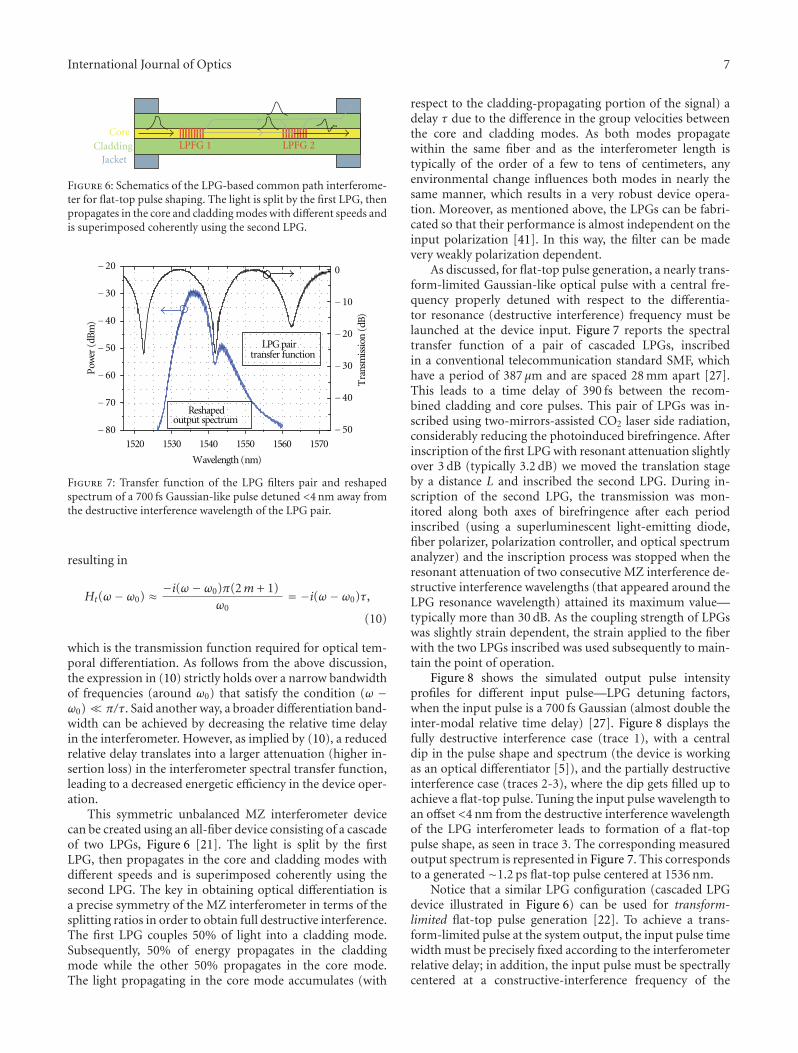
International Journal of Optics 7
LPFG 1 LPFG 2Core
CladdingJacket
Figure 6: Schematics of the LPG-based common path interferome-ter for flat-top pulse shaping. The light is split by the first LPG, thenpropagates in the core and cladding modes with different speeds andis superimposed coherently using the second LPG.
1520 1530 1540 1550 1560 1570
Pow
er (
dBm
)
Wavelength (nm)
0
Tra
nsm
issi
on (
dB)
Reshapedoutput spectrum
LPG pairtransfer function
− 10
− 20
− 30
− 40
− 50
− 60
− 70
− 80
− 20
− 30
− 40
− 50
Figure 7: Transfer function of the LPG filters pair and reshapedspectrum of a 700 fs Gaussian-like pulse detuned <4 nm away fromthe destructive interference wavelength of the LPG pair.
resulting in
Ht(ω − ω0) ≈ −i(ω − ω0)π(2m + 1)ω0
= −i(ω − ω0)τ,
(10)
which is the transmission function required for optical tem-poral differentiation. As follows from the above discussion,the expression in (10) strictly holds over a narrow bandwidthof frequencies (around ω0) that satisfy the condition (ω −ω0) � π/τ. Said another way, a broader differentiation band-width can be achieved by decreasing the relative time delayin the interferometer. However, as implied by (10), a reducedrelative delay translates into a larger attenuation (higher in-sertion loss) in the interferometer spectral transfer function,leading to a decreased energetic efficiency in the device oper-ation.
This symmetric unbalanced MZ interferometer devicecan be created using an all-fiber device consisting of a cascadeof two LPGs, Figure 6 [21]. The light is split by the firstLPG, then propagates in the core and cladding modes withdifferent speeds and is superimposed coherently using thesecond LPG. The key in obtaining optical differentiation isa precise symmetry of the MZ interferometer in terms of thesplitting ratios in order to obtain full destructive interference.The first LPG couples 50% of light into a cladding mode.Subsequently, 50% of energy propagates in the claddingmode while the other 50% propagates in the core mode.The light propagating in the core mode accumulates (with
respect to the cladding-propagating portion of the signal) adelay τ due to the difference in the group velocities betweenthe core and cladding modes. As both modes propagatewithin the same fiber and as the interferometer length istypically of the order of a few to tens of centimeters, anyenvironmental change influences both modes in nearly thesame manner, which results in a very robust device opera-tion. Moreover, as mentioned above, the LPGs can be fabri-cated so that their performance is almost independent on theinput polarization [41]. In this way, the filter can be madevery weakly polarization dependent.
As discussed, for flat-top pulse generation, a nearly trans-form-limited Gaussian-like optical pulse with a central fre-quency properly detuned with respect to the differentia-tor resonance (destructive interference) frequency must belaunched at the device input. Figure 7 reports the spectraltransfer function of a pair of cascaded LPGs, inscribedin a conventional telecommunication standard SMF, whichhave a period of 387 μm and are spaced 28 mm apart [27].This leads to a time delay of 390 fs between the recom-bined cladding and core pulses. This pair of LPGs was in-scribed using two-mirrors-assisted CO2 laser side radiation,considerably reducing the photoinduced birefringence. Afterinscription of the first LPG with resonant attenuation slightlyover 3 dB (typically 3.2 dB) we moved the translation stageby a distance L and inscribed the second LPG. During in-scription of the second LPG, the transmission was mon-itored along both axes of birefringence after each periodinscribed (using a superluminescent light-emitting diode,fiber polarizer, polarization controller, and optical spectrumanalyzer) and the inscription process was stopped when theresonant attenuation of two consecutive MZ interference de-structive interference wavelengths (that appeared around theLPG resonance wavelength) attained its maximum value—typically more than 30 dB. As the coupling strength of LPGswas slightly strain dependent, the strain applied to the fiberwith the two LPGs inscribed was used subsequently to main-tain the point of operation.
Figure 8 shows the simulated output pulse intensityprofiles for different input pulse—LPG detuning factors,when the input pulse is a 700 fs Gaussian (almost double theinter-modal relative time delay) [27]. Figure 8 displays thefully destructive interference case (trace 1), with a centraldip in the pulse shape and spectrum (the device is workingas an optical differentiator [5]), and the partially destructiveinterference case (traces 2-3), where the dip gets filled up toachieve a flat-top pulse. Tuning the input pulse wavelength toan offset <4 nm from the destructive interference wavelengthof the LPG interferometer leads to formation of a flat-toppulse shape, as seen in trace 3. The corresponding measuredoutput spectrum is represented in Figure 7. This correspondsto a generated ∼1.2 ps flat-top pulse centered at 1536 nm.
Notice that a similar LPG configuration (cascaded LPGdevice illustrated in Figure 6) can be used for transform-limited flat-top pulse generation [22]. To achieve a trans-form-limited pulse at the system output, the input pulse timewidth must be precisely fixed according to the interferometerrelative delay; in addition, the input pulse must be spectrallycentered at a constructive-interference frequency of the

8 International Journal of Optics
0
0.2
0.4
0.6
0.8
1
Nor
mal
ised
pow
er (
a.u
.)
−1.5 −1 −0.5 0 0.5 1 1.5 2 2.5
Time (ps)
Nor
mal
ised
pow
er (
dBm
)
0
−10
−20
−30
−40
1530 1535 1540 1545 1550
Wavelength (nm)
1
2
3
1
2
3
Figure 8: Traces in ascending order of pulse intensity profiles (left) and respective spectra (right) for detuning of the signal input wavelengthaway from the interference fringe of the cascaded LPG filter pair.
Flat-top pulse shaper
ERGO
ERGO
Compressor
Compressor
LPG NOLM-demuxer
HNLF
PCBERτ
SMFMOD
Transmitter 640 Gb/s
(50 m)
(20 m)HNLF (400 m) MUX
FWHM∼430 fs
FWHM∼530 fs
Figure 9: Setup for 640 Gbit/s. ERGO—erbium glass oscillator, PC—polarization controller, MOD—modulator, BER—bit error rate.
device. Different pulse waveforms could be generated usingthis same pulse coherent superposition concept by simplychanging the interpulse relative delay [13]. In another recentexperiment, a similar double-LPG device was used to gen-erate parabolic-like optical pulses aimed at ultra-broadbandflat spectral broadening (supercontinuum generation) bynonlinear propagation through a normally dispersive opticalfiber [43].
3. Nonlinear Optical Time DivisionDemultiplexing at 640 Gbit/s UsingFlat-Top Pulse Gating
3.1. Flat-Top Pulse Gating Schemes Based on a Single-LPGShaper. The single-LPG scheme for flat-top optical pulseshaping described in Section 2.1 above has been successfullyemployed to generate optimized gating (control) pulses forerror-free and jitter-tolerant nonlinear switching in opticaltime division multiplexing (OTDM) systems operating upto 640 Gbit/s [24–26]. The use of flat-top control pulses fordemultiplexing in OTDM schemes has proved greatly advan-tageous as compared with the use of Gaussian-like pulses:flat-top pulse gating offers significant improvements inreceiver sensitivity and timing-jitter tolerance. We reiteratethat increasing tolerance to timing jitter in the system is ofcritical importance for serial data transmission in telecom-munication links operating at rates of 160 Gbit/s and above.
In a first experimental demonstration [25], picosecondflat-top pulses generated from a single-LPG detuned differ-
entiator were employed as gating pulses in a 640-to-10 Gbit/sdemultiplexing configuration and they were demonstratedto provide an ∼13 dB improvement in receiver sensitivity ascompared to the use of Gaussian-like control pulses and ajitter tolerance of ∼500 fs, nearly 30% of the one-bit timewindow.
Figure 9 shows a schematic of the experimental setup. Itconsists of three principal parts that will be described sub-sequently: the flat-top pulse generator, the transmitter, andthe demultiplexer, a nonlinear optical loop mirror (NOLM).
The NOLM consists of a Sagnac interferometer [28] con-taining a 50 m long section of a highly nonlinear fiber(HNLF, dispersion slope ∼0.018 ps/nm2 km, zero dispersionat 1554 nm, and nonlinear coefficient of γ ∼ 10.5 W−1 km−1).The signal propagates inside the loop in both (oppo-site) directions and interferes at the NOLM’s input/outputcoupler. Without the presence of the gating signal, thephase difference experienced by light propagating in bothdirections is zero, which results in constructive interferenceat the input port of the NOLM, that is, the signal is reflectedback. In the presence of the gating pulse that propagatesunidirectionally in the NOLM only, the copropagating signallight experiences a Kerr-effect-induced nonlinear phase shift,which introduces a phase difference between signals propa-gating in both directions. Adjusting the parameters (e.g., thegating signal intensity) to produce a phase difference equalto π, the signal, which is overlapped with the gating pulse, isdirected to the NOLM output port. For optimum operation,the gating signal has to be propagated simultaneously withthe target data pulse. To minimize dispersion-induced delays,

International Journal of Optics 9
Flat top
Nonflat top
640 Gb/s data
0
0.2
0.4
0.6
0.8
1
−2 −1.5 −1 0 0.5 1 1.5 2
Cro
ss-c
orre
lati
on p
ower
(a.
u.)
Time (ps)
Figure 10: Cross-correlation of the data (dashed), flat-top (solid),and nonflat-top (dash-dot) gating pulses.
the signal and gating pulses should be respectively located ateach different side of the zero-dispersion wavelength of theNOLM (1554 nm). Nonetheless, any delay between these twopulses (caused, e.g., by the timing jitter) severely degrades theperformance. As the tolerance to the timing jitter scales withthe one-bit time slot duration, higher repetition rate systemsare generally more timing-jitter sensitive.
The flat-top pulse generator consists of an ERGO (erbi-um glass oscillator) pulse source emitting 1.2 ps full-width-half-maximum (FWHM) pulses at 10 GHz at 1543 nm withrms timing jitter of 90 fs (measured by the von der Lindemethod [44], integrating the phase noise spectrum from1 kHz to 1 GHz). These pulses are further soliton compressedusing an optical amplifier in saturation to obtain 450 fs pulses(measured with an autocorrelator). Subsequently, the pulsesare propagated through the LPG filter. The used LPG is110 mm long with a period of 530 μm and is made in astandard SMF-28 fiber using CO2 laser irradiation and thepoint-by-point technique [36]. Its coupling strength that isclose to the full coupling condition (zero transmission at theresonance wavelength) is slightly tunable using axial strain[37]. The FWHM of the LPG notch is 6 nm in power trans-mission. Following optimization of the frequency detuningbetween the input pulse and LPG resonance, flat-top pulsesthat give a cross-correlation FWHM of ∼1.4 ps are obtainedat the LPG output. The sampling pulse used for the cross-correlation is a 500 fs FWHM Gaussian-shaped pulse (meas-ured using an autocorrelator). The temporal characteristicsof the flat-top pulses at the LPG shaper output are shownin Figure 10. The flat-top width of the pulses measured at98% of the pulse cross-correlation peak power is measuredto be 550 fs. Considering the relatively long duration of thesampling pulse used for the cross-correlation, the actualpulse flat-top part is expected to be slightly larger andthe FWHM slightly smaller compared to the cross-cor-relation values. Due to an unwanted photoinduced bire-fringence of our in-house made LPG-based filter, a polar-ization controller is employed to operate the LPG-based filterwithin one principal axis of birefringence. The energetic ef-ficiency of the filtering process (ratio of the signal powers atthe LPG output and input) was measured to be 24%.
−40 −35 −30 −25 −20
3
4
5
6
7
8
9
10
11
−lo
g(B
ER
)
Channel 31
10 Gb/s b-b640/10 falt top640/10 Gaussian
−18.5−32.5
−35.9
Receiver power (dBm)
Figure 11: BER characteristics: back-to-back (squares), using flat-top pulses (circles), and using nonflat-top pulses (triangles). Thedemultiplexing results are from the same data channel.
The transmitter consists of another 10 GHz ERGO sourceemitting at 1557 nm, a pulse compressor based on HNLFfollowed by SMF-28 standard fiber giving pulses of 530 fsFWHM duration (estimated from autocorrelation measure-ments) with measured rms timing jitter of 70 fs. The pulsetrain is data modulated at 10 Gbit/s (27-1 PRBS) and opticaltime division multiplexed (OTDM) up to 640 Gbit/s, seecross-correlation trace of the data signal in Figure 10. Thus,the 640 Gbit/s serial data signal is composed by 64 channels,each at 10 Gbit/s. Please note that in practice, the data modu-lated pulses are multiplexed to 40 Gbit/s before compression,in order to avoid unwanted dispersive broadening in the firstmultiplexer-stages. The multiplexer (MUX) is polarizationand PRBS maintaining (for 27-1 PRBS word length) with a(27-1)/2 bits fiber delay in each MUX stage. The cross-cor-relation measurement of the multiplexed 640 Gbit/s datasignal evidences that the individual data channels have beentemporally aligned with the correct distance to neighboringchannels, that is, about 1.57 ps, and the pulses are adequatelynarrow to obtain a reasonable resolution of the individualchannels using the 500 fs reference pulses.
The amplified flat-top gating signal and properly delayedtransmitter signal are launched into the NOLM demulti-plexer. The 10 Gbit/s demultiplexed signal at the NOLM out-put is filtered by a band-pass filter (1.4 nm) to filter outnoise and residual gating signal at 1543 nm before being ana-lyzed using a bit error ratio (BER) analyzer. We used a free-running ERGO as a master clock and then o/e convertedits pulses to lock all other subsystems to it. This reducedthe timing jitter to 70 fs rms for the data and 90 fs forthe clock pulses. For the system evaluation (results shownin Figure 11), we measure the back-to-back sensitivity at10 Gbit/s first. Subsequently, we characterize the 640-Gbit/ssetup: we measure power penalty using the optical gate based

10 International Journal of Optics
Flat top
(a)
Nonflat top
(b)
Figure 12: Eye diagrams obtained for flat-top and non-flat-top gating pulses.
0 4 8 12 16 20 24 28 32 36 40 44 48 52 56 60 64
Channel number
−15
−20
−25
−30
−35Rec
eive
r se
nsi
tivi
ty (
dBm
)
−28 dBm
10 Gb/s b-b
E − 7E − 7
E − 5
E − 9
E − 6
E − 7
E − 4E − 4E − 6
E − 6E − 8E − 9
Figure 13: Demultiplexing of all 64 tributary channels using flat-top gating pulses.
−600 −400 −200 0 200 400 6000
10
20
30
40
50
350 fs
Time (fs)
Cro
ss-c
orre
lati
on p
ower
(a.
u.)
3
2
4
5
67891011
−lo
g(B
ER
)
Figure 14: BER timing-jitter tolerance (triangles) and intensityprofile of the used flat-top pulse (dashed).
on the flat-top pulses and for comparison with a non-flat-top pulse. The non-flat-top reference pulse is prepared bysimply detuning the LPG, which enables us to remain onthe same data channel, yielding a fair comparison of the twopulse types. The non-flat-top reference pulse is a Gaussian-like shaped 900 fs FWHM pulse, see plot in Figure 10.
From Figure 11 we see that the use of non-flat-top gatingpulses results in an additional power penalty of 13 dB for theerror-free level of BER = 10−9 compared to the flat-top case,
where the penalty is only 3.5 dB with respect to the 10 Gbit/sback to back. Moreover, there is an error floor using non-flat-top pulses indicating that the system is limited by relativetiming jitter, which is over 110 fs rms in our system (consid-ering independent transmitter and gating signals timing jitterof 70 fs and 90 fs, resp.). This is confirmed by the fact that theuse of the flat-top gating pulses with a flat-top width five-times wider than the system rms timing jitter does not leadto the appearance of an error floor. That is, the non-flat-toperror floor does not stem from interference from neighboringchannels but only from timing mismatch with the data pulsecaused by their relative jitter. For this reason flat-top pulsesperform better, because their shape combined with the non-linear mechanism of performing the demultiplexing processleads to a quasisquare switching window. This is furtherconfirmed by the eye diagrams that are shown in Figure 12.We clearly see that using the non-flat-top gating pulses leadsto amplitude noise, which is typical for timing jitter-limitedsystems. Again, influence of this phenomenon is considerablyreduced when flat-top gating pulses are used. All thesemeasurements were carried out on the same data channel.
Furthermore, we measure the system performance for all64 tributary channels. Figure 13 shows the sensitivities for all64 channels when using the flat-top pulses to gate with. Wesee that it is possible to resolve all channels and demultiplexthem. But since some of the channels partially overlap, we seethat some pairs of channels are not as good as the rest, and 12of the 64 channels are not error-free due to the suboptimumMUX alignment. This is purely a feature of the multiplexerand is consequently not associated with the gating pulses.In fact the flat-top-pulses clearly reveal the quality of themultiplexed signal in a much better way than the non-flat-top pulse would have been able to with its large penalty.Furthermore, with 52 channels error free, it can be concludedthat the flat-top pulses are unambiguously appropriate for640 Gbit/s operation.
The previous data clearly shows that the used flat-topgating pulses are capable of mitigating the system timingjitter being over 110 fs rms. To find a maximum value ofthe timing jitter that can be tolerated by the demultiplexerwith the available flat-top pulses, we increase the power at

International Journal of Optics 11
Tran
smis
sion
(dB
)
Polarization 1Polarization 2
3-dB BW: 6 nm Polarization splitting: 1 nm
0
−10
−20
−30
−40
1530 1540 1550
Wavelength (nm)
(a)
0
−10
−20
−30
−40
Tran
smis
sion
(dB
)
1530 1540 1550
Wavelength (nm)
Polarization 1Polarization 2
Polarization splitting: 0.1 nm3-dB BW: 15 nm
(b)
Figure 15: Measured spectral transmission responses of the LPG differentiators used (a) on the [25] (results shown in Figures 10–14) and(b) on the [26] (results shown in Figure 16) for the two orthogonal input light polarization states.
the receiver by 5 dB over the error-free level and vary thedelay between the data and gating pulses. Subsequently, wemeasure the BER for different levels of this delay, Figure 14.The flat-top waveform is also shown in order to visualize therelation between the gating pulse flat-top duration and theamount of delay that can be tolerated for error-free opera-tion (with BER < 10−9). We see that an additional time dis-placement of 350 fs can be tolerated. Together with the sys-tem jitter of 110 fs, this gives almost 500 fs tolerance or 30%of the 640 Gbit/s time slot, which is a value very close to theflat part of the flat-top pulse of 550 fs. For non-flat-top gatingpulses, the system does not tolerate any additional timingjitter, indicating that the system is already limited by its tim-ing jitter of 110 fs rms.
In addition to the above critical advantages, it has beenalso demonstrated that the use of flat-top control pulses ina nonlinear time-domain demultiplexing system may helpin achieving polarization-independent operation [45]. Thelatter is a highly desired feature in an optical demultiplexer,enabling it to process incoming optical data signals with arbi-trary states of polarization, as it is usually the case in pra-ctical systems. For this purpose, the flat-top pulse-shapingelement should be polarization independent. As mentionedabove, LPG-based pulse shapers with significantly reducedpolarization dependence can be created by fabricating theLPG devices through a two-mirror assisted CO2 laser radia-tion configuration, which yields azimuthally symmetric illu-mination of the fiber [41], greatly reducing the photo-in-duced birefringence in the fabricated LPGs. Figure 15(b)shows the measured transmission spectral response for thetwo orthogonal light polarization states of a single LPG dif-ferentiator fabricated using this improved configuration[26]. As anticipated, a nearly polarization-independent re-
sponse is achieved (polarization splitting ∼0.1 nm), in sharpcontrast to the conventional single-side illuminated LPG dif-ferentiator (polarization splitting ∼1 nm), see Figure 15(a)showing the measured spectral responses for the two orthog-onal light polarization states of the LPG used in the nonlinearswitching experiments described above [25]. Notice that thenewly fabricated LPG differentiator also exhibits a signif-icantly larger operation bandwidth (FWHM bandwidth ofthe resonance notch ∼15 nm) than that used in our previousexperiments (∼6 nm). This enables the generation of shorterflat-top pulse waveforms (∼840-fs FWHM from a 500 fsinput Gaussian-like pulse) with an improved intensity-profile quality, leading to a significantly improved BER per-formance when employed for 640-to-10 Gbit/s demultiplex-ing in the nonlinear switch [26]. In particular, the optimizedLPG differentiator yields less than 0.5 dB receiver sensitivitypenalty relative to the 10 Gbit/s back-to-back measurements,see results in Figure 16, as compared with the >3 dB penaltymeasured for the previous LPG filters, see results in Figure 11above. A total timing jitter tolerance of ∼310 fs has beenexperimentally estimated when using the newly generatedflat-top pulse waveform [26]. The observed decrease in thejitter tolerance (as compared with the results obtained withthe previous flat-top pulse, ∼500 fs) can be attributed to thefact that the new pulse has a shorter flat-top section.
3.2. Flat-Top Pulse Gating Schemes Based on Double LPGfor Polarization-Independent Demultiplexing. Polarization-independent (PI) operation is one of the most desiredfeatures of an optical demultiplexer, enabling it to pro-cess incoming optical data signals with arbitrary statesof polarizations. But nonlinear effects such as cross-phasemodulation (XPM) or four wave mixing (FWM), which

12 International Journal of Optics
Receiver power (dBm)
Pow
er (
a.u
.)
Pow
er (
a.u
.)
Time (ps) Time (ps)
0
5
10
15
0
5
10
15
97 98 99 100 101 102 100 101 102 103
Exp
Exp
Fit Fit
Deconv
Deconv
Smpl Smpl
1.1 ps840 fs
Gaussian
Flat top
1/e ∼450 fs
m3
m1
0
0.5
1
700 fs
840 fs
100 101
Time (ps)
10 G b-b
(nm)
−20
−40
−60
(dB
m)
1520 1540 1560
4
5
6
7
8
9
10
−lo
g(B
ER
)
−41 −40 −39 −38 −37 −36 −35
Figure 16: Flat-top pulses and 640 Gbit/s demultiplexing with subpicosecond flat-top pulse. Top: measured cross-correlation traces of thegenerated flat-top pulses of various widths and deconvoluted waveforms. Bottom: BER performance with and without flat-top pulse. Insetsshow the spectral (lower left) profile of the flat-top pulse and the temporal (upper right) corresponding waveforms of the flat-top super-Gaussian (or order M = 3) and Gaussian (m = 1) control pulses.
are used in ultrahigh-speed all-optical demultiplexing, areinherently polarization dependent. This is the case also forthe standard NOLM, since it is based on an XPM-inducedphase shift.
The principle for canceling the data polarization-de-pendence of the NOLM is based on the careful use of itsperiodic power transfer function without introduction ofany structural modifications [45]. The operation is shownin Figure 17. The polarization states are shown to the left:the control polarization is set to a linear state along the
y-axis, and the data is in a random (elliptical) state with field-components Ex and Ey along the x- and y-axes, respective-ly. The XPM phase shift Δϕy induced by the control pulseon the parallel Ey-component is three-times larger comparedto the XPM phase shift Δϕx induced on the perpendicularcomponent Ex. The power transfer function of the NOLMas a function of the phase-shift is shown to the right. It ispossible to find conditions under which the XPM phase-shifts of the two data-polarization components Ey and Ex,Δϕy and Δϕx = 1/3Δϕy , respectively, give rise to equal

International Journal of Optics 13
Ex −→ ϕx Ey −→ ϕy
ϕx = 1/3 ϕy
Polarization state
Control
DataEy
Ex
XPM phase shiftsin NOLM:
Tx = Ty
Tx = Ty
NOLM transfer function
π 2π 3π0
0.25
0.5
0.75
1
XPM phase shift
Tran
smit
tan
ceT
(a.u
.)
Pctrl,1
Pctrl,2
Figure 17: Principle behind polarization-independent operation of a standard NOLM.
NOLM-demuxer10 GHz
13 nm5 nm 9 nm
FWHM
410 fs
SMF
Polarisationscrambler
640 Gbit/s
640 Gbit/s
transmitter
ERGO
PC
PCBERτ
Control pulse shaper
LPG1 LPG2 HNLF(15 m)
DF-HNLF400 m
Figure 18: Setup for PI-NOLM operation.
transmissions Ty and Tx. This will result in a polarization-in-dependent switching operation and it occurs at (Δϕx;Δϕy) =(π/2; 3π/2) and (Δϕx;Δϕy) = (π; 3π). These conditions canbe achieved by carefully adjusting the average control pulsepower Pctrl, since the XPM-phase shift is proportional to Pctrl.It is easy to understand that PI operation of the NOLM wouldbenefit from the utilization of flat-top control pulses. This isrelated to the fact that a constant control pulse power wouldresult in a constant phase shift along the data channel to bedemultiplexed.
The double-LPG flat-top pulse shaper described inSection 2.3 above has been successfully employed for polar-ization-independent nonlinear switching in a 640-to-10 Gbit/s demultiplexing experiment [27]. Figure 18 showsthe experimental setup for the PI-NOLM operation using thecascaded LPG pair as a flat-top pulse shaper (see detaileddescriptions on this specific pulse shaper in Section 2.3above). An ERGO pulse source runs at 10 GHz and emits1.5 ps wide pulses at 1542 nm, which are used to create a sup-ercontinuum in 400 m of dispersion flattened highly nonlin-ear fiber (DF-HNLF). The output from the DF-HNLF is usedto generate the control and data signal by using two opticalband-pass filters centered respectively at 1536 and 1555 nm.
The double-LPG filter is used for generation of a 1.2 psflat-top pulse centered at 1536 nm from an input 700 fsGaussian-like pulse. The generated flat-top pulse is subse-quently used as control in an NOLM with 15 m HNLF (dis-persion slope S ≈ 0.015 ps/(nm2 km), zero dispersion at λ0 =1545 nm, and nonlinear coefficient γ ≈ 10.5 W−1 km−1).The data is a 640 Gbit/s OTDM signal (PRBS 27-1, singlepolarization) centered at 1555 nm, with 410 fs wide pulses.The data is subsequently demultiplexed down to 10 Gbit/s forBER characterization.
The polarization state of the data signal is randomized ina polarization scrambler running at 113 kHz. The standard
NOLM operation (nonpolarization insensitive operation)is reached for Pctrl = 26.5 dBm. When the scrambler isturned on the demultiplexed eye is severely deteriorated(Figure 19(a)), independently on the polarization state of thecontrol. When Pctrl is increased to 27.6 dBm and the controlpolarization is optimized, then the NOLM works in PI mode.With the scrambler on, the eye remains open as seen inFigure 19(b). By using a slow photodetector it is possible tomeasure 0.7 dB residual polarization dependence of the PI-NOLM operation when the scrambler is on.
Figure 20 shows the BER measurement for the standardand PI-NOLM operation. As can be seen, when the scrambleris off, the power sensitivity (at BER = 10−9) is the samefor both cases. When the scrambler is turned on, then thestandard NOLM exhibits an error floor above BER = 10−7.In contrast, the PI-NOLM shows just a power penalty of∼1 dB. These measurements confirm both the flat-top pulseenhanced performance of the nonlinear switch and the PIoperation of the NOLM.
4. Conclusions
In this paper, we have reviewed some recent work on thedesign and fabrication of all-fiber (LPG-based) picosecondand subpicosecond flat-top optical pulse shapers and theirapplication for nonlinear optical telecommunication dataprocessing, particularly demultiplexing of OTDM serial datausing NOLM-based switches with flat-top gating pulses, atbit rates up to 640 Gbit/s. The reviewed set of experimentsdemonstrate error-free 640-to-10 Gbit/s data signal demul-tiplexing over the 64 OTDM channels with a significantlyimproved performance over the use of Gaussian-like con-trol/gating pulses, for example, in terms of receiver sensitivity(up to ∼13 dB), timing-jitter tolerance (up to ∼500 fs, corre-sponding to ∼30% of the OTDM signal bit period), andoptimized polarization insensitivity.

14 International Journal of Optics
Standard NOLM = 26.5 dBm
Scrambler o Scrambler on
Pctrl
(a)
PI-NOLM = 27.6 dBm
Scrambler o Scrambler on
Pctrl
(b)
Figure 19: Eye diagrams for the demultiplexed 10 Gbit/s signal for the (a) standard, and (b) PI-NOLM operations, with polarization scram-bler on and off.
1.5 ps
−36 −34 −32 −30 −28 −26 −24 −22 −20 −18
Power (dBm)
−lo
g(B
ER
)
2
3
4
5
6
7
8
910
PI-NOLM, scrambler oPI-NOLM, scrambler onStandard NOLM, scrambler oStandard NOLM, scrambler on
Figure 20: BER curves for the standard and PI-NOLM operation.Inside: 640 Gbit/s eye diagram.
The described LPG-based optical pulse-shaping methodscan be readily used for generation of even shorter flat-toppulse waveforms, opening the path for the creation of opticaltime-division demultiplexing platforms with an optimizedperformance at 1.2 Tbit/s and above. Moreover, other tempo-ral pulse shapes of practical interest (e.g., triangular or para-bolic waveforms) could be generated in the subpicosecondregime using similar LPG approaches, potentially enablingthe implementation of other pulse shaping-enhanced tele-communication signal processing/generation operations(e.g., optimized wavelength conversion, signal copying, time-to-wavelength mapping, high-repetition rate femtosecondpulse generation, etc.) at unprecedented bit rates, that is, at640 Gbit/s and above.
Acknowledgments
This paper was supported in part by the Natural Sciencesand Engineering Research Council (NSERC) of Canada andby the Les Fonds Quebecois de la Recherche sur la Natureet les Technologies (FQRNT). It was also supported bythe European Research Council (ERC) starter grant projectSOCRATES and the Danish National Research Council fund-ed project NOSFERATU. OFS Fitel Denmark Aps is gratefullyacknowledged for providing the nonlinear fibers used inthese experiments.
References
[1] A. M. Weiner, “Femtosecond optical pulse shaping and pro-cessing,” Progress in Quantum Electronics, vol. 19, no. 3, pp.161–237, 1995.
[2] F. Parmigiani, P. Petropoulos, M. Ibsen, and D. J. Richardson,“All-optical pulse reshaping and retiming systems incorporat-ing pulse shaping fiber Bragg grating,” Journal of LightwaveTechnology, vol. 19, pp. 746–752, 2001.
[3] J. H. Lee, P. C. Teh, P. Petropoulos, M. Ibsen, and D. J. Richard-son, “All-optical modulation and demultiplexing systems withsignificant timing jitter tolerance through incorporation ofpulse-shaping fiber Bragg gratings,” IEEE Photonics TechnologyLetters, vol. 14, no. 2, pp. 203–205, 2002.
[4] J. H. Lee, L. K. Oxenløwe, M. Ibsen et al., “All-optical TDMdata demultiplexing at 80 Gb/s with significant timing Jittertolerance using a fiber bragg grating based rectangular pulseswitching technology,” Journal of Lightwave Technology, vol.21, no. 11, pp. 2518–2523, 2003.
[5] S. Watanabe, R. Ludwig, F. Futami et al., “Ultrafast all-optical3R-regeneration,” IEICE Transactions on Electronics, vol. E87-C, no. 7, pp. 1114–1118, 2004.
[6] L. K. Oxenløwe, M. Galili, A. T. Clausen, and P. Jeppesen,“Generating a square switching window for timing jitter toler-ant 160 Gb/s demultiplexing by the optical Fourier transformtechnique,” in Proceedings of the 32nd European Conference onOptical Communications (ECOC ’06), Cannes, France, 2006,paper We2.3.4.
[7] T. Otani, T. Miyazaki, and S. Yamamoto, “Optical 3R regener-ator using wavelength converters based on electroabsorption

International Journal of Optics 15
modulator for all-optical network applications,” IEEE Photon-ics Technology Letters, vol. 12, no. 4, pp. 431–433, 2000.
[8] A. I. Latkin, S. Boscolo, R. S. Bhamber, and S. K. Turitsyn,“Optical frequency conversion, pulse compression and sig-nal copying using triangular pulses,” in Proceedings of theEuropean Conference on Optical Communication (ECOC ’08),Brussels, Belgium, 2008, paper Mo.3.F.4.
[9] F. Parmigiani, M. Ibsen, T. T. Ng, L. Provost, P. Petropoulos,and D. J. Richardson, “An efficient wavelength converter ex-ploiting a grating-based saw-tooth pulse shaper,” IEEE Pho-tonics Technology Letters, vol. 20, no. 17, pp. 1461–1463, 2008.
[10] F. Parmigiani, C. Finot, K. Mukasa et al., “Ultra-flat SPM-broadened spectra in a highly nonlinear fiber using parabolicpulses formed in a fiber Bragg grating,” Optics Express, vol. 14,no. 17, pp. 7617–7622, 2006.
[11] T. Kurokawa, H. Tsuda, K. Okamoto et al., “Time-space-conversion optical signal processing using arrayed-waveguidegrating,” Electronics Letters, vol. 33, no. 22, pp. 1890–1891,1997.
[12] P. Petropoulos, M. Ibsen, A. D. Ellis, and D. J. Richardson,“Rectangular pulse generation based on pulse reshaping usinga superstructured fiber Bragg grating,” Journal of LightwaveTechnology, vol. 19, no. 5, pp. 746–752, 2001.
[13] Y. Park, M. H. Asghari, T. J. Ahn, and J. Azana, “Transform-limited picosecond pulse shaping based on temporal coher-ence synthesization,” Optics Express, vol. 15, no. 15, pp. 9584–9599, 2007.
[14] Y. Park, M. Kulishov, R. Slavık, and J. Azana, “Picosecondand sub-picosecond flat-top pulse generation using uniformlong-period fiber gratings,” Optics Express, vol. 14, no. 26, pp.12671–12678, 2006.
[15] R. Slavık, Y. Park, and J. Azana, “Tunable dispersion-tolerantpicosecond flat-top waveform generation using an opticaldifferentiator,” Optics Express, vol. 15, no. 11, pp. 6717–6726,2007.
[16] R. Kashyap, Fiber Bragg Gratings, Academic Press, San Diego,Calif, USA, 2nd edition, 2009.
[17] M. Kulishov and J. Azana, “Ultrashort pulse propagation inuniform and nonuniform waveguide long-period gratings,”Journal of the Optical Society of America A, vol. 22, no. 7, pp.1319–1333, 2005.
[18] R. Slavık, M. Kulishov, Y. Park, and J. Azana, “Long-period-fiber-grating-based filter configuration enabling arbitrary lin-ear filtering characteristics,” Optics Letters, vol. 34, no. 7, pp.1045–1047, 2009.
[19] M. Kulishov and J. Azana, “Long-period fiber gratings as ultra-fast optical differentiators,” Optics Letters, vol. 30, no. 20, pp.2700–2702, 2005.
[20] R. Slavık, Y. Park, M. Kulishov, R. Morandotti, and J. Azana,“Ultrafast all-optical differentiators,” Optics Express, vol. 14,no. 22, pp. 10699–10707, 2006.
[21] R. Slavık, Y. Park, D. Krcmarık, and J. Azana, “Stable all-fiberphotonic temporal differentiator using a long-period fibergrating interferometer,” Optics Communications, vol. 282, no.12, pp. 2339–2342, 2009.
[22] R. Slavık, Y. Park, and J. Azana, “Long-period fiber-grating-based filter for generation of picosecond and subpicosecondtransform-limited flat-top pulses,” IEEE Photonics TechnologyLetters, vol. 20, no. 10, pp. 806–808, 2008.
[23] E. Palushani, H. Hu, L. K. Oxenløwe et al., “640 Gb/s timingtolerant demultiplexing using a cascaded long-period fibergrating pulse shaper,” in Proceedings of the 35th European Con-ference on Optical Communication (ECOC ’09), Vienna, Aus-tria, 2009, paper Tu4.3.3.
[24] R. Slavık, L. K. OxenlØwe, M. Galili et al., “Demultiplexing of320-Gb/s OTDM data using ultrashort flat-top pulses,” IEEEPhotonics Technology Letters, vol. 19, no. 22, pp. 1855–1857,2007.
[25] L. K. Oxenløwe, R. Slavık, M. Galili et al., “640 Gb/s timingjitter-tolerant data processing using a long-period fiber-grat-ing-based flat-top pulse shaper,” IEEE Journal on SelectedTopics in Quantum Electronics, vol. 14, no. 3, Article ID4538055, pp. 566–572, 2008.
[26] L. K. Oxenløwe, M. Galili, H. C. M. Mulvad, R. Slavık,A. T. Clausen, and P. Jeppesen, “Polarisation-independentsub-picosecond flat-top pulse generation for ultra-fast 640Gbit/s gating,” in Proceedings of the Optical Fiber Conference(OFC ’09), San Diego, Calif, USA, March 2009, paper OWS5.
[27] E. Palushani, H. Hu, M. Galili et al., “640 Gbit/s polarisation-independent demultiplexing in a standard nonlinear-optical-loop-mirror using a cascaded long-period grating pulseshaper,” in Proceedings of the 23rd Annual Photonics SocietyMeeting, Denver, Colo, USA, November 2010, paper TuM2.
[28] T. Yamamoto, E. Yoshida, and M. Nakazawa, “Ultrafast non-linear optical loop mirror for demultiplexing 640Gbit/s TDMsignals,” Electronics Letters, vol. 34, no. 10, pp. 1013–1014,1998.
[29] A. I. Siahlo, A. T. Clausen, L. K. Oxenløwe, J. Seoane, and P.Jeppesen, “640 Gb/s OTDM transmission and demultiplexingusing a NOLM with commercially available highly non-linearfiber,” in Proceedings of the Conference on Lasers and Electro-Optics (CLEO ’05), vol. 2, pp. 883–885, 2005, paper CTuO1.
[30] H. G. Weber, C. Schubert, S. Ferber et al., “Single channel1.28 Tbit/s and 2.56 Tbit/s DQPSK transmission,” ElectronicsLetters, vol. 42, pp. 178–179, 2006.
[31] S. Watanabe, “Optical signal processing using nonlinear fi-bers,” Journal of Optical and Fiber Communications Reports,vol. 3, no. 1, pp. 1–24, 2006.
[32] D. Zibar, L. K. Oxenløwe, H. C. H. Mulvad et al., “The im-pact of gating timing jitter on a 160 Gb/s demultiplexer,” inProceedings of the Optical Fiber Conference (OFC ’06), vol.2006, 2006, paper OTuB2.
[33] E. Tangdiongga, Y. Liu, H. de Waardt et al., “All-optical demul-tiplexing of 640 to 40 Gbits/s using filtered chirp of a semi-conductor optical amplifier,” Optics Letters, vol. 32, no. 7, pp.835–837, 2007.
[34] M. H. Asghari and J. Azana, “Proposal and analysis of a recon-figurable pulse shaping technique based on multi-arm opticaldifferentiators,” Optics Communications, vol. 281, no. 18, pp.4581–4588, 2008.
[35] A. M. Vengsarkar, P. J. Lemaire, J. B. Judkins, V. Bhatia, T.Erdogan, and J. E. Sipe, “Long-period fiber gratings as band-rejection filters,” Journal of Lightwave Technology, vol. 14, no.1, pp. 58–65, 1996.
[36] D. D. Davis, T. K. Gaylord, E. N. Glytsis, S. G. Kosinski, S.C. Mettler, and A. M. Vengsarkar, “Long-period fibre gratingfabrication with focused CO2 laser pulses,” Electronics Letters,vol. 34, no. 3, pp. 302–303, 1998.
[37] R. Slavık, “Extremely deep long-period fiber grating madewith CO2 laser,” IEEE Photonics Technology Letters, vol. 18, no.16, pp. 1705–1707, 2006.
[38] T. Erdogan and V. Mizrahi, “Characterization of UV-inducedbirefringence in photosensitive Ge-doped silica optical fibers,”Journal of the Optical Society of America B, vol. 11, no. 10, pp.2100–2105, 1994.
[39] L. Lepetit, G. Cheriaux, and M. Joffre, “Linear technique ofphase measurement by femtosecond spectral interferometryfor applications in spectroscopy,” Journal of the Optical Societyof America B, vol. 12, no. 12, pp. 2467–2474, 1995.

16 International Journal of Optics
[40] Y. Park, F. Li, and J. Azana, “Characterization and optimizationof optical pulse differentiation using spectral interferometry,”IEEE Photonics Technology Letters, vol. 18, no. 17, pp. 1798–1800, 2006.
[41] V. Grubsky and J. Feinberg, “Fabrication of axially symmetriclong-period gratings with a carbon dioxide laser,” IEEE Pho-tonics Technology Letters, vol. 18, no. 21, pp. 2296–2298, 2006.
[42] Y. Park, J. Azana, and R. Slavık, “Ultrafast all-optical first- andhigher-order differentiators based on interferometers,” OpticsLetters, vol. 32, no. 6, pp. 710–712, 2007.
[43] D. Krcmarık, R. Slavık, Y. G. Park, and J. Azana, “Nonlinearpulse compression of picosecond parabolic-like pulses synthe-sized with a long period fiber grating filter,” Optics Express, vol.17, no. 9, pp. 7074–7087, 2009.
[44] D. von der Linde, “Characterization of the noise in continu-ously operating mode-locked lasers,” Applied Physics B, vol. 39,no. 4, pp. 201–217, 1986.
[45] H. C. H. Mulvad, M. Galili, L. K. Oxenløwe, A. T. Clausen, L.Gruner-Nielsen, and P. Jeppesen, “Polarization-independenthigh-speed switching in a standard non-linear optical loopmirror,” in Proceedings of the Optical Fiber Conference (OFC’08), San Diego, Calif, USA, 2008, paper OMN3.

Hindawi Publishing CorporationInternational Journal of OpticsVolume 2012, Article ID 263828, 7 pagesdoi:10.1155/2012/263828
Research Article
Bragg-Scattering Four-Wave Mixing in Nonlinear Fibers withIntracavity Frequency-Shifted Laser Pumps
Katarzyna Krupa,1 Michela Bettenzana,2 Alessandro Tonello,1 Vincent Couderc,1
Philippe Di Bin,1 Stefan Wabnitz,2 and Alain Barthelemy1
1 XLIM, UMR CNRS 6172, Universite de Limoges, 123 av A. Thomas, 87060 Limoges, France2 Dipartimento di Ingegneria dell’Informazione, Universita di Brescia, Via Branze 38, 25123 Brescia, Italy
Correspondence should be addressed to Alessandro Tonello, [email protected]
Received 8 July 2011; Accepted 5 September 2011
Academic Editor: Christophe Finot
Copyright © 2012 Katarzyna Krupa et al. This is an open access article distributed under the Creative Commons AttributionLicense, which permits unrestricted use, distribution, and reproduction in any medium, provided the original work is properlycited.
We experimentally study four-wave mixing in highly nonlinear fibers using two independent and partially coherent laser pumpsand a third coherent signal. We focus our attention on the Bragg-scattering frequency conversion. The two pumps were obtainedby amplifying two Intracavity frequency-shifted feedback lasers working in a continuous wave regime.
1. Introduction
Over the last decades, the nonlinear phenomena of paramet-ric four-wave mixing (FWM) have been intensively studiedin view of their great potential to provide a large variety ofall-optical functionalities for ultrafast signal processing [1–4]. In particular, optical parametric amplification, frequencyconversion, phase conjugation, and nonlinear switching havebeen widely explored. The main interest was developedfor FWM with coherent pumps, since this technique mayprovide high conversion efficiencies with appropriate dis-persion curves [5]. Nevertheless, in recent years, FWM inoptical fibers with incoherent or partially coherent pumpshas attracted great attention, in view of its polarization-independent gain and increased resilience to stimulatedBrillouin scattering (SBS) [6, 7]. Let us remember that SBSlimits the direct use of intense and narrowband lasers innonlinear fiber. For the specific case of highly nonlinearfibers (hereafter HNLF) the Brillouin threshold may be inthe order of few tens of milliwatt for a fiber length of 500 m.The common way to increase the Brillouin threshold requiresthe adoption of phase modulation of pumps. For the caseof two-pump parametric devices, optimal architectures ofphase modulations have been proposed to suppress SBS.These solutions are based on phase modulators, generally
driven by a pseudorandom bitsequence generator [4, 5, 8, 9]at GHz repetition frequency. With pure phase modulationthe pumps can be spectrally broadened without affecting thetime domain intensity.
The adoption of incoherent pumps may represent a cost-effective solution to study FWM in different scenarios andmay open a novel kind of applications, even if this may takeplace at the expense of low conversion efficiency and spectralbroadening of the converted signal. The interplay betweenfour-wave mixing processes with mixed coherent-incoherentpumps may also open entirely new features as reported veryrecently in [10]. Till now, most of investigations on nonlineareffects with incoherent pumping have been conducted forsingle pump FWM processes and so far, little attention hasbeen paid to a specific type of FWM generally called Bragg-scattering FWM (BS-FWM) [6, 10]. The low-noise natureof the BS-FWM is a very attractive feature [8, 11], whichmakes this process an excellent candidate for light-by-lightmanipulation with possible extension to the case of veryweak signals. These optical functionalities may be of interestto manipulate optical quantum states in view of frequencyconversion in quantum networks.
In this paper, we study the case of BS-FWM with partiallycoherent pumps in HNLF. For this purpose we used twobroadband intra-cavity frequency-shifted feedback lasers

2 International Journal of Optics
(IFSFLs) that operated in the continuous wave (CW) regime.Although these pumps are independent and exhibit lowcoherence time, we experimentally observed a clear signatureof frequency conversion. In addition, we discuss the compe-tition between BS-FWM and other types of FWM simultane-ously occurring in HNLFs. In particular, we experimentallydemonstrate the competition with degenerate (i.e., singlepump) FWM.
2. Experimental Setup and Pump Sources
In the case of a parametric frequency conversion, thecoherence time of the pump tC should be compared to thecharacteristic evolution time tP to establish such a nonlinearinteraction. In HNLF and for powers in the order of 50 mWone could estimate tP from the effective nonlinear length andgroup speed [12]. Whereas tC from our pumps is insteadassociated to the bandwidth of at least 50 GHz of our pumps,so we may expect that the nonlinear interplay becomesaffected by the partial coherence of pumps.
To study the case of BS-FWM frequency conversion insuch a different regime we propose the experimental setuppresented in Figure 1. Instead of filtering amplified sponta-neous emission (ASE) sources (often employed in previousstudies of incoherent FWM [6]) in our experiment weused a pair of intra-cavity frequency-shifted feedback lasers(IFSFLs) that we independently amplified to obtain twointense pumps.
The coherence properties of IFSFLs have been widelyinvestigated and exploited in metrology and in astronomicalimaging [13–15]. This kind of laser has also been proposed toincrease by several orders of magnitude the SBS threshold in[16] allowing supercontinuum generation from an amplifiedIFSFL with several Watts of input power. However BS-FWM requires two distinct pumps. Thus, we developedtwo identical tunable fiber IFSFLs that operated at differentwavelengths. Each IFSFL has been separately amplified by anerbium-doped fiber amplifier (EDFA) and protected againstunwanted back reflections by an isolator. To reduce theASE noise we put one bandpass filter at the input andtwo bandpass filters at the output of each EDFA (DiConthin-film filters with 5 nm bandwidth each). These sets offilters carve the spectrum of each pump to reduce thebackground spectral level without significantly affecting the3 dB bandwidth of the sources. Next, the two pumps werecombined by a 50/50 fiber coupler and multiplexed with athird signal from a commercially available tunable extendedcavity laser (laser power of 4 mW) through a 95/5 “tap”coupler. Pumps and signal were injected into a 480 m longoff-the-shelf segment of HNLF with nominal zero dispersionwavelength (ZDW) of 1545 nm.
The spectrum at the output end of the fiber was analyzedby an optical spectrum analyzer (OSA) and by a 1 GHzphotodiode connected either to an oscilloscope (OSC) or toa radio frequency (RF) analyzer. In what follows we will referto a set of measurements in which the average powers ofpump 1, 2, and signal at the input end of HNLF were 43 mW,62 mW, and 0.12 mW, respectively.
The two central elements of our experimental setupare the fiber IFSFLs. We present their synoptic scheme inFigure 2. Each laser cavity consists of a 20 m long polariza-tion maintaining (PM) erbium-doped fiber pumped by alaser diode emitting at 1480 nm and an inline PM acousto-optic frequency shifter (AOFS) controlled by a fixed RFdriver at 110 MHz. The cavity mirrors are provided bya fiber FC-PC connector (see Figure 2, on the right) tointroduce a natural Fresnel-type back reflection; the laseris connected to an output fiber with a FC-APC connectorthough a mating sleeve containing an air gap. The secondmirror is represented on the left-hand side of Figure 2 bya blazed grating in Littrow configuration working at thefirst diffraction order. The microlens has a focal lengthf ′ = 8 mm while the grating has density of 600 groovesper millimeter. The central wavelength of the laser can befreely tuned all over the bandwidth permitted by the erbiumgain by a simple rotation of the grating. The two IFSFLs areidentical copies, and they are both based on this scheme: theywere tuned to the upper and lower spectrum edge allowed bysuch lasers (1540 nm and 1563 nm for pump 1 and 2, resp.)so as to obtain the largest possible difference between theircarrier frequencies. The corresponding frequency differencein this case is of 2.87 THz.
The free-space optics section reported in Figure 2 pro-vides the transfer function of intra-cavity frequency depen-dent loss. In the case of perfect collimation, it turns out thatthe filtered bandwidth is inversely proportional to the focallength f ′ of the microlens. The fiber end close to the lenswas cleaved with an angle of 8◦ to reduce any undesiredback reflection. Under these conditions the low numericalaperture of the fiber provides the filtering mechanism. Inorder to smooth the optical spectrum, we used the AOFSinside the fiber cavity. A dynamical equilibrium can be foundbetween frequency shifting, tight frequency-dependent loss,and broadband gain. However, a more detailed analysis ofthe RF spectrum at the output of one of the IFSFL unveilsits complex behavior, as reported on the left-hand side ofFigure 3.
We observe the presence of a comb of frequenciesregularly spaced by 3.6 MHz, which compares well with thereciprocal of the round trip time of the fiber cavity. Wecompare these results with the direct numerical calculationcoming from a model described in [17] (see Figure 3(b)). Toimplement equation (3) of [17] we assumed a fiber length of27 m (in fact both the doped fiber and the AOFS are splicedto PM standard monomode fiber patchcords on both ends),a group index of 1.45, a frequency shift of 2 × 110 MHz(the AOFS is seen two times per round trip), and a randomphase for each frequency comb component. Note that in ourcase the AOFS is driven by a radio frequency which is muchhigher than the inverse of the round trip time of the cavity.
The dynamical evolution of the IFSFLs is also a key pointfor applications in nonlinear optics. Indeed we observed asmany other authors that our IFSFLs may operate in a CW orin a pulsed regime (see, e.g., [18]), depending on the levelof feedback in the cavity. However, it would be desirable thatthe IFSFLs work close to a CW mode to observe BS-FWMas one would expect that a nonsynchronized pulsed regime

International Journal of Optics 3
IFSFL480 m HNLF
OSA
BPF
OSC
ISO
Tunable ECL
50 : 50
95 : 5IFSFL BPF
EDFA
EDFA
ISO
BPF
BPF 50 : 50
ISO
Figure 1: Experimental setup; IFSFL: intra-cavity frequency-shifted feedback laser, BPF: bandpass filter, EDFA: erbium-doped fiberamplifier, ISO: isolator, ECL: extended cavity tunable laser, HNLF: highly non-linear fiber, OSA: optical spectrum analyzer, and OSC:oscilloscope.
Laser output
110 MHz
MUX
PC/APC connector
with air gap
4% back reflection
PM AOFS
Pump diode
1480 nm
Littrow mountgrating
Er-doped fiber
20 m PM
Microlensf = 8 mm
Figure 2: Setup of each IFSFL; MUX: multiplexer, PM: polarization maintaining, and AOFS: acousto-optic frequency shifter.
0 20 40 60 80 100
−80
−75
−70
−65
−60
−55
−50
−45
−40
Pow
er(d
Bm
)
RF (MHz)
(a)
0 20 40 60 80 100
0
50
100
RF (MHz)
I(d
B)
(b)
Figure 3: (a) Experimental RF spectrum for IFSFL 1 with a preamplified RF analyzer: the frequency comb free spectral range is of 3.6 MHz;(b) numerical simulation of RF photodiode current (spectrum of equation (3) of [17]).
between the pumps may drastically degrade the conversionefficiency in a dual pump process. According to [18], thebifurcation point between CW and pulsed solution can beinfluenced by the pump diode power. To keep the IFSFLsoperating in the CW regime, we have then set their diodecurrents to a low value (65 mA for both lasers). For highervalues of diode current one observes a rapid transition totime-periodic solutions [18] by direct observation of thelaser output through a photodiode and an oscilloscope. Theworking points of our lasers were finely adjusted by verifying
the absence of relaxation oscillations with an oscilloscopeand a 1 GHz bandwidth InGaAs photodetector.
3. Background Theory
Four-wave mixing is usually characterized as 3 distinct proc-esses depending on the relative positions of the pumps,signal, and idler frequencies (see Figure 4(a)) [4, 8]: mod-ulation instability (MI), phase conjugation (PC), andBragg-scattering (BS). All of them may be simultaneously
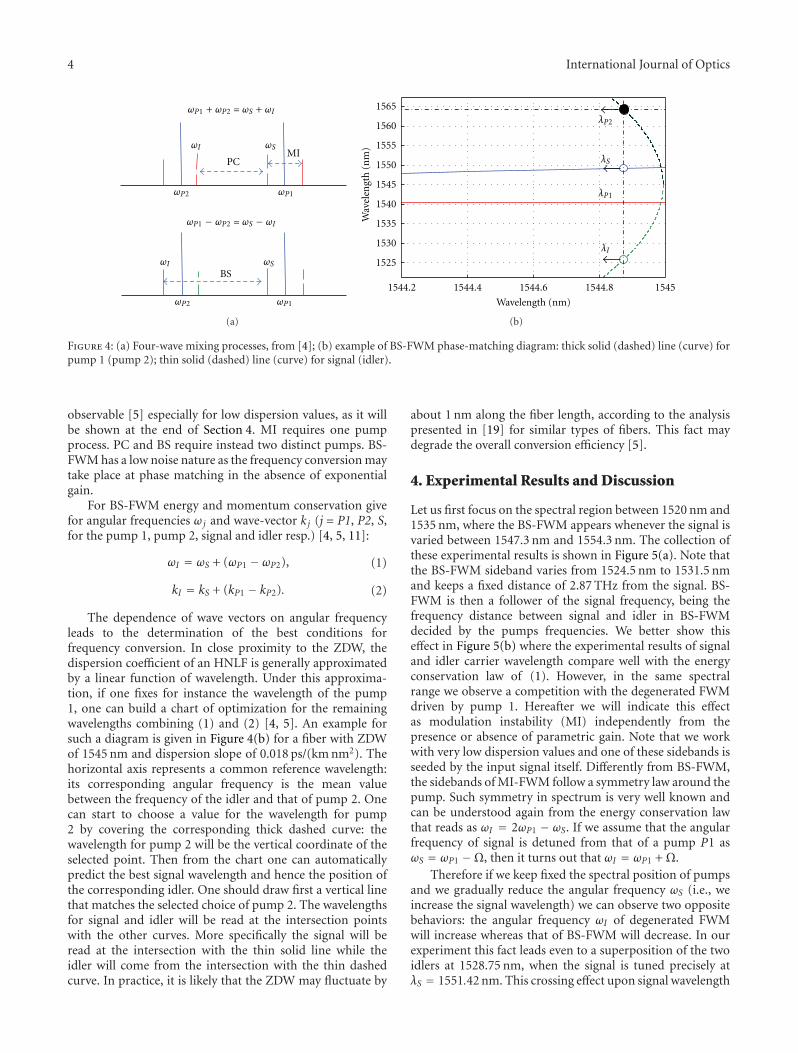
4 International Journal of Optics
ωP1 + ωP2 = ωS + ωI
PC
BS
ωI ωSMI
ωP1ωP2
ωP1 − ωP2 = ωS − ωI
ωSωI
ωP1ωP2
(a)
1544.2 1544.4 1544.6 1544.8 1545
1525
1530
1535
1540
1545
1550
1555
1560
1565
λI
λP1
λS
λP2
Wavelength (nm)
Wav
elen
gth
(nm
)
(b)
Figure 4: (a) Four-wave mixing processes, from [4]; (b) example of BS-FWM phase-matching diagram: thick solid (dashed) line (curve) forpump 1 (pump 2); thin solid (dashed) line (curve) for signal (idler).
observable [5] especially for low dispersion values, as it willbe shown at the end of Section 4. MI requires one pumpprocess. PC and BS require instead two distinct pumps. BS-FWM has a low noise nature as the frequency conversion maytake place at phase matching in the absence of exponentialgain.
For BS-FWM energy and momentum conservation givefor angular frequencies ωj and wave-vector k j (j = P1, P2, S,for the pump 1, pump 2, signal and idler resp.) [4, 5, 11]:
ωI = ωS + (ωP1 − ωP2), (1)
kI = kS + (kP1 − kP2). (2)
The dependence of wave vectors on angular frequencyleads to the determination of the best conditions forfrequency conversion. In close proximity to the ZDW, thedispersion coefficient of an HNLF is generally approximatedby a linear function of wavelength. Under this approxima-tion, if one fixes for instance the wavelength of the pump1, one can build a chart of optimization for the remainingwavelengths combining (1) and (2) [4, 5]. An example forsuch a diagram is given in Figure 4(b) for a fiber with ZDWof 1545 nm and dispersion slope of 0.018 ps/(km nm2). Thehorizontal axis represents a common reference wavelength:its corresponding angular frequency is the mean valuebetween the frequency of the idler and that of pump 2. Onecan start to choose a value for the wavelength for pump2 by covering the corresponding thick dashed curve: thewavelength for pump 2 will be the vertical coordinate of theselected point. Then from the chart one can automaticallypredict the best signal wavelength and hence the position ofthe corresponding idler. One should draw first a vertical linethat matches the selected choice of pump 2. The wavelengthsfor signal and idler will be read at the intersection pointswith the other curves. More specifically the signal will beread at the intersection with the thin solid line while theidler will come from the intersection with the thin dashedcurve. In practice, it is likely that the ZDW may fluctuate by
about 1 nm along the fiber length, according to the analysispresented in [19] for similar types of fibers. This fact maydegrade the overall conversion efficiency [5].
4. Experimental Results and Discussion
Let us first focus on the spectral region between 1520 nm and1535 nm, where the BS-FWM appears whenever the signal isvaried between 1547.3 nm and 1554.3 nm. The collection ofthese experimental results is shown in Figure 5(a). Note thatthe BS-FWM sideband varies from 1524.5 nm to 1531.5 nmand keeps a fixed distance of 2.87 THz from the signal. BS-FWM is then a follower of the signal frequency, being thefrequency distance between signal and idler in BS-FWMdecided by the pumps frequencies. We better show thiseffect in Figure 5(b) where the experimental results of signaland idler carrier wavelength compare well with the energyconservation law of (1). However, in the same spectralrange we observe a competition with the degenerated FWMdriven by pump 1. Hereafter we will indicate this effectas modulation instability (MI) independently from thepresence or absence of parametric gain. Note that we workwith very low dispersion values and one of these sidebands isseeded by the input signal itself. Differently from BS-FWM,the sidebands of MI-FWM follow a symmetry law around thepump. Such symmetry in spectrum is very well known andcan be understood again from the energy conservation lawthat reads as ωI = 2ωP1 − ωS. If we assume that the angularfrequency of signal is detuned from that of a pump P1 asωS = ωP1 −Ω, then it turns out that ωI = ωP1 + Ω.
Therefore if we keep fixed the spectral position of pumpsand we gradually reduce the angular frequency ωS (i.e., weincrease the signal wavelength) we can observe two oppositebehaviors: the angular frequency ωI of degenerated FWMwill increase whereas that of BS-FWM will decrease. In ourexperiment this fact leads even to a superposition of the twoidlers at 1528.75 nm, when the signal is tuned precisely atλS = 1551.42 nm. This crossing effect upon signal wavelength

International Journal of Optics 5
1520
1525
1530
1535
1548
15501552
1554
−60
−50
−40
λS (nm)Po
wer
(dB
)
expe
rim
ent
−56
−54
−52
−50
−48
−46
−44
BS
MI
Max conversionfor BS-idler
Wavelength (nm)
(dB
)
(a)
1547 1548 1549 1550 1551 1552 1553 1554 1555
1524
1526
1528
1530
1532
λI
(nm
)
λS (nm)
(b)
Figure 5: (a) Collection of experimental spectra upon different input signal wavelengths; (b) BS-FWM idler wavelength upon signalwavelength; dots: experimental results; solid line: equation (1).
is also shown in Figure 5(a). The coexistence of these twoparametric processes and their tiny frequency separationshould be then considered carefully in applications. Note thatpump 1 is very close to the ZDW and a selection rule ofparametric processes, based on phase mismatch may becomeless effective in practice.
As we show in Figure 6(a), we obtained in our exper-iment 16 dB from the background noise level at the idlercentral wavelength for the case of maximally efficient BS-FWM. Note that in our spectral measurements we setto 1 kHz the video bandwidth digital filter of the opticalspectrum analyzer. The maximum conversion is found fora signal at 1550.3 nm. The discrepancy from phase matching(1549.8 nm) may be due to uncertainties in the dispersionparameters of the fiber and to the fluctuation in ZDWalong the beam propagation in the fiber [5], as we havealready mentioned. We obtained a depletion of the signalof about 1 dB and a ratio between the spectral peak of theidler and that of the signal of the signal of −20 dB: thisresult is much lower than that reported in [5] for the caseof coherent pumps with direct phase modulation. This ismainly due to the difference in fiber parameters and choiceof wavelengths. Additionally note that the experiments showthat the idler is spectrally broadened as it comes froma combination of broadband pumps and a narrowbandsignal [6]. In the experiments we estimated the 3 dBbandwidths of pumps as 20 GHz and 44 GHz for IFSL 1and 2, respectively, (our spectrum analyzer has a minimum
resolution of 0.05 nm which correspond to 6.24 GHz at thesewavelengths). We experimentally obtained a 57 GHz wideBS-idler at 1527.8 nm and for a signal wavelength λS =1550.3 nm.
Note that in our experiment we can shift the signal withinthe relatively wide spectral range and still obtain efficientBS-idler generation (see Figure 5(b)). This effect may bepotentially applicable for the simultaneous conversion of alarge spectrum. In our case, the conversion efficiency BS-FWM varies by less than 3 dB when the signal is tuned by9 nm.
Let us now report on the case of the two externalsidebands (see a and b in Figure 6(b)). By using the word“spontaneous” in the label, we mean that these sidebandsare directly generated by the two pumps and they do notrequire a third signal to appear. Their spectral position isentirely due to the spectral positions of pumps: with respectto pump 1 (pump 2), sideband a (b) is at the same frequencydetuning of pump 2 (pump 1). Because of the low dispersionof the fiber and relatively high intensity of pumps, sidebandsa and b have large amplitudes. Note that the amplitude ofthe left-side spontaneous FWM idler (see a in Figure 6(b)) islarger than that of the right-side one (see b in Figure 6(b)).There are also some additional frequency conversion effects.Since their appearance is strongly connected to the fineadjustment of the working points of IFSFLs, we report ourbest observation in Figure 7. More specifically we observedthe signature of MI-FWM around pump 2 and PC-FWM.

6 International Journal of Optics
1510 1520 1530 1540 1550 1560 1570 1580 1590
−50
−40
−30
−20
−10
0
Signal
Pump 1 Pump 2
20 dB
BS
16 dB
Wavelength (nm)
Pow
er(d
B)
(a)
SpontaneousFWM
b
a
1510 1520 1530 1540 1550 1560 1570 1580 1590
−50
−40
−30
−20
−10
0Pump 1 Pump 2
Wavelength (nm)
Pow
er(d
B) Spontaneous
FWM
expe
rim
ent
(b)
Figure 6: (a) experimental output spectrum obtained for the signal wavelength at 1550.3 nm: maximal conversion of BS-FWM; phase-matching conditions for BS-FWM. (b) experimental output with two pumps only.
BS
1510 1520 1530 1540 1550 1560 1570 1580 1590
Wavelength (nm)
−50
−40
−30
−20
−10
0
Pow
er(d
B)
SpontaneousFWM
Pump 1 Pump 2
SpontaneousFWM
BS MI
Signal
PC
(a)
1510 1520 1530 1540 1550 1560 1570 1580 1590
Wavelength (nm)
−50
−40
−30
−20
−10
0
Pow
er(d
B)
SpontaneousFWM
Pump 1 Pump 2
SpontaneousFWM
BS MI
Signal
PCMI
(b)
Figure 7: Experimental output spectrum obtained for signal wavelength at 1547.3 nm (a) and 1556.3 nm (b); existence of multiplesimultaneous FWM processes.
We also observed another kind of BS-FWM that comesfrom the subtraction instead of the sum of the beatingfrequency of 2.87 THz (BS′). The conversion efficiencies ofthese last processes remain low, probably due to the largephase mismatch. We show in Figure 7 two output spectrataken with a signal at 1547.3 nm (a) and 1556.3 nm (b).
5. Conclusion
In this paper, we studied BS-FWM in HNLF with a novelcost-effective and partially coherent pumping scheme. Weexperimentally demonstrated efficient and tunable BS-FWMdespite the large bandwidth of the pumps and their completestatistical independence. The spectral peak of the convertedBS-FWM is 20 dB below that of the original signal and 16 dBabove the background noise level. We noted coexistenceof multiple independent FWM processes. In particular, weobserved a relevant competition BS-FWM and MI-FWM.Our measurements agree well with a theoretical analysisbased on the phase-matching diagram for the case ofmonochromatic waves. In conclusion, nonlinear fiber optics
frequency converters based on broadband pumps appear tobe promising for their implementation in all-optical signalprocessing devices.
Acknowledgments
The authors acknowledge the financial support from theRegion Limousin and from the French National ResearchAgency under Grant ANR-08-JCJC-0122 PARADHOQS.They thank Alain Dexet for his assistance in manufacturingsome of the mechanical parts used in the experiment.
References
[1] C. J. McKinstrie, S. Radic, and A. R. Chraplyvy, “Parametricamplifiers driven by two pump waves,” IEEE Journal onSelected Topics in Quantum Electronics, vol. 8, no. 3, pp. 538–547, 2002.
[2] R. Slavık, F. Parmigiani, J. Kakande et al., “All-optical phaseand amplitude regenerator for next-generation telecommuni-cations systems,” Nature Photonics, vol. 4, no. 10, pp. 690–695,2010.

International Journal of Optics 7
[3] J. Hansryd, P. A. Andrekson, M. Westlund, J. Li, and P.O. Hedekvist, “Fiber-based optical parametric amplifiers andtheir applications,” IEEE Journal on Selected Topics in QuantumElectronics, vol. 8, no. 3, pp. 506–520, 2002.
[4] D. Mechin, R. Provo, J. D. Harvey, and C. J. McKinstrie, “180-nm wavelength conversion based on Bragg scattering in anoptical fiber,” Optics Express, vol. 14, no. 20, pp. 8995–8999,2006.
[5] R. Provo, S. Murdoch, J. D. Harvey, and D. Mechin, “Braggscattering in a positive β4 fiber,” Optics Letters, vol. 35, no. 22,pp. 3730–3732, 2010.
[6] Y. Yan and C. Yang, “Four-wave mixing between coherentsignal and incoherent pump light in nonlinear fiber,” Journalof Lightwave Technology, vol. 27, no. 22, pp. 4954–4959, 2009.
[7] D. Nodop, D. Schimpf, J. Limpert, and A. Tunnermann, “SBSsuppression in high power fiber pulse amplifiers employing asuperluminescence diode as seed source,” in Proceedings of theConference on Lasers and Electro-Optics (CLEO EUROPE ’11),Munich, Germany, May 2011, paper CJ7.6 THU.
[8] A. H. Gnauck, R. M. Jopson, C. J. McKinstrie, J. C. Centanni,and S. Radic, “Demonstration of low-noise frequency conver-sion by Bragg Scattering in a Fiber,” Optics Express, vol. 14, no.20, pp. 8989–8994, 2006.
[9] S. Radic, R. M. Jopson, A. Gnauck, C. J. McKinstrie, J.C. Centanni, and A. R. Chaplyvy, “Stimulated-brillouin-scattering supression using a single modulator in two-pumpparametric architectures,” in Proceedings of the Optical FiberCommunication Conference (OFC ’05), Anaheim, Calif, USA,March 2005, paper OWN5.
[10] J. Schroder, A. Boucon, S. Coen, and T. Sylvestre, “Interplay offour-wave mixing processes with a mixed coherent-incoherentpump,” Optics Express, vol. 18, no. 25, pp. 25833–25838, 2010.
[11] H. J. McGuinness, M. G. Raymer, C. J. McKinstrie, andS. Radic, “Quantum frequency translation of single-photonstates in a photonic crystal fiber,” Physical Review Letters, vol.105, no. 11, Article ID 093604, 2010.
[12] Y. Yan and Y. Changxi, “Coherent light wave generated fromincoherent pump light in nonlinear kerr medium,” Journal ofthe Optical Society of America B, vol. 26, no. 11, pp. 2059–2063,2009.
[13] H. G. Chatellus and J.-P. Pique, “Coherence properties ofmodeless lasers,” in Proceedings of the Science, Quantum ofQuasars Workshop, Grenoble, France, December 2009.
[14] L. P. Yatsenko, B. W. Shore, and K. Bergmann, “Coherencein the output spectrum of frequency shifted feedback lasers,”Optics Communications, vol. 282, no. 2, pp. 300–309, 2009.
[15] L. P. Yatsenko, B. W. Shore, and K. Bergmann, “An intuitivepicture of the physics underlying optical ranging usingfrequency shifted feedback lasers seeded by a phase-modulatedfield,” Optics Communications, vol. 282, no. 11, pp. 2212–2216,2009.
[16] P. A. Champert, V. Couderc, and A. Barthelemy, “1.5-2.0-μmmultiwatt continuum generation in dispersion-shifted fiberby use of high-power continuous-wave fiber source,” IEEEPhotonics Technology Letters, vol. 16, no. 11, pp. 2445–2447,2004.
[17] K. Nakamura, T. Miyahara, and H. Ito, “Observation of ahighly phase-correlated chirped frequency comb output froma frequency-shifted feedback laser,” Applied Physics Letters, vol.72, no. 21, pp. 2631–2633, 1998.
[18] M. Stellpflug, G. Bonnet, B. W. Shore, and K. Bergmann,“Dynamics of frequency shifted feedback lasers: Simulationstudies,” Optics Express, vol. 11, no. 17, pp. 2060–2080, 2003.
[19] B. Auguie, A. Mussot, A. Boucon, E. Lantz, and T. Sylvestre,“Ultralow chromatic dispersion measurement of optical fiberswith a tunable fiber laser,” IEEE Photonics Technology Letters,vol. 18, no. 17, pp. 1825–1827, 2006.

Hindawi Publishing CorporationInternational Journal of OpticsVolume 2012, Article ID 418469, 13 pagesdoi:10.1155/2012/418469
Research Article
Multiple-Pulse Operation and Bound States of Solitons inPassive Mode-Locked Fiber Lasers
A. Komarov,1 F. Amrani,2 A. Dmitriev,1 K. Komarov,3 D. Meshcheriakov,1, 3 and F. Sanchez2
1 Department of Laser Systems, Novosibirsk State Technical University, 630092 Novosibirsk, Russia2 Laboratoire de Photonique d’Angers EA 4644, Universite d’Angers, 49000 Angers, France3 Institute of Automation and Electrometry, Russian Academy of Sciences, 630090 Novosibirsk, Russia
Correspondence should be addressed to A. Komarov, [email protected]
Received 3 May 2011; Accepted 25 July 2011
Academic Editor: Sonia Boscolo
Copyright © 2012 A. Komarov et al. This is an open access article distributed under the Creative Commons Attribution License,which permits unrestricted use, distribution, and reproduction in any medium, provided the original work is properly cited.
We present results of our research on a multiple-pulse operation of passive mode-locked fiber lasers. The research has beenperformed on basis of numerical simulation. Multihysteresis dependence of both an intracavity energy and peak intensities ofintracavity ultrashort pulses on pump power is found. It is shown that the change of a number of ultrashort pulses in a lasercavity can be realized by hard as well as soft regimes of an excitation and an annihilation of new solitons. Bound steady statesof interacting solitons are studied for various mechanisms of nonlinear losses shaping ultrashort pulses. Possibility of coding ofinformation on basis of soliton trains with various bonds between neighboring pulses is discussed. The role of dispersive waveemitted by solitons because of lumped intracavity elements in a formation of powerful soliton wings is analyzed. It is foundthat such powerful wings result in large bounding energies of interacting solitons in steady states. Various problems of a solitoninteraction in passive mode-locked fiber lasers are discussed.
1. Introduction
Lasers generating ultrashort optical pulses are widely em-ployed in diversified areas of science, technology, andengineering [1–7]. Applications of such lasers range fromtesting of ultrahigh speed semiconductor devices to precisionprocessing of materials, from triggering of tracing chemicalreactions to sophisticated surgical applications in medicine.These lasers are used for study of ultrahigh speed processes inatomic and molecular physics, in solid-state physics, and inchemistry and biology. They are employed for investigationof light-matter interactions under ultrahigh intensity levels.Lasers of ultrashort optical pulse with a high repetition rateare a key element in high-speed optical communications.Ultrashort pulse lasers are extensively used for micromachin-ing, biomedical diagnostic, in light detection, and ranging(lidar) systems, and so forth.
The great diversity of applications of ultrashort pulselasers calls for further development and perfection of thistype of quantum generators. At the present time, one of mainways for creation of perfect ultrashort pulse sources is related
to passive mode-locked fiber lasers [8–16]. Nonlinear lossesforming ultrashort pulses in fiber lasers are usually realizedby the nonlinear polarization rotation technique. Theselasers have unique potentialities. They are reliable, compact,flexible, and of low cost. Such generators can be convenientlypumped with commercially available semiconductor lasers.The nonlinear losses based on the nonlinear polarizationrotation technique are fast, practically inertia-free. For them,the depth of the modulation and the saturating intensity areeasily controlled through the orientation angles of intracavityphase plates. The great variety of operating regimes isan important feature of this type of lasers. Indeed, theselasers have demonstrated bistability between continuouswave and mode-locking regimes, spike operation, and Q-switching [17, 18]. They can operate either with a singlepulse in the laser cavity or in a multiple-pulse regime.The latter is connected with the effect of a quantizationof intracavity lasing radiation into individual identicalsolitons [17–21]. Lasers operating in multiple-pulse regimesdemonstrate multistability: the number of pulses in anestablished operation depends on initial conditions [17, 20].
2 International Journal of Optics
The dependence of the number of pulses on pumping andon orientation angles exhibits hysteresis phenomena [22].Analogical regimes are realized in lasers with another mecha-nisms of nonlinear losses (semiconductor saturable absorbermirror (SESAM), saturable absorbers based on quantumdots, carbon nanotubes, graphene, and so on [23–25]).
The type of a soliton interaction plays a crucial rolein the established multiple-pulse regimes of fiber lasers[26–30]. In the case of pulse attraction, bound solitonsstructures can be formed. Such structures were theoreticallyand experimentally investigated by many authors [11, 13, 16,26, 28, 30–32]. Possibility of a realization of strong bondsbetween solitons (∼10% of an individual soliton energy) wasfound in the paper [33]. As this takes place, steady states ofpair interacting solitons form a two-soliton molecule witha set of energy levels corresponding to various types ofbonds between pulses. With a use of this effect, the high-stable noise-proof information sequences of bound solitonscan be realized. In such sequences, a high-density coding ofthe information is realized through various distributions ofdifferent energy bonds along the soliton chains.
A long-distance mechanism of repulsion of ultrasortpulses results in the regime of harmonic passive mode-locking [34–37] (the regime of a multiple-pulse generation inwhich distances between all neighboring pulses take the samevalue). The harmonic passive mode-locked fiber lasers are ofgreat interest as ultrashort optical pulse sources with a highrepetition rate which are employed in high-speed opticalcommunications. This lasing regime can be also realized onbasis of a sequence of bound solitons with a single type ofa bond between neighboring pulses which fills completelya total laser resonator. In this case, the expected rate ofrepetition of ultrashort pulses in the output laser radiationis of the order of inverse ultrashort pulse duration and canlay in the terahertz frequency range for subpicosecond pulses[38, 39].
A quantization of intracavity radiation into individualidentical solitons is a useful phenomenon for a creation ofultrashort pulse generators with a high rate of a repetition ofultrashort pulses. The greater number of pulses in laser cavityresults in the greater rate of the repetition of pulses in outputradiation. However, this phenomenon is a serious obstaclefor creation of generators with high energy of individualpulses. Really, in consequence of this phenomenon, anincrease of pumping results in an increase in number ofpulses in the laser resonator, thus the energy of an individualpulse remains approximately as before.
The effective control of intersoliton interactions opensnew opportunities for management of generation regimes offiber lasers. For realization of such control, it is necessary toknow the properties of soliton interaction at a fundamentallevel. In this paper, we present our results on a formationof multiple-pulse regimes connected with interaction oflasing solitons through a gain medium, inertia-free nonlinearlosses, and a nonlinear refractive index. The paper containsthe original results on the multihysteresis dependence ofthe lasing energy characteristics (a total energy of anintracavity radiation, peak intensities of individual solitons,an amplification coefficient, etc.) on pumping, the results
System ofnonlinear losses
Pumppower
Optical fiber
Figure 1: Schematic representation of the investigated ring passivemode-locked fiber laser.
on the realization of hard and soft regimes of excitationand annihilation of solitons in a laser cavity under multiple-pulse operation, and the results on an interaction of solitonsthrough dispersive waves (these waves are emitted by solitonsbecause of lumped elements in a laser cavity). For acompleteness of a description of these phenomena, we alsodiscuss earlier our results on the given subjects (a solitonquantization, information ultrashort pulse trains in fiberlasers with the nonlinear polarization rotation technique,etc.).
This paper is organized as follows. In Section 2, wepresent the results on multihysteresis phenomena due to acompetition and a coexistence of solitons in a laser cavity.Section 3 is devoted to bound steady states related withthe interaction of solitons through an interference of theirwings in a intracavity medium with fast nonlinear lossesand Kerr nonlinearity of refractive index. In Section 4, weanalyze the interaction of solitons in fiber laser with lumpedsaturable absorber. Section 5 is devoted to mechanisms ofa realization of powerful long-distance soliton wings whichare connected with dispersive waves emitted by solitonsbecause of lumped intracavity elements. Such powerfulwings result in a strong intersoliton interaction with greatbound energies. In Section 6, we discuss the presentedresults. The most important ones from them are presentedin Section 7.
2. Multiple-Pulse Operation and HysteresisPhenomena in Fiber Lasers
The laser under investigation is schematically representedin Figure 1. The system forming nonlinear losses through anonlinear polarization rotation technique was described indetail in [20]. For isotropic fiber, it involves all necessaryelements for the polarization control. In this system, aradiation passes sequentially through the first quarter waveplate, the second half wave plate, the polarizer, and the thirdquarter wave plate. The space orientation of the three phaseplates is determined by the angles α1, α2, α3, respectively(αi is an angle of one eigenaxis of a corresponding platewith respect to the passing axis of the polarizer). Afterthe polarizing isolator, the electric field has a well-definedlinear polarization. Such state of polarization does notexperience polarization rotation in the fiber because therotation angle is proportional to the area of the polarizationellipse. Consequently, it is necessary to place the third

International Journal of Optics 3
quarter wave plate after the polarizer which transformsthe linear polarization into the elliptic one. The rotationof the polarization ellipse resulting from the optical Kerrnonlinearity is proportional to the light intensity, the area ofthe polarization ellipse, and the fiber length. At the outputof the fiber, the direction of the elliptical polarization of thecentral part of the pulse can be rotated towards the passingaxis of the polarizer by the second half wave plate. Then, thiselliptical polarization can be transformed into a linear oneby the first quarter wave plate. In this situation, the lossesfor the central part of the pulse are minimized while thewings undergo strong losses. The evolution of the radiationin the investigated laser is described by the following set ofequations [20]:
∂E
∂ζ= (Dr + iDi)
∂2E
∂τ2+(G + iq|E|2
)E, (1)
En+1(τ) = −η[cos
(pIn + α0
)cos(α1 − α3)
+i sin(pIn + α0
)sin(α1 + α3)
]En(τ),
(2)
where E(ζ , τ) is the electric field amplitude, τ is a time
coordinate expressed in units δt =√|β2|L/2 (here β2 is
the second-order group-velocity dispersion for fiber and Lis the fiber length), ζ is the normalized propagation distanceζ = z/L, Dr and Di are the frequency dispersions for a gain-loss and for a refractive index, respectively, and q is the Kerrnonlinearity. The term G in the second parenthesis in (1)describes the saturable amplification
G = a
1 + bJ, (3)
where J = ∫ |E|2dτ is the total energy of the intracavityradiation (the integration is carried out on the whole round-trip period), a is the pumping parameter, and b is thesaturation one). The second term in these parentheses isconnected with Kerr nonlinearity of the fiber. Equation (2)determines the relation between the time-distributions ofthe field before and after n-th pass of radiation through thepolarizer (η is the transmission coefficient of the intracavitypolarizer). Parameters α0, I , p are determined by relationsα0 = 2α2 − α1 − α3, I = |E|2, p = sin(2α3)/3. The amplitudeE(τ) is subject to periodic boundary conditions with periodequal to one round trip.
The numerical procedure starts from the evaluation ofthe electric field after passing through the Kerr medium,the phase plates, and the polarizer, using (2). The resultingelectric field is then used as the input field to solve (1) over adistance L, using a standard split-step Fourier algorithm. Thecomputed output field is used as the new input for (2). Thisiterative procedure is repeated until a steady state is achieved.For the numerical simulations, we use typical parameters ofytterbium- and erbium-doped fiber lasers operating in thenormal and anomalous dispersion regimes.
Figure 2 shows the distribution of radiation in a laserresonator I(τ) as the function of a number of passes ofthe field through the cavity ζ . After a transient process, the
I
4096
8192
0
5
10
1520
0
5
10
0
5
10
ζ
τ
Figure 2: Transient evolution of the field in the fiber laser. Thetemporal distribution of the intracavity intensity I(τ) versus theround-trip number ζ . a = 3, b = 0.017, q = 1, Di = −1,Dr = Dr0G,Dr0 = 0.34, α0 = −1.1, α3 = −α1 = 0.2.
stationary operation with identical pulses is realized. Thedifference in the peak intensities of initial pulses models arandom spread in amplitudes of pulses of an initial noiseradiation. Figure 3 demonstrates the number of identicalpulses in a laser cavity in the established stationary operationas the function of pumping a. With changing pump athe pulses are created and annihilated one by one. Thecorresponding changes in the intracavity radiation energyJ , in the peak intensity of intracavity identical pulses I0,and in the amplification G are shown in Figures 4, 5,and 6, respectively. The vertical arrows in these figuresare connected to a change of a number of pulses N inthe laser resonator that is due to a change of pumpinga (see Figure 3). From the dependences I0 = I0(a) andG = G(a) (see Figures 5 and 6), we obtain the dependenceG = G(I0). The total amplification of a steady-state pulseconsists of two parts. The first part is due to the gainG(I0). The second part Λ is due to nonlinear losses and adispersion of intracavity elements. In stationary regime, thetotal amplification is equal to zero, that is Λ = −G(I0).The dependence of nonlinear-dispersion part Λ of the totalamplification coefficient for an individual soliton as thefunction of its peak intensity I0 is presented in Figure 7.This dependence is a key factor determining a competitionand a coexistence of solitons in an established stationaryregime. In the interval I0 < Icr2, the dependence Λ = Λ(I0)is monotonously increasing. Here, the pulse with a greaterpeak intensity I0 has a greater amplification Λ. As a resultof the soliton competition, no multiple-pulse regimes isrealized. After a transient process, the generation with singlesoliton in a laser cavity is established. In the interval Icr2 <I0 < Icr1, a multiple-pulse generation is possible. Here, thepulse with a greater peak intensity I0 has a less amplificationΛ. As a result, after transient process, all pulses in a lasercavity have the same peak intensity I0 and the same otherparameters (a duration, an energy, a chirp, and so on). Itis, so-called, the effect of quantization of a laser radiationon identical solitons. When, with decreasing pump a, thepeak intensity of identical pulses I0 reaches the value Icr2

4 International Journal of Optics
0 1 2 3 4 50
1
2
3
4
5
6
N
a
Figure 3: Multihysteresis dependence of the number of pulses N inestablished stationary operation on pumping a.
0 1
1
2
2
3
3
4
4
5
5
a
0
100
200
300
400
J
6
Figure 4: Dependence of the intracavity radiation energy J inestablished operation on pumping a. Digits indicate a number ofpulses in a laser cavity for a corresponding branch.
the pulses disappear one by one as one can see in Figure 3(the left step dependence N = N(a)). To the contrary, when,with increasing pump, the peak intensity of identical pulsesreaches the value Icr1, new pulses appear in the cavity oneby one (the right step dependence in Figure 3). They areformed from weak seed pulses of a radiation noise. As arule, the solitons appear and disappear by a threshold way(hard excitation and annihilation of the solitons [40]). Thatis, a peak intensity of each soliton is changed by a jumpfrom 0 to I0 and from I0 to 0 (see Figure 5). However, thesoft regime of excitation and annihilation of solitons [40] (acontinuous change of the peak intensity with continuouslychanging pump a) is also possible. Figure 8 demonstratesthe examples of the two types of changes in the secondpulse (the first pulse already exists in the laser resonator).The corresponding dependences Λ = Λ(I0) are presented inFigure 9. The soft excitation and annihilation of pulses arerealized if the slope of the decreasing part of the dependenceΛ = Λ(I0) is greater than the slope of the increasing one.
It should be pointed out that the dependence Λ = Λ(I0)determines the phase relations of interacting solitons inbound steady states: for peak intensities in the vicinity of top
0 1
1
2
2
3
3
4
4
5
5 6
a
0
2
4
6
8
I 0
Figure 5: Dependence of the peak intensity I0 of intracavityidentical pulses in established operation on pumping a.
00
0.2
0.4
0.6
0.8
1
1
1
2
2
3
3
4
4
5
5
a
G 6
Figure 6: Dependence of the gain G on pumping a.
6 8−0.86
−0.76
−0.66
−0.56
Λ
Icr1Icr2Ith
0 2 4I0
Figure 7: Dependence of the nonlinear-dispersion part of ampli-fication for intracavity pulses Λ on their peak intensity I0. Thefragment of an unstable single-pulse generation is shown as adashed line. The value Icr2 corresponds maximum Λ = Λ(I0).Λ(Icr1) = Λ(0).

International Journal of Optics 5
0 1
1
2 3 40
2
4
6 Icr1
Icr2
ath ath2 ath1
I
a
0
1, 2
(a)
0 1
1
2
2
3 40
0.5
1
Icr1
Icr2
ath ath2ath1
I
a
0
1, 2
(b)
Figure 8: Dependences of the peak intensities I0 for two intracavity pulses in established operation on pumping a for hard (a) and soft (b)regimes of excitation and annihilation of the second soliton. The dependences I0 = I0(a) for first and second pulses are denoted by digits 1and 2, respectively.
00
1.5
0.1
0.2
0.3
3 4.5 6
Λ
I0
Icr1Icr2
I0w I0s
(a)
00
0.5
0.02
0.04
1
Λ
I0
Icr1Icr2
I0wI0s
(b)
Figure 9: Dependences of the nonlinear-dispersion part of amplification Λ for intracavity pulses on their peak intensity I0 for hard (a) andsoft (b) regimes of excitation and annihilation of the second soliton.
of this dependence, as a rule, the phase difference is closeto π/2, whereas far from the top (the decreasing part of thedependence), as a rule, the phase difference is close to 0 or π(see Section 3).
3. Bound Steady States of Interacting Solitons
In the previous section, we have studied phenomena whichare related with the interaction of solitons through thegain medium in a condition of fast nonlinear losses andKerr nonlinearity of refractive index. For these phenomena,the interaction of solitons due to an interference of theirwings is insignificant (if the distances between pulses issufficiently large, then the interference effects are weak). Inthis section, we study the soliton interaction which is dueto an interference of their wings in conditions of the fastcomplex nonlinearity of intracavity elements.
3.1. Steady States of Pair Bound Solitons. In this section, forour numerical simulation, we have used typical parameters
of Er-doped fiber laser with anomalous net dispersion ofgroup velocity. Figure 10 demonstrates the temporal andspectral profiles of a single soliton. Figure 10(a) shows alsothe change in a phase along the pulse. The soliton haspowerful wings which result in large energy bounding pairinteracting solitons.
Because of the interaction between solitons, the pair ofsuch solitons is united in the stability formation with a largebinding energy—highly-stable “two soliton molecule.” Theradiation energy of such molecule is less than the energyof two solitons placed from each other on a long distance.The binding energy for two solitons in this molecule takesthe discrete set of values shown on Figure 11. Large bindingenergies for the low-energy steady states are due to powerfulwings of solitons. These steady states are stable.
For the ground steady-state (the first energy level) andfor the all odd levels, the field functions are antisymmetricEk(τ) = −Ek(−τ) if the origin of the coordinate τ = 0corresponds to the point equally spaced from the peaksof the solitons. In this case, the peaks amplitudes of two

6 International Journal of Optics
−120 −90 −60 −30 0
0
30 60 90 120−2
0
2
4
6
I
τ
(a)
−256 0 2560
200
400
I A
A
(b)
Figure 10: Temporal (a) and spectral (b) distributions of radiation for the single-soliton passive mode-locking. The upper right inset in (a)shows the multiplied soliton pedestal. The change of the phase along the pulse is presented in (a). All phase magnitudes are reduced to theinterval (−π, +π). In the point of the pulse with a maximum amplitude, the phase is equal to zero. The black squares and circles correspondto the points of the pulse where its phase is equal to π and 0, correspondingly.
−28
−24
−20
−16
−12
−8
−4
0
J(%
)
1
2
34
Figure 11: Binding energy of two solitons in stable steady states Jexpressed in relative units (the binding energy divided by the energyof a single soliton). The laser parameters are the same as in the caseof Figure 10.
solitons are in opposite phase (δϕ ≈ π). For all even steadystates, the field functions are symmetric Ek(τ) = Ek(−τ)and the peak amplitudes of two solitons have the same phase(δϕ ≈ 0). Figures 12(a), 12(b), and 12(c) show the temporaldistributions of intensities in the two-soliton molecule forthe cases of the ground steady state (the minimal distance d1
between solitons) and for the first and second excited steady-states (the distances between solitons approximately equalsthe double and triple minimal one d1, resp.). In the cases ofthe ground (k = 1) and second excited (k = 3) states, theintensity is equal to zero in the center point between solitons.For the first excited state k = 2, the intensity in this pointis distinct from zero. Figures 12(d), 12(e), and 12(f) showthe spectral profiles of the two-soliton molecule. They aresymmetric. For odd states, the center spectral componentis equal to zero. For even states, it is maximum. For usedlaser parameters, as indicated above, all steady states of the
pair interacting solitons are stable. That is, the two solitonmolecule is multistable.
In the bound steady states, the second soliton in the twosoliton molecule is arranged in the space point where the firstsoliton has the phase equal to 0 or π (see Figure 10(a)). Undersuch arrangement, the peak amplitude of one pulse andthe wing amplitude of other pulse have the opposite-phaseinterference. For such interference, the peak intensities ofthe pulses are decreased and their amplification coefficientsbecome larger (see the dependence Λ = Λ(I0) for I0 > Icr2presented in Figures 7 and 9). We have also obtained thephase difference for the pair pulses equal to π/2. In this case,the peak intensity was in vicinity of the maximum of thedependence Λ = Λ(I0) (I0 is close to Icr2). As this takes place,for one pulse, the opposite-phase interference is realized, forthe other, the in-phase one is done [33].
3.2. Information Sequences of Bound Solitons. One of theusual way of coding the information for its transfer throughoptical communication fiber lines consists in the following.In equidistant initial sequences of pulses, some pulses areremoved. It arises two positions (a pulse is present, and apulse is absent) which are required for the coding of theinformation in binary system (zero and unit). Displacementand merge of pulses in such information pulse sequences,that is due to various types of technical perturbationsincluding noise radiation, results in loss of the information.There are various ways of increase of a tolerance to theseperturbations. Among them, there is an increase in distancebetween the neighboring pulses in initial pulse sequence.However, this way results in the decrease in the speedof a transfer of information. In this section, we considerthe nonlinear regime of propagation of pulse informationsequences. The interaction of neighboring pulses results inthe stabilization of this sequence. Because various types ofbonds between neighboring pulses can be realized, accord-ingly, the coding of the information in such sequences can
International Journal of Optics 7
6
256 5120
0
3I 1
6
0
3I 2
6
0
3I 3
d1
δϕ = π
2d1
δϕ = 0
3d1
τ
256 5120τ
256 5120τ
(a)
(b)
(c)
δϕ = π
−256 0 2560
400
800
A
I A1
(d)
−256 0 2560
800
1600
A
I A2
−256 0 2560
800
A
I A3
(e)
(f)
1600
Figure 12: Temporal and spectral distributions of intensity of the two-soliton molecule (a), (d) for the ground steady state (minimal distanced1 between solitons), (b), (e) for the first excited steady state, and (c), (f) for the second excited steady state. All steady states are stable. Thelaser parameters are the same as in the case of Figure 10.
be realized through various distributions of types of bondsbetween neighboring pulses along a soliton train. Thanks topowerful wings, the binding energy for such solitons appearshigh, that provides the high degree of tolerance againstvarious perturbations in the case of such sequences. Densepacking of pulses in such sequence provides high speed oftransfer information. Due to large binding energies, suchmultisoliton molecules are highly stable and noise-proof.Placing several initial pulses on certain distances from eachother, after transient process, we have obtained stationary“molecular chains” with any desirable distribution of types ofbonds between neighboring solitons along a pulse train. Suchsequence is realized more simply with a use of the groundand first excited types of intersoliton bonds for which the
binding energies are especially great. Figure 13 shows suchinformation soliton sequence in which the number 28062010is coded in binary system (28.06.2010 is the data of theSecond International Conference: Nonlinear Waves-Theoryand Application [41]). Here, the ground type of a bond(smaller distance between pulses) corresponds to unit, andthe first excited type of a bond (the greater distance betweenpulses) corresponds to zero. In binary system, this sequencecorresponds to the number 1101011000011000100111010,that in decimal system is the number 28062010. Really, 1 ·224 + 1 · 223 + 0 · 222 + · · · + 1 · 21 + 0 · 20 = 28062010.
Such soliton trains are highly stable formations. Thehigh stability is primarily due to large binding energies. Fur-thermore, there exists a second reason of the high stability.

8 International Journal of Optics
0 256 5120
3
6
I
τ
Figure 13: Stable molecule chain of bound solitons with the groundand first excited types of bonds in which the number 28062010 iscoded in binary system 1101011000011000100111010. The greaterdistance between pulses corresponds to zero. The smaller distancebetween pulses does to unit. The laser parameters are the same as inthe case of Figure 10.
It consists in the following. The perturbation energy whichwas initially localized in the vicinity of some pair of boundsolitons is quickly collectivized among all solitons of thetrain. In the numerical simulation, we have used the randomradiation noise to prove this stability. This noise induces upto 10% fluctuations of peak intensities of solitons but doesnot change the structure of soliton sequences.
4. Steady States of Interacting Solitons in FiberLasers with Lumped Saturable Absorber
In the previous sections, we have studied steady states ofinteracting solitons in passive mode-locking fiber lasers witha nonlinear polarization rotation technique. In this section,we investigate another type of nonlinear losses when passivemode-locking is realized thanks to a saturable absorber. Therole of such nonlinear absorber can be played by variousmaterials: carbon nanotubes, graphene, saturable absorbersbased on quantum dots, and so on [23–25]. In this case, (2)is replaced by the following one:
En+1(τ) = En(τ) exp
(− snl
1 + pIn(τ)
). (4)
This equation describes the change in the field under itspass through the lumped saturating absorber, where snl isthe losses for a weak field and p is the parameter of asaturation. We have studied the formation of bound statesof interacting solitons and obtained analogical results as forthe case of nonlinear losses due to the nonlinear polarizationrotation technique. Figure 14 shows the distances betweentwo interacting solitons in stable steady states. One can seean alternation of odd and even states as in Figures 11 and 12in the case of nonlinear losses due to the polarization rotationtechnique. Here, powerful soliton wings are also realized.These powerful wings result in large bound energies ofinteracting pulses. For both cases of a realization of nonlinear
π π
δτ
20 40 60 80 1000
0 0 π π0 0
Figure 14: Steady-state distances between two solitons interactingthrough a lumped saturable absorber. The white circle correspondsto the first soliton. The black squares and grey circles do to thesteady-state second soliton with the phase differences π and 0,respectively. a = 0.5, Dr = 0.01, Di = 0.1, q = 1.5, p = 1, snl = 1.
losses, we have used sufficiently close nonlinear-dispersionparameters of the investigated laser systems.
5. About Mechanism of Formation of PowerfulSoliton Wings
Large bounding energies of interacting solitons are due totheir powerful wings. In this section, we analyze reasonsresulting in such wings. Figure 10(b) demonstrates theadditional structure on the bell-shaped spectral profile ofa single soliton which has the spectrum sideband form.Sideband generation in soliton spectrum is a well-knownphenomenon. The sidebands result from an interferencebetween the soliton and dispersive waves. Such dispersivewaves are emitted by a soliton when it circulates in a laserresonator and periodically experiences perturbations causedby the lumped intracavity components. The interference ofsuch wave during several circulations forms the powerfullong-distance wings of solitons. This mechanism does notwork in the case of a continuously distributed intracavitynonlinear-dispersion medium. In this section, we check thehypothesis about a formation of powerful soliton wings atthe expense of dispersive waves.
5.1. Model of a Continuously Distributed Intracavity Non-linear-Dispersion Medium. In the case of a continuouslydistributed intracavity nonlinear-dispersion medium theevolution of radiation in a laser cavity is described by thefollowing equation [42]:
∂E
∂ζ= (Dr + iDi)
∂2E
∂τ2+
(G− σ − σnl
1 + p|E|2 + iq|E|2)E,
(5)
where σ is linear losses, G is a saturable amplification (see(3)), and the term σnl/(1 + p|E|2) describes the continuouslydistributed variant of nonlinear losses (4). In the case ofDi = 0, q = 0, this equation transforms into the nonlineardiffusion equation [43] which describes passive mode-locking of lasers when any phase-modulation effects maybe ignored. Equation (5) was obtained as the generalizationof this nonlinear diffusion equation with a purpose of ananalysis of effects of phase modulation of ultrashort pulses inpassive mode-locked lasers. In the frame of (5), the multiple-pulse operation and the multihysteresis phenomena (see

International Journal of Optics 9
Figure 3) were investigated in the papers [44, 45]. In the casepI � 1, (5) has the form
∂E
∂ζ= (Dr + iDi)
∂2E
∂τ2+(G− σ0 +
(r + iq
)|E|2)E, (6)
where σ0 = σ + σnl is the total linear losses, r = pσnl. It is thesimplest equation taking into account a frequency dispersionof gain-losses and a refractive index, a nonlinearity oflosses and a refractive index, and also a saturation of anamplification. Equation (6) describes the two lasing regimes:an operation with radiation filling totally laser resonatorand a regime with single ultrashort pulse in laser cavity.The amplitude of this single pulse in the case of stationarygeneration is described by the expression
E = E0exp(iΩτ − iδkζ)
cosh1+iαβτ, (7)
where the peak amplitude of a pulse E0, its reverse durationβ, its frequency chirp α, parameters Ω and δk are determinedfrom a system of algebraic equations [42]. The spectralprofile of the ultrashort pulse (7) is determined by thefollowing analytical expression [42, 46]:
I = π2|E0|2β2
sinhπαα(coshπα + cosh
(π /β
)) , (8)
where is a frequency detuning from the center frequencyof soliton radiation. With increasing chirp α, the spectralprofile is changed from a bell-shaped form to a rectangleone (see Figure 15(a)). Figure 15(b) shows the change in thefrequency chirp α on the plate of the nonlinear-dispersionparameters ξ = q/r, θ = Di/Dr . Equation (6) has also asolution with indefinitely increasing amplitude E → ∞ (thatis J → ∞) which is not correct because of breakdown of thecondition pI � 1.
Equation (6) is close to the following equation:
∂Ψ
∂t= (dr + idi)
∂2Ψ
∂z2+[g + (c1 + ic2)|Ψ|2
]Ψ, (9)
where dr , di, g, c1, c2 are constant parameters. This equa-tion is used in a description of hydrodynamical phenomena[47, 48] (see also [49, 50]). It has also the solution in theform (7) [48, 49, 51]. However, there exists the principle dis-tinction between these equations: equation (6) has the stabilesolution in the form of a single stationary soliton describedby (7), but in the case of (9), such stationary solution isalways unstable. In the case of (6), the stabilization of thesingle-pulse solution is realized through a saturation of theamplification G. If the parameter of the gain saturation isequal to zero b = 0 (see (3)), then (6) is transformed into(9). The stabilization of a single pulse can be achieved atthe expense of nonlinear losses described by additional high-order nonlinearities [32, 52]. However, in this case, the exactelegant analytical solutions (7) and (8) for an amplitude anda spectrum of a single stationary pulse do not hold.
5.2. Model with Combination of Lumped and ContinuouslyDistributed Nonlinear Losses. We study passive mode-lockedlaser with the combination of the continuously distributedsaturable absorber included in (5) and the lumped saturableabsorber described by (4). To follow the change of propertiesof soliton wings due to dispersive waves and correspondinglyof properties of steady states of a pair of interacting solitons,we decrease the magnitude of the lumped saturable absorbersnl up to zero. Simultaneously we increase the value of thedistributed nonlinear losses σnl thus that the total losses fora weak signal for one pass of a field through the resonatorremain constant. If our hypothesis is true, then dispersivewaves should weaken up to zero and the amplitude of solitonwings should decrease that will result in the change ofproperties of bound steady states.
Figure 16 shows the spectral change in a single solitonwith varying lumped part of nonlinear losses snl. One can seethe decrease and disappearance of sidebands in the solitonspectrum with decreasing snl. Figure 17 shows the decrease ofa bounding energy for the first excited steady state of a pairof bounding solitons with decreasing values snl. Figure 18shows the decrease of the soliton wing with decreasinglumped part of nonlinear losses. These results demonstratethe role of dispersive waves in a formation of powerful solitonwings which determine properties of bound steady state ofinteracting solitons.
6. Discussion
We have developed a theoretical model to describe severalbehaviors which are usually observed in passively mode-locked fiber lasers. The model is based on a fiber exhibitingoptical Kerr nonlinearity, gain and group velocity disper-sions, and saturable gain. For our analysis, we use typicalparameters for ytterbium- and erbium-doped fiber lasersoperating in the normal and anomalous dispersion regimes.Two mechanisms of nonlinear losses have been analyzed.One of them is related with the nonlinear polarization rota-tion technique. The other is due to a saturable absorber. Forboth mechanisms, the analogical results have been obtained.In our study, we have chosen such laser parameters for whichthe researched phenomena are manifested most clearly. Withother parameters, we have observed various modificationsof investigated regimes. For example, we have observed thetemporal oscillations of soliton amplitudes in bound states.For some parameters, the lower states were unstable. As aresult of this instability, a soliton pair transits into a highersteady state. With other parameters, this instability results ina merge of solitons. With certain parameters, the investigatedphenomena are masked by period-doubling effects.
The multiple-pulse passive mode-locking has been care-fully investigated. It is determined by a coexistence and acompetition of pulses amplified in a common gain medium.The multiple-pulse operation is realized through the effectof a quantization of intracavity radiation into identicaldissipative solitons. A number of identical pulses in a lasercavity as a function of pumping are determined by multihys-teresis dependence. These results are in good agreement with
10 International Journal of Optics
−256 0 2560
1.5
3
1
2
34
A
I A
(a)
−5−5
5
5
−2.5
−2.5
2.5
2.5
0
0ξ
α = 0
θ
(b)
Figure 15: Spectra of ultrashort pulse described by (8). (a) Spectral profiles of established solitons with different chirps: (1) α = 0, (2) α = 1,(3) α = 3, (4) α = 5. (b) Variation of the chirp α on the plane of the nonlinear-dispersion parameters (ξ, θ). For the dashed line α = 0, for thesolid curves α = ±√2, the arrows point the directions of maximal increase in the chirp α. The spectral profiles in the figure (b) demonstratetypical spectra for the three areas separated from each other by the solid curves.
−120
0
120
0
1
0
350
700
0
350
700
0.5 A
I A
snl
Figure 16: Change in spectrum of single ultrashort pulse with thechange in a value of lumped part of saturable absorber snl. The totalvalue of nonlinear losses remains the same.
0 0.25 0.5 0.75 1−7
−3.5
0
J(%
)
snl
Figure 17: Bound energy for the first excited steady state withchanging value of a lumped part of a saturable absorber snl.
0 30 60 900
0.04
0.08 1
2
3
τ
I
Figure 18: Change in the intensity of single-soliton wing with thechange in a value of lumped part of saturable absorber snl: (1) snl =1, (2) snl = 0.75, (3) snl = 0. The total value of nonlinear lossesincluding lumped and distributed parts remains the same.
experimental data reported in the literature (see e.g., [17]). Itis shown that the multihysteresis dependence of a numberof pulses on pumping results in analogical multihysteresisdependences for an intracavity energy and a peak intensityof intracavity solitons.
It is found that a competition and a coexistence ofsolitons in a laser cavity is determined by the dependence ofthe nonlinear-dispersion part of an amplification on a peakintensity of solitons Λ = Λ(I0) (see Figures 7 and 9). Forachievement of a single-pulse generation, it is necessary toincrease the parameter Icr2 that the condition I0 < Icr2 issatisfied for all intracavity pulses. In this case, the multiple-pulse generation is suppressed and, as result, the single pulseoperation is realized. In such a way, it is possible to expect
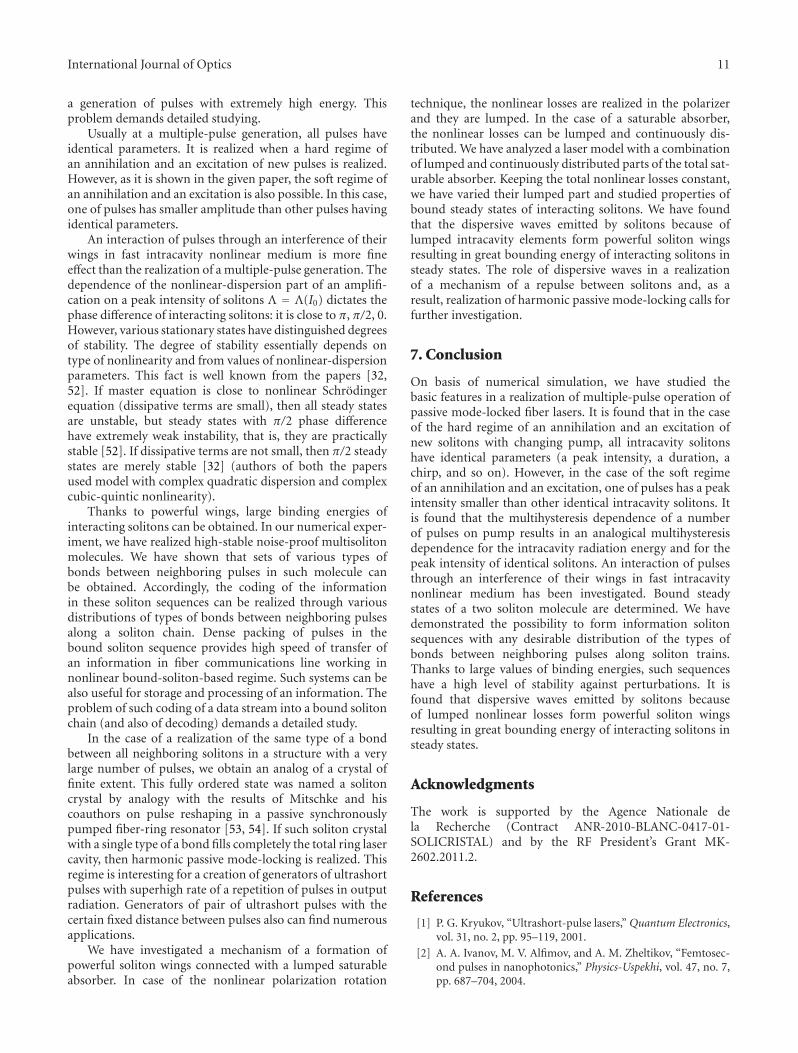
International Journal of Optics 11
a generation of pulses with extremely high energy. Thisproblem demands detailed studying.
Usually at a multiple-pulse generation, all pulses haveidentical parameters. It is realized when a hard regime ofan annihilation and an excitation of new pulses is realized.However, as it is shown in the given paper, the soft regime ofan annihilation and an excitation is also possible. In this case,one of pulses has smaller amplitude than other pulses havingidentical parameters.
An interaction of pulses through an interference of theirwings in fast intracavity nonlinear medium is more fineeffect than the realization of a multiple-pulse generation. Thedependence of the nonlinear-dispersion part of an amplifi-cation on a peak intensity of solitons Λ = Λ(I0) dictates thephase difference of interacting solitons: it is close to π, π/2, 0.However, various stationary states have distinguished degreesof stability. The degree of stability essentially depends ontype of nonlinearity and from values of nonlinear-dispersionparameters. This fact is well known from the papers [32,52]. If master equation is close to nonlinear Schrodingerequation (dissipative terms are small), then all steady statesare unstable, but steady states with π/2 phase differencehave extremely weak instability, that is, they are practicallystable [52]. If dissipative terms are not small, then π/2 steadystates are merely stable [32] (authors of both the papersused model with complex quadratic dispersion and complexcubic-quintic nonlinearity).
Thanks to powerful wings, large binding energies ofinteracting solitons can be obtained. In our numerical exper-iment, we have realized high-stable noise-proof multisolitonmolecules. We have shown that sets of various types ofbonds between neighboring pulses in such molecule canbe obtained. Accordingly, the coding of the informationin these soliton sequences can be realized through variousdistributions of types of bonds between neighboring pulsesalong a soliton chain. Dense packing of pulses in thebound soliton sequence provides high speed of transfer ofan information in fiber communications line working innonlinear bound-soliton-based regime. Such systems can bealso useful for storage and processing of an information. Theproblem of such coding of a data stream into a bound solitonchain (and also of decoding) demands a detailed study.
In the case of a realization of the same type of a bondbetween all neighboring solitons in a structure with a verylarge number of pulses, we obtain an analog of a crystal offinite extent. This fully ordered state was named a solitoncrystal by analogy with the results of Mitschke and hiscoauthors on pulse reshaping in a passive synchronouslypumped fiber-ring resonator [53, 54]. If such soliton crystalwith a single type of a bond fills completely the total ring lasercavity, then harmonic passive mode-locking is realized. Thisregime is interesting for a creation of generators of ultrashortpulses with superhigh rate of a repetition of pulses in outputradiation. Generators of pair of ultrashort pulses with thecertain fixed distance between pulses also can find numerousapplications.
We have investigated a mechanism of a formation ofpowerful soliton wings connected with a lumped saturableabsorber. In case of the nonlinear polarization rotation
technique, the nonlinear losses are realized in the polarizerand they are lumped. In the case of a saturable absorber,the nonlinear losses can be lumped and continuously dis-tributed. We have analyzed a laser model with a combinationof lumped and continuously distributed parts of the total sat-urable absorber. Keeping the total nonlinear losses constant,we have varied their lumped part and studied properties ofbound steady states of interacting solitons. We have foundthat the dispersive waves emitted by solitons because oflumped intracavity elements form powerful soliton wingsresulting in great bounding energy of interacting solitons insteady states. The role of dispersive waves in a realizationof a mechanism of a repulse between solitons and, as aresult, realization of harmonic passive mode-locking calls forfurther investigation.
7. Conclusion
On basis of numerical simulation, we have studied thebasic features in a realization of multiple-pulse operation ofpassive mode-locked fiber lasers. It is found that in the caseof the hard regime of an annihilation and an excitation ofnew solitons with changing pump, all intracavity solitonshave identical parameters (a peak intensity, a duration, achirp, and so on). However, in the case of the soft regimeof an annihilation and an excitation, one of pulses has a peakintensity smaller than other identical intracavity solitons. Itis found that the multihysteresis dependence of a numberof pulses on pump results in an analogical multihysteresisdependence for the intracavity radiation energy and for thepeak intensity of identical solitons. An interaction of pulsesthrough an interference of their wings in fast intracavitynonlinear medium has been investigated. Bound steadystates of a two soliton molecule are determined. We havedemonstrated the possibility to form information solitonsequences with any desirable distribution of the types ofbonds between neighboring pulses along soliton trains.Thanks to large values of binding energies, such sequenceshave a high level of stability against perturbations. It isfound that dispersive waves emitted by solitons becauseof lumped nonlinear losses form powerful soliton wingsresulting in great bounding energy of interacting solitons insteady states.
Acknowledgments
The work is supported by the Agence Nationale dela Recherche (Contract ANR-2010-BLANC-0417-01-SOLICRISTAL) and by the RF President’s Grant MK-2602.2011.2.
References
[1] P. G. Kryukov, “Ultrashort-pulse lasers,” Quantum Electronics,vol. 31, no. 2, pp. 95–119, 2001.
[2] A. A. Ivanov, M. V. Alfimov, and A. M. Zheltikov, “Femtosec-ond pulses in nanophotonics,” Physics-Uspekhi, vol. 47, no. 7,pp. 687–704, 2004.

12 International Journal of Optics
[3] M. E. Fermann and I. Hartl, “Ultrafast fiber laser technology,”IEEE Journal on Selected Topics in Quantum Electronics, vol. 15,no. 1, Article ID 4773318, pp. 191–206, 2009.
[4] T. Brabec and F. Krausz, “Intense few-cycle laser fields:frontiers of nonlinear optics,” Reviews of Modern Physics, vol.72, no. 2, pp. 545–591, 2000.
[5] E. V. Baklanov and P. V. Pokasov, “Optical frequency standardsand femtosecond lasers,” Quantum Electronics, vol. 33, no. 5,pp. 383–400, 2003.
[6] G. P. Agrawal, Nonlinear Fiber Optics, Elsevier Science andTechnology Books, Academ Press, Burlington, Mass, USA,2006.
[7] N. Akhmediev and A. Ankiewicz, Dissipative Solitons, LectureNotes in Physics, Springer, Berlin, Germany, 2005.
[8] F. W. Wise, A. Chong, and W. H. Renninger, “High-energyfemtosecond fiber lasers based on pulse propagation at normaldispersion,” Laser & Photonics Reviews, vol. 2, no. 1-2, pp. 58–73, 2008.
[9] S. Chouli and P. Grelu, “Rains of solitons in a fiber laser,”Optics Express, vol. 17, no. 14, pp. 11776–11781, 2009.
[10] D. Y. Tang, L. M. Zhao, X. Wu, and H. Zhang, “Solitonmodulation instability in fiber lasers,” Physical Review A, vol.80, pp. 023806–023813, 2009.
[11] F. Amrani, A. Haboucha, M. Salhi, H. Leblond, A. Komarov,and F. Sanchez, “Dissipative solitons compounds in a fiberlaser. Analogy with the states of the matter,” Applied PhysicsB, vol. 99, no. 1-2, pp. 107–114, 2010.
[12] S. Kobtsev, S. Kukarin, S. Smirnov, S. Turitsyn, and A. Latkin,“Generation of double-scale femto/pico-second optical lumpsin mode-locked fiber lasers,” Optics Express, vol. 17, no. 23, pp.20707–20713, 2009.
[13] P. Grelu, F. Belhache, F. Gutty, and J. M. Soto-Crespo, “Relativephase locking of pulses in a passively mode-locked fiber laser,”Journal of the Optical Society of America B, vol. 20, no. 5, pp.863–870, 2003.
[14] H. A. Haus, “Mode-locking of lasers,” IEEE Journal on SelectedTopics in Quantum Electronics, vol. 6, no. 6, pp. 1173–1185,2000.
[15] V. I. Denisov, B. N. Nyushkov, and V. S. Pivtsov, “Self-mode-locked all-fibre erbium laser with a low repetition rate andhigh pulse energy,” Quantum Electronics, vol. 40, no. 1, pp. 25–27, 2010.
[16] A. Komarov, A. Haboucha, K. Komarov, H. Leblond, M. Salhi,and F. Sanchez, “Soliton interaction in fiber laser,” in RecentResearch Developments in Optics, S. G. Pandalai, Ed., vol. 7,pp. 63–112, 2009.
[17] D. Y. Tang, W. S. Man, and H. Y. Tam, “Stimulated solitonpulse formation and its mechanism in a passively mode-lockedfibre soliton laser,” Optics Communications, vol. 165, no. 4, pp.189–194, 1999.
[18] A. Hideur, T. Chartier, M. Sahli, C. Ozkul, C. M. Brunel, and F.Sanchez, “Mode-lock, Q-switch and CW operation of an Yb-doped double-clad fiber ring laser,” Optics Communications,vol. 198, no. 1, pp. 141–146, 2001.
[19] A. B. Grudinin, D. J. Richardson, and D. N. Payne, “Energyquantisation in figure eight fibre laser,” Electronics Letters, vol.28, no. 1, pp. 67–68, 1992.
[20] A. Komarov, H. Leblond, and F. Sanchez, “Multistability andhysteresis phenomena in passively mode-locked fiber lasers,”Physical Review A, vol. 71, no. 5, Article ID 053809, pp. 1–9,2005.
[21] D. Y. Tang, L. M. Zhao, B. Zhao, and A. Q. Liu, “Mechanismof multisoliton formation and soliton energy quantization inpassively mode-locked fiber lasers,” Physical Review A, vol. 72,no. 4, pp. 1–9, 2005.
[22] A. Komarov, H. Leblond, and F. Sanchez, “Theoretical analysisof the operating regime of a passively-mode-locked fiber laserthrough nonlinear polarization rotation,” Physical Review A,vol. 72, no. 6, pp. 063811–063818, 2005.
[23] J.-C. Chiu, Y.-F. Lan, and J.-J. Kang, “Passivelly mode-lockedlasers using saturable absorber incorporating dispersed singlewall carbon nanotudes,” in Proceedings of the IEEE ElectronicComponent and Technology Conference, pp. 827–830, SanDiego, Calif, USA, 2009.
[24] H. Zhang, D. Tang, R. J. Knize, L. Zhao, Q. Bao, and K. P.Loh, “Graphene mode locked, wavelength-tunable, dissipativesoliton fiber laser,” Applied Physics Letters, vol. 96, no. 11,Article ID 111112, 2010.
[25] Z. Sun, T. Hasan, D. Popa et al., “Ultrafast fiber laser mode-locked by graphene based saturable absorber,” in Proceedingsof the Lasers and Electro-Optics/Quantum Electronics and LaserScience Conference: 2010 Laser Science to Photonic Applications(CLEO/QELS 2010), San Jose, Calif, USA, May 2010.
[26] P. Grelu, F. Belhache, F. Gutty, and J. M. Soto-Crespo, “Phase-locked soliton pairs in a stretched-pulse fiber laser,” OpticsLetters, vol. 27, no. 11, pp. 966–968, 2002.
[27] M. Olivier, V. Roy, M. Piche, and F. Babin, “Pulse collisions inthe stretched-pulse fiber laser,” Optics Letters, vol. 29, no. 13,pp. 1461–1463, 2004.
[28] D. Y. Tang, W. S. Man, H. Y. Tam, and P. D. Drummond,“Observation of bound states of solitons in a passively mode-locked fiber laser,” Physical Review A, vol. 64, no. 3, Article ID033814, 2001.
[29] A. K. Komarov, K. P. Komarov, H. Leblond, and F. Sanchez,“Spectral control over the interaction of ultrashort pulses infiber lasers,” Optics and Spectroscopy, vol. 103, no. 5, pp. 825–830, 2007.
[30] N. Akhmediev, J. M. Soto-Crespo, M. Grapinet, and P. Grelu,“Dissipative soliton interactions inside a fiber laser cavity,”Optical Fiber Technology, vol. 11, no. 3, pp. 209–228, 2005.
[31] B. A. Malomed, “Bound solitons in the nonlinear Schrodinger-Ginzburg-Landau equation,” Physical Review A, vol. 44, no. 10,pp. 6954–6957, 1991.
[32] N. Akhmediev, A. Ankiewicz, and J. M. Soto-Crespo, “Multi-soliton solutions of the complex ginzburg-landau equation,”Physical Review Letters, vol. 79, no. 21, pp. 4047–4051, 1997.
[33] A. Komarov, K. Komarov, and F. Sanchez, “Quantization ofbinding energy of structural solitons in passive mode-lockedfiber lasers,” Physical Review A, vol. 79, no. 3, Article ID033807, 2009.
[34] K. S. Abedin, J. T. Gopinath, L. A. Jiang, M. E. Grein, H. A.Haus, and E. P. Ippen, “Self-stabilized passive, harmonicallymode-locked stretched-pulse erbium fiber ring laser,” OpticsLetters, vol. 27, no. 20, pp. 1758–1760, 2002.
[35] C. X. Yu, H. A. Haus, E. P. Ippen, W. S. Wong, and A.Sysoliatin, “Gigahertz-repetition-rate mode-locked fiber laserfor continuum generation,” Optics Letters, vol. 25, no. 19, pp.1418–1420, 2000.
[36] B. Ortac, A. Hideur, G. Martel, and M. Brunel, “2-GHz passiveharmonically mode-locked Yb-doped double-clad fiber laser,”Applied Physics B, vol. 81, no. 4, pp. 507–509, 2005.
[37] A. Komarov, H. Leblond, and F. Sanchez, “Passive harmonicmode-locking in a fiber laser with nonlinear polarizationrotation,” Optics Communications, vol. 267, no. 1, pp. 162–169,2006.

International Journal of Optics 13
[38] A. Komarov, A. Haboucha, and F. Sanchez, “Ultrahigh-repetition-rate bound-soliton harmonic passive mode-lockedfiber lasers,” Optics Letters, vol. 33, no. 19, pp. 2254–2256,2008.
[39] A. Haboucha, H. Leblond, M. Salhi, A. Komarov, and F.Sanchez, “Coherent soliton pattern formation in a fiber laser,”Optics Letters, vol. 33, no. 5, pp. 524–526, 2008.
[40] Y. I. Khanin, Principles of Laser Dynamics, Elsevier, Amster-dam, The Netherlands, 1995.
[41] A. Komarov, K. Komarov, D. Meshcheriakov, F. Amrani, andF. Sanchez, “Dissipative solitons in passive mode-locked fiberlasers with nonlinear polarization rotation technique,” inProceedings of the Second International Conference:NonlinearWaves—Theory and Applications, Technical Digest, p. 207,Beijing, China, June 2010.
[42] K. P. Komarov, “Theory of stationary ultrashort pulses insolid-state lasers with passive mode-locking,” Optics andSpectroscopy, vol. 60, no. 2, pp. 231–234, 1986.
[43] K. P. Komarov and V. D. Ugozhaev, “Steady-state pulsesin solid-state lasers with passive mode locking,” Optics andSpectroscopy, vol. 55, no. 5, pp. 564–568, 1983.
[44] A. K. Komarov, K. P. Komarov, and A. S. Kuch’yanov, “Onphase-modulational bifurcation during passive mode lockingin lasers,” JETP Letters, vol. 67, no. 4, pp. 280–283, 1998.
[45] A. K. Komarov and K. P. Komarov, “Multistability andhysteresis phenomena in passive mode-locked lasers,” PhysicalReview E, vol. 62, no. 6 B, pp. R7607–R7610, 2000.
[46] K. P. Komarov, A. S. Kuch’yanov, and V. D. Ugozhayev,“Generation of stationary ultra-short pulses by a passivemode-locking solid-state laser,” Optics Communications, vol.57, no. 4, pp. 279–284, 1986.
[47] L. M. Hocking, K. Stewartson, J. T. Stuart, and S. N. Brown,“A nonlinear instability burst in plane parallel flow,” Journal ofFluid Mechanics, vol. 51, no. 4, pp. 705–735, 1972.
[48] L. M. Hocking and K. Stewartson, “On the nonlinear responseof a marginally unstable plane parallel flow to a two-dimensional disturbance,” Proceedings of the Royal Society A,vol. 326, pp. 289–313, 1972.
[49] A. C. Newell, “Envelope equations,” Lectures in AppliedMathematics, vol. 15, pp. 157–163, 1974.
[50] A. C. Newell and J. A. Whitehead, “Finite bandwidth, finiteamplitude convection,” Journal of Fluid Mechanics, vol. 38, no.2, pp. 279–303, 1969.
[51] N. R. Pereira and L. Stenflo, “Nonlinear Schrodinger equationincluding growth and damping,” Physics of Fluids, vol. 20, no.10, pp. 1733–1734, 1977.
[52] V. V. Afanasjev, B. A. Malomed, and P. L. Chu, “Stability ofBound States of pulses in the Ginzburg-Landau equations,”Physical Review E, vol. 56, no. 5, pp. 6020–6023, 1997.
[53] B. A. Malomed, A. Schwache, and F. Mitschke, “Soliton latticeand gas in passive fiber-ring resonators,” Fiber and IntegratedOptics, vol. 17, no. 4, pp. 267–277, 1998.
[54] S. Rutz and F. Mitschke, “Towards thermodynamics of soli-tons: cooling,” Journal of Optics B, vol. 2, no. 3, pp. 364–366,2000.

Hindawi Publishing CorporationInternational Journal of OpticsVolume 2012, Article ID 831604, 18 pagesdoi:10.1155/2012/831604
Research Article
The Proper Orthogonal Decomposition for DimensionalityReduction in Mode-Locked Lasers and Optical Systems
Eli Shlizerman,1 Edwin Ding,2 Matthew O. Williams,1 and J. Nathan Kutz1
1 Department of Applied Mathematics, University of Washington, Seattle, WA 98195-2420, USA2 Department of Mathematics and Physics, Azusa Pacific University, P.O. Box 7000, Azusa, CA 91702-7000, USA
Correspondence should be addressed to J. Nathan Kutz, [email protected]
Received 6 May 2011; Accepted 24 June 2011
Academic Editor: Sonia Boscolo
Copyright © 2012 Eli Shlizerman et al. This is an open access article distributed under the Creative Commons Attribution License,which permits unrestricted use, distribution, and reproduction in any medium, provided the original work is properly cited.
The onset of multipulsing, a ubiquitous phenomenon in laser cavities, imposes a fundamental limit on the maximum energy de-livered per pulse. Managing the nonlinear penalties in the cavity becomes crucial for increasing the energy and suppressing themultipulsing instability. A proper orthogonal decomposition (POD) allows for the reduction of governing equations of a mode-locked laser onto a low-dimensional space. The resulting reduced system is able to capture correctly the experimentally observedpulse transitions. Analysis of these models is used to explain the sequence of bifurcations that are responsible for the multipulsinginstability in the master mode-locking and the waveguide array mode-locking models. As a result, the POD reduction allows fora simple and efficient way to characterize and optimize the cavity parameters for achieving maximal energy output.
1. Introduction
Ultrashort lasers have a large variety of applications, rangingfrom small scale problems such as ocular surgeries and bi-ological imaging to large-scale problems such as optical com-munication systems and nuclear fusion. In the context oftelecommunications and broadband sources, the laser is re-quired to robustly produce pulses in the range of 200 fem-toseconds to 50 picoseconds. The generation of such shortpulses is often referred to as mode-locking [1, 2]. One of themost widely used mode-locked lasers developed to date isa ring cavity laser with a combination of waveplates and apassive polarizer. The combination of such components actsas an effective saturable absorber, providing an intensitydiscriminating mechanism to shape the pulse [3–7]. It wasfirst demonstrated experimentally in the early 90s that ultra-short pulse generation and robust laser operation could beachieved in such a laser cavity [3, 4]. Since then, a numberof theoretical models have been proposed to characterize themode-locked pulse evolution and its stability, including thepresent work which demonstrates that the key phenomenonof multipulsing can be completely characterized by a low-dimensional model with modes created by a proper orthog-onal decomposition (POD).
Mode-locking can be achieved through a variety ofmechanisms, for example, nonlinear polarization rotation [1]or waveguide arrays [2]. In the context of mode-locking withnonlinear polarization rotation, the master mode-lockingequation proposed by Haus [3, 8–11], which is the complexGinzburg-Landau equation with a bandwidth-limited gain,was the first model used to describe the pulse formationand mode-locking dynamics in the ring cavity laser. TheGinzburg-Landau equation was originally developed in thecontext of particle physics as a model of superconductivityand has since been widely used as a prototypical model fornonlinear wave propagation and pattern-forming systems.In the context of mode-locking with waveguide arrays,the nonlinear mode coupling inherent in semiconductorwaveguide arrays is exploited to produce the saturableabsorber needed for mode-locking [12–14]. The governingequation in this context is the waveguide array mode-lockingmodel (WGAML).
In both of these systems, a large number of stationarysolutions are supported by this equation [14–16]. These sta-tionary solutions can be categorized as single-pulse, double-pulse, and in general n-pulse solution depending on thestrength of the cavity gain. The phenomenon for which a sin-gle mode-locked pulse solution splits into two or more pulses

2 International Journal of Optics
is known as multipulsing [1, 2, 17] and has been observed ina wide variety of experimental and theoretical configurations[12, 18–24]. Specifically, when the pulse energy is increased,the spectrum of the pulse experiences a broadening effect.Once the spectrum exceeds the bandwidth limit of the gain,the pulse becomes energetically unfavorable, and a double-pulse solution is generated which has a smaller bandwidth.The transition from a single-pulse to a double-pulse solutioncan be via various mechanisms: abrupt jump from singlepulse to double pulse, creation of periodic structures andchaotic/translational behavior. It is the aim of this manuscriptto characterize the translational behavior in the nonlinearpolarization rotation and WGAML systems and provide aframework for the study of the multipulsing phenomena whenparameters are varied.
A number of analytical and numerical tools have beenutilized over the past fifteen years to study the mode-lockingstability and multipulsing transition. One of the earliesttheoretical approaches was to consider the energy rate equa-tions derived by Namiki et al. that describe the averagedenergy evolution in the laser cavity [25]. Other theoreticalapproaches involved the linear stability analysis of stationarypulses [12, 26–28]. These analytical methods were effectivein characterizing the stability of stationary pulses but wereunable to describe the complete pulse transition that occursduring multipulsing.
Computationally, there is no efficient (algorithmic) wayto find bifurcations by direct simulations, since solutions thatpossess a small basin of attraction are difficult to find. Alter-native, local approach is to follow the single-pulse solutionusing continuation methods; however, to the limitation ofthe analytic tools, the transition region is difficult to char-acterize computationally even with the fastest and the mostaccurate algorithms available [29]. Such difficulties has ledto the consideration of reduction techniques that simplifythe full governing equation and allow for a deeper insight ofthe multipulsing instability. One obvious method for a low-dimensional reconstruction of the dynamics is to use anappropriate eigenfunction expansion basis for characterizingthe system. Such eigenfunction expansions represent anatural basis for the dynamics as have been demonstratedin various photonic applications [30–32]. For nonlinearsystems; however, it is not always clear what eigenfunctionbasis should be used nor is it clear that the optimal basisset can be found by such a technique. Nevertheless, itprovides a powerful and effective method for recasting thedynamics in a lower-dimensional framework. Among otherreduction techniques, the variational method was first usedby Anderson et al. in the context of nonlinear evolutionequations with nonhamiltonian dissipative perturbations[33, 34]. Since then, it has been widely used to study variousaspects in nonlinear optics such as soliton resonance andpulse interactions [35–37]. In the context of mode-locking,the method (or the associated method of moments) wassuccessful in characterizing the single-pulse dynamics of thegoverning systems [37–39].
The limitation of the variational method is that the accu-racy of the results depends largely on the approach used todescribe the true dynamics. When multipulsing occurs, the
form of the solution in the laser system changes significantly,and the prediction by the variational reduction is ambigu-ous. Unlike the variational approach [38, 39], the low-dimensional model considered here is constructed using themethod of POD [40]. The proper orthogonal decomposition(POD), also known as principal component analysis (PCA)or the Karhunen-Loeve (KL) expansion, is a singular-valuedecomposition- (SVD-) based technique often used to gen-erate a low-rank, orthogonal basis that optimally (in anL2-sense [41]) represents a set of data. Although the PODtechnique can be applied to generic data sets, it is often usedon data obtained from systems with a physical, biological,and/or engineering application [40, 42, 43]. The resulting setof the POD modes is often paired with the standard Galerkinprojection technique in order to generate a set of ODEs forthe mode amplitudes [40]. This combination has proven tobe very powerful and is used in a number of fields includingnonlinear optics [44, 45], turbulence [40], fluid flow [46–49], convective heating [50], and even neuroscience [51]. Asa result, the POD method provides a generic, analytic toolthat can be used efficiently, unlike the direct methods. Theresulting POD system is able to capture the whole bifurcationsequence from the single mode-locked pulse to the double-pulse solution observed in numerical simulations of bothsystems of mode-locking. The key idea behind the methodis that there exists an “ideal” (optimal) basis in which agiven system can be written (diagonalized) so that in thisbasis, all redundancies have been removed, and the largestvariances of particular measurements are ordered. In thelanguage being developed here, this means that the systemhas been written in terms of its principle components or ina proper orthogonal decomposition. As already mentioned,such techniques are commonly used as a tool in exploratorydata analysis and for making predictive models.
This paper is outlined as follows: Section 2 describes theprocedure for obtaining the POD modes from a given set ofdata. A simple example of the POD technique is applied toN-soliton dynamics. This illustrates the key features of themethod. The application of the POD reduction to the cubic-quintic Ginzburg-Landau equation and the waveguide arraymode-locking model are then explored in Sections 4 and 5,respectively. Section 6 summarizes the results of the paper.
2. Proper Orthogonal Decomposition
Here we provide a short review of the POD method anddescribe its application to the derivation of reduced modelsfor nonlinear evolution equations (see [40]). Abstractly, thePOD method developed here can be represented by consider-ing the following partial differential equation (PDE) system:
Ut = N(U, Ux, Uxx, . . . , x, t), (1)
where U is a vector of physically relevant quantities, and thesubscripts t and x denote partial differentiation. The functionN(·) captures the space-time dynamics that is specific tothe system being considered. Along with this PDE are someprescribed boundary conditions and initial conditions.
As a specific solution method for (1), we considerthe separation of variable and basis expansion technique.

International Journal of Optics 3
In particular, standard eigenfunction expansion techniquesassume a solution of the form
u(x, t) =∞∑n=1
an(t)φn(x), (2)
where the φn(x) is an orthogonal set of eigenfunctions, andwe have assumed that the PDE is now described by a scalarquantity u(x, t). The φn(x) can be any orthogonal set offunctions such that
(φj(x),φk(x)
)= δjk =
⎧⎨⎩1, j = k,
0, j /= q,(3)
where δjk is the Dirac function, and the notation (φj ,φk) =∫φjφ
∗k dx gives the inner product. For a given physical
problem, one may be motivated to use a specified set ofeigenfunctions such as those special functions that arisefor specific geometries or symmetries. More generally, forcomputational purposes, it is desired to use a set of eigen-functions that produce accurate and rapid evaluation ofthe solutions of (1), that is, a Fourier mode basis and theassociated fast Fourier transform. In the method developedhere, optimal POD basis functions are generated from asingular value decomposition of the representative dynamicsof the governing equations, thus, recasting the dynamics ofthe system into the best low-dimensional framework.
The POD method is related to the singular value decom-position (SVD). Computationally, the SVD is implementedas a built-in routine in many scientific software packages,such as MATLAB or NumPy. To generate a complete set ofPOD modes, a data set is compiled and represented as thematrix X. Each row of the matrix consists of a samplesolution taken at a specific value of time, and the number ofrows in the matrix is the number of samples taken at evenlyspaced values in time. Therefore, if the data consists of msamples with n points per sample, then X ∈ Cm×n. The SVDfactorizes the matrix X into three matrices
X = UΣV∗, (4)
where U ∈ Cm×m, V ∈ Cn×n, and Σ ∈ Rm×n, and the asteriskdenotes the conjugate transpose. In a matrix form, the fac-torization in (4) is expressed as
X =
⎡⎢⎢⎢⎢⎢⎢⎢⎢⎢⎢⎢⎢⎣
�u1
...
�ui...
�um
⎤⎥⎥⎥⎥⎥⎥⎥⎥⎥⎥⎥⎥⎦
⎡⎢⎢⎢⎢⎢⎢⎢⎢⎢⎢⎢⎢⎢⎢⎢⎣
σ1
. . .
σj
. . .
σn
0 · · · · · · · · · 0
⎤⎥⎥⎥⎥⎥⎥⎥⎥⎥⎥⎥⎥⎥⎥⎥⎦
⎡⎢⎢⎢⎢⎢⎢⎢⎢⎢⎢⎢⎢⎢⎣
�φ1
...
�φj...
�φn
⎤⎥⎥⎥⎥⎥⎥⎥⎥⎥⎥⎥⎥⎥⎦. (5)
The matrix Σ is a diagonal matrix with nonnegative elementsσj . For m > n, j is an index that takes the values j = 1, . . . ,n;otherwise, it takes the values j = 1, . . . ,m. The σj are referredto as the singular values of X and are ordered such that
σ1 ≥ σ2 ≥ · · · ≥ 0. The matrices U and V are composed
of the eigenvectors �ui (rows of U) and �φj (rows of V∗) of thecovariance matrices XX∗ and X∗X, respectively. As a result,the singular value decomposition allows the decompositionof the kth row of X into
�χk =n∑j=1
σjuk j�φj , (6)
assuming that m > n. Hence, the SVD returns a completeorthonormal set of basis functions for the rows of the datamatrix X. The elements of this basis are the vectors �φj andare referred to as the POD modes. The key idea of this paperis embodied in (6). Specifically, the POD-Galerkin methodattempts to provide an accurate approximation of the σjuk jwith a system of ordinary differential equations.
One way to reduce the dimensionality of the matrix X isto use a subset of the POD basis. The relative importance of
the jth POD mode �φj in the approximation of the matrix Xis determined by the relative energy E j of that mode, definedas [40, 52]
E j =σ2j∑n
i=1 σ2i
, (7)
where the total energy is normalized such that∑n
j=1 E j = 1.If the sum of the energies of the retained modes is unity,then these modes can be used to completely reconstruct X.Typically, the number of modes required to capture all ofthe energy is very large and does not result in a significantdimensionality reduction. In practice; however, it has beenfound that the matrix can be accurately approximated byusing POD modes whose corresponding energies sum toalmost all of the total energy. Then the POD basis that is usedin the approximation is a truncated basis, where the PODmodes with negligible energy are neglected. In practice, thetruncated basis with energies that sum to 99% of the totalenergy is a plausible truncation. The advantage of using atruncated set of POD modes rather than any other set ofmodes is that the representation of the data generated bythe POD modes is guaranteed to have a smaller least squareserror than the representation of the data generated by anyother orthonormal set of the same size [40].
3. Soliton Dynamics: A SimpleExample Application
To give a specific demonstration of this technique, considerthe nonlinear Schrodinger (NLS) equation
iut +12uxx + |u|2u = 0 (8)
with the boundary conditions u → 0 as x → ±∞. Notethat, for this example, time t and space x are represented ina standard way versus the traditional moving frame referenceof optics. If not for the nonlinear term, this equation could besolved easily in closed form. However, the nonlinearity mixesthe eigenfunction components in the expansion (2) makinga simple analytic solution not possible.

4 International Journal of Optics
−20
0
20
1
x
|u|
0
3
6
0
t
(a)
0
3
6
0t
−40
0
40
40
k
|t(
u)|
(b)
Figure 1: Evolution of the N = 1 soliton. Although it appears to be a very simple evolution, the phase is evolving in a nonlinear fashion, andapproximately 50 Fourier modes are required to model accurately this behavior.
It now remains to consider a specific spatial configurationfor the initial condition. For the NLS, there are the set of spe-cial initial conditions corresponding to the soliton solutions
u(x, 0) = N sech(x), (9)
where N is an integer. We will consider the soliton dynamicswith N = 1 and N = 2, respectively. In order to do so, theinitial condition is projected onto the Fourier modes withthe fast Fourier transform (denoted by a hat). Rewriting (8)in the Fourier domain, that is, Fourier transforming, givesthe set of differential equations
ut = − i
2k2u + i|u| 2u, (10)
where the spatial Fourier mode (k is the wavenumber) mix-ing occurs due to the nonlinear mixing in the cubic term.This gives the system of differential equations to be solved forin order to evaluate the NLS behavior.
The dynamics of the N = 1 and N = 2 solitons aredemonstrated in Figures 1 and 2, respectively. During evolu-tion, the N = 1 soliton only undergoes phase changes whileits amplitude remains stationary. In contrast, the N = 2soliton undergoes periodic oscillations. In both cases, a largenumber of Fourier modes, about 50 and 200, respectively, arerequired to model the simple behaviors illustrated.
The potentially obvious question to ask in light of ourdimensionality reduction thinking is this: is the solitondynamics really a 50 or 200 degree-of-freedom system asimplied by the Fourier mode numerical solution technique?The answer is no. Indeed, the inverse scattering transformensures that there is an orthogonal, low-dimensional basis interms of nonlinear, soliton modes. Such a technique is ana-lytically difficult to handle and requires in-depth knowledgeof the technique. On the other hand, with the appropriatebasis, that is, the POD modes generated from the SVD, it canbe shown that the dynamics is a simple reduction to 1 or 2modes, respectively. Indeed, it can easily be shown that theN = 1 and N = 2 are truly low dimensional by computing
the singular value decomposition of the evolutions shown inFigures 1 and 2, respectively.
Figures 3 and 4 demonstrate the low-dimensional natureexplicitly by computing the singular values of the numericalsimulations along with the modes to be used in our neweigenfunction expansion. What is clear is that for both ofthese cases, the dynamics is truly low dimensional withthe N = 1 soliton being modeled exceptionally well bya single POD mode while the N = 2 dynamics is modeledquite well with two POD modes. Thus, in performing theexpansion (2), the modes chosen should be the POD modesgenerated from the simulations themselves. In the followingsubsections, the dynamics of the modal interaction for thesetwo cases are derived, showing that quite a bit of analyticprogress can then be made within the POD framework.
3.1. N = 1 Soliton Reduction. To take advantage of the low-dimensional structure, we first consider the N = 1 solitondynamics. Figure 1 shows that a single mode in the SVDdominates the dynamics. Thus, the dynamics is recast in asingle mode so that
u(x, t) = a(t)φ(x), (11)
where now there is no sum in (2) since there is only a single-mode φ(x). Plugging this expansion into the NLS equation(8) yields the following:
iatφ +12aφxx + |a|2a∣∣φ∣∣2
φ = 0. (12)
The inner product is now taken with respect to φ which gives
iat +α
2a + β|a|2a = 0, (13)
where
α =(φxx,φ
)(φ,φ
) ,
β =(∣∣φ∣∣2
φ,φ)
(φ,φ
) ,
(14)

International Journal of Optics 5
−20
0
20
4
x
|u|
0
3
6
0
t
(a)
−40
0
40
0
3
6
0
t
80
k
|t(
u)|
(b)
Figure 2: Evolution of theN = 2 soliton. Here a periodic dynamics is observed, and approximately 200 Fourier modes are required to modelaccurately the behavior.
and the inner product is defined as integration over the com-putational interval so that (φ,ψ) = ∫
φψ∗dx. Note thatthe integration is over the computational domain and the∗ denotes the complex conjugate and where (φ,φ) = 1.
The differential equation for a(t) given by (13) can besolved explicitly to yield
a(t) = a(0) exp[iα
2t + iβ|a(0)|2t
], (15)
where a(0) is the initial value condition for a(t). To find theinitial condition, recall that
u(x, 0) = sech(x) = a(0)φ(x). (16)
Taking the inner product with respect to φ(x) gives
a(0) =(sech(x),φ
)(φ,φ
) . (17)
Thus, the one-mode expansion gives the approximate PDEsolution
u(x, t) = a(0) exp[iα
2t + iβ|a(0)|2t
]φ(x). (18)
This solution is the low-dimensional POD approximation ofthe PDE expanded in the best basis possible, that is, the SVDdetermined basis.
For theN = 1 soliton, the spatial profile remains constantwhile its phase undergoes a nonlinear rotation. The PODsolution (18) can be solved exactly to give a characterizationof this phase rotation. Figure 5 shows both the full PDEdynamics along with its one-mode approximation.
3.2. N = 2 Soliton Reduction. The case of the N = 2 solitonis a bit more complicated and interesting. In this case, twomodes clearly dominate the behavior of the system. Thesetwo modes are now used to approximate the dynamics
observed in Figure 2. In this case, the two-mode expansiontakes the form
u(x, t) = a1(t)φ1(x) + a2(t)φ2(x), (19)
where the φ1 and φ2 are simply taken from the first twocolumns of the U matrix in the SVD. Inserting this approxi-mation into the governing equation (8) gives
i(a1tφ1 + a2tφ2
)+
12
(a1φ1xx + a2φ2xx
)+(a1φ1 + a2φ2
)2(a∗1 φ
∗1 + a∗2 φ
∗2
) = 0.
(20)
Multiplying out the cubic term gives the equation
i(a1tφ1 + a2tφ2
)+
12
(a1φ1xx + a2φ2xx
)+(|a1|2a1
∣∣φ1∣∣2φ1 + |a2|2a2
∣∣φ2∣∣2φ2 + 2|a1|2a2
∣∣φ1∣∣2φ2
+2|a2|2a1∣∣φ2
∣∣2φ1 + a2
1a∗2 φ
21φ∗2 + a2
2a∗1 φ
22φ∗1
).
(21)
All that remains is to take the inner product of this equationwith respect to both φ1(x) and φ2(x). Recall that these twomodes are orthogonal, thus, the resulting 2 × 2 system ofnonlinear equations results in
ia1t + α11a1 + α12a2 +(β111|a1|2 + 2β211|a2|2
)a1
+(β121|a1|2 + 2β221|a2|2
)a2 + σ121a
21a∗2 + σ211a
22a∗1 = 0,
ia2t + α21a1 + α22a2 +(β112|a1|2 + 2β212|a2|2
)a1
+(β122|a1|2 + 2β222|a2|2
)a2 + σ122a
21a∗2 + σ212a
22a∗1 = 0,
(22)

6 International Journal of Optics
30
300
10
10
20
20
σj
0
(a)
103
20 30
10−6
100
10−3
0 10
log(σ
) j
(b)
−15 0 15−0.2
0
0.2
x
φj(
x)
Mode1
Mode2
(c)
Figure 3: Projection of the N = 1 evolution to POD modes. The top two figures are the singular values σj of the evolution demonstrated in(1) on both a regular scale and log scale. This demonstrates that the N = 1 soliton dynamics is primarily a single-mode dynamics. The firsttwo modes are shown in the bottom panel. Indeed, the second mode is meaningless and is generated from noise and numerical roundoff.
where
αjk =(φjxx,φk
)2
,
βjkl =(∣∣∣φj∣∣∣2
φk,φl
),
σjkl =(φ2j φ∗k ,φl
),
(23)
and the initial values of the two components are given by
a1(0) =(2sech(x),φ1
)(φ1,φ1
) ,
a2(0) =(2sech(x),φ2
)(φ2,φ2
) .
(24)
This gives a complete description of the two-mode dynamicspredicted from the SVD analysis.
The 2 × 2 system (22) can be easily simulated with anystandard numerical integration algorithm (e.g., fourth-orderRunge-Kutta). Before computing the dynamics, the innerproducts given by αjk, βjkl and σjkl must be calculated alongwith the initial conditions a1(0) and a2(0).
Note that the two-mode dynamics does a good job inapproximating the solution as demonstrated in Figure 6.
However, there is a phase drift that occurs in the dynamicsthat would require higher precision in both taking time slicesof the full PDE and more accurate integration of the innerproducts for the coefficients. Indeed, the most simple trape-zoidal rule has been used to compute the inner products, andits accuracy is somewhat suspected. Higher-order schemescould certainly help improve the accuracy. Additionally,incorporation of the third mode could also help. In eithercase, this demonstrates sufficiently how one would in prac-tice use the low-dimensional structures for approximatingPDE dynamics.
4. Cubic-Quintic Ginzburg-Landau’s Equation
As a more complicated example, we consider the mastermode-locking model that describes the evolution of thenonlinear polarization rotation mode-locking system. Themaster mode-locking model is known as the cubic-quinticGinzburg-Landau equation (CQGLE). The model describesthe averaged pulse evolution in a ring cavity laser subjectedto the combined effect of chromatic dispersion, fiber bire-fringence, self- and cross-phase modulations for the twoorthogonal components of the polarization vector in thefast- and slow-fields, bandwidth-limited gain saturation,cavity attenuation, and the intensity-discriminating element
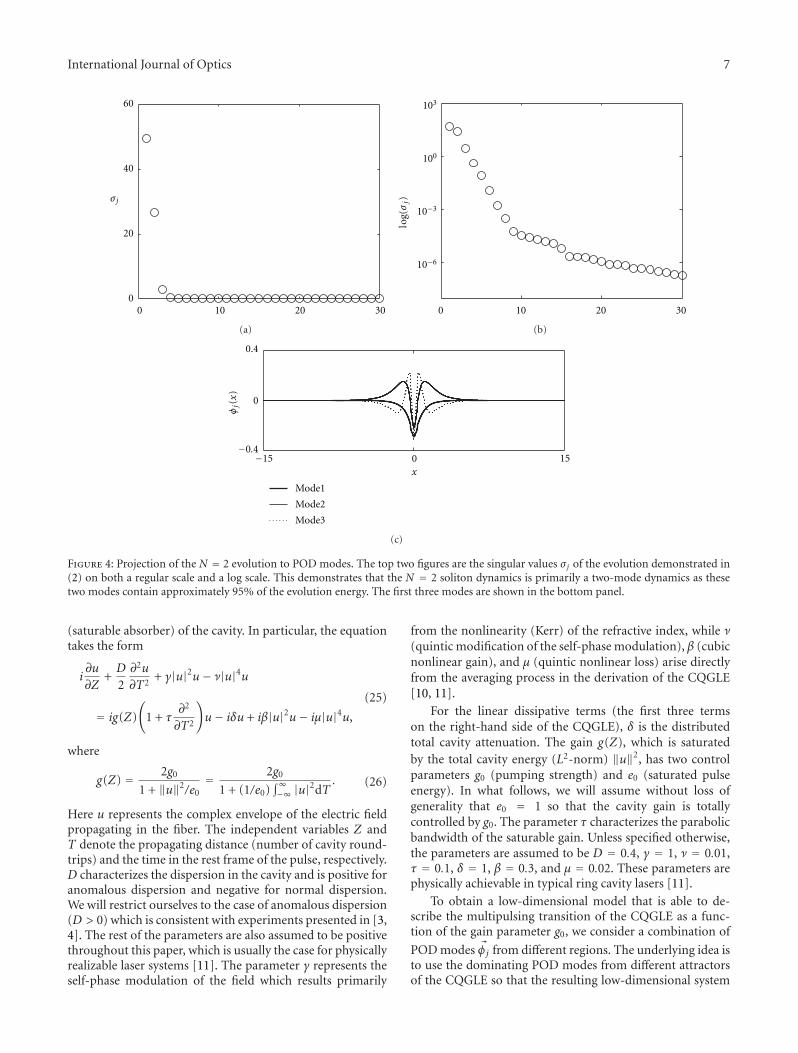
International Journal of Optics 7
0 10 20 300
20
40
60
σj
(a)
103
20 30
10−6
100
10−3
0 10
log(σ
) j
(b)
−15 0 15−0.4
0
0.4
x
φj(
x)
Mode1
Mode2
Mode3
(c)
Figure 4: Projection of the N = 2 evolution to POD modes. The top two figures are the singular values σj of the evolution demonstrated in(2) on both a regular scale and a log scale. This demonstrates that the N = 2 soliton dynamics is primarily a two-mode dynamics as thesetwo modes contain approximately 95% of the evolution energy. The first three modes are shown in the bottom panel.
(saturable absorber) of the cavity. In particular, the equationtakes the form
i∂u
∂Z+D
2∂2u
∂T2+ γ|u|2u− ν|u|4u
= ig(Z)
(1 + τ
∂2
∂T2
)u− iδu + iβ|u|2u− iμ|u|4u,
(25)
where
g(Z) = 2g0
1 + ‖u‖2/e0= 2g0
1 + (1/e0)∫∞−∞ |u|2dT
. (26)
Here u represents the complex envelope of the electric fieldpropagating in the fiber. The independent variables Z andT denote the propagating distance (number of cavity round-trips) and the time in the rest frame of the pulse, respectively.D characterizes the dispersion in the cavity and is positive foranomalous dispersion and negative for normal dispersion.We will restrict ourselves to the case of anomalous dispersion(D > 0) which is consistent with experiments presented in [3,4]. The rest of the parameters are also assumed to be positivethroughout this paper, which is usually the case for physicallyrealizable laser systems [11]. The parameter γ represents theself-phase modulation of the field which results primarily
from the nonlinearity (Kerr) of the refractive index, while ν(quintic modification of the self-phase modulation), β (cubicnonlinear gain), and μ (quintic nonlinear loss) arise directlyfrom the averaging process in the derivation of the CQGLE[10, 11].
For the linear dissipative terms (the first three termson the right-hand side of the CQGLE), δ is the distributedtotal cavity attenuation. The gain g(Z), which is saturatedby the total cavity energy (L2-norm) ‖u‖2, has two controlparameters g0 (pumping strength) and e0 (saturated pulseenergy). In what follows, we will assume without loss ofgenerality that e0 = 1 so that the cavity gain is totallycontrolled by g0. The parameter τ characterizes the parabolicbandwidth of the saturable gain. Unless specified otherwise,the parameters are assumed to be D = 0.4, γ = 1, ν = 0.01,τ = 0.1, δ = 1, β = 0.3, and μ = 0.02. These parameters arephysically achievable in typical ring cavity lasers [11].
To obtain a low-dimensional model that is able to de-scribe the multipulsing transition of the CQGLE as a func-tion of the gain parameter g0, we consider a combination of
POD modes �φj from different regions. The underlying idea isto use the dominating POD modes from different attractorsof the CQGLE so that the resulting low-dimensional system

8 International Journal of Optics
−20
0
20
1
x
|u|
0
3
6
0
t
(a)
−20
0
20
1
x
|u|
0
3
6
0
t
(b)
PDEPOD analytic
Ph
ase
00
1
2
3
3 6t
(c)
Figure 5: Comparison of (a) full PDE dynamics and (b) one-mode POD dynamics. In the bottom figure, the phase of the pulse evolution atx = 0 is plotted for the full PDE simulations and the one-mode analytic formula (circles) given in (18).
carries as much information as possible and thus approxi-mates the mode-locking dynamics better [40]. We illustratethis by combining the first m modes from the single-pulseregion with the first n modes from the double-pulse region.
Denote S as the union of the two sets of orthonormalbasis mentioned above, that is,
S ={�φ(1)
1 , . . . , �φ(1)m , �φ(2)
1 , . . . , �φ(2)n
}. (27)
Here �φ(1)j and �φ(2)
j are the POD modes computed from thesingle-pulse and double-pulse region, respectively. The orig-inal field u can be projected onto the elements of S as
u = eiθ1
⎛⎝a1S1 +m+n∑j=2
ajeiψj S j
⎞⎠, (28)
where Sj represent the elements of the combined basis S,aj are the modal amplitudes, θ1 is the phase of the firstmode, and ψj denote the phase differences with respect toθ1. One can obtain a low-dimensional system governingthe evolutions of the modal amplitudes ak and the phasedifferences ψk by substituting (28) into the CQGLE, multi-plying the resulting equation by the complex conjugate ofSk (k = 1, . . . ,m + n), integrating over all T and then sep-arating the result into real and imaginary parts. The reduced
system has, however, a complicated form due to the fact theelements in the combined basis S are not all orthonormalto each other. To address this issue, one can orthogonalizethe combined basis S prior to the projection to obtain a newbasis {Φ j}m+n
j=1 , which can be achieved by the Gram-Schmidt
algorithm. The reduced model derived from the new basisΦ j has a simpler form than the one derived directly from S,since it does not have terms that are due to nonorthogonalityof the basis functions. This reduced model will be called the(m + n) model, which indicates the number of modes takenfrom the single-pulse (m) and double-pulse (n) region.
We specifically consider the (1 + 3) model in this work[44]. The orthonormal basis {Φ j}4
j=1 obtained using the
Gram-Schmidt algorithm is shown in Figure 7. By construc-
tion, the first mode Φ1 in the new basis is identical to �φ(1)1 .
The second mode Φ2 contains a tall pulse which is identicalto the first mode at T = −6 and a small bump in the origin.In general, this tall pulse can be located on either the left orthe right of the origin, depending on the data set X for whichthe POD modes are computed from. The other two modeshave complicated temporal structures, and their oscillatorynature is mainly due to the orthogonalization.
4.1. Classification of Solutions of the (1 + 3) Model. In thissection, we study the dynamics governed by the (1+3) model,

International Journal of Optics 9
−20
0
202
1x
|u|
03
4
0
t
(a)
−20
0
202
1x
|u|
03
4
0
t
(b)
PDEPOD
Ph
ase
00
1 2 3
16
8
t
(c)
a1
a2Mod
es
0 1 2 3
5
0
10
t
(d)
Figure 6: Comparison of (a) full PDE dynamics and (b) two-mode POD dynamics. In the bottom two figures, the phase of the pulseevolution at x = 0 (middle panel) is plotted for the full PDE simulations and the two-mode dynamics along with the nonlinear oscillationdynamics of a1(t) and a2(t) (bottom panel).
whose basis functions are shown in Figure 7. This four-mode model is 7 dimensional in the sense that the dynamicvariables are the four modal amplitudes a1, a2, a3, a4 and thethree phase differences ψ2, ψ3, ψ4. To effectively characterizeany periodic behavior in the system, it is customary to usethe new set of variables
x1 = a1,
xj = aj cosψj , yj = aj sinψj
(29)
for j = 2, 3, 4, so that the formal projection of the field isgiven by
u = eiθ1
⎛⎝x1Φ1 +∑j≥2
(xj + iy j
)Φ j
⎞⎠. (30)
Figure 8 shows the solution of the (1+3) model expressedin terms of the above variables and the reconstructed fieldu at different cavity gain g0. At g0 = 3 (top panel), the(1 + 3) model supports a stable fixed point with x1 = 2.2868while the other variables are nearly zero; that is, the steadystate content of u mainly comes from Φ1, and; thus, a
single mode-locked pulse centered at the origin is expected.Increasing g0 eventually destabilizes the fixed point, anda periodic solution is formed (middle panel) which corre-sponds to a limit cycle in the 7-dimensional phase space.The reconstructed field has a tall pulse centered at theorigin due to the significant contribution of x1 (and henceΦ1). The small-amplitude side pulses are resulted from thelinear combination of the higher-order modes present in thesystem, and their locations are completely determined bythe data matrix X representing the double-pulse evolutionof the CQGLE. Further increasing g0 causes the limit cycleto lose its stability and bifurcate to another type of stablefixed point. Unlike the first fixed point, this new fixed pointhas significant contributions from both x1 and y2 which areassociated to Φ1 and Φ2. Since the other variables in thesystem become negligible when Z → ∞, a double-pulsesolution is formed. The (1 + 3) model is able to describe boththe single-pulse and double-pulse evolution of the CQGLE.The two key features of the periodic solution of the CQGLEare explicitly revealed: (i) the existence of side pulses and(ii) the small-amplitude oscillations of the entire structure.In fact, these two features are also observed in the full
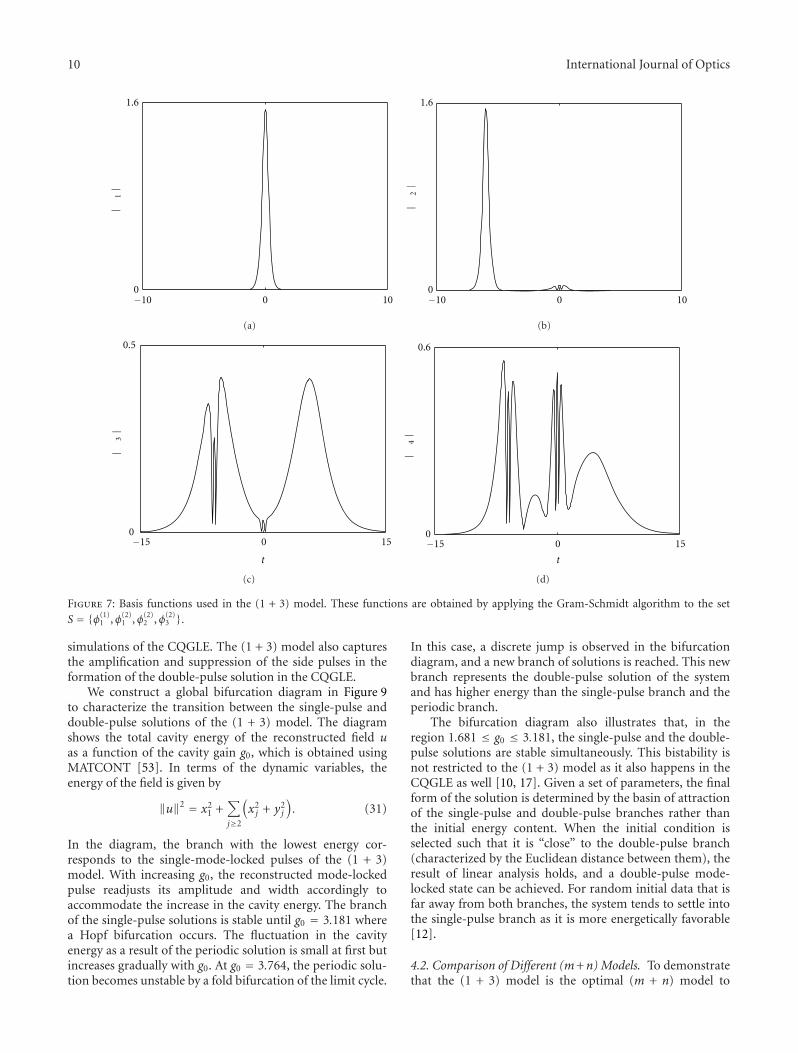
10 International Journal of Optics
−10 0 100
1.6|
1|
(a)
−10 0 100
1.6
|2|
(b)
−15 00
15
0.5
t
|3|
(c)
0.6
−15 00
15
t
|4|
(d)
Figure 7: Basis functions used in the (1 + 3) model. These functions are obtained by applying the Gram-Schmidt algorithm to the setS = {φ(1)
1 ,φ(2)1 ,φ(2)
2 ,φ(2)3 }.
simulations of the CQGLE. The (1 + 3) model also capturesthe amplification and suppression of the side pulses in theformation of the double-pulse solution in the CQGLE.
We construct a global bifurcation diagram in Figure 9to characterize the transition between the single-pulse anddouble-pulse solutions of the (1 + 3) model. The diagramshows the total cavity energy of the reconstructed field uas a function of the cavity gain g0, which is obtained usingMATCONT [53]. In terms of the dynamic variables, theenergy of the field is given by
‖u‖2 = x21 +
∑j≥2
(x2j + y2
j
). (31)
In the diagram, the branch with the lowest energy cor-responds to the single-mode-locked pulses of the (1 + 3)model. With increasing g0, the reconstructed mode-lockedpulse readjusts its amplitude and width accordingly toaccommodate the increase in the cavity energy. The branchof the single-pulse solutions is stable until g0 = 3.181 wherea Hopf bifurcation occurs. The fluctuation in the cavityenergy as a result of the periodic solution is small at first butincreases gradually with g0. At g0 = 3.764, the periodic solu-tion becomes unstable by a fold bifurcation of the limit cycle.
In this case, a discrete jump is observed in the bifurcationdiagram, and a new branch of solutions is reached. This newbranch represents the double-pulse solution of the systemand has higher energy than the single-pulse branch and theperiodic branch.
The bifurcation diagram also illustrates that, in theregion 1.681 ≤ g0 ≤ 3.181, the single-pulse and the double-pulse solutions are stable simultaneously. This bistability isnot restricted to the (1 + 3) model as it also happens in theCQGLE as well [10, 17]. Given a set of parameters, the finalform of the solution is determined by the basin of attractionof the single-pulse and double-pulse branches rather thanthe initial energy content. When the initial condition isselected such that it is “close” to the double-pulse branch(characterized by the Euclidean distance between them), theresult of linear analysis holds, and a double-pulse mode-locked state can be achieved. For random initial data that isfar away from both branches, the system tends to settle intothe single-pulse branch as it is more energetically favorable[12].
4.2. Comparison of Different (m+n) Models. To demonstratethat the (1 + 3) model is the optimal (m + n) model to

International Journal of Optics 11
0 100−1.5
4.5
−10 0
0
10 0
5000
4
z
zt
|u|
x1
(a)
−1.5
4.5
−10 0
0
10 0
5000
4
z
zt
|u|
495 500
x1
(b)
0 200−10 0
0
10 0
500
0
4
z
z t
|u|
x1
−5
5
y2
(c)
Figure 8: Left: the solution of the (1+3) model at g0 = 3 (top), g0 = 3.24 (middle), and g0 = 3.8 (bottom). Here, only the significant variables(in absolute value) are labeled. Right: the corresponding reconstructed field u from the variables of the (1 + 3) model.
0 1 2 3 4 5 6 72
4
6
8
10
12
Stable
Unstable
g0
∥u∥2
Figure 9: Bifurcation diagram of the total cavity energy of thereconstructed field u as a function of g0. Here the bottom branch(blue) represents the single-pulse solution, and the top branch (red)represents the double-pulse solution. The middle branch (green)denotes the extrema of the energy of the periodic solution.
characterize the transition from a single-mode-locked pulseinto two pulses that occurs in the CQGLE, we consider the(1 + 2) model whose results are shown in the top row ofFigure 10. This model can be derived by setting the variablesx4 and y4 in the (1 + 3) model to zero. At g0 = 3 atall stable pulse is formed at T = −6 together with asmall residual at the origin. The entire structure has closeresemblance to Φ2 from the Gram-Schmidt procedure (seeFigure 7). The tall pulse agrees with the single-pulse solutionof the CQGLE quantitatively. When the structure loses itsstability, a periodic solution is formed which persists even atunrealistically large values of cavity gain such as g0 = 7.
The middle row of the same figure shows the numericalsimulations of the (1 + 4) model, which is derived fromthe combination of the first POD mode from the single-pulse region with the first four modes from the double-pulseregion. This model is able to reproduce all the key dynamicsobserved during the multipulsing phenomenon shown inFigure 8. The difference between the (1 + 4) model and the(1 + 3) model is the locations at which the bifurcationsoccur. In the previous section we showed that the single-pulse solution described by the (1+3) model loses stability atg0 = 3.181 (Hopf bifurcation), and the subsequent periodicsolution bifurcates into the double-pulse solution at g0 =3.764. For the (1 + 4) model, these two bifurcations occur

12 International Journal of Optics
z
t
|u|
−10
(1 + 2)
(1 + 4)
(2 + 3)
1000
100
0
0
4
z
t
|u|1000
0
0
0
4
z
t
|u|
−5
−5
1000
5
5
0
0
0
4
z
t
|u|
−10
1000
100
0
0
4
z
t
|u|
−10
1000
100
0
0
4
z
t
|u|
−10
1000
100
0
0
4
z
t
|u|
−15
1000
150
0
0
4
z
t
|u|
−15
1000
150
0
0
4
z
t
|u|
−15
1000
150
0
0
4
Figure 10: Top: the reconstructed field of the (1 + 2) model at g0 = 3 (left), g0 = 4.3 (middle), and g0 = 7 (right). Middle: the reconstructedfield of the (1 + 4) model at g0 = 3 (left), g0 = 3.4 (middle), and g0 = 3.8 (right). Bottom: the reconstructed field of the (2 + 3) model atg0 = 3 (left), g0 = 3.4 (middle), and g0 = 3.7 (right).
at g0 = 3.173 and g0 = 3.722, respectively, which are closer tothe values predicted using the full simulations of the CQGLE(g0 ≈ 3.15 and g0 ≈ 3.24). The (2 + 3) model (bottomrow of Figure 10) produces similar results as the (1 + 3) andthe (1 + 4) models, with pulse transitions occurring at g0 =3.177 and 3.678. The comparison here shows that the third
POD mode �φ(2)3 from the double-pulse region is essential for
getting the right pulse transition. Once this mode is included,further addition of the POD modes has only a minor effecton the accuracy of the low-dimensional model.
5. Waveguide Array Mode-Locking Model
The waveguide array mode-locking model (WGAML)describes the mode-locking process in a fiber waveguide
system that combines the saturable absorption of the waveg-uide with the saturating and the bandwidth-limited gain oferbium-doped fiber [12, 14]. The governing equations forsuch a system are given by
i∂A0
∂Z+D
2∂2A0
∂T2+ β|A0|2A0
− ig(Z)
(1 + τ
∂2
∂T2
)A0 + iγ0A0 + CA1 = 0,
i∂A1
∂Z+ C(A0 + A2) + iγ1A1 = 0,
i∂A2
∂Z+ CA1 + iγ2A2 = 0,
(32)

International Journal of Optics 13
with
g(z) = 2g0
1 + ‖A0‖2/e0, (33)
where A0, A1, and A2 are the envelopes of the electric field inwaveguides 0, 1, and 2, respectively. The normalized param-eters used in the following sections are(
D,β,C, γ0, γ1, γ2, τ, e0) = (1, 8, 5, 0, 0, 10, 0.1, 1), (34)
where D controls the strength and the type (normal oranomalous) of the chromatic dispersion, β is the strength ofthe Kerr nonlinearity, g is the saturating gain, τ is the band-width of the gain, γj is a linear loss in the jth waveguide, andC controls the strength of the evanescent coupling betweenadjacent waveguides. For a derivation and description of thegoverning equations, see the work of Proctor and Kutz [14]as well as Kutz and Sandstede [12]. As shown by Kutz andSandstede [12], the WGAML undergoes a region of chaotictranslating behaviors for sufficiently large values of g0. Thiscreates major difficulties in applying reduced dimensionalmodels based on the POD [45]. Therefore, in this paper werestrict ourselves to the set of solutions that are even up toa translation in T .
In order to develop a low-dimensional model, we assumethat
A0(T , z) =N∑j=1
aj(z)φ(0)j (T),
A1(T , z) =N∑j=1
bj(z)φ(1)j (T),
A2(T , z) =N∑j=1
cj(z)φ(2)j (T),
(35)
where φ(i)j is the jth POD mode from the ith waveguide, and
N is the total number of retained POD modes. Substituting(35) into the WGAML in (32) and taking an inner product
with each of φ(i)j gives the following system of ordinary dif-
ferential equations
∂an∂Z
=(iD
2+ gτ
) N∑j=1
〈φ(0)n , ∂2
Tφ(0)j 〉aj +
(g − γ0
)an
+ iCN∑j=1
⟨φ(0)n ,φ(1)
j
⟩bj
+ iβN∑j=1
N∑k=1
N∑m=1
⟨φ(0)n ,φ(0)
k φ(0)j φ
(0)∗m
⟩ajaka
∗m,
∂bn∂Z
= iCN∑j=1
(⟨φ(1)n ,φ(0)
j
⟩aj +
⟨φ(1)n ,φ(2)
j
⟩cj)− γ1bn,
∂cn∂Z
= iCN∑j=1
⟨φ(2)n ,φ(1)
j
⟩bj − γ2cn,
(36)
1
0.5
06
54
32
1 −10
0
10Mode number T
Figure 11: POD modes taken from the combined data set for the0th waveguide that are capable of qualitatively reproducing thedynamics observed in the full WGAML model.
where 〈u, v〉 = ∫∞−∞ u∗vdT and
g = 2g0
1 +∑N
j=1
∣∣∣aj∣∣∣2/e0
. (37)
The resulting system is a set of 3N nonlinear evolutionequations for the coefficient of the POD modes. This reducedset of equations is quite generic and is valid for any set oforthonormal functions, whether obtained through the PODor some other means. In order for this reduced model to bean accurate approximation of the full evolution equationsover a range of g0, the φ
(i)j must be chosen carefully. The
process through which the φ(i)j were obtained is described in
Section 5.1. In Section 5.2, we use these modes to determinethe bifurcations of the reduced model.
5.1. POD Mode Selection. In order to accurately capture thedynamics of the WGAML, the POD modes must be drawnfrom a particular set of data. Unlike with the CQGLEcase, we do not combine POD modes drawn from differentregimes through an orthonormalization process. Instead, wecombine individual runs obtained at different values of g0
into one combined dataset. Each individual run consists of ashort-time but high-resolution solution for Z ∈ [0, 10] witha sampling period of ΔZ = 5 × 10⁻³. The initial conditionsused were a small perturbation away from the attractor forthe fixed value of g0. By combining these individual runs intoa single data set, the SVD provides the set of POD modes thatbest captures the energy of the global dynamics through thetransition from one to two pulses.
Figure 11 shows the first six POD modes generated usingthe methodology described in the preceding paragraph forsolutions of the even WGAML model. Only the modes of the0th waveguide are shown. However, there are two additionalsets of modes, one for each of the other two waveguides.The data set includes information from the single-pulse, thebreather, the chaotic, and the double-pulse solutions. Thesesix modes capture over 99% of the modal energy, and 99.9%may be captured by including an additional four modes. Theresulting modes do not resemble the modes that would be

14 International Journal of Optics
acquired from any run with a fixed value of g0. Indeed, thePOD modes appear to be a nontrivial combination of themodes from all the runs at different gain values. These modeswould be impossible to predict a priori even with knowledgeabout the solutions of the system.
5.2. Low-Dimensional Dynamics. In this section, the reducedmodel is used to study the multipulsing transition of theWGAML. The reduced model is obtained by the Galerkinprojection of WGAML model in (32) onto the global PODmodes in Figure 11. This produces a system of differentialequations of the form shown in (36). To determine the valid-ity of the reduced model, we compare the full version of theevolution equations and the POD model dynamics for fixedvalues of g0 in the relevant ranges for single-pulse, breather,chaotic, and double-pulse solutions using low-amplitudenoise as the initial condition in both the full and reduceddynamics. The evolution considered is for a long periodof time so that the attractor is reached for each value g0
considered. In this manner, the full and reduced dynamicsof the WGAML starting from a cold-cavity configurationcan be compared. In addition to comparing the solutions ata single value of g0, we also compare the branches of single-pulse and breather solutions in both models. This allows themultipulsing transition to be studied in both systems.
The first row of Figure 12 shows the single-pulse, breath-er, chaotic, and double-pulse solutions reconstructed usinga six-mode POD model, ordered from left to right. To obtainthese solutions, the reduced model was evolved forward for1000 units in Z starting with a low-amplitude white-noiseinitial condition. These results compare favorably with thesame four regimes of the even WGAML dynamics shown inthe second row of Figure 12, whose solutions were obtainedby evolving for 200 units in Z starting from low amplitudeeven white noise. The reduced model qualitatively capturesthe dynamics and the profile of the solution. The primarydifference is the value of g0 at which these solutions areobtained. The stationary solutions of the POD model losestability at lower values of g0 than the stationary solutionsof the WGAML. Further, the breather solutions in the PODmodel remain stable for larger values of g0 than those in theWGAML. Due to the vastly smaller dimension of the reducedmodel and the range of g0 for which the POD generateddifferential equations are valid, some disparity between themodels is inevitable.
The advantage of the reduced model over the full dynam-ics is that the bifurcation diagram, including the stability andbifurcations of periodic solutions, can be explicitly calculatedand categorized in the reduced model. The bifurcationsoftware, MATCONT [53], was used to track and computethe stability of the single-pulse and breather solutions of theWGAML. The chaotic and the double-pulse solutions wereobtained using direct numerical simulations. While othersolution branches may exist, they do not appear as attractorsfor white-noise initial conditions and are not discussed here.
The first row of Figure 13 shows the bifurcation diagramof the reduced model including solution branches for thestationary, breather, chaotic, and double-pulse solutions. Thebranches marked in solid (blue) curves are linearly stable
stationary solutions, and the branches marked in dashed(red) curves are linearly unstable stationary solutions. Forthe periodic solutions, the branches marked by black x sym-bols and denote the extrema of∥∥∥�A∥∥∥2 = ‖A0‖2 + ‖A1‖2 + ‖A2‖2, (38)
where ‖An‖2 = ∫∞−∞ |An(T)|2dT . If no extrema exist, the
mean value ‖�A‖ is denoted with a black dot. This bifurcationdiagram reveals the sequence of bifurcations responsible forthe multi-pulse transition. At the lowest values of g0, the onlystable solution is the quiescent (trivial) solution because thegain is insufficient to overcome the cavity losses. The firstnontrivial solution is the single-pulse solution, which firstappears from the saddle-node bifurcation that is labeled (a)in Figure 13 at g0 = 0.7229. The value of g0 represents theminimum gain needed for a single-pulse solution to exist inthe WGAML. Although only the modes of the 0th waveguideare shown, these single-pulse solutions distribute energy inall three of the waveguides, and the presence of energy inthe other two waveguides is critical for the stabilization ofthese solutions. For larger values of g0, there are two branchesof single-pulse solutions that emanate from (a). The firstbranch is a high-amplitude stable branch of solutions, andthe other is a low-amplitude unstable branch. Following thelow-amplitude unstable branch of solutions, another saddle-node bifurcation, which is labeled (b) in Figure 13, occurs.This bifurcation creates a stable branch of low-amplitudestationary solutions. Because their basin of attraction issmall, these solutions are unlikely to appear for white-noiseinitial conditions. They are, however, known to exist in thefull WGAML dynamics [29]. This extra branch of stationarysolutions loses stability through a Hopf bifurcation at thepoint labeled (c) in Figure 13. Therefore, the branch of low-amplitude stationary solutions does not play a role in themulti-pulse transition process.
On the other hand, the branch of larger-amplitude solu-tions participates in the multi-pulse transition. This branchof single-pulse solutions can be shown to be stable. Becausewe have assumed even solutions, the zero eigenvalue associ-ated with translational invariance does not exist in the low-dimensional system. On the other hand, the zero eigenvalueassociated with phase invariance persists. Although thevalues of the eigenvalues differ, the stability results agreequalitatively with the full results obtained with the Floquet-Fourier-Hill method [29]. For a range of g0, all other eigen-values have negative real parts with the exception of the zeroeigenvalue. As g0 increases, this branch becomes unstablethrough a supercritical Hopf bifurcation, which is shownin Figure 13 at (d). The Hopf bifurcation occurs when theeigenvalues of the linearized operator include a complex-conjugate pair of eigenvalues with zero real part. As a result,the single-pulse solution becomes unstable, but a stablelimit-cycle is generated. These limit cycles are the breathersolutions of the WGAML.
As g0 is increased, the breather solutions themselves willlose stability through two bifurcations in rapid succession.The first of these bifurcations is a period-doubling bifurca-tion. After the period-doubling bifurcation, the solution is

International Journal of Optics 15
|A0|
ZT
OD
EEv
enP
DE
OD
EEv
enP
DE
OD
EEv
enP
DE
OD
EEv
enP
DE
2
2
0
00
5
−5
|A0|
ZT
2
2
0
00
5
−5
|A0|
ZT
2
2
0
00
5
−5
|A0|
ZT
2
2
0
00
5
−5
|A0|
ZT
2
2
0
00
5
−5
|A0|
ZT
2
2
0
00
5
−5
|A0|
ZT
2
2
0
00
5
−5
|A0|
ZT
2
2
0
00
5
−5
Figure 12: Top: surface and pseudocolor plots of the single-pulse, breather, chaotic, and double-pulse solutions computed for the finite-dimensional model at g0 = 1.5, 2.5, 3.495, and 3.5, respectively. Bottom: the same plots for the even WGAML model taken at g0 = 2.3, 2.5,3.1, and 3.2, respectively. The reduced model accurately reproduces the four behaviors observed.
OD
E
2
1
00.5 1 1.5 2 2.5
(a)
(b)
(c)
(d)
g0
OD
E
210
2
3
4
(a)
(b)(c)
(d)
(e, f)
g0 g0
OD
E
2
3
3.3 3.4 3.5
(e, f)
5
4
2
1
00.5 1 1.5 2 2.5
g0
Even
PD
E
210
2
3
4(e, f)
g0
Even
PD
E
2
3
5
4
g0
2.9 3 3.1
Even
PD
E
Figure 13: Top: the bifurcation diagram of energy (L2 norm) versus g0 for the multi-pulse transition in the POD model. Bottom: thebifurcation diagram of the multi-pulse transition of the WGAML model. The different plots show the same diagram with emphasis ondifferent regions of the transition. For the stationary solutions, emphasized on the left, linearly unstable regions are dashed (red) lines whilelinearly stable regions are solid (blue) lines. Stationary solutions that were not computed explicitly are denoted with dots. For the periodicsolutions, the xs are the local extrema of the energy (L2 norm).
still periodic in Z but with a larger period. In the reducedmodel, the Floquet multipliers can be computed explicitly.One of the multipliers was found to be−1, so the bifurcationthat occurs is indeed a period-doubling bifurcation. Thenew stable period-doubled limit cycles almost immediatelylose stability through supercritical Neimark-Sacker bifurca-tion. The Neimark-Sacker bifurcation, also called a Torus
bifurcation or secondary Hopf-bifurcation, occurs when acomplex-conjugate pair of the Floquet multipliers leave theunit circle. In this case, the limit cycle loses stability, but atorus that encloses the original limit cycle becomes stable.The Neimark-Sacker bifurcation indicates the presence ofquasi-periodic solutions in the POD model. The perioddoubling and the Neimark-Sacker bifurcations can be seen

16 International Journal of Optics
Table 1: The values of g0 associated with each bifurcation in theODE and PDE. The labels correspond to the bifurcations of theODE in Figure 13. Values in parenthesis are estimated from thesame figure.
Label Bifurcation type ODE Even PDE
(a) Saddle node 0.7229 0.6522
(b) Saddle node 1.424 1.429
(c) Hopf 1.398 1.369
(d) Hopf 1.753 2.404
(e) Period doubling 3.3872 (3.0± 0.1)
(f) Neimark-Sacker 3.3873 (3.0± 0.1)
in the top right panel of Figure 13 when the pair of extremasplits at the points labeled (e) and (f). MATCONT is unableto track branches of quasiperiodic solutions, but as shown inFigure 13, further bifurcations occur, and the ODE exhibitschaos. At the same time, the double-pulse solutions aregaining stability, and the system completes the transitionfrom single- to double-pulse solutions.
The bifurcation diagram of the ODE shows remarkablequalitative agreement with the bifurcation diagram of the fullWGAML dynamics illustrated in the second row of Figure 13.For the full system, linear stability has only been determinedfor the stationary solutions [29]. For the stationary solutions,the types of bifurcations agree completely between thereduced and full models. Additionally, the value of g0 agreesrelatively well for all of the bifurcations as shown in Table 1.Although explicit stability results do not exist for the breathersolutions, the same qualitative sequence occurs. The breathersolutions lose stability around g0 = 2.9 and serves as a routeto chaos in Z.
6. Conclusion
The POD method, used here to construct the low-dimen-sional models for two different mode-locking systems, resultsas a robust tool for the study of the dynamics of nonlinearevolution equations describing various optical systems. Inmany cases where the observed dynamics are coherent butnot trivial and exhibit various phenomena, the POD is thenatural choice to construct a reduced and tractable model.If the model correctly reproduces the observed dynamics, itcan then be studied using simpler computational methodsand in special cases analytically in order to identify thebifurcations responsible for observed phenomena. The PODmethodology can be easily modified for changes in themodel. Such robustness of the method, allows one to studythe operating regimes of mode-locked lasers as a function ofthe parameters in the system, specifically the change in gainthat occurs during the multi-pulse transition.
For the mode-locking dynamics governed by the CQGLEmodel, the reduced system obtained via the POD method isable to capture the pulse transition that occurs in the laserwhen the cavity gain g0 is increased. It is shown that a four-mode reduction (also known as the (1+3) model) is adequateto capture the transition from a single-mode-locked pulse totwo pulses through an intermediate periodic state observed
in the CQGLE. It is found that the form of the single-pulse, double-pulse, and the periodic solutions observedin the full numerics of the CQGLE can be accuratelyrepresented by the fixed points and limit cycles of the (1 + 3)model. When g0 is increased, the fixed point representingthe single-mode-locked pulse bifurcates into a stable limitcycle (periodic solution) through a Hopf bifurcation andthen into a new type of fixed point (double-pulse solution).The pulse profiles predicted by the (1 + 3) model agree wellwith those generated by the full system. The model alsodemonstrates a bistability between the single-pulse solutionand the double-pulse solution which also occurs in theCQGLE. The bifurcation diagram can be used as a guidelinefor achieving different types of solutions by choosing theinitial condition appropriately.
For the mode-locking dynamics governed by theWGAML, the reduced model obtained by projecting the evenWGAML model onto six global POD modes qualitativelyreproduces the dynamics over the relevant range of gainvalues for which the transition from a single pulse to adouble pulse occurs. In particular, for low values of g0, themodel completely reproduces the dynamics of the single-pulse solution, including its bifurcations in a region of lowamplitude solutions discovered earlier [29]. With increasinggain g0, the single-pulse solution bifurcates to a limit cycle viaa Hopf bifurcation, matching the study of WGAML model[12]. Our analysis indicates that as the limit cycle grows wheng0 is further increased, it will eventually become chaoticthrough a series of bifurcations, initiated by a period-doubl-ing bifurcation and then almost immediately followed bya Neimark-Sacker (Torus) bifurcation. The chaos in the Zdirection is terminated by the double-pulse solution gainingstability and becoming the attractor for low-amplitude solu-tions. Here, the WGAML was modeled as a three-waveguidearray. However, using the same methodology, a system ofN-waveguide arrays could be studied. Only minor modifica-tions to (36) are required to model a system with a differentnumber of waveguides.
The parameters in the two reduced models constructedhere indicate the physical setup of the mode-locking system,and their values were considered as fixed. By allowing vari-ation of some of the parameters, the reduced models canserve as a framework for investigating optimal mode-lock-ing and studying the nontrivial behavior observed in themultipulsing transition [21, 24]. Specifically, by using thedescribed methodology, the application of standard contin-uation methods (such as MATCONT) and stability analysisto the reduced model allows for the constructing of a bi-furcation diagram for the reduced model. Such a diagramindicates the impact of the parameters on the multi-pulsetransition. It can reveal operating regimes for which multi-pulse transition is abrupt or results with a more complexbehavior. Furthermore, it can be used to determine the opti-mal working regime for the mode-locking laser (maximalsuppression of the multi-pulse instability), by searching for aset of parameters for which there is a maximal range of inputcavity gain that supports stable single-pulse solutions.
In addition, models based on the POD are sometimesable to predict dynamics in regions outside of the data set,

International Journal of Optics 17
where the POD modes were computed, the low-dimensionalmodel can be used to find interesting regions within the sys-tem without having to develop an appropriate approach.Once these regions have been identified, by altering the useddata set, a more accurate representation of the region canbe developed. In summary, the POD reduction gives a com-pletely new and insightful way to explore the dynamics andbifurcations of a given system.
Acknowledgments
J. N. Kutz acknowledges support from the National ScienceFoundation (NSF) (DMS-0604700) and the US Air ForceOffice of Scientific Research (AFOSR) (FA9550-09-0174).
References
[1] H. A. Haus, “Mode-locking of lasers,” IEEE Journal on SelectedTopics in Quantum Electronics, vol. 6, no. 6, pp. 1173–1185,2000.
[2] J. N. Kutz, “Mode-locked soliton lasers,” SIAM Review, vol. 48,no. 4, pp. 629–678, 2006.
[3] K. Tamura, H. A. Haus, and E. P. Ippen, “Self-starting additivepulse mode-locked erbium fibre ring laser,” Electronics Letters,vol. 28, no. 24, pp. 2226–2228, 1992.
[4] H. A. Haus, E. P. Ippen, and K. Tamura, “Additive-pulse mode-locking in fiber lasers,” IEEE Journal of Quantum Electronics,vol. 30, pp. 200–208, 1994.
[5] A. Chong, J. Buckley, W. Renninger, and F. Wise, “All-normal-dispersion femtosecond fiber laser,” Optics Express, vol. 14, no.21, pp. 10095–10100, 2006.
[6] A. Chong, W. H. Renninger, and F. W. Wise, “Properties ofnormal-dispersion femtosecond fiber lasers,” Journal of theOptical Society of America B, vol. 25, no. 2, pp. 140–148, 2008.
[7] T. Brabec, C. Spielmann, P. F. Curley, and F. Krausz, “Kerr lensmode locking,” Optics Letters, vol. 17, pp. 1292–1294, 1992.
[8] H. A. Haus, J. G. Fujimoto, and E. P. Ippen, “Structures foradditive pulse mode-locking,” Journal of the Optical Society ofAmerica B, vol. 8, p. 2068, 1991.
[9] W. H. Renninger, A. Chong, and F. W. Wise, “Dissipative soli-tons in normal-dispersion fiber lasers,” Physical Review A, vol.77, no. 2, Article ID 023814, 2008.
[10] A. Komarov, H. Leblond, and F. Sanchez, “Quintic complexGinzburg-Landau model for ring fiber lasers,” Physical ReviewE, vol. 72, no. 2, Article ID 025604, pp. 1–4, 2005.
[11] E. Ding and J. N. Kutz, “Operating regimes, split-step model-ing, and the Haus master mode-locking model,” Journal of theOptical Society of America B, vol. 26, no. 12, pp. 2290–2300,2009.
[12] J. N. Kutz and B. Sandstede, “Theory of passive harmonicmode-locking using waveguide arrays,” Optics Express, vol. 16,no. 2, pp. 636–650, 2008.
[13] D. D. Hudson, K. Shish, T. R. Schibli et al., “Nonlinear fem-tosecond pulse reshaping in waveguide arrays,” Optics Letters,vol. 33, no. 13, pp. 1440–1442, 2008.
[14] J. L. Proctor and J. N. Kutz, “Theory and simulation of passivemode-locking by use of waveguide arrays,” Optics Letters, vol.30, no. 15, pp. 2013–2015, 2005.
[15] N. N. Akhmediev, A. Ankiewicz, and J. M. Soto-Crespo, “Mul-tisoliton solutions of the complex ginzburg-landau equation,”Physical Review Letters, vol. 79, no. 21, pp. 4047–4051, 1997.
[16] J. M. Soto-Crespo, N. N. Akhmediev, V. V. Afanasjev, andS. Wabnitz, “Pulse solutions of the cubic-quintic complexGinzburg-Landau equation in the case of normal dispersion,”Physical Review E, vol. 55, no. 4, pp. 4783–4796, 1997.
[17] A. Komarov, H. Leblond, and F. Sanchez, “Multistability andhysteresis phenomena in passively mode-locked fiber lasers,”Physical Review A, vol. 71, no. 5, Article ID 053809, pp. 1–9,2005.
[18] C. Y. Wang, W. Zhang, K. F. Lee, and K. M. Yoo, “Pulse splittingin a self-mode-locked Ti:sapphire laser,” Optics Communica-tions, vol. 137, no. 1–3, pp. 89–92, 1997.
[19] M. Lai, J. Nicholson, and W. Rudolph, “Multiple pulse oper-ation of a femtosecond Ti:sapphire laser,” Optics Communica-tions, vol. 142, no. 1–3, pp. 45–49, 1997.
[20] M. Horowitz, C. R. Menyuk, T. F. Carruthers, and I. N. Duling,“Theoretical and experimental study of harmonically mode-locked fiber lasers for optical communication systems,” Jour-nal of Lightwave Technology, vol. 18, no. 11, pp. 1565–1574,2000.
[21] B. G. Bale, K. Kieu, J. N. Kutz, and F. Wise, “Transition dynam-ics for multi-pulsing in mode-locked lasers,” Optics Express,vol. 17, no. 25, pp. 23137–23146, 2009.
[22] Q. Xing, L. Chai, W. Zhang, and C. Y. Wang, “Regular, period-doubling, quasi-periodic, and chaotic behavior in a self-mode-locked Ti:sapphire laser,” Optics Communications, vol. 162, no.1, pp. 71–74, 1999.
[23] J. M. Soto-Crespo, M. Grapinet, P. Grelu, and N. Akhmediev,“Bifurcations and multiple-period soliton pulsations in a pas-sively mode-locked fiber laser,” Physical Review E, vol. 70, no.6, Article ID 066612, pp. 1–11, 2004.
[24] P. Grelu, F. Belhache, F. Gutty, and J. M. Soto-Crespo, “Phase-locked soliton pairs in a stretched-pulse fiber laser,” OpticsLetters, vol. 27, no. 11, pp. 966–968, 2002.
[25] S. Namiki, E. P. Ippen, H. A. Haus, and C. X. Yu, “Energy rateequations for mode-locked lasers,” Journal of the Optical Soci-ety of America B, vol. 14, no. 8, pp. 2099–2111, 1997.
[26] T. Kapitula, J. N. Kutz, and B. Sandstede, “Stability of pulsesin the master mode-locking equation,” Journal of the OpticalSociety of America B, vol. 19, no. 4, pp. 740–746, 2002.
[27] T. Kapitula, N. Kutz, and B. Sandstede, “The Evans functionfor nonlocal equations,” Indiana University Mathematics Jour-nal, vol. 53, no. 4, pp. 1095–1126, 2004.
[28] J. M. Soto-Crespo, N. N. Akhmediev, and V. V. Afanasjev,“Stability of the pulselike solutions of the quintic complexGinzburg-Landau equation,” Journal of the Optical Society ofAmerica B, vol. 13, no. 7, pp. 1439–1449, 1996.
[29] C. R. Jones and J. N. Kutz, “Stability of mode-locked pulsesolutions subject to saturable gain: computing linear stabilitywith the Floquet-Fourier-Hill method,” Journal of the OpticalSociety of America B, vol. 27, no. 6, pp. 1184–1194, 2010.
[30] S. K. Turitsyn and V. K. Mezentsev, “Dynamics of self-similardispersion-managed soliton presented in the basis of chirpedGauss-Hermite functions,” JETP Letters, vol. 67, no. 9, pp.640–646, 1998.
[31] S. K. Turitsyn, T. Schafer, and V. K. Mezentsev, “Self-sim-ilar core and oscillatory tails of a path-averaged chirpeddispersion-managed optical pulse,” Optics Letters, vol. 23, no.17, pp. 1351–1353, 1998.
[32] Y. S. Kivshar, T. J. Alexander, and S. K. Turitsyn, “Nonlinearmodes of a macroscopic quantum oscillator,” Physics Letters,Section A, vol. 278, no. 4, pp. 225–230, 2001.
[33] A. Bondeson, M. Lisak, and D. Anderson, “Soliton perturba-tions: a variation principle for the soliton parameters,” PhysicaScripta, vol. 20, no. 3-4, pp. 479–485, 1979.
18 International Journal of Optics
[34] D. Anderson, M. Lisak, and A. Berntson, “A variationalapproach to nonlinear evolution equations in optics,” Pra-mana, vol. 57, no. 5-6, pp. 917–936, 2001.
[35] B. A. Malomed, “Resonant transmission of a chirped solitonin a long optical fiber with periodic amplification,” Journal ofthe Optical Society of America B, vol. 13, no. 4, pp. 677–686,1996.
[36] D. Anderson and M. Lisak, “Bandwidth limits due to mutualpulse interaction in optical soliton communications systems,”Optics Letters, vol. 11, p. 174, 1986.
[37] W. Chang, A. Ankiewicz, J. M. Soto-Crespo, and N. Akhme-diev, “Dissipative soliton resonances,” Physical Review A, vol.78, no. 2, Article ID 023830, 2008.
[38] E. Ding and J. N. Kutz, “Stability analysis of the mode-lockingdynamics in a laser cavity with a passive polarizer,” Journal ofthe Optical Society of America B, vol. 26, no. 7, pp. 1400–1411,2009.
[39] B. G. Bale and J. N. Kutz, “Variational method for mode-locked lasers,” Journal of the Optical Society of America B, vol.25, no. 7, pp. 1193–1202, 2008.
[40] P. Holmes, J. Lumley, and G. Berkooz, Eds., Turbulence, Coher-ent Structures, Dynamical Systems and Symmetry, CambridgeUniversity Press, Cambridge, UK, 1996.
[41] L. N. Trefethen and D. Bau, Numerical Linear Algebra, SIAM,1997.
[42] D. S. Broomhead and G. P. King, “Extracting qualitativedynamics from experimental data,” Physica D, vol. 20, no. 2-3,pp. 217–236, 1986.
[43] L. Sirovich, “Turbulence and the dynamics of coherent struc-tures part i: coherent structures,” Quarterly of Applied Mathe-matics, vol. 45, p. 561, 1987.
[44] E. Ding, E. Shlizerman, and J. N. Kutz, “Modeling multi-pulsing transition in ring cavity lasers with proper orthogonaldecomposition,” Physical Review A, vol. 82, Article ID 023823,2010.
[45] M. O. Williams, E. Shlizerman, and J. N. Kutz, “The multi-pulsing transition in mode-locked lasers: a low-dimensionalapproach using waveguide arrays,” Journal of the Optical Soci-ety of America B, vol. 27, no. 12, pp. 2471–2481, 2010.
[46] M. Ilak and C. W. Rowley, “Reduced-order modeling of chan-nel flow using traveling POD and balanced POD,” in Proceed-ings of the 3rd AIAA Flow Control Conference, pp. 864–874,June 2006.
[47] M. Ilak and C. W. Rowley, “Modeling of transitional chan-nel flow using balanced proper orthogonal decomposition,”Physics of Fluids, vol. 20, no. 3, Article ID 034103, 2008.
[48] E. A. Christensen, M. Brøns, and J. N. Sørensen, “Evaluation ofproper orthogonal decomposition-based decomposition tech-niques applied to parameter-dependent nonturbulent flows,”SIAM Journal on Scientific Computing, vol. 21, no. 4, pp. 1419–1434, 1999.
[49] P. del Sastre and R. Bermejo, Numerical Mathematics andAdvanced Applications, Springer, 2006.
[50] A. Liakopoulos, P. A. Blythe, and H. Gunes, “A reduced dy-namical model of convective flows in tall laterally heated cav-ities,” Proceedings of the Royal Society of London, vol. 453, no.1958, pp. 663–672, 1997.
[51] L. Sirovich, R. Everson, E. Kaplan, B. W. Knight, E. O’Brien,and D. Orbach, “Modeling the functional organization of thevisual cortex,” Physica D, vol. 96, no. 1–4, pp. 355–366, 1996.
[52] A. Chatterjee, “An introduction to the proper orthogonal de-composition,” Current Science, vol. 78, no. 7, pp. 808–817,2000.
[53] A. Dhooge, W. Govaerts, and Y. A. Kuznetsov, “MATCONT:a MATLAB package for numerical bifurcation analysis ofODEs,” ACM Transactions on Mathematical Software, vol. 29,no. 2, pp. 141–164, 2003.

Hindawi Publishing CorporationInternational Journal of OpticsVolume 2012, Article ID 573843, 14 pagesdoi:10.1155/2012/573843
Review Article
Nonlinear Optical Signal Processing forTbit/s Ethernet Applications
L. K. Oxenløwe, M. Galili, H. C. Hansen Mulvad, H. Hu, J. L. Areal, E. Palushani, H. Ji,A. T. Clausen, and P. Jeppesen
DTU Fotonik, Department of Photonics Engineering, Technical University of Denmark, Building 343, 2800 Kongens Lyngby, Denmark
Correspondence should be addressed to L. K. Oxenløwe, [email protected]
Received 31 May 2011; Accepted 12 July 2011
Academic Editor: Christophe Finot
Copyright © 2012 L. K. Oxenløwe et al. This is an open access article distributed under the Creative Commons Attribution License,which permits unrestricted use, distribution, and reproduction in any medium, provided the original work is properly cited.
We review recent experimental demonstrations of Tbaud optical signal processing. In particular, we describe a successful1.28 Tbit/s serial data generation based on single polarization 1.28 Tbaud symbol rate pulses with binary data modulation (OOK)and subsequent all-optical demultiplexing. We also describe the first error-free 5.1 Tbit/s data generation and demodulationbased on a single laser, where a 1.28 Tbaud symbol rate is used together with quaternary phase modulation (DQPSK) andpolarization multiplexing. The 5.1 Tbit/s data signal is all-optically demultiplexed and demodulated by direct detection in a delay-interferometer-balanced detector-based receiver, yielding a BER less than 10−9. We also present subsystems making serial opticalTbit/s systems compatible with standard Ethernet data for data centre applications and present Tbit/s results using, for instancesilicon nanowires.
1. Introduction
Historically, quadrupling the serial line rate has resulted inreducing the cost per bit by 40%, mostly due to a reductionof terminal equipment and related power consumption [1].For any given line rate, there will be trade-offs between thecomplexity of the line cards, the modulation format, thetransmission reach, and the available technology at a givenpoint in time. However, considering the historical facts, itis clear that there must be a potential for cost and powerreductions when using higher serial line rates. It is merelya question of uncovering the right technological solutions.Today, electronic signal processing seems limited to about120 Gbit/s [2], as stated by the high-speed electronicscommunity itself, so it becomes relevant to explore opticalsignal processing and in particular in the context of highserial bit rates. Optical signal processing is well suited forserial data signals, since a single ultrafast optical switch canprocess the entire data content in one go. This may lead toa potential reduction in power consumption, as concludedin [3], where they state the following “photonic technologiesmay be well suited for processes such as the all-optical
wavelength conversion and signal regeneration, where thenumber of signal processing devices is small.” This is exactlythe case for high serial line rates where a single devicemay perform the signal processing of the full data signal.Therefore, we believe it is relevant and interesting to conductmore research in the field of ultra-high-speed serial opticalcommunications.
In the year 2000, the first demonstration of reachingTbit/s data rates on a single wavelength channel was achieved[4] using 640 Gbaud polarization-multiplexing (pol-MUX)and simple OOK. Recently, it has become apparent thatTbit/s bit rates for Ethernet applications will be neededvery soon [5] and that the overall necessary capacity perfiber will reach several tens of Tbit/s [6], while the needfor power reductions is getting more and more evident,where the Internet today emits more than 2% of theglobal man-made CO2 emission. This has spurred on aregained focus on increasing the bit rates, both with a single-channel perspective and with a spectral efficiency perspectiveusing advanced modulation formats and latest advances incoherent receiver technology. A high single-channel bit ratehas generally had the effect of cutting the overall systems

2 International Journal of Optics
cost, due to reduced network complexity, fewer components,and hence lower power consumption per bit. A high spectralefficiency may also help in power per bit savings, since thebandwidth is more efficiently used. Using OFDM has a highcomponent count in the terminals but, on the other hand,is very resilient to transmission impairments and henceneeds less inline equipment for, for example, regeneration.So the optimum path to energy-efficient high-bandwidthcommunication systems is still open, and all routes must beexplored to ensure future sustainability.
Recent highlights of the endeavors to boost the bit ratesto the Tbit/s regime include the record breaking 2.56 Tbit/susing DQPSK and pol-MUX on a 640 Gbaud RZ pulserate [7] and a recent upgrade to 8 PSK on 640 Gbaudwith pol-MUX resulted in below FEC-limit 3.56 Tbit/susing coherent reception and 2.38 Tbit/s using 16 QAMon 640 Gbaud without pol-MUX [8]. Including pol-MUXwas also attempted but was not below the FEC limit, butcould have resulted in 4.76 Tbit/s. The combination of timedivision multiplexing and coherent receiver techniques hasalso been successfully studied by the Kikuchi group andrecently led to a 1.28 Tbit/s based on 16 QAM on a 160 Gbaudpol-MUX OTDM pulse train [9]. Using coherent OFDM hasalso recently been demonstrated to reach 1 Tbit/s [10] andeven 1.2 Tbit/s [11]. The simple OOK purely serial formathas the advantage of having a low component count withsimple line cards, as well as being the simplest format withseveral well-established suggestions for all-optical regeneration,which may also aid in driving the power consumption down.Successful demonstrations of regenerating the phase have alsobeen obtained recently [12], and this may also be applied toOTDM phase-modulated data. Drawbacks of binary OTDMare the relatively low spectral efficiency and the severechallenges with respect to long-haul transmission. Until veryrecently, the baud rate had been limited to 640 Gbaud, buta new record of 1.28 Tbit/s was recently demonstrated [13]using only optical time division multiplexing (OTDM) from10 Gbit/s and remaining in one single polarization, that is, apurely serial 1.28 Tbaud symbol rate.
In this paper, we describe recent progress on 1.28 Tbit/sdata generation and demultiplexing and discuss opportu-nities and limitations of this technology. Using 300 fs wide(FWHM) 1.28 Tbaud symbols for more advanced modula-tion formats has also been demonstrated with a world-firsterror-free 5.1 Tbit/s data generation and demodulation [14].DQPSK and polarization multiplexing were used, and thedetails of this will also be presented here.
2. Experimental Demonstrations: Background
A schematic of the experimental setup used for the demon-strations described here is shown in Figure 1. An erbiumglass oscillator pulse generating laser (ERGO) supplies a10 GHz optical pulse train at 1557 nm having a pulse width of1.3 ps. A Mach-Zender modulator (MOD) is used to encodea data sequence (27-1 PRBS) on the pulse train. The 10Gbit/s modulated pulse train is compressed down to 350 fsin a highly nonlinear fiber (HNLF) SPM-based chirp unitfollowed by linear dispersion and subsequently multiplexed
to 160-320-640-1280 Gbit/s in a passive fiber delay PRBSand polarization-maintaining multiplexer (MUX). The mul-tiplexed data is then subjected to various experiments.
Several interesting functionalities have already beendemonstrated at 640 Gbit/s and show promise for higherbit rates. This goes for transmission and clock recovery,wavelength conversion, and add/drop multiplexing, all ofwhich have been demonstrated at 640 Gbit/s in our testbed[15–20]. These functionalities are likely to be possible toperform at 1.28 Tbit/s, as the physical properties involvedin the signal processing are fast enough. For the clockrecovery scheme described in [15, 16], a periodically poledLithium Niobate (PPLN) device was used as an all-opticalmixer, and it was fast enough to resolve the 640 Gbit/s datasignal. In [21] is described how a similar PPLN deviceis used to compress an optical pulse to less than 100 fs,revealing the great speed potential of the χ(2) process,which takes place on an fs timescale. So these devices havegreat potential for Tbit/s applications. The HNLF used forwavelength conversion and add/drop multiplexing in [17–20] are the same types as used for the 1.28 Tbit/s experiment,so they have already proven themselves able to operate atTbit/s speeds. An alternative to HNLF is the very nonlinearchalcogenide waveguides. In [22], we showed that such adevice could be used to demultiplex a 640 Gbit/s data signal,and as with the HNLF and the PPLN, the active effect usedfor the optical signal processing is ultrafast, and the onlyspeed limitation lies in the design of the dispersion (thisgoes for all the devices). Recently, in [23], it was shownthat these waveguides indeed have a THz response witha modulation bandwidth on the order of 2.5 THz. Thismeans that this technology would also lend itself favorablyto Tbit/s serial communication systems. Very recently, it wasthus demonstrated that 1.28 Tbit/s demultiplexing is indeedpossible with such a chalcogenide device [24].
3. 1.28 Tbit/s OOk Serial Data Generation
A detailed set-up drawing of the 1.28 Tbit/s experimentis shown in Figure 2. In this back-to-back set-up, onlya single pulse source is used. This feeds both the datageneration part and the control pulse part in the demul-tiplexer. The pulses are split in two parts after an SPM-based wavelength conversion unit. A supercontinuum isgenerated in 400 m of dispersion-flattened HNLF (DF-HNLF1). DF-HNLF1 has dispersion D = −0.45 ps/nm kmand slope S = 0.006 ps/nm2 km at 1550 nm, nonlinearcoefficient γ = 10.5 W−1 km−1). It is very important that theHNLF is slightly negative in dispersion and has a very flatdispersion profile, as this gives the best supercontinuum—in this case a 70 nm wide spectrum, see Figure 3. The topbranch is filtered through a 9 nm wide filter, which is offsetby 15 nm from the original pulse source wavelength. Thishas two effects: firstly, a Mamyshev regeneration takes placesuppressing the inevitable pulse pedestals from the externalcavity mode-locked laser, and secondly, a linear chirp isobtained across the pulse, and by carefully measuring outthe path to the demultiplexer, the resulting dispersion issuch that a transform-limited short pulse of width 400 fs

International Journal of Optics 3
2 4 6 8 10 12
HNLF(50 m)
...
640–1280 Gbit/s transmitter
ERGO MOD MUX
Compressor FWHM530 fs
640 Gb/s
26 km 24 kmIDF
λ-conv
Add/drop
Sync.
Ch. id.
Various in-linefunctionalities
CR
SMF
(a) 640
HNLF
Demux (NOLM)
SMF
’ed eye
6.25 PS
(b)
Gbit/s
(ps)
Demux1.28 Tbit/s
Figure 1: Schematic of the DTU OTDM test bed for generating 640–1280 Gbit/s data. Insets: (a) 640 Gbit/s eye diagram, (b) 1.28 Tbit/s eyediagram.
14 nm
1535 nm
1561 nm
1561 nm
1561 nm
HNLF (15 m)
(x2)
1.28 Tbit/s, 350 fs
BPF
BPF BPF
BPF
BPFBPF
10 GHz
10 GHz
10 GHz
10 GHz
10 Gbit/s
10 Gbit/s
40 Gbit/s
40 Gbit/s
DF-HNLF1
MUX MUX
Mach-zehnder
OOK (PRBS 27-1)
NOLM
(demux)ERGO
PGL
1550 nm
1561 nm
100 m
9 nm
1.3 PS
DF-HNLF2
1.28 Tbit/s
1.28 Tbit/s
OTDM data
10 Gbit/s demux
λ-conversionΔt
15 nm
5 nm 3 nm
400 m
Compression
5 nm
receiver
10 GHz ctrl, 440 fs
1.28 Tbit/stransmitter
Figure 2: Experimental set-up for a back-to-back demonstration of 1.28 Tbit/s serial data generation and demultiplexing.
FWHM is obtained at the input to the HNLF in the nonlinearoptical loop mirror (NOLM). The lower branch is alsooffset filtered by 11 nm in a 5 nm wide filter to separate iteffectively from the original wavelength. These pulses, nowat 1561 nm, are data modulated at 10 Gbit/s with a 27-1PRBS OOK data signal. The PRBS length is merely chosen forconvenience, as the multiplexer is designed to preserve thisPRBS word. Longer word lengths become impractical for thistype of lab-solution MUX. For all experiments mentionedhere, the PRBS length does not matter, since only trulyultrafast optical switching effects are used, which effectivelyalleviates any potential patterning effects. Changing thePRBS length would thus only serve to characterize the10 Gbit/s photodetector and receiver. This has of coursebeen done, with no difference between a 27-1 and a 231-1 PRBS word. Following the data modulation, the data ismultiplexed to 40 Gbit/s, and then it is further compressedin a second SPM-based compression stage (DF-HNLF2: D =
−1.7 ps/(nm km), S = 0.004 ps/(nm2 km) 1560 nm) with a14 nm bandpass filter. The data pulses are then sent throughthe remainder of the multiplexer, reaching 1.28 Tbit/s andbeing compressed down to about 350 fs.
The 1.28 Tbit/s data is subsequently demultiplexed inthe NOLM, which contains a 15 m short HNLF with a zerodispersion at 1545 nm and a slope of 0.015 ps/nm2 km. Witha short HNLF and a zero dispersion wavelength in betweenthe control and data, walk-off is reduced to a negligiblelevel (less than 50 fs). Furthermore, the short HNLF helpsto enhance overall stability by reducing the amount ofsecond-order PMD. The demultiplexed data channels arecharacterized in terms of bit error rate (BER) performance.
The heart of an ultra-high-speed serial data system is theshort-pulse generation. Figure 3 shows details of the pulsecompression. The optimally compressed pulses are as shortas 196 fs FWHM, which is adequate for 1.28 Tbit/s signals.Please note that there is a small background offset in the

4 International Journal of Optics
1500 1520 1540 1560 1580 1600−80
−70
−60
−50
−40
−30
−20
−10
Pow
er(d
Bm
)
Wavelength (nm)
Ctrl DataGT
(a)
1500 1520 1540 1560 1580 1600−80
−70
−60
−50
−40
−30
−20
−10
Pow
er(d
Bm
)
Wavelength (nm)
40 Gbit/s at 100 m DF-HNLF output
10 GHzafter 5 nm BPF
. . . and after 14 nm BPF
(b)
−3 −2 −1 0 1 2 3 4
0
300
600
900
SFG
pow
er(a
.u.)
Time (ps)
Gaussian pulse FWHM
Input 1.36 ps
Output 196 fs
Autocorr.
(c)
Figure 3: Pulse compression for 1.28 Tbit/s pulses. (a) Spectra at the input and output of DF-HNLF1. The “GT” trace is the input to theDF-HNLF1 creating the 70 nm wide supercontinuum trace. From this supercontinuum, a control and data spectrum is carved out. (b) Thedata spectra at DF-HNLF2 showing the input (data output from DF-HNLF2), the resulting generated supercontinuum in DF-HNLF2 andthe final filtered (14 nm) compressed output. (c) Autocorrelation traces of the input data pulse and the optimally compressed pulse revealinga 196 fs FWHM pulse.
autocorrelation traces, caused partly by ASE noise. In practice,the multiplexer stages and other parts of the full system resultin a small broadening of this, so the data pulses end upbeing around 350 fs wide FWHM. This is still adequate for1.28 Tbit/s, as will be seen below.
The compressed pulses are multiplexed, and the resultanteye diagrams, as measured on an optical sampling oscil-loscope (OSO) with a 1 ps timing resolution, are shownin Figure 4. The resolution of the OSO is obviously notsufficient to resolve the 350 fs pulses, but the OTDM timeslot for a 1.28 Tbit/s data signal is about 750 fs, which canjust be discerned by the OSO. Therefore, the OSO can show
open-eye diagrams at 1.28 Tbit/s. But the real pulse widthsare much shorter than it seems here. Figure 4 also shows a640 Gbit/s eye diagram, and as can be seen on that there isample room between the data pulses for an extra time slot.
The generated 1.28 Tbit/s data signal is subsequently sentto the NOLM demultiplexer. It is very important that thereis as low a spectral overlap as possible between the controland data in the NOLM, which is challenging if the systemis constrained to remain in the C-band and the spectra areabout 15 nm wide each. However, as seen in Figure 5, thereis a small overlap, but the effect of this can be minimizedby keeping the detrimental SPM broadening at a minimum
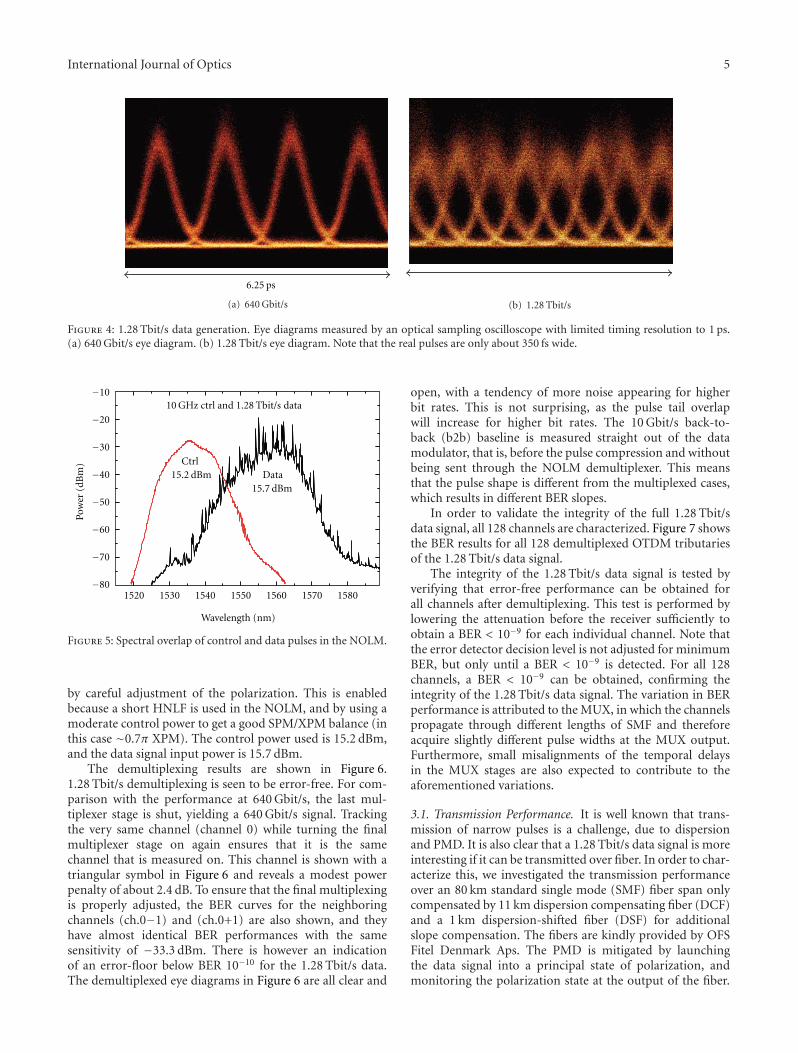
International Journal of Optics 5
6.25 ps
(a) 640 Gbit/s (b) 1.28 Tbit/s
Figure 4: 1.28 Tbit/s data generation. Eye diagrams measured by an optical sampling oscilloscope with limited timing resolution to 1 ps.(a) 640 Gbit/s eye diagram. (b) 1.28 Tbit/s eye diagram. Note that the real pulses are only about 350 fs wide.
1520 1530 1540 1550 1560 1570 1580−80
−70
−60
−50
−40
−30
−20
−10
Pow
er(d
Bm
)
Wavelength (nm)
CtrlData15.2 dBm
15.7 dBm
10 GHz ctrl and 1.28 Tbit/s data
Figure 5: Spectral overlap of control and data pulses in the NOLM.
by careful adjustment of the polarization. This is enabledbecause a short HNLF is used in the NOLM, and by using amoderate control power to get a good SPM/XPM balance (inthis case ∼0.7π XPM). The control power used is 15.2 dBm,and the data signal input power is 15.7 dBm.
The demultiplexing results are shown in Figure 6.1.28 Tbit/s demultiplexing is seen to be error-free. For com-parison with the performance at 640 Gbit/s, the last mul-tiplexer stage is shut, yielding a 640 Gbit/s signal. Trackingthe very same channel (channel 0) while turning the finalmultiplexer stage on again ensures that it is the samechannel that is measured on. This channel is shown with atriangular symbol in Figure 6 and reveals a modest powerpenalty of about 2.4 dB. To ensure that the final multiplexingis properly adjusted, the BER curves for the neighboringchannels (ch.0−1) and (ch.0+1) are also shown, and theyhave almost identical BER performances with the samesensitivity of −33.3 dBm. There is however an indicationof an error-floor below BER 10−10 for the 1.28 Tbit/s data.The demultiplexed eye diagrams in Figure 6 are all clear and
open, with a tendency of more noise appearing for higherbit rates. This is not surprising, as the pulse tail overlapwill increase for higher bit rates. The 10 Gbit/s back-to-back (b2b) baseline is measured straight out of the datamodulator, that is, before the pulse compression and withoutbeing sent through the NOLM demultiplexer. This meansthat the pulse shape is different from the multiplexed cases,which results in different BER slopes.
In order to validate the integrity of the full 1.28 Tbit/sdata signal, all 128 channels are characterized. Figure 7 showsthe BER results for all 128 demultiplexed OTDM tributariesof the 1.28 Tbit/s data signal.
The integrity of the 1.28 Tbit/s data signal is tested byverifying that error-free performance can be obtained forall channels after demultiplexing. This test is performed bylowering the attenuation before the receiver sufficiently toobtain a BER < 10−9 for each individual channel. Note thatthe error detector decision level is not adjusted for minimumBER, but only until a BER < 10−9 is detected. For all 128channels, a BER < 10−9 can be obtained, confirming theintegrity of the 1.28 Tbit/s data signal. The variation in BERperformance is attributed to the MUX, in which the channelspropagate through different lengths of SMF and thereforeacquire slightly different pulse widths at the MUX output.Furthermore, small misalignments of the temporal delaysin the MUX stages are also expected to contribute to theaforementioned variations.
3.1. Transmission Performance. It is well known that trans-mission of narrow pulses is a challenge, due to dispersionand PMD. It is also clear that a 1.28 Tbit/s data signal is moreinteresting if it can be transmitted over fiber. In order to char-acterize this, we investigated the transmission performanceover an 80 km standard single mode (SMF) fiber span onlycompensated by 11 km dispersion compensating fiber (DCF)and a 1 km dispersion-shifted fiber (DSF) for additionalslope compensation. The fibers are kindly provided by OFSFitel Denmark Aps. The PMD is mitigated by launchingthe data signal into a principal state of polarization, andmonitoring the polarization state at the output of the fiber.
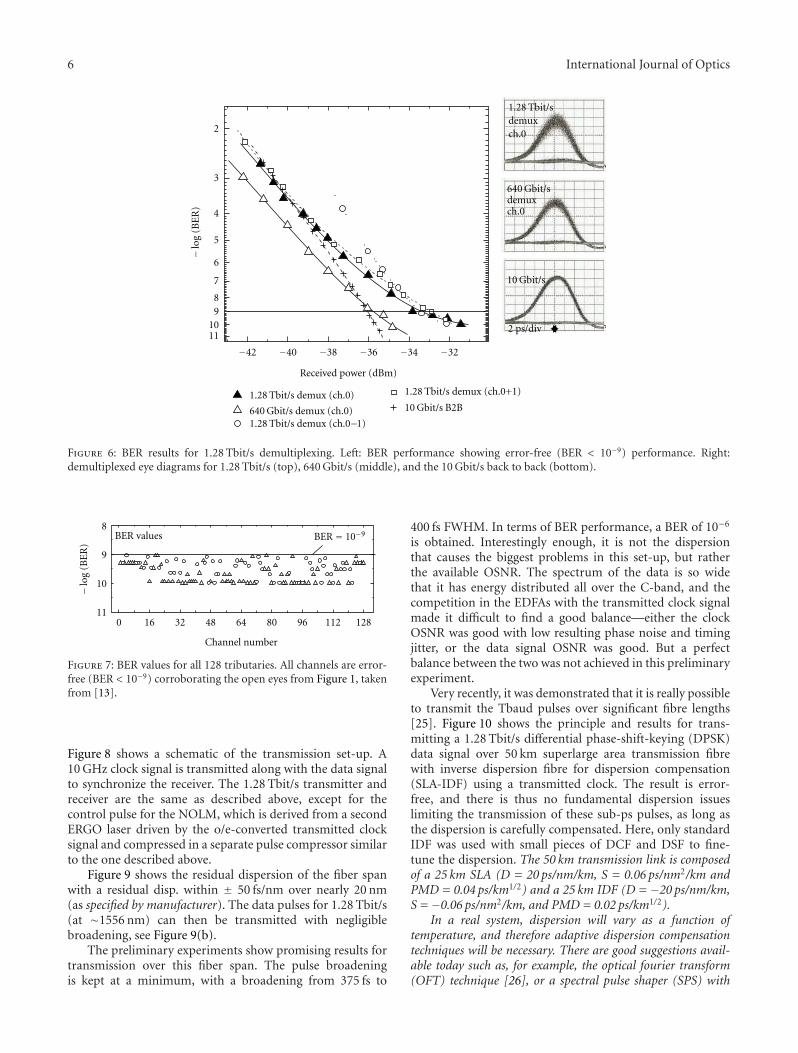
6 International Journal of Optics
1.28 Tbit/sdemuxch.0
10 Gbit/s
640 Gbit/sdemuxch.0
2 ps/div
−42 −40 −38 −36 −34 −32
1110
98
7
6
5
4
3
2
1.28 Tbit/s demux (ch.0)
640 Gbit/s demux (ch.0)1.28 Tbit/s demux (ch.0−1)
1.28 Tbit/s demux (ch.0+1)
10 Gbit/s B2B
Received power (dBm)
−lo
g(B
ER
)
Figure 6: BER results for 1.28 Tbit/s demultiplexing. Left: BER performance showing error-free (BER < 10−9) performance. Right:demultiplexed eye diagrams for 1.28 Tbit/s (top), 640 Gbit/s (middle), and the 10 Gbit/s back to back (bottom).
0 16 32 48 64 80 96 112 12811
10
9
8
Channel number
BER values BER = 10−9
−lo
g(B
ER
)
Figure 7: BER values for all 128 tributaries. All channels are error-free (BER < 10−9) corroborating the open eyes from Figure 1, takenfrom [13].
Figure 8 shows a schematic of the transmission set-up. A10 GHz clock signal is transmitted along with the data signalto synchronize the receiver. The 1.28 Tbit/s transmitter andreceiver are the same as described above, except for thecontrol pulse for the NOLM, which is derived from a secondERGO laser driven by the o/e-converted transmitted clocksignal and compressed in a separate pulse compressor similarto the one described above.
Figure 9 shows the residual dispersion of the fiber spanwith a residual disp. within ± 50 fs/nm over nearly 20 nm(as specified by manufacturer). The data pulses for 1.28 Tbit/s(at ∼1556 nm) can then be transmitted with negligiblebroadening, see Figure 9(b).
The preliminary experiments show promising results fortransmission over this fiber span. The pulse broadeningis kept at a minimum, with a broadening from 375 fs to
400 fs FWHM. In terms of BER performance, a BER of 10−6
is obtained. Interestingly enough, it is not the dispersionthat causes the biggest problems in this set-up, but ratherthe available OSNR. The spectrum of the data is so widethat it has energy distributed all over the C-band, and thecompetition in the EDFAs with the transmitted clock signalmade it difficult to find a good balance—either the clockOSNR was good with low resulting phase noise and timingjitter, or the data signal OSNR was good. But a perfectbalance between the two was not achieved in this preliminaryexperiment.
Very recently, it was demonstrated that it is really possibleto transmit the Tbaud pulses over significant fibre lengths[25]. Figure 10 shows the principle and results for trans-mitting a 1.28 Tbit/s differential phase-shift-keying (DPSK)data signal over 50 km superlarge area transmission fibrewith inverse dispersion fibre for dispersion compensation(SLA-IDF) using a transmitted clock. The result is error-free, and there is thus no fundamental dispersion issueslimiting the transmission of these sub-ps pulses, as long asthe dispersion is carefully compensated. Here, only standardIDF was used with small pieces of DCF and DSF to fine-tune the dispersion. The 50 km transmission link is composedof a 25 km SLA (D = 20 ps/nm/km, S = 0.06 ps/nm2/km andPMD = 0.04 ps/km1/2) and a 25 km IDF (D = −20 ps/nm/km,S = −0.06 ps/nm2/km, and PMD = 0.02 ps/km1/2).
In a real system, dispersion will vary as a function oftemperature, and therefore adaptive dispersion compensationtechniques will be necessary. There are good suggestions avail-able today such as, for example, the optical fourier transform(OFT) technique [26], or a spectral pulse shaper (SPS) with

International Journal of Optics 7
1.28 Tbit/s transmitter
40 km 40 kmSMF SMF
80 km transmission
DCF11 km
10 GHz transmitted
1.28 Tbit/s receiver
Figure 8: Transmission set-up. A transmitted 10 GHz clock signal are used for synchronizing the receiver. 80 km SMF and 11 km DCF isused.
1530 1540 1550 1560 1570−1.5
−1
−0.5
0
0.5
1 km DSF
Dis
pers
ion
(ps/
nm
)
Wavelength (nm)
11 km DCF
Residual dispersion of span
80 km SMF +
80 km SMF +
11 km DCF +
(a)
−1.5 −1 −0.5 0 0.5 1 1.5
0
0.25
0.5
0.75
1
Before span:
Autocorrelations
After span:
fwhm 562 fs
(∼400 fs pulse)
SHG
pow
er(a
.u.)
Time (ps)
fwhm 531 fs
(∼375 fs pulse)
BER ∼10−6
(b)
Figure 9: Preliminary transmission results. The stated “fwhm” pulse widths are autocorrelation measurements. The deconvoluted FWHMpulse widths are in brackets (375/400 fs).
1.28 Tbit/s data10 GHz clock 3
4
5
6789
1011−30 −25 −20 −15 −10 −5 0 5
Received power (dBm)
−1 0 1
6
4
2
0
Am
plit
ude
(a.u
.)
Time (ps)
1520 1540 1560 1580
−20
−40
−60
−80
Wavelength (nm)
Pow
erde
nsi
ty(d
Bm
/0.1
nm
)
640 Gb/s B2B640 Gb/s ch. +1640 Gb/s ch. 0
640 Gb/s ch. −1
1.28 Tb/s B2B1.28 Tb/s ch. +11.28 Tb/s ch. 0
1.28 Tb/s ch. −1
1.28 Tbit/s transmitter 50 km transmission
SLA25 km 25 km
IDF10 GHz transmitted clock
After transmission −lo
g(B
ER
)
1.28 Tbit/s receiver
Figure 10: 1.28 Tbit/s DPSK transmission over 50 km SLA-IDF using an L-band 10 GHz transmitted clock [25].

8 International Journal of Optics
MUX
Mach- Phase-
POL-MUX5.1 Tbit/s:
1.28 Tbaud pol-muxDQPSK
10 Gbaud↓
1.28 Tbaud
1555 nm
1.28 Tbaud
DQPSK
50:50PBS
1550 nm
10 GHzzehnder modulator
DQPSK modulator
Pattern generator
10 Gbit/s PRBS 27-1
(OTDM × 128)
Figure 11: 5.1 Tbit/s data generation set-up.
10 GHz ctrl
1535 nm
Δt
1.28 Tbaud pol-mux 1.28 Tbaud
1.28 Tbaud
DQPSK
1555 nm
DQPSK (pol2)
DQPSK (pol1)
BPF
BPF
20 nm
1557 nm
HNLF
10 Gbaud
DQPSK
1 nm
NOLM demultiplexer
(15 m)
PBS
5.1 Tbit/s:Demux
Figure 12: 5.1 Tbit/s demultiplexer receiver with a pol-DEMUX (PBS) and an NOLM DEMUX, yielding 10 Gbaud symbols.
adjustable phase [27]. For PMD, a liquid crystal modulatorscheme has been demonstrated to compensate for all-orderPMD on subpicosecond pulses in a potentially adaptive setup[28]. To conclude on this section, it is possible to generatean error-free 1.28 Tbit/s purely serial data signal, and eventransmission is demonstrated, when careful compensation ofthe dispersion is applied.
4. 5.1 Tbit/s Dqpsk Pol-MUX Data Generation
In this section, we describe the upgrade from 1.28 Tbit/sto 5.1 Tbit/s. The main idea behind this experiment is touse the generated record high symbol rate of 1.28 Tbaud,as described above. Each pulse is now compressed toabout 400 fs first, and subsequently phase modulatedrather than intensity modulated. A differential quaternaryphase-shift-keying (DQPSK) data signal is encoded ontothe pulses in two steps. First, a push-pull Mach-Zehndermodulator is used to add a 27-1 PRBS DPSK data signal tothe 10 GHz compressed pulses.
The data generation is schematically represented inFigure 11. The second level of data to generate the DQPSKsignal is added by a LiNbO3 phase modulator. This mod-ulator is also adding a decorrelated 27-1 PRBS data signalwith a π/2 offset compared to the DPSK signal, thus assuringan even distribution of the quaternary phase levels. Notethat the aggregated DQPSK data signal is not a preservedPRBS sequence. However, as mentioned above, the specificdata sequence is not important here, as a pattern-dependent-free receiver is used. The 20 Gbit/s (10 Gbaud) DQPSKdata signal is then multiplexed in the same split-and-delay
multiplexer as described above up to 1.28 Tbaud, that is,2.56 Tbit/s. Then an additional polarization multiplexing isimposed on the data signal, by splitting the signal in two ina 3-dB coupler, and then aligning the polarization to matchthe inputs to a polarization beam splitter (PBS). The PBScombines the two orthogonally polarized 1.28 Tbaud datacopies in a 5.1 Tbit/s DQPSK pol-multiplexed data signal.
The 5.1 Tbit/s data signal is then sent to the same NOLMdemultiplexer as described above, see Figure 12.
Before entering the NOLM, the 5.1 Tbit/s data signal issplit in its two polarization states by a second PBS. Eachpolarization state is characterized separately, one after theother. The control pulse for the NOLM is derived the sameway as above.
The demultiplexed 10 Gbaud DQPSK data signal is fur-ther demodulated in a standard 10 Gbaud DQPSK receiver,see Figure 13. A delay interferometer (DLI) with a phasetuner is used to choose the I or the Q component, and theDLI outputs are detected in a balanced photodetector andevaluated in a BER counter.
Figure 14 shows an autocorrelation trace of the1.28 Tbaud data signal together with the 10 GHz controlpulse. The data pulses are about 410 fs wide (FWHM) in thiscase, and the control pulse is around 440 fs wide. The datasignal is well equalized and correctly separated. The BERresults are shown in Figure 15 for a 640 Gbaud 2.56 Tbit/ssignal and a 1.28 Tbaud 5.1 Tbit/s signal. In both cases,error-free performance is achieved.
At 1.28 Tbit/s (640 Gbaud, no pol-MUX), the 10 Gbit/sI/Q components have sensitivities of −35.3 dBm and−34.8 dBm. There is a penalty of less than 3 dB compared

International Journal of Optics 9
5 nm
BPF 10 Gbit/sError-detector
DLI
BPD
(10 GHz)
10 Gbaud preamplified DQPSK RX
10 GbaudDQPSK
1557 nm
Demux
Figure 13: 5.1 Tbit/s demodulator receiver with a preamplifier, a delay interferometer, and a balanced detector.
0
0.2
0.4
0.6
0.8
0 2 4 6 8 10 12
1.28 Tbaud data:410 fs FWHMSF
Gpo
wer
(a.u
.)
Time (ps)
10 GHz ctrl: 440 fs
Figure 14: 1.28 Tbaud data pulses with DQPSK modulation.
to the 10 Gbaud reference I/Q sensitivity of −37.5 dBm(obtained by injecting the DQPSK modulator output directlyinto the DQPSK receiver). When adding pol-MUX to reach2.56 Tbit/s, the penalty is only increased by 0.5 dB. Thesymbol rate is subsequently doubled to 1.28 Tbaud, yieldinga total bit rate of 5.1 Tbit/s. Figure 14 (bottom) shows theBER results for the case, when using pol-MUX, showing theI/Q components of a demultiplexed 10 Gbaud channel, andthe inset (top right) shows the demodulated eye diagram forthis case. The eye is clearly open, and the BER confirms error-free performance of both polarizations and both the I and Qcomponents. BER values < 10−9 are detected for all measuredcurves, hence demonstrating that error-free performance canbe obtained for the 5.1 Tbit/s data signal. There is however anerror floor below 10−9 and a penalty of ∼7–10 dB relative tothe 10 Gbaud DQPSK reference sensitivity. This is primarilyattributed to a slightly too large data pulse FWHM of∼410 fscompared to the 1.28 Tbaud bit slot of ∼785 fs, resultingin some pulse tail overlap. Finally, note that the BPFs inthe receiver differ between the measurements on 640 and1280 Gbaud, causing the difference in reference sensitivity.At 640 Gbaud, narrow 0.3 nm and 0.9 nm BPFs are used toachieve the best reference sensitivity, but at the cost of a limitin the amount of received power. At 1.28 Tbaud, a higherreceived power is required to reach a BER < 10−9, and 1 nmand 5 nm BPFs are therefore selected.
To conclude on this section, we have shown that it isindeed possible to achieve several Tbit/s on a single lasersource and that Tbaud symbol rates are appropriate for thisusage.
5. Network Applications
At 640 Gbit/s, several essential network functionalities havealready been demonstrated. This goes for add/drop multi-plexing [19, 20, 29], wavelength conversion [17, 18, 30, 31],
5.1 Tbit/s
−lo
g(B
ER
)
Received power (dBm)
10
9
8
7
6
5
4
3
1.28 Tbit/s (single pol)
2.56 Tbit/s
10 Gbaud ref.
10 Gbaud ref.
640 Gbaud
/
/
/
/
/
−44
10
9
8
7
6
5
4
3
−42 −40 −38 −36 −34
1.28 Tbaud
−44 −42 −40 −38 −36 −34 −32 −30 −28 −26 −24
Received power (dBm)
−lo
g(B
ER
)
(pol-MUX)
5.1 Tbit/s , pol1)(pol-MUX
5.1 Tbit/s , pol2)(pol-MUX
Figure 15: 5.1 Tbit/s demultiplexing and demodulation.
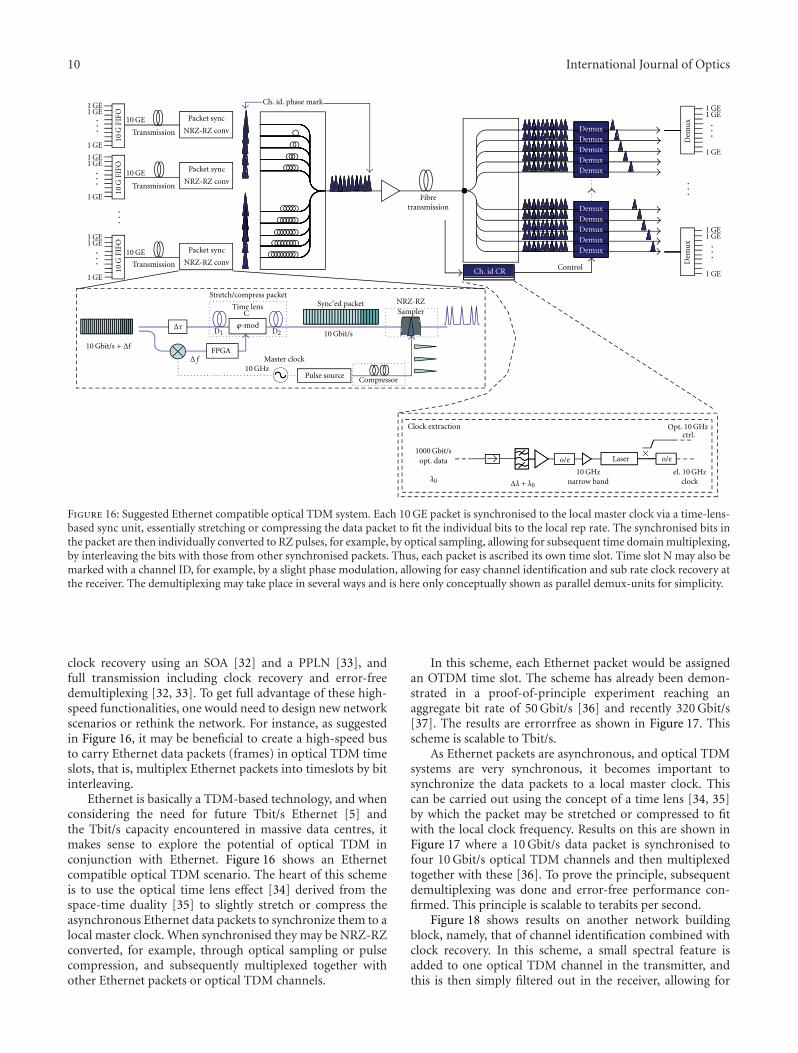
10 International Journal of Optics
ϕ-mod
10 Gbit/s + Δf
1 GE1 GE
1 GE
1 GE1 GE
1 GE
1 GE1 GE
1 GE
1 GE1 GE
1 GE
1 GE1 GE
1 GE
10G
FIFO
10G
FIFO
10G
FIFO
Transmission
Transmission
Transmission
NRZ-RZ conv
Ch. id. phase mark
Ch. id CR
ΔτD1 D2
Time lens
FPGAMaster clock
Pulse sourceCompressor
SamplerNRZ-RZ
C
Clock extraction
1000 Gbit/s
λ0 Δλ + λ0
o/e o/eLaser
10 GE
10 GE
10 GE
narrow band
ctrl.
el. 10 GHzclock
10 GHz
10 GHz
Δ f
Sync’ed packet
opt. data
10 Gbit/s
...
...
...
...
...
...
...
DemuxDemuxDemuxDemuxDemux
Dem
ux
Dem
ux
DemuxDemuxDemuxDemuxDemux
Control
Fibretransmission
Packet sync
NRZ-RZ conv
Packet sync
NRZ-RZ conv
Packet sync
. 10 GHzOpt
Stretch/compress packet
×
Figure 16: Suggested Ethernet compatible optical TDM system. Each 10 GE packet is synchronised to the local master clock via a time-lens-based sync unit, essentially stretching or compressing the data packet to fit the individual bits to the local rep rate. The synchronised bits inthe packet are then individually converted to RZ pulses, for example, by optical sampling, allowing for subsequent time domain multiplexing,by interleaving the bits with those from other synchronised packets. Thus, each packet is ascribed its own time slot. Time slot N may also bemarked with a channel ID, for example, by a slight phase modulation, allowing for easy channel identification and sub rate clock recovery atthe receiver. The demultiplexing may take place in several ways and is here only conceptually shown as parallel demux-units for simplicity.
clock recovery using an SOA [32] and a PPLN [33], andfull transmission including clock recovery and error-freedemultiplexing [32, 33]. To get full advantage of these high-speed functionalities, one would need to design new networkscenarios or rethink the network. For instance, as suggestedin Figure 16, it may be beneficial to create a high-speed busto carry Ethernet data packets (frames) in optical TDM timeslots, that is, multiplex Ethernet packets into timeslots by bitinterleaving.
Ethernet is basically a TDM-based technology, and whenconsidering the need for future Tbit/s Ethernet [5] andthe Tbit/s capacity encountered in massive data centres, itmakes sense to explore the potential of optical TDM inconjunction with Ethernet. Figure 16 shows an Ethernetcompatible optical TDM scenario. The heart of this schemeis to use the optical time lens effect [34] derived from thespace-time duality [35] to slightly stretch or compress theasynchronous Ethernet data packets to synchronize them to alocal master clock. When synchronised they may be NRZ-RZconverted, for example, through optical sampling or pulsecompression, and subsequently multiplexed together withother Ethernet packets or optical TDM channels.
In this scheme, each Ethernet packet would be assignedan OTDM time slot. The scheme has already been demon-strated in a proof-of-principle experiment reaching anaggregate bit rate of 50 Gbit/s [36] and recently 320 Gbit/s[37]. The results are errorrfree as shown in Figure 17. Thisscheme is scalable to Tbit/s.
As Ethernet packets are asynchronous, and optical TDMsystems are very synchronous, it becomes important tosynchronize the data packets to a local master clock. Thiscan be carried out using the concept of a time lens [34, 35]by which the packet may be stretched or compressed to fitwith the local clock frequency. Results on this are shown inFigure 17 where a 10 Gbit/s data packet is synchronised tofour 10 Gbit/s optical TDM channels and then multiplexedtogether with these [36]. To prove the principle, subsequentdemultiplexing was done and error-free performance con-firmed. This principle is scalable to terabits per second.
Figure 18 shows results on another network buildingblock, namely, that of channel identification combined withclock recovery. In this scheme, a small spectral feature isadded to one optical TDM channel in the transmitter, andthis is then simply filtered out in the receiver, allowing for

International Journal of Optics 11
Sync’ed NRZ→RZ packet
Added
Input NRZ packet
Local 40 Gb/s OTDM signal
3
4
5
6
789
1011−40 −36 −32 −28 −24
Original NRZ
Synchronized RZDemultiplexed RZ
Demux
5 ps/div
20 ps/div20 ps/div
Sync’ and mux’
Received power (dBm)
−lo
g(B
ER
)
packet
packet
packetpacket
Figure 17: Time-lens-based data packet synchronisation and RZ conversion. A 12.000 bits long NRZ packet offset with 200 kHz to the localclock is synchronised, RZ-converted, and multiplexed with a 40 Gbit/s OTDM signal. To prove the principle, demultiplexing with error-freeBER performance is performed [19].
BPF
OTDM data signal
(one empty time slot)
ΔtMZ
λ1
λ1
+ Δλ
BER clk
10 GCR
Additional baserate channel
BPF + FBG
-After 80 km transmission and compensation
Demux
Clk. channel
Figure 18: 650 Gbit/s channel identification and simultaneousclock recovery by adding a small spectral feature to one TDMchannel [38].
easy identification of that particular channel. This schemewas demonstrated at 650 Gbit/s, that is, where a markedchannel was added to a 640 Gbit/s optical TDM signal [38].Again, this scheme should be scalable to Tbit/s speeds.The added channel could stem from an Ethernet packet,and several spectral marks could be envisaged to allow forindividual labeling of the TDM data packets.
Ultrafast data signals like Tbaud data require equallyultra-fast switches and are sensitive to temporal issues suchas pulse widths and timing jitter. Therefore, timing jittertolerant switching techniques are interesting. To this end, theOFT/time lens concept has again turned out to be very usefulto create flat-top pulses [40] and compensate for dispersion[26], retiming [34], packet compression [41], and packetsynchronisation [36]. Several pulse shaping schemes havebeen demonstrated for sub-ps flat-top pulse generation, suchas the optical differentiation technique [42], and the Mach-Zehnder delay technique [43], and used for timing-tolerantas well as polarization-independent switching [44].

12 International Journal of Optics
450 nm
300 nm
(a)
20
16
12
8
4
00 3.125
Time (ps)
780 fs
510 fsAm
plit
ude
(a.u
.)
(b)
2
4
6
8
1012
−40 −38 −36 −34 −32 −30 −28 −26
Receiver power
1.28 Tbit/s to 10 Gbit/s demux
10-to-10 Gbit/s demux
7 dB
−lo
g(B
ER
)
(dBm)
(c)
Figure 19: Ultra-fast silicon photonics. Using four-wave mixing in a silicon nanowire (a) is demonstrated to perform Tbit/s optical signalprocessing by sampling a 1.28 Tbit/s serial data signal (b) and error-free demultiplexing [39].
6. Switching Materials
Most Tbaud experiments have been carried out using ahighly non-linear-fibre-(HNLF) based switch, for example,a non-linear optical loop mirror (NOLM). HNLF hassuperior efficiency and is convenient to use but is notcompact and cannot be integrated onto a chip. Veryrecently, it was demonstrated that compact devices can beused for Tbit/s switching, for example, chalcogenide (ChG)waveguides and silicon nanowires [24, 39]. These results,together with 640 Gbit/s semiconductor-optical-amplifier-(SOA-) based demultiplexers [45, 46], show great promisefor making compact multifunctional optical chips with ultra-high-speed potential. Figure 19 shows recent results on theuse of a silicon nanowire for optical signal processing of a1.28 Tbit/s serial data signal. The Si-nanowire is used as anonlinear waveguide for four wave mixing (FWM) betweena control and a data pulse in order to perform all-opticalsampling (Figure 19(b)). These measured eye diagramsconstitute the shortest sampled data pulses reported so far.The sampled data pulse width is 510 fs, and the distancebetween data pulses is 785 fs. The Si-nanowire is also usedfor demultiplexing the 1.28 Tbit/s data signal, and as seenin Figure 19(c), error-free performance is achieved. This isthe highest signal processing speed reported to date usingsilicon—and indeed pure silicon.
7. Conclusion
We have described the generation and use of 1.28 Tbaudserial symbol rates for a 1.28 Tbit/s OOK data experimentaldemonstration and a 5.1 Tbit/s DQPSK pol-MUX dataexperimental demonstration. We have also described thatthere are several technology platforms that can potentiallydeal with such high symbol rates, with a number of these,including compact alternatives, already demonstrated at640 Gbit/s (640 Gbaud). We have shown that Tbit/s opticalTDM is feasible even for transmission. We have describedefforts to embrace network scenarios and demonstrated datapacket synchronisation for future Tbit/s Ethernet systems,
for example, in Data Centres. Finally we have touched uponsome emerging techniques which could enable more resilientand efficient switching, such as the time lens concept andsilicon nanowires. This means that Tbit/s serial optical datamay be a feasible path to accommodate for the future needfor high-capacity communication systems.
Acknowledgments
This work is partly funded by the European-Research-Council-(ERC-) independent researcher starter grant projectSOCRATES and the Danish Research Council projectsNANO-COM and NOSFERATU, and the European Networkof Excellence, Euro-Fos. OFS Fitel Denmark Aps is acknowl-edged for providing HNLF.
References
[1] B. Mikkelsen, C. Rasmussen, F. Liu, P. Mamyshev, and S. Dey,“40 Gbit/s based ULH transmission,” in Proceedings of the 9thOptoElectronics and Communications Conference (OECC ’04),July 2004, Paper 14C3-1.
[2] R. Driad, R. E. Makon, V. Hurm et al., “INP DHBT-basedICs for 100 Gbit/s data transmission,” in the InternationalConference on Indium Phosphide and Related Materials (IPRM’08), May 2008.
[3] K. Hinton, G. Raskutti, P. M. Farrell, and R. S. Tucker,“Switching energy and device size limits on digital photonicsignal processing technologies,” IEEE Journal on Selected Topicsin Quantum Electronics, vol. 14, no. 3, pp. 938–945, 2008.
[4] M. Nakazawa, T. Yamamoto, and K. R. Tamura, “1.28Tbit/s-70km OTDM transmission using third- and fourth-ordersimultaneous dispersion compensation with a phase modula-tor,” Electronics Letters, vol. 36, no. 24, pp. 2027–2029, 2000.
[5] B. Metcalfe, http://www.ofcnfoec.org/Home/Program/ Plena-ry-Session.aspx.
[6] E. B. Desurvire, “Capacity demand and technology challengesfor lightwave systems in the next two decades,” Journal ofLightwave Technology, vol. 24, no. 12, pp. 4697–4710, 2006.
[7] H. G. Weber, S. Ferber, M. Kroh et al., “Single channel1.28 Tbit/s and 2.56 Tbit/s DQPSK transmission,” ElectronicsLetters, vol. 42, no. 3, pp. 67–68, 2006.
International Journal of Optics 13
[8] C. Schmidt-Langhorst et al., “Generation and coherent time-division demultiplexing of up to 5.1 Tb/s single-channel 8-PSK and 16-QAM signals,” in Proceedings of the Conference onOptical Fiber Communication (OFC ’09), 2009, paper PDPC6.
[9] C. Zhang et al., “Demodulation of 1.28 Tbit/s polarization-multiplexed 16-QAM signals on a single carrier with digitalcoherent receiver,” in Proceedings of the Conference on OpticalFiber Communication (OFC ’09), 2009, paper OTuG3.
[10] Y. Ma et al., “1 Tb/s per channel coherent optical OFDM trans-mission with subwavelength bandwidth access,” in Proceedingsof the Conference on Optical Fiber Communication (OFC ’09),2009, PD paper PDPC1.
[11] R. Dischler et al., “Transmission of 1.2 Tbit/s continuouswaveband PDM-OFDM-FDM signal with spectral efficiencyof 3.3 bit/s/Hz over 400 km of SSMF,” in Proceedings of theConference on Optical Fiber Communication (OFC ’09), 2009,paper PDPC2.
[12] R. Slavık, F. Parmigiani, J. Kakande et al., “All-optical phaseand amplitude regenerator for next-generation telecommuni-cations systems,” Nature Photonics, vol. 4, no. 10, pp. 690–695,2010.
[13] H. C. Hansen Mulvad, L. K. Oxenløwe, M. Galili, A. T.Clausen, L. Gruner-Nielsen, and P. Jeppesen, “1.28Tbit/ssingle-polarisation serial OOK optical data generation anddemultiplexing,” Electronics Letters, vol. 45, no. 5, pp. 280–281,2009.
[14] H. C. Hansen Mulvad, M. Galili, L. K. Oxenløwe et al.,“Error-free 5.1 Tbit/s data on a single-wavelength channelusing a 1.28 Tbaud symbol rate,” in Proceedings of the 22ndAnnual Meeting of the IEEE Photonics Society, Belek-Antalya,Turkey, October 2009.
[15] L. K. Oxenløwe, F. Gomez-Agis, C. Ware et al., “640-Gbit/sdata transmission and clock recovery using an ultrafastperiodically poled lithium niobate device,” Journal ofLightwave Technology, vol. 27, no. 3, pp. 205–213, 2009.
[16] L. K. Oxenløwe, F. Gomez Agis, C. Ware et al., “640Gbit/sclock recovery using periodically poled lithium niobate,”Electronics Letters, vol. 44, no. 5, pp. 370–372, 2008.
[17] M. Galili, L. K. Oxenløwe, H. C. H. Mulvad, A. T. Clausen, andP. Jeppesen, “Optical wavelength conversion by cross-phasemodulation of data signals up to 640 Gb/s,” IEEE Journalon Selected Topics in Quantum Electronics, vol. 14, no. 3, pp.573–579, 2008.
[18] M. Galili, H. C. H. Mulvad, L. Gruner-Nielsen et al.,“640 Gbit/s optical wavelength conversion using FWM in apolarisation maintaining HNLF,” in the 34th European Confer-ence on Optical Communication (ECOC ’08), September 2008.
[19] H. C. Hansen Mulvad et al., “640 Gbit/s optical time-divisionadd-drop multiplexing in a non-linear optical loop mirror,” inIEEE Lasers and Electro-Optics Society Winter Topical Meeting,Innsbruck, Austria, January 2009, Paper MC4.4.
[20] H. C. H. Mulvad, M. Galili, L. Gruner-Nielsen, L. K. Ox-enløwe, A. T. Clausen, and P. Jeppesen, “640 Gbit/s time-di-vision add-drop multiplexing using a non-linear polarisation-rotating fibre loop,” in the 34th European Conference on Opti-cal Communication (ECOC ’08), September 2008.
[21] S. Ashihara, T. Shimura, K. Kuroda et al., “Optical pulsecompression using cascaded quadratic nonlinearities inperiodically poled lithium niobate,” Applied Physics Letters,vol. 84, no. 7, pp. 1055–1057, 2004.
[22] M. Galili, J. Xu, H. C. H. Mulvad et al., “Breakthroughswitching speed with an all-optical chalcogenide glass chip:640 Gbit/s demultiplexing,” Optics Express, vol. 17, no. 4, pp.2182–2187, 2009.
[23] M. Pelusi, F. Luan, T. D. Vo et al., “Photonic-chip-based radio-frequency spectrum analyser with terahertz bandwidth,”Nature Photonics, vol. 3, no. 3, pp. 139–143, 2009.
[24] T. D. Vo, H. Hu, M. Galili et al., “Photonic chip based1.28 Tbaud transmitter optimization and receiver OTDMdemultiplexing,” in Proceedings of the Conference on OpticalFiber Communication (OFC ’10), 2010, paper PDPC5.
[25] H. Hu, M. Galili, L. K. Oxenløwe et al., “Error-freetransmission of serial 1.28 Tbaud RZ-DPSK signal,” inthe European Conference on Optical Communication (ECOC’10), Turin, Italy, September 2010, Paper P4.18.
[26] M. Nakazawa, T. Hirooka, F. Futami, and S. Watanabe, “Idealdistortion-free transmission using optical Fourier transforma-tion and Fourier transform-limited optical pulses,” IEEE Pho-tonics Technology Letters, vol. 16, no. 4, pp. 1059–1061, 2004.
[27] Y. Paquot et al., “Automatic higher-order dispersionmeasurement and compensation of a 1.28 Tbaud signal,”in Proceedings of the Conference on Lasers and Electro-Optics(CLEO ’11), 2011, paper CFP3.
[28] M. Akbulut, A. M. Weiner, and P. J. Miller, “Wideband all-order polarization mode dispersion compensation via pulseshaping,” Optics Letters, vol. 30, no. 20, pp. 2691–2693, 2005.
[29] H. C. Hansen Mulvad, L. K. Oxenløwe, A. T. Clausen, M.Galili, L. Gruner-Nielsen, and P. Jeppesen, “Error-free 320Gb/s simultaneous add-drop multiplexing,” in Proceedings ofthe Conference on Optical Fiber Communication (OFC ’07),Anaheim, Calif, USA, March 2007, Paper OTuI.
[30] H. Sotobayashi, W. Chujo, and T. Ozeki, “Inter-wavelength-band conversions and demultiplexings of 640 Gbit/s OTDMsignals,” in Proceedings of the Conference on Optical FiberCommunication (OFC ’02), pp. 261–262, 2002.
[31] H. Hu, E. Palushani, M. Galili et al., “1.28 Tb/s wavelengthconversion for polarisation multiplexed RZ-DPSK signals,” inProceedings of the Conference on Optical Fiber Communication(OFC ’10), San Diego, Calif, USA, March 2010, Paper OWP1.
[32] E. Tangdiongga et al., “SOA-based clock recovery and demul-tiplexing in a lab trial of 640- Gb/s OTDM transmission over50-km Fibre Link,” in the 33rd European Conference and Exhi-bition of Optical Communication (ECOC ’07), 2007, PD 1.2.
[33] L. K. Oxenløwe, F. Gomez Agis, C. Ware et al., “640 Gbit/sdata transmission and clock recovery using an ultra-fastperiodically poled lithium niobate device,” in Proceedings ofthe Conference on Optical Fiber Communication (OFC ’08),San Diego, Calif, USA, February 2008, PDP22.
[34] L. F. Mollenauer and C. Xu, “Time-lens timing-jittercompensator in ultra-long haul DWDM dispersion managedsoliton transmissions,” in the Conference on Lasers andElectro-Optics (CLEO ’02), pp. CPDB11–CPDB13, May 2002.
[35] Brian H. Kolner, “Space-time duality and the theory oftemporal imaging,” IEEE Journal of Quantum Electronics, vol.30, no. 8, pp. 1951–1963, 1994.
[36] H. Hu, E. Palushani, J. L. Areal et al., “Optical framesynchronizer for 10 G Ethernet packets aiming at 1 Tb/sOTDM Ethernet,” in Proceedings of the Conference on OpticalFiber Communication, Collocated National Fiber OpticEngineers Conference (OFC/NFOEC ’10), 2010.
[37] J. L. Areal, H. Hu, and E. Palushani, “Synchronization andNRZ-to-RZ conversion of 10 Gbit/s Ethernet-like data packetsand subsequent optical TDM multiplexing to 330 Gbit/s,” inProceedings of the Conference on Optical Fiber Communication(OFC ’11), 2011.
[38] M. Galili, H. C. Hansen Mulvad, H. Hu et al., “650 Gbit/sOTDM transmission over 80 km SSMF incorporating clock

14 International Journal of Optics
recovery, channel identification and demultiplexing in a Polar-isation insensitive receiver,” in Proceedings of the Conference onOptical Fiber Communication, Collocated National Fiber OpticEngineers Conference (OFC/NFOEC ’10), 2010, OWO3.
[39] H. Ji, H. Hu, M. Galili et al., “Optical waveform samplingand error-free demultiplexing of 1.28 Tbit/s serial datain a silicon nanowire,” in the Conference on Optical FiberCommunication, Collocated National Fiber Optic EngineersConference (OFC/NFOEC ’10), 2010, PDPC7.
[40] E. Palushani, L. K. Oxenløwe, M. Galili, H. C. H. Mulvad, A.T. Clausen, and P. Jeppesen, “Flat-top pulse generation by theoptical fourier transform technique for ultrahigh speed signalprocessing,” IEEE Journal of Quantum Electronics, vol. 45, no.11, pp. 1317–1324, 2009.
[41] M. A. Foster et al., “Generation of 270 Gb/s NRZ data packetsfrom a 10-Gb/s signal using a temporal telescopic system,” inProceedings of the Conference on Optical Fiber Communication(OFC ’09), 2009, OWS4.
[42] L. K. Oxenløwe, R. Slavık, M. Galili et al., “640 Gb/s timingjitter-tolerant data processing using a long-period fiber-grating-based flat-top pulse shaper,” IEEE Journal on SelectedTopics in Quantum Electronics, vol. 14, no. 3, pp. 566–572,2008.
[43] E. Palushani, H. Hu, L. K. Oxenløwe et al., “640 Gb/s timingtolerant demultiplexing using a cascaded long-period fibergrating pulse shaper,” in the 35th European Conference onOptical Communication (ECOC ’09), 2009.
[44] H. C. H. Mulvad, M. Galili, L. K. Oxenløwe, A. T. Clausen, L.Gruner-Nielsen, and P. Jeppesen, “Polarization-independenthigh-speed switching in a standard non-linear optical loopmirror,” in Proceedings of the Conference on Optical FiberCommunication/National Fiber Optic Engineers Conference(OFC/NFOEC ’08), 2008.
[45] E. Tangdiongga et al., “SOA-based clock recovery and demulti-plexing in a lab trial of 640- Gb/s OTDM transmission over 50-km fibre link,” in the 33rd European Conference and Exhibitionof Optical Communication (ECOC ’07), 2007, PD 1.2.
[46] T. Hirooka, M. Okazaki, T. Hirano, P. Guan, M. Nakazawa,and S. Nakamura, “All-optical demultiplexing of 640 Gbit/sOTDM-DPSK signal using a semiconductor SMZ switch,”in the 35th European Conference on Optical Communication(ECOC 09), 2009, paper 4.3.2.

Hindawi Publishing CorporationInternational Journal of OpticsVolume 2012, Article ID 979632, 6 pagesdoi:10.1155/2012/979632
Research Article
Amplification of Frequency-Modulated Similariton Pulses inLength-Inhomogeneous Active Fibers
I. O. Zolotovskii,1 D. I. Sementsov,1 A. A. Sysolyatin,2 A. S. Belanov,3 and M. S. Yavtushenko1
1 Ul’yanovsk State University, 42 L.Tolstogo Street, Ul’anovsk 432700, Russia2 Fiber Optics Research Center, 38 Vavilov Street, Moscow 119333, Russia3 Moscow State University of Instrument Engineering and Computer Sciences, 20 Stromynka Street, Moscow 107996, Russia
Correspondence should be addressed to D. I. Sementsov, [email protected]
Received 4 May 2011; Accepted 21 June 2011
Academic Editor: Christophe Finot
Copyright © 2012 I. O. Zolotovskii et al. This is an open access article distributed under the Creative Commons AttributionLicense, which permits unrestricted use, distribution, and reproduction in any medium, provided the original work is properlycited.
The possibility of an effective gain of the self-similar frequency-modulated (FM) wave packets is studied in the length-inhomogeneous active fibers. The dynamics of parabolic pulses with the constant chirp has been considered. The optimal profilefor the change of the group-velocity dispersion corresponding to the optimal similariton pulse amplification has been obtained. Itis shown that the use of FM pulses in the active (gain) and length-inhomogeneous optical fibers with the normal group-velocitydispersion can provide subpicosecond optical pulse amplification up to the energies higher than 1 nJ.
1. Intoduction
Generation of stable self-similar FM optical pulses, referredto as similaritons, in an active (gain) medium with thenormal group-velocity dispersion (GVD) opens up extensiveadvantages over the classical ways of an optical pulseamplification [1–16]. In the case of the optical pulseamplification in an anomalously dispersive medium, it isdifficult to avoid various instabilities as well as Raman lasereffect that could considerably distort the wave packet profile.However, in the normal GVD medium, there also arisesome definite problems. Some known methods of the pulseamplification in homogeneous optical fibers are sensitive tothe stochastic diameter variation of the mentioned fibers[17–19]. Therefore, the use of “long” amplifiers (the length>100 m) with a low gain increment γ > 1 M−1 provesinefficient.
To overcome this problem, it is reasonable to use thecompact inhomogeneous amplifiers with the normal GVDincreasing over the length and gain increment of the fibermaterial γ � 1 M−1. In this case, the following parameterscan be efficiently controlled over the optical fiber length(due to a relatively short amplifier length): the fiber corediameter, dispersion, and nonlinearity. The present work
analyses the dynamics of the parabolic FM wave packetin the length-inhomogeneous amplifier and describes theconditions for their stable (self-similar) propagation in aform of the similariton wave packet.
2. Basic Equations
We will consider the optical pulse dynamics in the inhomo-geneous amplifying medium. In this case, the field of thewave packet which evolves in an optical fiber can be expressedas
�E(t, r, z) = 12�eU(r, z)
×{A(t, z) exp
[i
(ω0t −
∫ z
0β′(ξ)dξ
)]+ C.C.
},
(1)
where �e is the unit vector of the light field polarization;U(r, z) function describes the radial field propagation in anoptical fiber; ω0 represents the carrier frequency of a wavepacket; β′(z) is the real component of the propagation con-stant. The nonlinear Schrodinger equation with coefficients

2 International Journal of Optics
inhomogeneous over the optical fiber length is valid for thetime pulse envelope A(t, z)
∂A
∂z− iD(z)
2∂2A
∂τ2+ iR(z)|A|2A = g(z)A, (2)
where the following parameters are introduced: τ = t −∫ z0 dξ/u(ξ) is the time of the traveling coordinate system;u(z) = (∂β(z)/∂ω)−1
0 and D(z) = (∂2β(z)/∂ω2)0 are thegroup velocity and the fiber GVD; R(z) is Kerr nonlinearitycoefficient. The dependence of the fiber parameters on thelongitudinal coordinate z is associated, first of all, with theirdependence on the effective mode area Sm(z). Thus, theparameter of the mode amplification is related not only tothe material gain γ(z) but also to the mode area as well in thefollowing correlation:
g(z) = γ(z)− 12Sm(z)
dSm(z)dz
, (3)
where,
Sm(z) = 2π∫∞
0|Um(r, z)|2r dr (4)
is the mode area. Let us assume the dispersion and nonlin-earity parameters to be the functions of z coordinate whichare defined as D(z) = D0d(z) and R(z) = R0r(z), whereD0,R0 are the values of these parameters at the fiber input.Introduction of a new variable ξ(z) = ∫ z
0 d(z′)dz′ and thepulse envelope C(τ, z) = √
r(z)/d(z)A(τ, z) to (2) yields theequation with the constant dispersion and nonlinearity butlength-inhomogeneous gain
∂C
∂ξ− iD0
2∂2C
∂τ2+ iR0|C|2C = gef(ξ)C. (5)
The effective and inhomogeneous (with the respect to a newcoordinate ξ) gain increment is defined as
gef(ξ) = γ(ξ)d(ξ)
− 12∂
∂ξlnSm(ξ)Sm(0)
d(ξ)r(ξ)
. (6)
Having performed all substitutions, the problem to de-scribe the nonlinear pulse propagation in the optical fiberwith such parameters inhomogeneous over the length asGVD, nonlinearity, gain and effective mode area is reducedto the description of the optical pulse propagation in thefiber with the homogeneous dispersion D0 and nonlinearityR0 and inhomogeneous effective gain gef, which stronglydepends on the mode profile Sm(z).
3. Conditions of Similariton Existence inthe Amplifying Fiber
As known, the singularity of a similariton pulse propagationconsists of the fact that the pulse envelope, irrespective ofits original profile, asymptotically approaches to a parabolicshape scaled along the pulse coordinate [4–9]. In this case,the pulse can be expressed as:
A(τ, z) = A(z)Gpar(z, τ) exp[i(ϕ(z) + α(z)τ2)], (7)
where φ(z) is the pulse phase; α(z) is the FM rate (chirp)which is constant for a similariton. Here, function Gpar(τ, z)assigns the profile of the parabolic pulse envelope and isdetermined by
Gpar =
⎧⎪⎪⎨⎪⎪⎩√
1− τ2
τ2s (z)
, τ ≤ τs(z),
0, τ > τs(z),(8)
where τs(z) is the pulse duration.It is known that the condition under which (5) has
an exact solution in a form of FM parabolic pulse can beexpressed as [6–9]
gef − 3α0D0 = 0. (9)
In the case of an active optical fiber, the condition for pro-ducing a stable similariton, that is, condition (7), can be giv-en as
γ0 − 3α0D0 = 0. (10)
It is noteworthy that the available sources of picosecondpulses used to generate similariton FM pulses, as a rule, canproduce (after passing through the complementary disper-sive components) chirp of some 1023-1024 c−2. Moreover, theGVD values of the amplifying fibers being used do not exceed3·10−26 c2/M (in practice, for instance, the GVD of Er3+-doped fibers, in rare cases, exceed this value [6–8, 19, 20]).As a consequence, the gain increment of the homogeneousfiber which is responsible for the FM similariton productionmust be appreciably lower than 0.1 m−1 (a more preciseanalyses yields γ value not more than 0.01 m−1). In thiscase, to increase the pulse energy more than by an order ofmagnitude is required that the fiber length exceed 10 meters(and even 100 meters). As it follows from the experimentson Er-, Yb-, and Bi-doped fibers [7, 8], as well as fromthe numerical simulation [18, 19], self-similar FM pulsesare very sensitive to the fluctuation of the gain incrementand variation of the fiber amplifier diameter. By virtue ofthis fact, it proves difficult to use long (longer than 100meters) active fibers to reach considerable (more than byan order of magnitude) pulse energy increase. The way outcould be a short fiber (<10 meters) with a high gain (γ >1 M−1) and GVD sharply increasing over its length. Further,the possibility of an efficient “rapid” parabolic FM pulseamplification will be studied in the length-inhomogeneousfiber with W-profile of the refractive index distribution overthe fiber cross-section. Taking into account expression (6),condition (9) acquires the following form for the effectivegain increment:
6α0D(z) = 2γ(z)− 1Sm
∂Sm∂z
+1R
∂R
∂z− 1D
∂D
∂z. (11)
Here, the nonlinearity-dependent term can be rewritten as
1R
∂R
∂z= 1n2
∂n2
∂z− 1Sef
∂Sef
∂z, (12)

International Journal of Optics 3
where n2 is the cubic nonlinearity parameter, and effectivemode area is introduced as
Sef(z) =2π
(∫∞0 |Um(r, z)|2r dr
)2
∫∞0 |Um(r, z)|4r dr . (13)
Using the derived relations, we will arrive to the followingequation describing the GVD profile over the fiber length:
∂D
∂z− f (z)D(z) + 6α0D
2(z) = 0, (14)
where the function f (z) = 2γ(z) − (1/Sm)(∂Sm/∂z) +(1/R)(∂R/∂z) is introduced.
Solution of (14) allows to obtain a required profile ofthe GVD variation which provides a self-similar propagatingregime of the parabolic FM pulses. This equation representsa well-known Bernoulli equation, and its solution can bewritten in the following way:
D(z) = D0F(z)
×exp
[2∫ z
0 γ(z′)dz′]
1 + 6α0D0∫ z
0 F(z′) exp[
2∫ z′
0 γ(z′′)dz′′]dz′
,(15)
where D0 is the input GVD, and the following notion isintroduced:
F(z) = Sef(0)Sef(z)
Sm0
Sm(z)n2(z)n20
. (16)
If the material gain is kept constant over the whole fiberlength and relation F(z) ≈ 1 is fulfilled (that is, valid, witha high precision, for most practically important cases, and,first of all, for W-profile fibers [18–20]), the required GVDprofile will have the following view:
D(z) = γD0e2γz
γ + 3α0D0(e2γz − 1). (17)
Taking into account (17), the efficient amplificationof frequency-modulated pulses could be carried out whenγ/3α0 > D(0) and the normal dispersion is increasing alongthe active fiber length. If γ/3α0 < D(0), then the dispersionshould decrease along the length, and if γ/3α0 ≈ D(0), thedispersion should be constant along amplifier length. It couldbe noted that the first case is fast scenario (the amplifierlength is less than 10 m) and the second is slow.
Figures 1(a) and 1(b) show the relative dispersion func-tion along the amplifier length to reach optimal similaritonamplification. The grow of similariton pulse energy ispossible if the GVD is increasing essentially. The relationbetween the final and initial similariton energy is close to theD(z)/D(0).
For a passive fiber with the negligibly low optical loss (i.e.,fiber with γ → 0), the GVD satisfying the condition for thesimilariton existence in W-profile fiber will have a hyperbolicshape (qto polnost�� sootvetstvyet rezyl�tatampolyqennym v rabotah [11, 13])
D(z) = D0
1 + 6α0D0z. (18)
1 2
3150
100
50
0
1
2
D(z
)/D
0
z (m)
(a)
1
2
3
0 1 2
20
40
D(z
)/D
0z (m)
(b)
Figure 1: The GVD profiles providing self-similar propagation ofFM parabolic pulses in the optical fiber with the following fixedparameters: τ0 = 10−12 s,D0 = 2·10−27 s2/m and fitting parameters:α0 = 1024 s−2, γ = (0.5; 1.0; 1.5) m−1 (a) and γ = 1 m−1, α0 =(1023, 1024, 1025) s−2 (b). One can see that exponential character ofGVD at γ ≈ 1 m−1 is kept for the fibers shorter than 2 m.
Besides, in the general case, the following relation can bewritten for the similariton pulse duration [9]:
τs(z) = τ0 exp(
2α0
∫ z
0D(z′)dz′
), (19)
taking into account relation (15), we can express it as
τs(z)= τ0
[1 + 6α0D0
∫ z
0F(z′) exp
(2∫ z′
0γ(z′′)dz′′
)dz′
]1/3
.
(20)
If F(z) = 1 and γ = 0, we obtain the following known rela-tion for the pulse duration [3, 4]:
τs(z) = τ0[1 + 6α0D0z]1/3. (21)
In the general case, the formation energy for the parabolicsimilariton can be defined as follows [9]:
Ws = 8cD(0)α20τ
30
3ω0n2(0)Sef(0). (22)
Equations (22) and (11) describe the condition underwhich the stable self-similar pulses similaritons are gen-erated. The energy change of the wave packet during itspropagation through the fiber is defined
Ws(z) =W(0) exp(
2∫ z
0γ(z′)dz′
). (23)

4 International Journal of Optics
1.3
1.2
1.1
1
1
10 2
2
τ s/τ
0
3
z (m)
(a)
1.6
1.4
1.2
1
0 1
1
2
2
3
τ s/τ
0
z (m)
(b)
Figure 2: The normalized duration of similariton pulse versusoutput gain with the following fixed parameters: τ0 = 10−12 s,D0 = 2 · 10−27 s2/m and fitting parameters: α0 = 1024 s−2, γ =(0.5; 1.0; 1.5) m−1 (a) and γ = 1 m−1, α0 = (1023, 1024, 1025) s−2 (b).One can see the pulse duration increase with the increasing outputgain and fiber length.
The similariton pulse width as a function of active fiberlength is shown on Figures 2(a) and 2(b) for differentvalues of γ and frequency modulation. For indicated fiberlengths and essential similariton energy increase, there isonly a weak width change. As a result, there is a tinyspectrum modification if the chirp parameter is constant.Definitely, this condition is important for stable similaritonamplification.
The stability of gef(ξ) should be taken into accountin relation to external perturbations. It has been shownearlier [15] that the frequency-modulated parabolic pulsesare stable to gef(ξ) variations. One could believe that thedispersion parameter would be stable too (in accordancewith (6)). It is essential for efficient amplification. Inaddition, the influence of high-order dispersion effects issmall for proposed technique of frequency-modulated pulsesamplification. Indeed, if the fiber amplifier does not exceed10 m, the significance of the 3 rd order dispersion would benot essential. For instance, in the case of picosecond pulsewith initial chirp of α0 < 1024 c−2 the characteristic lengthL(3) � 103 M.
4. Compression of FM Pulses
As follows from the performed analysis, the regime of theparabolic pulse amplification in a medium with normaldispersion is accompanied by the increase of its duration
while preserving the chirp. A further increase in the peakpower of the pulse due to its temporal compression shouldbe performed in a passive dispersive medium providing aminimal nonlinear effects (it is required to avoid, as far aspossible, the corresponding noises and aberration as wellas the development of different kinds of instabilities [9,10]). This procedure can be performed already outside theamplifying fiber: either in a passive anomalous dispersionfiber with a low nonlinearity (hollow fibers can be used forthis purpose), or on a couple of diffraction gratings acting asan effective dispersion element. At present, this technologyfor producing high-energy laser pulses is the most developed[21–23]. The technology providing compression in an all-fiber regime is supposed to be the method of using hollowcrystal fibers with a low cubic nonlinearity [24, 25].
The duration of a bandwidth-limited pulse with the pa-rameters τs(L) and α0 at the compressor input (afterpropagating through the fiber amplifier of the length L) afterpassing through the compressor is as follows [9, 23]:
τcom = τs(L)√1 +
(α0τ2
s (L))2. (24)
When the inequality α0τ2s (L) � 1 is fulfilled, we have τcom ∼
1/α0τs(L). The peak power of the compressed bandwidth-limited pulse can be determined by
Pmax∼= P0α0τ0τs(L) exp
(2∫ L
0γ(z)dz
). (25)
It follows from the obtained relations that the more we“stretch” the pulse with a constant nonzero chirp in time,the more compressed the pulse will be and the higher thepeak power can be obtained after pulse propagation throughthe compressor. Thus, if the input chirp is α0 = 1024 s−2,the original pulse duration is τ0 = 10−12 s, the amplifierlength is L = 1 M, and the gain increment is γ = 2 M−1, thepeak power can be increased in 100 times after chirp vanish(here, according to (20), we accept that after propagatingthrough the amplifying fiber the pulse duration becomestwice as high). The offered scheme of pulse amplification andsubsequent FM pulse compression is actively used nowadaysin solid-state laser systems for generating high-power pulses.
The offered scheme of pulse amplification and subse-quent FM pulse compression is actively used nowadays insolid-state laser systems for generating high-power pulses.
It seems that this technique based on similariton amplifi-cation and grating compressor would allow to move forwardto generation of a few cycles pulses. Taking into considerationthat the similariton energy may be at the level of 10 nJand above, the output peak power could be at megawattlevel. Definitely, this technique may be especially fruitfulin 1550 nm spectral region (Er-doped fiber as amplifier)[24, 25]. Provided that increment gain γ > 0.5 m, theamplifier length should be enough small (e.g., 5 m) toamplify the input ps similariton more than in order. Itseems the novel waveguide structure like a Bragg fiber wouldbe useful to improve the parameters of such a all-fibersimilariton amplifier. For instance, if the waveguide structure

International Journal of Optics 5
allows to control the GVD by 2 orders, it will result to thecorresponding energy increase of FM wave packet.
At present, there is a practical way to design and producesingle mode fibers with chromatic dispersion varying alongthe length in accordance with some prearranged low [17].This method performs a precise control of the fiber corediameter during the drawing. This technology becamepossible owing to digital signal processing used for thecontrol of the drawing process. At present, fibers withvarious dispersion functions can be produced, for example,dispersion decreasing or dispersion increasing. The lengthof fiber with varying dispersion may be in the range fromseveral meters to several kilometers. The dispersion deviationfrom the prearranged value is less than 0.1 ps/nm/km. Todesign the fiber with varying dispersion, the preform withdispersion shifted waveguide structure could be used. Onecan obtain the relation between the chromatic dispersion andouter fiber diameter solving the scalar wave equation for thepreform profile and fixed drawing coefficient. The approachto produce fibers with chromatic dispersion varying alongthe length in accordance with a prearranged law becamepossible owing to digital signal processing used for thecontrol of the drawing process. A real-time software designedenabled measuring and remembering the process parametersduring the drawing and closing a feedback loop. The softwareand hardware tools enabled us to control the fiber diameterduring drawing. After that, the current diameter is comparedwith the prearranged value, and then, a control parameter(the drawing speed) was calculated in accordance with thealgorithm used. Working in such a manner, the feedbacksystem could control well of the fiber diameter. Reliableoperation of the digital control system in a wide drawingspeed range has allowed to fabricate single mode fibers withchromatic dispersion varying along length. The necessarylength dependence of the fiber diameter was written inthe memory of the control computer. During the drawing,the current fiber length is registered along with the otherparameters, the current diameter was compared with theprearranged value for the given length, and the necessarychange of the drawing speed is worked out by the controlalgorithm to produce the desirable diameter.
5. Conclusion
Thus, in the present paper, we have obtained the conditionsfor appearance of stable parabolic pulses in the optical fiberswith W-profile of radial propagation of the refractive index inthe normal group velocity dispersion region. The relation forthe GVD profile describing an optimally fast FM parabolicpulse amplification was offered. It was shown that the useof length-inhomogeneous FM similaritons (resistant to thewave instability) with the slightly increasing normal group-velocity dispersion allows to produce fiber laser systems witha high peak power P > 1MW.
Acknowledgment
This work was supported by the Federal Agency on Scienceand Innovations within the framework the Federal Task
Program “Academic and Teaching Staff of Innovative Russiain 2009-2013”.
References
[1] M. E. Fermann, V. I. Kruglov, B. C. Thomsen, J. M. Dudley,and J. D. Harvey, “Self-similar propagation and amplificationof parabolic pulses in optical fibers,” Physical Review Letters,vol. 84, no. 26, pp. 6010–6013, 2000.
[2] G. Chang, H. G. Winful, A. Galvanauskas, and T. B. Norris,“Self-similar parabolic beam generation and propagation,”Physical Review E, vol. 72, no. 1, Article ID 016609, pp. 1–4,2005.
[3] J. M. Dudley, C. Finot, D. J. Richardson, and G. Millot, “Self-similarity in ultrafast nonlinear optics,” Nature Physics, vol. 3,no. 9, pp. 597–603, 2007.
[4] T. Hirooka and M. Nakazawa, “Parabolic pulse generationby use of a dispersion-decreasing fiber with normal group-velocity dispersion,” Optics Letters, vol. 29, no. 5, pp. 498–500,2004.
[5] A. I. Latkin, S. K. Turitsyn, and A. A. Sysoliatin, “Theory ofparabolic pulse generation in tapered fiber,” Optics Letters, vol.32, no. 4, pp. 331–333, 2007.
[6] A. Y. Plotskii, A. A. Sysoliatin, A. I. Latkin et al., “Experimentson the generation of parabolic pulses in fibers with length-varying normal chromatic dispersion,” Zhurnal Eksperimen-tal’noi i Teoreticheskoi Fiziki, vol. 85, no. 7, pp. 397–401, 2007.
[7] A. V. Andrianov, S. V. Muraviov, A. V. Kim, and A. A.Sysoliatin, “Generation of optical soliton pulses smoothlytunable in a wide frequency range in silica fibers with variabledispersion,” JETP Letters, vol. 85, no. 8, pp. 364–368, 2007.
[8] I. O. Zolotovskii, D. I. Sementsov, A. K. Senatorov, A. A.Sysolyatin, and M. S. Yavtushenko, “Dynamics of similaritonpulses in length-inhomogeneous active fibres,” QuantumElectronics, vol. 40, no. 3, pp. 229–233, 2010.
[9] A. S. Zeytunyan, K. A. Palandjan, G. L. Esayan, and L.K. Muradyan, “Nonlinear dispersive similariton: spectralinterferometric study,” Quantum Electronics, vol. 40, no. 4, pp.327–328, 2010.
[10] J. Laegsgaard and P. J. Roberts, “Influence of air pressure onsoliton formation in hollow-core photonic bandgap fibers,”Journal of the Optical Society of America B, vol. 26, no. 9, pp.1795–1800, 2009.
[11] S. Wabnitz and C. Finot, “Theory of parabolic pulse propa-gation in nonlinear dispersion-decreasing optical fiber ampli-fiers,” Journal of the Optical Society of America B, vol. 25, no. 4,pp. 614–621, 2008.
[12] C. Dai, Y. Wang, and J. Zhang, “Analytical spatiotemporallocalizations for the generalized (3+1)-dimensional nonlinearSchrodinger equation,” Optics Letters, vol. 35, no. 9, pp. 1437–1439, 2010.
[13] C. Finot, B. Barviau, G. Millot, A. Guryanov, A. Sysoliatin, andS. Wabnitz, “Parabolic pulse generation with active or passivedispersion decreasing optical fibers,” Optics Express, vol. 15,no. 24, pp. 15824–15835, 2007.
[14] D. Ghosh, M. Basu, and S. Sarkar, “Generation of self-similarparabolic pulses by designing normal dispersion decreasingfiber amplifier as well as its staircase substitutes,” Journal ofLightwave Technology, vol. 27, no. 17, pp. 3880–3887, 2009.
[15] V. I. Kruglov, A. C. Peacock, J. M. Dudley, and J. D. Harvey,“Self-similar propagation of high-power parabolic pulses inoptical fiber amplifiers,” Optics Letters, vol. 25, no. 5-24, pp.1753–1755, 2000.
6 International Journal of Optics
[16] C. Finot, J. M. Dudley, B. Kibler, D. J. Richardson, and G.Millot, “Optical parabolic pulse generation and applications,”IEEE Journal of Quantum Electronics, vol. 45, no. 11, Article ID5308680, pp. 1482–1489, 2009.
[17] V. A. Bogatyrjov, M. M. Bubnov, E. M. Dianov, and A. A.Sysoliatin, “Advanced fibres for soliton systems,” Pure andApplied Optics, vol. 4, no. 4, article 009, pp. 345–347, 1995.
[18] U. G. Akhmetshin, V. A. Bogatyrev, A. K. Senatorov, A. A.Sysolyatin, and M. G. Shalygin, “New single-mode fibreswith the flat spectral dependence of the chromatic dispersionvarying over the fibre length,” Quantum Electronics, vol. 33,no. 3, pp. 265–267, 2003.
[19] M. E. Likhachev, M. M. Bubnov, K. V. Zotov et al., “Erbium-doped aluminophosphosilicate optical fibres,” Quantum Elec-tronics, vol. 40, no. 7, pp. 633–638, 2010.
[20] D. A. Grukh, V. A. Bogatyrev, A. A. Sysolyatin, V. M.Paramonov, A. S. Kurkov, and E. M. Dianov, “Broadbandradiation source based on an ytterbium-doped fibre withfibre-length-distributed pumping,” Quantum Electronics, vol.34, no. 3, pp. 247–248, 2004.
[21] G. A. Mourou, T. Tajima, and S. V. Bulanov, “Optics in therelativistic regime,” Reviews of Modern Physics, vol. 78, no. 2,pp. 309–371, 2006.
[22] V. V. Lozhkarev, S. G. Garanin, R. R. Gerke et al., “100-TW femtosecond laser based on parametric amplification,”Zhurnal Eksperimental’noi i Teoreticheskoi Fiziki, vol. 82, no.4, pp. 196–199, 2005.
[23] S. A. Akhmanov, V. A. Vysloukh, and A. S. Chirkin, Optics ofFemtosecond Laser Pulses, AIP, New York, NY, USA, 1992.
[24] D. N. Papadopoulos, Y. Zaouter, M. Hanna et al., “Generationof 63 fs 4.1 MW peak power pulses from a parabolic fiberamplifier operated beyond the gain bandwidth limit,” OpticsLetters, vol. 32, no. 17, pp. 2520–2522, 2007.
[25] D. J. Richardson, J. Nilsson, and W. A. Clarkson, “High powerfiber lasers: current status and future perspectives,” Journal ofthe Optical Society of America B, vol. 27, no. 11, pp. B63–B92,2010.

Hindawi Publishing CorporationInternational Journal of OpticsVolume 2012, Article ID 157319, 12 pagesdoi:10.1155/2012/157319
Review Article
Manipulating the Propagation of Solitons with Solid-CorePhotonic Bandgap Fibers
O. Vanvincq, A. Kudlinski, A. Betourne, A. Mussot, Y. Quiquempois, and G. Bouwmans
Laboratoire PhLAM, UMR CNRS 8523, IRCICA, Universite Lille 1, 59655 Villeneuve d’Ascq Cedex, France
Correspondence should be addressed to A. Kudlinski, [email protected]
Received 7 April 2011; Accepted 20 June 2011
Academic Editor: Miguel Gonzalez Herraez
Copyright © 2012 O. Vanvincq et al. This is an open access article distributed under the Creative Commons Attribution License,which permits unrestricted use, distribution, and reproduction in any medium, provided the original work is properly cited.
We review the dynamics of soliton self-frequency shift induced by Raman gain in special solid-core photonic bandgap fibers andits consequences in terms of supercontinuum generation. These photonic bandgap fibers have been designed to allow nonlinearexperiments in the first bandgap without suffering from significant loss even when working close to the photonic bandgap edge.We studied experimentally, numerically, and analytically the extreme deceleration of the soliton self-frequency shift at the long-wavelength edge of the first transmission window. This phenomenon is interpreted as being due to a large variation of thegroup-velocity dispersion in this spectral range and has been obtained with no significant power loss. Then, we investigatedexperimentally and numerically the generation of supercontinuum in this kind of fibers, in both spectral and temporal domains.In particular, we demonstrated an efficient tailoring of the supercontinuum spectral extension as well as a strong noise reductionat its long-wavelength edge.
1. Introduction
Solid-core photonic bandgap (PBG) fibers are one class ofmicrostructured optical fibers in which light is confinedin a low-index solid core by the PBGs of the cladding[1]. In the case of two-dimensional PBGs, the periodicmicrostructured cladding is usually composed of periodichigh-index inclusions embedded in a low-index background[1]. The core region then corresponds to a defect (lack ofinclusion) in the center of the periodic structure. Becauseof the intrinsic nature of the PBG waveguidance, the fibertransmission properties are characterized by discrete spectralbands [1, 2] in which the group-velocity dispersion (GVD),attenuation, and effective mode area of the fundamentalcore mode are strongly wavelength dependent [3], especiallynear the PBG edges [1, 4]. These singular characteristicsare thus of particular interest in the field of nonlinear(NL) fiber optics. The potential of solid-core PBG fibersfor NL propagation experiments has already been pointedout by the report of soliton propagation and phase-matcheddispersive wave generation [5, 6], even across different PBG[7]. Degenerate four-wave mixing [8], frequency doublingand tripling [9], and supercontinuum (SC) generation acrossadjacent PBGs have also been investigated numerically [10].
In this paper, we present an overview of our recent workshowing how the particular properties of solid-core PBGfibers can influence soliton propagation and SC generation.First, we detail the linear properties of the fabricated solid-core PBG fibers under investigation through experimentsand numerical modelling. Then, we demonstrate experimen-tally that the soliton self-frequency shift (SSFS) effect can bestrongly mitigated [11]. A simple analytical model indicatesthat this is caused by the strong third-order dispersionexperienced by solitons as they approach the PBG edge.Finally, we show that this SSFS quasicancellation allowsto control the spectral extent of infrared SC in the long-pulse regime [12] and, simultaneously, leads to a significantreduction of spectral power fluctuations at the SC long-wavelength edge [13].
2. Linear Properties of the Solid-CorePhotonic Bandgap Fibers
The solid-core PBG fibers used in various experimentsreported in this paper are all based on the same doubleperiodicity structure [11, 12], although their optogeomet-rical characteristics (summarized in Table 1) slightly varyfrom one fiber to another. The scanning electron microscope

2 International Journal of Optics
Table 1: Table summarizing the optogeometrical properties of the three fabricated solid-core PBG fibers under investigation.
dGe (μm) dair (μm) Λ (μm) ZDW (nm) NL coefficient (W−1·km−1) PBG edge (nm)
Fiber 1 2.19 2.33 3.09 905 6 (at 1200 nm) 1535
Fiber 2 2.20 2.25 3.25 915 6.9 (at 1064 nm) 1580
Fiber 3 2.22 2.27 3.28 921 6.8 (at 1064 nm) 1590
30 μm
Figure 1: SEM image of the solid-core PBG fiber 1. Black regionsare air holes, light gray regions are GeO2-doped inclusions, and thedark gray background is pure silica.
(SEM) image shown in Figure 1 illustrates such a doubleperiodicity solid-core PBG fiber. The periodical high-indexresonators (light gray regions in Figure 1) present in thecladding are responsible for the PBG guidance and are madeof germanium-doped silica with a parabolic refractive indexprofile and a maximal index difference Δn of 32 × 10−3 (ascompared to pure silica). They are embedded in a pure silicabackground (dark gray). Because we decided to work in thefirst PBG (mainly to minimize the effective area in orderto maximize the NL coefficient), air holes of diameter dair
(depicted in black in Figure 1) were periodically added intothe cladding structure for reducing the otherwise relativelyhigh confinement losses in this PBG [14, 15]. The core regioncorresponds to a defect (lack of air hole) in the center ofthe periodic structure. The geometrical parameters of thethree solid-core PBG fibers investigated here are summarizedin Table 1, where the pitch Λ corresponds to the distancebetween two neighboring germanium-doped inclusions.
Although all fibers were characterized the same way, weonly present here the linear properties of fiber 1, whoseSEM image is depicted in Figure 1. Other fibers presentsimilar characteristics, with a slight red-shift of the PBGtransmission windows due to a slightly greater pitch Λ.Figure 2 shows the experimental transmission spectrum of awhite light SC source through a 2 m long sample of the solid-core PBG fiber. The first PBG is very broad and extends from740 to 1535 nm, whereas the second one is much sharperand extends from 510 to 650 nm. As for usual solid-core PBGfibers, typical resonances can be observed in the first ring of
Tran
smit
ted
pow
er(1
0dB
/div
.)
1600140012001000800600Wavelength (nm)
10−5
10−4
10−3
10−2
10−1
100
101
102
103
Con
fin
emen
tlo
sses
(dB
/km
)
Figure 2: Transmission spectrum of the solid-core PBG fiber 1(black line, left axis) measured with a SC source, and computedconfinement losses across the first PBG (red line, right axis). Insetsshow the near-field mode profile in the first (right) and second (left)PBG. Gray areas depict spectral regions in which the PBG guidancein the core is not allowed.
800
600
400
200
0
GV
D(p
s/n
m/k
m)
1600140012001000800
Wavelength (nm)
10
8
6
4
2
GVD measurement
GVD calculation
Non
linea
rco
eci
ent
(W−1·k
m−1
)
Figure 3: Calculated GVD curve of the solid-core PBG fiber 1(solid black line, left axis), and corresponding measurements witha white-light interferometry setup (markers). Spectral evolution ofthe computed NL coefficient (red line, right axis). The gray areadepicts the region outside the first PBG transmission window.
high-index resonators [4], with the number of intensity max-ima indicating the PBG order (insets of Figure 2). The redcurve (right axis) shows confinement losses across the firstPBG calculated with a finite element mode solver. They areless than 1 dB/km across most of the PBG, and as expectedthey drastically increase to the dB/m range near the PBGedge. Figure 3 shows the calculated GVD curve of the solid-core PBG fiber 1 (solid black line), as well as measurements
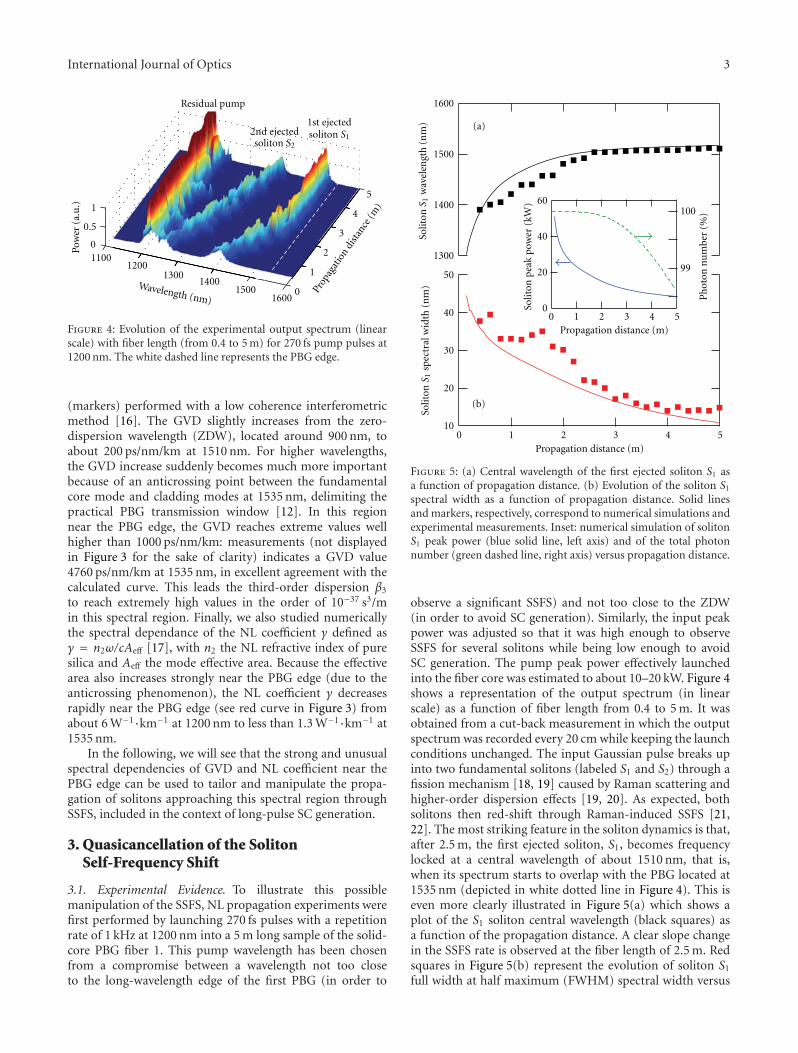
International Journal of Optics 3
11001200
13001400
15001600
0
0
0.5
5
1
Pow
er(a
.u.)
Wavelength (nm)
1
2
3
4
Residual pump
1st ejected2nd ejected soliton S1soliton S2
Prop
agat
ion
dist
ance
(m)
Figure 4: Evolution of the experimental output spectrum (linearscale) with fiber length (from 0.4 to 5 m) for 270 fs pump pulses at1200 nm. The white dashed line represents the PBG edge.
(markers) performed with a low coherence interferometricmethod [16]. The GVD slightly increases from the zero-dispersion wavelength (ZDW), located around 900 nm, toabout 200 ps/nm/km at 1510 nm. For higher wavelengths,the GVD increase suddenly becomes much more importantbecause of an anticrossing point between the fundamentalcore mode and cladding modes at 1535 nm, delimiting thepractical PBG transmission window [12]. In this regionnear the PBG edge, the GVD reaches extreme values wellhigher than 1000 ps/nm/km: measurements (not displayedin Figure 3 for the sake of clarity) indicates a GVD value4760 ps/nm/km at 1535 nm, in excellent agreement with thecalculated curve. This leads the third-order dispersion β3
to reach extremely high values in the order of 10−37 s3/min this spectral region. Finally, we also studied numericallythe spectral dependance of the NL coefficient γ defined asγ = n2ω/cAeff [17], with n2 the NL refractive index of puresilica and Aeff the mode effective area. Because the effectivearea also increases strongly near the PBG edge (due to theanticrossing phenomenon), the NL coefficient γ decreasesrapidly near the PBG edge (see red curve in Figure 3) fromabout 6 W−1·km−1 at 1200 nm to less than 1.3 W−1·km−1 at1535 nm.
In the following, we will see that the strong and unusualspectral dependencies of GVD and NL coefficient near thePBG edge can be used to tailor and manipulate the propa-gation of solitons approaching this spectral region throughSSFS, included in the context of long-pulse SC generation.
3. Quasicancellation of the SolitonSelf-Frequency Shift
3.1. Experimental Evidence. To illustrate this possiblemanipulation of the SSFS, NL propagation experiments werefirst performed by launching 270 fs pulses with a repetitionrate of 1 kHz at 1200 nm into a 5 m long sample of the solid-core PBG fiber 1. This pump wavelength has been chosenfrom a compromise between a wavelength not too closeto the long-wavelength edge of the first PBG (in order to
1600
1500
1400
1300
543210Propagation distance (m)
50
40
30
20
10
60
40
20
0Solit
onp
eak
pow
er(k
W)
543210Propagation distance (m)
100
99
Ph
oton
nu
mbe
r(%
)
(a)
(b)
Solit
onS 1
wav
elen
gth
(nm
)So
liton
S 1sp
ectr
alw
idth
(nm
)
Figure 5: (a) Central wavelength of the first ejected soliton S1 asa function of propagation distance. (b) Evolution of the soliton S1
spectral width as a function of propagation distance. Solid linesand markers, respectively, correspond to numerical simulations andexperimental measurements. Inset: numerical simulation of solitonS1 peak power (blue solid line, left axis) and of the total photonnumber (green dashed line, right axis) versus propagation distance.
observe a significant SSFS) and not too close to the ZDW(in order to avoid SC generation). Similarly, the input peakpower was adjusted so that it was high enough to observeSSFS for several solitons while being low enough to avoidSC generation. The pump peak power effectively launchedinto the fiber core was estimated to about 10–20 kW. Figure 4shows a representation of the output spectrum (in linearscale) as a function of fiber length from 0.4 to 5 m. It wasobtained from a cut-back measurement in which the outputspectrum was recorded every 20 cm while keeping the launchconditions unchanged. The input Gaussian pulse breaks upinto two fundamental solitons (labeled S1 and S2) through afission mechanism [18, 19] caused by Raman scattering andhigher-order dispersion effects [19, 20]. As expected, bothsolitons then red-shift through Raman-induced SSFS [21,22]. The most striking feature in the soliton dynamics is that,after 2.5 m, the first ejected soliton, S1, becomes frequencylocked at a central wavelength of about 1510 nm, that is,when its spectrum starts to overlap with the PBG located at1535 nm (depicted in white dotted line in Figure 4). This iseven more clearly illustrated in Figure 5(a) which shows aplot of the S1 soliton central wavelength (black squares) asa function of the propagation distance. A clear slope changein the SSFS rate is observed at the fiber length of 2.5 m. Redsquares in Figure 5(b) represent the evolution of soliton S1
full width at half maximum (FWHM) spectral width versus

4 International Journal of Optics
propagation length. It is shown that, as soliton S1 red-shifts,it initially experiences a spectral compression from about40 nm to 15 nm within the first 3 m. For longer propagationdistances, that is, when the soliton is frequency locked,its spectral width stabilizes to about 15 nm, without anysignificant change in its spectral power density, as observedin Figure 4. Note that the same phenomenon was observedfor the soliton S2 (at a longer fiber length) and even for morethan five ejected solitons by increasing the pump power.These experiments clearly show that the SSFS is extremelydecelerated (and even quasicancelled) when the solitonsapproach the PBG edge, this effect being accompanied by aspectral compression.
3.2. Confirmation with Numerical Simulations. In order toget further insight into this phenomenon, we performednumerical simulations by integrating the generalized NLSchrodinger equation (GNLSE) taking into account themode profile dispersion [23]. In this case, it writes [23, 24]:
∂C(z,ω)∂z
= i(β(ω)− β0 − β1(ω − ω0)
)C(z,ω)− α(ω)
2C(z,ω)
+ iγ(ω)F(C(z, t)
∫∞−∞
R(t − t′)∣∣C(z, t′)∣∣2dt′
),
(1)
where the NL coefficient takes the following form [24]:
γ(ω) = n2ωn0
cneff(ω)√Aeff(ω)Aeff(ω0) (2)
and C(z,ω) = A(z,ω)(Aeff(ω0)/Aeff(ω))1/4, A(z,ω) being thecomplex spectral envelope. The coefficient β0 corresponds tothe mode propagation constant β(ω) at the center frequencyof the input pulse spectrum ω0, and β1 is the first derivativeof β(ω) (i.e., dβ(ω)/dω). The symbol F denotes the Fouriertransform of the function in argument, and α(ω) is the fiberlinear power attenuation at ω. The silica response function isdefined by R(t) = (1− fR)δ(t) + fRhR(t) where fR = 0.18 andhR(t) is the Raman response function which is approximatedby the analytical expression given in [25].
Figure 6 shows a propagation simulation over 5 m of a270 fs Gaussian pulse with 15 kW peak power centered at1200 nm, corresponding to the input experimental pulses.The frequency dependence of all parameters, that is, α(ω),β(ω), and Aeff(ω), associated with the experimental fiber wastaken into account. This simulation shows excellent quali-tative agreement with the experimental results of Figure 4.The input pulse experiences fission leading to the ejectionof two fundamental solitons, labeled S1 to S2, and theSSSF associated to soliton S1 is strongly decelerated nearthe PBG edge. This effect is accompanied by a spectralcompression and an increase of its spectral power density.Black and red solid lines in Figure 5, respectively, correspondto the simulated soliton S1 central wavelength and FWHMspectral width. They show good quantitative agreement withexperiments, especially when the solitons approach the PBG
11001200
13001400
1500
0
0
0.5
1
Pow
er(a
.u.)
Wavelength (nm)
Residual pump
1600
1
2
3
4
Prop
agat
ion
dist
ance
(m)
5
1st ejected2nd ejected soliton S1soliton S2
Figure 6: Numerical simulation of the propagation of a 270 fsGaussian pulse with 15 kW peak power centered at 1200 nm,showing fission and ejection of two fundamental solitons S1 andS2. All frequency-dependant parameters of the fiber were taken intoaccount. The white dashed line represents the PBG edge.
edge (for propagation distances greater than 2.5 m). The bluesolid curve in the inset of Figure 5 represents the soliton S1
peak power as a function of propagation distance. Althoughits spectral power density increases (as shown in Figure 6),its peak power (in the temporal domain) decreases alongpropagation, because the soliton temporally broadens. Thevariation of total photon number as a function of fiber lengthis displayed in the green dashed curve in the inset of Figure 5.It decreases (due to linear attenuation) by only less than1.5% within the first 5 m, which indicates that the solitonS1 does not significantly suffer from the high attenuationat the PBG edge. This suggests that the quasicancellationof the SSFS does not occur at the expense of significantattenuation. At this point, however, the physics at the originof this phenomenon has not been elucidated yet.
3.3. Discussion. First, let us recall that, as a soliton reachesthe PBG edge, the values of the GVD evaluated at its centralfrequency strongly increase while its NL coefficient is largelyreduced (see Figure 3). All these spectral evolutions areexpected to be detrimental to the efficiency of the SSFS asthey lead, directly or indirectly, to a significant increase ofthe pulse duration which is known to strongly affect theSSFS efficiency [17, 22]. In the following, we will presentan analytical approach that allows to quantify the relativeweight of the spectral dependence of the GVD (dβ2/dω) andNL coefficient (dγ/dω) on the SSFS rate. For the sake ofclarity, we only consider hereafter fundamental solitons asinput pulses. This is justified by the fact that experimentalinput pulses experience fission which leads to pulse breakupand ejection of actual fundamental solitons [18–20]. Thecharacteristics of these input pulses (hyperbolic secant pulsesof 21 fs duration FWHM and 100 kW peak power) wereestimated from the measurement of the soliton S1 spectralwidth in Figure 5(b), assuming a soliton order N2 = 1.
The starting point of our analysis is the well-knownGordon formula allowing to predict the SSFS rate, d〈ω〉/dz,of a fundamental soliton of mean frequency 〈ω〉 and

International Journal of Optics 5
duration T as a function of propagation distance z [22]. Itwrites
d〈ω〉dz
= − fR∣∣β2(z)
∣∣T(z)π4
I(z), (3)
where
I(z) =∫
I(hR(Ω′)
) Ω′3
sinh2(T(z)πΩ′/2)dΩ′ (4)
and I(hR) is the imaginary part of the Fourier transformof the Raman response, which is related to the Raman gainspectrum [22]. Then, assuming that (i) the soliton remainsfundamental, (ii) confinement losses are negligible, and (iii)the photon number is conserved, it is possible to find thefollowing evolution of the soliton duration T as a functionof propagation distance z [11]:
T(z) = γ(0)2∣∣β2(z)∣∣
γ(z)2∣∣β2(0)∣∣T0, (5)
where T0 = T(z = 0) is the initial soliton temporal width.Figure 7 shows the evolution of the soliton central wave-length along propagation calculated by integrating (3) withhelp of (5) (red line) and by the numerical resolution of theGNLSE given by (1) (black line). A reasonable agreementis obtained between both curves, especially for the longestpropagation distances (i.e., when the soliton appears to befrequency locked), the relative discrepancy on the frequencyshift being less than 3% for values of z larger than 1 m.Thus, this Figure 7 shows that (i) the SSFS deceleration nearthe PBG edge is directly linked to the fiber properties, asclaimed above and that (ii) the soliton central frequencycan be predicted easily and very accurately for the longestpropagation distances, without requiring the resolution ofthe GNLSE.
Then, in order to distinguish the effect of the spectraldependence of γ and the one of the spectral dependenceof β2, we now calculate the variation of the SSFS rate withpropagation distance z. Assuming that β2 < 0, that is, |β2| =−β2, this writes [11]
d2〈ω〉dz2
= fRT(z)πI(z)4
×[
2β2(z)γ(z)
(4− K(z))dγ
dz− (3− K(z))
dβ2
dz
],
(6)
where
K(z) = 1I(z)
∫⎡⎣I(hR(Ω′)
)−⎛⎝dI
(hR
)dΩ
⎞⎠Ω′
Ω′⎤⎦
× Ω′3
sinh2(T(z)πΩ′/2)dΩ′.
(7)
From (6), it can be seen that the variation of SSFS rateduring the propagation depends on the variation of β2 and
Rra
tio
10
8
6
4
2
0
Fibe
rle
ngt
h(m
)
16001500140013001200
Soliton wavelength (nm)
1.5
1
0.5
0
GNLSEAnalytical model
Figure 7: Left axis: evolution of the soliton central wavelength withfiber length calculated by integration of the GNLSE (black line) andwith (5) in the case of the Gordon model (red line). Right axis:evolution of the R ratio defined by (8) with soliton wavelength.
γ with z. Since the fiber is assumed to be invariant along itslength, the variations of β2 and γ with z are in fact only dueto their spectral evolution as the soliton red-shifts, that is,β2〈ω(z)〉 and γ〈ω(z)〉. Consequently, the derivative of β2 andγ with respect to z in (6) can mathematically be expressed interms of their derivative with respect to ω. We then introducethe R ratio defined as
R = −(
4− K(z)3− K(z)
)2β2
γ
dγ/dω
dβ2/dω(8)
so that values of R higher than 1 indicate that the NLcoefficient variation dγ/dω dominates the evolution of SSFSrate while values of R smaller than 1 mean that the dynamicsof the SSFS is mainly driven by the GVD variation dβ2/dω,that is, by the third-order dispersion term β3.
The blue curve of Figure 7 (right axis) shows a plot of theR ratio as a function of soliton wavelength calculated with(8). From this plot, it can be seen that the spectral variationof γ dominates the beginning of the SSFS dynamics, whereasfor wavelengths higher than 1475 nm the effect induced bythe spectral variation of β2 becomes predominant. Moreimportantly, the R value just below the PBG edge (located at1535 nm) is about 0.1, which clearly means that the extremedeceleration of the SSFS is due to the large GVD slope|β3| near the PBG edge rather than the large NL coefficientdiminution.
Finally, let us mention that, in the absence of loss, a realcancellation of the SSFS, that is, d〈ω〉/dz = 0, implies that β2
and/or Aeff are infinite in order to get T also equal to infinite.Thus, the strong decrease of the SSFS efficiency near the PBGedge does not lead, strictly speaking, to a true suppressionof the SSFS for a finite propagation distance. However, theextreme deceleration observed all along this paper is enoughto consider that the soliton frequency can be considered, atleast from a practical point of view, as frequency locked.

6 International Journal of Optics
0
2
4
6
8
Wavelength (nm)
1100 12001300 1400 1500
1600
1000900
Pow
er(2
0dB
/div
.)
PumpSolitons
accumulation
Prop
agat
ion
dist
ance
(m)
0
2
4
6
W
1100 12001300 1400 1500
100000
accumulation
Prop
agat
ion
dist
an
Figure 8: Experimental dynamics of the SC formation as a functionof fiber length in the solid-core PBG fiber 2 for a pump power of2.3 kW. The white dashed line represents the PBG edge.
4. Tailoring the SC Extension
The SSFS is one of the main mechanisms involved in thegeneration of octave-spanning SC [26]. Indeed, in boththe short- and long-pulse pumping regimes [27], the long-wavelength part of the SC spectrum is composed of red-shifting fundamental solitons initially created, respectively,by pulse fission and modulation instability (MI) [26]. Giventhat the spectral extent in the visible is intimately linked tothe infrared one through a group index matching betweensolitons and trapped dispersive waves [28, 29], the SSFSdynamics lies at the heart of the SC generation process. Therehave been many attempts to optimize the spectral extensionof SC sources, but, in most applications, only a small partof the SC spectrum is useful. There is thus an increasinginterest in tailoring the spectral extent so that SC generationonly occurs over the required spectral region. Fibers with twoZDWs have been employed in this way [30, 31]. Because theregion of anomalous GVD can be suitably adjusted througha control of the microstructured cladding parameters, theSSFS can be cancelled near the long-wavelength ZDW, whichresults in a stop of the infrared spectral broadening. However,the SSFS cancellation is accompanied by the emission of adispersive wave at higher wavelengths, so that the energyof frequency locked solitons exponentially decreases. In thissection, we show that the cancellation of the SSFS observedin solid-core PBG fibers described above allows to control theSC spectral extent without any significant loss of energy.
4.1. Dynamics of the SC Formation. SC experiments wereperformed using the solid-core PBG fiber 2 of Table 1, inwhich long-wavelength PBG edge is located at 1580 nm. Thepump laser used to generate the SC was a linearly polarizedmicrochip laser emitting 0.6 ns pulses at 1064 nm with a rep-etition rate of 7 kHz. The coupling efficiency in the fibre coreis estimated to be 50%. In the following, input power alwaysrefers to the power effectively launched into the fibre core.
0.5
Wavelength (nm)
1100 12001300 1400 1500 1600
1000900Pow
er(2
0dB
/div
.)
PumpSolitons
accumulation
0.51100 12001300 1400
100000
accumulation
2.5
2
1.5
1
Inpu
t pea
kpo
wer
(kW
)
Figure 9: Experimental dynamics of the SC formation as a functionof launched pump peak power. The white dashed line represents thePBG edge.
At first, we investigated the dynamics of the SC formationwith propagation distance by cutting the fiber back from 8 to0.1 m and recording the output spectrum every 0.5 m, for afixed pump power of 2.3 kW. Figure 8 shows the evolution ofthe output spectrum as a function of propagation distance.The spectrum initially presents two symmetric side lobescharacteristic of MI classically observed when pumping inthe anomalous GVD regime. In the temporal domain, thiscorresponds to the generation of a solitonic train, in whichpulses strongly differ from each other in terms of peakpower and duration. The spectrum then mainly broadenstowards the infrared (because we pump relatively far awayfrom the ZDW in the anomalous dispersion regime) untila fiber length of about 4 m is reached. At this propagationdistance, the SC ranges from 1050 to 1580 nm. The infraredspectral broadening is due to the SSFS of each individualsoliton generated from MI. Since they are characterized byvery different properties, their SSFS efficiency can be verydifferent, which leads to the SC. For further increasing fiberlengths to 8 m, the long-wavelength spectral broadeningcompletely stops, due to the SSFS cancellation of eachsoliton approaching the PBG edge, following the mechanismdescribed in Section 3. This leads to an accumulation ofsolitons just below the PBG edge (located at 1580 nm),which can be seen as a spectral power peak centered around1550 nm. Consequently, the SC long-wavelength spectralextent can be tailored over a given spectral range througha suitable design of the fiber linear properties and, inparticular, of the long-wavelength PBG edge.
To further illustrate this, we performed an additionalexperiment in which the dynamics of the SC formation wasinvestigated as a function of pump peak power, for a fixedfiber length of 10 m. To do that, the output spectrum wasrecorded with 0.2 kW increments for pump peak powersranging from 0.2 to 2.6 kW. The result of these measurementsis displayed in Figure 9. Similar to previous experiments ofFigure 8, the spectrum mainly broadens towards the infraredwhen the pump peak power is increased from 0 up to about

International Journal of Optics 7
2.521.510.50
1700
1600
1500
1400
1300
1200
1100
Lon
g-w
avel
engt
hed
ge(n
m)
Input peak power (kW)
(a)
12
10
8
6
4
2
0
Ou
tpu
tpo
wer
(mW
)
2.521.510.50
Input peak power (kW)
Whole SC spectrumSC spectrum with pump removed
(b)
Figure 10: (a) Measurement of the long-wavelength edge of the SCspectrum as a function of input peak power in a 10 m-long solid-core PBG fiber sample. The gray area depicts the region outside thefirst PBG transmission window. (b) Measured output average powerover the whole SC spectrum (red squares) and by removing theoutput pump peak with a 1064 nm notch filter (blue squares), as afunction of input peak power. Dotted lines are linear fits. The greenarea corresponds to input peak powers for which the SC spectralextent stops (i.e., for input peak powers greater than 1.8 kW).
1.7 kW. For higher pump powers, the spectral broadeningsuddenly stops at the long-wavelength PBG edge. This iseven more clearly illustrated in Figure 10(a) which representsthe long-wavelength SC edge (measured for a 10 dB dropwith respect to the spectral power at 1100 nm) as a functionof input peak power. A clear cancellation of the spectralbroadening at the PBG edge (depicted in gray) is observedfor peak powers higher than 1.7 kW. As discussed above, thiseffect is accompanied by an accumulation of solitons whichcan be seen as a spectral power peak at 1550 nm, that is, justbelow the PBG edge located at 1580 nm.
4.2. Discussion. As shown by Figure 4 and discussed inSection 3, the SSFS cancellation occurs without any reduc-tion of the spectral power density. This thus suggests, inthe frame of SC generation, that the SC spectrum widthcan be limited by the PBG effect without any significant
power loss. In order to check this experimentally, we plottedin Figure 10(b) the output average power measured overthe whole SC spectrum (red squares) as a function of theinput peak power. These measurements can be linearly fitted(red line), and the slope does not change once the SSFScancellation has occurred and the SC spectral broadeninghas stopped (corresponding to the green region). In orderto check that this was not due to the residual pump peak inthe SC, we performed the same kind of measurements afterfiltering it with a notch filter at 1064 nm at the fiber output.The results are displayed with blue markers in Figure 10 andshow that the output SC power (without the contributionof the 1064 nm pump) still increases with the input peakpower. This confirms that the tailoring of the SC extent is notdone through a simple long-wavelength filtering due to thePBG effect, which would lead to a significant output powerreduction. In our case, the fact that solitons are frequencylocked rather than attenuated near the PBG edge allows tokeep most of the launched power into the SC and thus tooptimize the pump power budget.
5. Reduction of Pulse-to-PulsePower Fluctuations at the SCLong-Wavelength Edge
In this section, we focus our attention on pulse-to-pulse fluc-tuations of the SC spectral power near the long-wavelengthedge of the spectrum. Indeed, in the long-pulse regime, thespectral broadening originates from the MI process whichis seeded by noise and the long-wavelength SC edge ischaracterized by statistically rare optical rogue waves [32],originating from soliton dynamics [32–35]. Consequently,the SC is characterized by a low coherence, and pulse-to-pulse fluctuations of the spectral power at the long-wavelength SC edge are very important [32, 36]. Here, weinvestigate the impact of the SSFS cancellation observed insolid-core PBG fibers on pulse-to-pulse fluctuations of thelong-wavelength SC edge.
5.1. Experiments. Experiments were performed using thesolid-core PBG fiber 3 of Table 1, in which long-wavelengthPBG edge is located at 1590 nm. Following the resultsof Section 4, a SC was generated using a 7 m long fibersample and a pump power of 3 kW. Figure 11(a) shows ameasurement of the spectral broadening as a function ofpropagation distance (made using a cutback technique). Asexpected, the infrared spectral broadening stops near thePBG edge, depicted with the dashed white line. Figures11(b1) and 11(b2) shows the spectra obtained at 7 m and2.5 m, respectively. Although the spectral extent is compa-rable in both cases, the shape of the spectrum is different.Indeed, while the long-wavelength edge is relatively smoothfor a fiber length of 2.5 m, it becomes much sharper at 7 m,where the cancellation of the SSFS imposes a saturation ofthe spectral broadening. This phenomenon causes a solitonaccumulation whose spectral signature is the peak locatedaround 1560 nm, as discussed in the previous section.
Pulse-to-pulse power fluctuations of the correspondingSC obtained at 2.5 and 7 m were then studied experimentally.

8 International Journal of Optics
1600140012001000Wavelength (nm)
7
6
5
4
3
2
1
0
Pro
paga
tion
dist
ance
(m)
(a)
Pow
er(1
0dB
/div
.)1600140012001000
Wavelength (nm)
7 m
2.5 m
b1
b2
(b)
0
1.2
0.8
0.4
0
Nor
mal
ized
sign
al
6004002000
Time (a.u.)
0.8
1.6
c1
c2
(c)
1200
800
400
0
Nu
mbe
rof
occu
rren
ces
0
400
200
Normalized signal0 1 2
d1
d2
(d)
Figure 11: (a) Measurement of the spectral broadening as a function of propagation distance in the solid-core PBG fiber 3. The white dashedline represents the PBG edge. (b) Measured spectra for a fiber length of 7 m (b1) and 2.5 m (b2). (c1 and c2) Samples of corresponding pulsetrain recorded after a 10 nm bandpass spectral filtering at 1550 nm (depicted by the purple region in (b)). (d1 and d2) Correspondingstatistical distribution of the signal amplitude over 10,000 records. The signal amplitude is normalized to the average over the 10,000 pulses.
To do this, the SC output was collimated and spectrally fil-tered with a 10 nm bandpass filter centered at 1550 nm, thatis, on the soliton accumulation peak. Pulse-to-pulse fluctu-ations in this 10 nm wide spectral regions were measuredusing the method firstly proposed in [37]. The energy ofspectrally filtered pulses is proportional to their peak power,so that rogue events and their associated characteristics canbe captured through a simplified measurement of shot-to-shot pulse energy [37]. This was done in our experimentsusing a photodiode and an analog oscilloscope, with thesame photodiode maximum signal amplitude and triggerlevel for both fiber lengths. Note that, in our experiments,this setup provides a measurement of the average energy ofeach pulse, but it does not allow to quantify noise-sensitiveinstabilities related to the actual temporal coherence of theSC, as explained in [38] for instance. The percentage of shot-to-shot variations, σ , was evaluated using σ = 100× (Vmax −Vmin)/(Vmax + Vmin) where Vmax and Vmin are, respectively,the maximum and minimum photodiode signal amplitudemeasured at least for 10 of the 10,000 recorded pulses.
Figures 11(c1) and 11(c2) show samples of pulse trainsmeasured for each investigated fiber length after the 10nm bandpass filter at 1550 nm, from which pulse-to-pulsefluctuations σ can be evaluated. The pulse amplitude hasbeen normalized to its average value over the 10,000measurements for this plot. Pulse-to-pulse fluctuations cal-culated at 1550 nm are as high as 80% after 2.5 m while theydrop down to 10% after 7 m. Besides, the correspondingstatistical distributions at 1550 nm have very different shapes,as attested by Figures 11(d1) and 11(d2) which representhistograms calculated over 10,000 measurements for fiberlengths of 2.5 m and 7 m, respectively. The distribution ishighly asymmetric after 2.5 m but becomes Gaussian-like at7 m, that is, once solitons have reached the PBG edge. Theseobservations thus suggest that there is a correlation betweenthe cancellation of the SSFS occurring near the PBG edge(leading to a saturation of the SC spectrum for propagationdistances longer than about 3 m), and the enhanced pulse-to-pulse stability and statistical distributions in the samespectral region.
5.2. Confirmation with Simulations. In order to get insightinto these results, we performed numerical simulations usingthe GNLSE given by (1). At first, we simply attempted toreproduce experimental results of Figure 11. To do this, allavailable fiber characteristics and experimental conditionshave been taken into account with no free parameter, withthe exception of the pulse duration that has been reducedto 50 ps (against 600 ps in experiments). Indeed, shorteningthe pulse duration in simulations (while staying in thelong-pulse regime though) allows to significantly reducethe computation time without significantly affecting theSC dynamics. The input pump peak power was 3 kW, andquantum noise was modeled by adding one photon per modewith random phase on each spectral discretization bin of theinput field [26]. In order to study the statistical behavior ofthe pulse train, we performed 200 simulations with randominitial noise conditions.
Simulations results are displayed in Figure 12, with thesame organization as Figure 11 for easy comparison. Figures12(a), 12(b1), and 12(b2), which show the dynamics ofthe SC formation, correspond to the averaged spectra over200 simulations shots. The agreement with experiments isexcellent, and the typical spectral features discussed aboveabout the spectrum shape at its long-wavelength edge areaccurately reproduced. The simulated temporal propertiesshown in Figures 12(c1), 12(c2), 12(d1), and 12(d2) havebeen calculated using a numerical gaussian filter of 10 nm(FWHM) centered at 1562 nm, which corresponds to themaximum of the spectral power peak observed near thePBG edge (see plot 12(b1)). Taking the inverse Fouriertransform gives the temporal profile of the SC filtered at thecorresponding wavelength, whose average power has beencalculated. Samples of the modeled pulse trains correspond-ing to 20 simulation shots are displayed in Figures 12(c1)and 12(c2), for, respectively, fiber lengths of 7 and 2.5 m.Corresponding statistical distributions calculated from allthe 200 simulations are shown in Figures 12(d1) and 12(d2)and also show excellent agreement with experiments.
All these simulation results therefore allow to repro-duce not only the main spectral features observed in the

International Journal of Optics 9
1600140012001000Wavelength (nm)
7
6
5
4
3
2
1
0
Pro
paga
tion
dist
ance
(m)
(a)
Pow
er(1
0dB
/div
.)
1600140012001000Wavelength (nm)
7 m
2.5 m
b1
b2
(b)
6
4
2
0
Nor
mal
ized
pow
er
20151050Shot number
1.5
1
0.5
0
c1
c2
(c)
Nu
mbe
rof
occu
rren
ces
40
20
0
20
10
0
Normalized power543210
d1
d2
(d)
Figure 12: (a) Simulation of the spectral broadening as a function of propagation distance in the solid-core PBG fiber 3 (averaged over 200simulation shots). The white dashed line represents the PBG edge. (b) Simulated averaged spectra for fiber lengths of 7 m (b1) and 2.5 m(b2). (c1 and c2) Samples of corresponding pulse train after spectral filtering at 1562 nm (depicted by the purple region in (b)). (d1 and d2)Corresponding histograms over 200 pulses at 1562 nm, where the power is normalized to its average over the 200 shots.
experiments (dynamics of the SC formation, typical spectralshape at the long-wavelength edge), but also the mea-sured statistical features of the pulse train (pulse-to-pulsefluctuations as a function of wavelength and propagationdistance, shape of the distribution). At this point, however,numerical simulations do not allow to discuss on the physicalmechanisms responsible for the enhanced pulse-to-pulsestability near the PBG edge.
5.3. Discussion. Numerical simulations using the GNLSEaccurately reproduce our experiments and can consequentlybe used to discuss the physical mechanisms causing theenhanced stability of the SC long-wavelength edge. To thisend, the spectrotemporal representation has proved to bea powerful tool in studying the dynamics of SC generation[26]. Figures 13(a)–13(d) show the evolution of a simulatedspectrogram for fiber lengths of 1, 2.5, 4, and 7 m.
Figure 13(a) shows how MI initially generates solitonsthat subsequently red-shifts through Raman-induced SSFS ascan be seen from Figure 13(b). In such a long-pulse pumpingregime, the presence of statistically rare temporal events inSC experiments can find two complementary physical ori-gins. Firstly, it can be due to a single high peak power solitongenerated from MI for particular initial noise conditions[32, 33]. Because of its higher peak power, it experiences amore efficient SSFS than other solitons and, consequently,becomes statistically rare at highest wavelengths due tothe low probability for these particular noise conditions tohappen [32]. Note that, in this case, the requirements fora soliton to be statistically rare at the long-wavelength SCedge, are only to experience a slightly more efficient SSFSthan the other ones [39]. Secondly, following these earlyinterpretations, it has been suggested that rare and briefevents can arise from the collision of two or more solitonstravelling with different group velocities [34, 35, 39, 40]because of the convective nature of the system [41]. Note thatthese two explanations are complementary for explaininglong-tail statistical distributions usually observed at the SClong-wavelength edge [41].
In the case of the present experiments, however, thisdynamics is strongly affected by the SSFS cancellationoccurring near the PBG edge, as can be seen from Figures13(c) and 13(d). Firstly, these figures show that, as long assolitons are frequency locked around 1562 nm, they all havevery close group velocities at this location in the spectrum.Consequently, once they have reached the PBG edge, theycannot collide anymore, which prevents the formation ofbrief spikes [34] and leads to an enhanced pulse-to-pulsestability at the SC edge. Secondly, since all solitons whoseSSFS has been cancelled near the PBG edge have veryclose characteristics, power fluctuations are reduced in thisspectral region as compared to the usual case in which onlya few solitons with slightly higher peak power are rare at thelong-wavelength edge [32, 33].
As a consequence, the reduction of pulse-to-pulse fluc-tuations at the long-wavelength edge as a function ofpropagation distance is intimately linked to the cancellationof the SFSS discussed in Section 3. It is thus in fact due to thespecific linear properties inherent to solid-core PBG fibersand, in particular, to the strong third-order dispersion nearthe PBG edge, as shown in Figure 3.
6. Conclusion
In conclusion, we showed that the SSFS and its dynamicscan be strongly and easily manipulated thanks to thespecific properties of the solid-core PBG fibers used in ourvarious experimental and numerical studies. Indeed, wedemonstrated that a quasicancellation of the SSFS couldbe obtained in this kind of fibers thanks to the largeincrease of β2 observed on the long-wavelength edge ofthe first PBG. We established, trough experimental andnumerical studies, that this phenomenon could be achievedwithout significant power loss. Thanks to these results, wedemonstrated and clearly interpreted that these fibers couldbe used to tailor efficiently the spectral extension of SC atno power cost. Moreover, we revealed and explained that thelong-wavelength edge of SC generated in this kind of fiberscan present strong quantitative and qualitative differences

10 International Journal of Optics
1600
1500
1400
1300
1200
1100
Delay (ps)
−100 0 100 200 300
Wav
elen
gth
(nm
)
(a)
1600
1500
1400
1300
1200
1100
Delay (ps)
−100 0 100 200 300
Wav
elen
gth
(nm
)
(b)
1600
1500
1400
1300
1200
1100
−100
Delay (ps)
0 100 200 300
Wav
elen
gth
(nm
)
(c)
1600
1500
1400
1300
1200
1100
Delay (ps)
−100 0 100 200 300
Wav
elen
gth
(nm
)
(d)
Figure 13: Simulated spectrograms representing the spectrotemporal dynamics of the SC generation for four propagation distances z of 1,2.5, 4, and 7 m, respectively, from (a) to (d).
in terms of temporal stability compared to SC generatedin more conventional fibres: the power fluctuations in thisspectral domain are indeed strongly reduced and have aGaussian-like statistical distribution and not the more usualL-shaped statistics associated with the presence of opticalrogue waves generally observed at the long-wavelength edgeof more conventional SC. We believe these results to behelpful for building SC sources for the next generation oftime-resolved coherent antistokes Raman scattering (CARS)microscopes for instance [42].
Acknowledgments
The authors acknowledge Remi Habert for experimentalassistance and Karen Delplace for assistance in fiber fab-rication. This work was partly supported by the French
Ministry of Higher Education and Research, the Nord-Pas deCalais Regional Council, and FEDER through the “Contratde Projets Etat Region (CPER) 2007-2013” and the “CampusIntelligence Ambiante” (CIA).
References[1] F. Luan, A. K. George, T. D. Hedley et al., “All-solid photonic
bandgap fiber,” Optics Letters, vol. 29, no. 20, pp. 2369–2371,2004.
[2] A. Argyros, T. A. Birks, S. G. Leon-Saval, C. M. B. Cordeiro,and P. S. J. Russell, “Guidance properties of low-contrastphotonic bandgap fibres,” Optics Express, vol. 13, no. 7, pp.2503–2511, 2005.
[3] V. Pureur, A. Betourne, G. Bouwmans et al., “Overview onsolid core photonic bandgap fibers,” Fiber and IntegratedOptics, vol. 28, no. 1, pp. 27–50, 2009.

International Journal of Optics 11
[4] G. Bouwmans, L. Bigot, Y. Quiquempois, F. Lopez, L. Provino,and M. Douay, “Fabrication and characterization of an all-solid 2D photonic bandgap fiber with a low-loss region (<20 dB/km) around 1550 nm,” Optics Express, vol. 13, pp. 8452–8459, 2005.
[5] A. Fuerbach, P. Steinvurzel, J. A. Bolger, A. Nulsen, and B.J. Eggleton, “Nonlinear propagation effects in antiresonanthigh-index inclusion photonic crystal fibers,” Optics Letters,vol. 30, no. 8, pp. 830–832, 2005.
[6] B. Kibler, T. Martynkien, M. Szpulak et al., “Nonlinear fem-tosecond pulse propagation in an all-solid photonic bandgapfiber,” Optics Express, vol. 17, no. 12, pp. 10393–10398, 2009.
[7] A. S. Cerqueira Jr., C. M. B. Cordeiro, F. Biancalana et al.,“Nonlinear interaction between two different photonic ban-dgaps of a hybrid photonic crystal fiber,” Optics Letters, vol.33, no. 18, pp. 2080–2082, 2008.
[8] P. D. Rasmussen, J. Laegsgaard, and O. Bang, “Degenerate fourwave mixing in solid core photonic bandgap fibers,” OpticsExpress, vol. 16, no. 6, pp. 4059–4068, 2008.
[9] A. Betourne, Y. Quiquempois, G. Bouwmans, and M. Douay,“Design of a photonic crystal fiber for phase-matched fre-quency doubling or tripling,” Optics Express, vol. 16, no. 18,pp. 14255–14262, 2008.
[10] V. Pureur and J. M. Dudley, “Nonlinear spectral broadeningof femtosecond pulses in solid-core photonic bandgap fibers,”Optics Letters, vol. 35, no. 16, pp. 2813–2815, 2010.
[11] O. Vanvincq, A. Kudlinski, A. Betourne, Y. Quiquempois,and G. Bouwmans, “Extreme deceleration of the soliton self-frequency shift by the third-order dispersion in solid-corephotonic bandgap fibers,” Journal of the Optical Society ofAmerica B, vol. 27, no. 11, pp. 2328–2335, 2010.
[12] A. Betourne, A. Kudlinski, G. Bouwmans, O. Vanvincq, A.Mussot, and Y. Quiquempois, “Control of supercontinuumgeneration and soliton self-frequency shift in solid-corephotonic bandgap fibers,” Optics Letters, vol. 34, no. 20, pp.3083–3085, 2009.
[13] O. Vanvincq, B. Barviau, A. Mussot, G. Bouwmans, Y.Quiquempois, and A. Kudlinski, “Significant reduction ofpower fluctuations at the long-wavelength edge of a super-continuum generated in solid-core photonic bandgap fibers,”Optics Express, vol. 18, no. 23, pp. 24352–24360, 2010.
[14] A. Betourne, G. Bouwmans, Y. Quiquempois, M. Perrin, andM. Douay, “Improvements of solid-core photonic bandgapfibers by means of interstitial air holes,” Optics Letters, vol. 32,no. 12, pp. 1719–1721, 2007.
[15] M. Perrin, Y. Quiquempois, G. Bouwmans, and M. Douay,“Coexistence of total internal reflexion and bandgap modes insolid core photonic bandgap fibre with intersticial air holes,”Optics Express, vol. 15, no. 21, pp. 13783–13795, 2007.
[16] M. Tateda, N. Shibata, and S. Seikai, “Interferometric methodfor chromatic dispersion measurement in a single-modeoptical fiber,” IEEE Journal of Quantum Electronics, vol. 17, no.3, pp. 404–407, 1981.
[17] G. P. Agrawal, Nonlinear Fiber Optics, Academic Press, NewYork, NY, USA, 4th edition, 2007.
[18] E. M. Dianov, A. Y. Karasik, P. V. Mamyshev et al.,“Stimulated-Raman conversion of multisoliton pulses inquartz optical fibers,” JETP Letters, vol. 41, pp. 294–297, 1985.
[19] Y. Kodama and A. Hasegawa, “Nonlinear pulse propagationin a monomode dielectric guide,” IEEE Journal of QuantumElectronics, vol. 23, no. 5, pp. 510–524, 1987.
[20] P. Beaud, W. Hodel, B. Zysset, and H. P. Weber, “Ultrashortpulse propagation, pulse breakup and fundamental soliton
formation in a single-mode optical fiber,” IEEE Journal ofQuantum Electronics, vol. 23, no. 11, pp. 1938–1946, 1987.
[21] F. M. Mitschke and L. F. Mollenauer, “Discovery of the solitonself-frequency shift,” Optics Letters, vol. 11, no. 10, pp. 659–661, 1986.
[22] J. P. Gordon, “Theory of the soliton self-frequency shift,”Optics Letters, vol. 11, no. 10, pp. 662–664, 1986.
[23] J. Laegsgaard, “Mode profile dispersion in the generalizednonlinear Schrodinger equation,” Optics Express, vol. 15, no.24, pp. 16110–16123, 2007.
[24] J. C. Travers, M. H. Frosz, and J. M. Dudley, “Nonlinear fibreoptics overview,” in Supercontinuum Generation in OpticalFibers, J. M. Dudley and J. R. Taylor, Eds., chapter 3,Cambridge University Press, Cambridge, UK, 2010.
[25] D. Hollenbeck and C. D. Cantrell, “Multiple-vibrational-modemodel for fiber-optic Raman gain spectrum and responsefunction,” Journal of the Optical Society of America B, vol. 19,no. 12, pp. 2886–2892, 2002.
[26] J. M. Dudley, G. Genty, and S. Coen, “Supercontinuumgeneration in photonic crystal fiber,” Reviews of ModernPhysics, vol. 78, no. 4, pp. 1135–1184, 2006.
[27] The long-pulse pumping regime refers to cases in whichthe pump pulse duration
�T is much longer than the MI
oscillation period�TMI, given by
�TMI = 2π
√|β2|/(2γP),
with β2 the second-order dispersion coefficient, γ the NLcoefficient and P the pump peak power. Cases in which
�T is
in the order or less than�TMI correspond to the short-pulse
pumping regime.[28] A. V. Gorbach and D. V. Skryabin, “Light trapping in gravity-
like potentials and expansion of supercontinuum spectra inphotonic-crystal fibres,” Nature Photonics, vol. 1, no. 11, pp.653–657, 2007.
[29] J. M. Stone and J. C. Knight, “Visibly “white” light generationin uniform photonic crystal fiber using a microchip laser,”Optics Express, vol. 16, no. 4, pp. 2670–2675, 2008.
[30] A. Kudlinski, G. Bouwmans, Y. Quiquempois, and A. Mussot,“Experimental demonstration of multiwatt continuous-wavesupercontinuum tailoring in photonic crystal fibers,” AppliedPhysics Letters, vol. 92, no. 14, Article ID 141103, 2008.
[31] A. Kudlinski, G. Bouwmans, M. Douay, M. Taki, and A.Mussot, “Dispersion-engineered photonic crystal fibers forCW-pumped supercontinuum sources,” Journal of LightwaveTechnology, vol. 27, no. 11, pp. 1556–1564, 2009.
[32] D. R. Solli, C. Ropers, P. Koonath, and B. Jalali, “Optical roguewaves,” Nature, vol. 450, no. 7172, pp. 1054–1057, 2007.
[33] J. M. Dudley, G. Genty, and B. J. Eggleton, “Harnessing andcontrol of optical rogue waves in supercontinuum generation,”Optics Express, vol. 16, no. 6, pp. 3644–3651, 2008.
[34] A. Mussot, A. Kudlinski, M. Kolobov, E. Louvergneaux, M.Douay, and M. Taki, “Observation of extreme temporal eventsin CW-pumped supercontinuum,” Optics Express, vol. 17, no.19, pp. 17010–17015, 2009.
[35] G. Genty, C. M. de Sterke, O. Bang, F. Dias, N. Akhmediev,and J. M. Dudley, “Collisions and turbulence in optical roguewave formation,” Physics Letters, Section A, vol. 374, no. 7, pp.989–996, 2010.
[36] F. Vanholsbeeck, S. Martin-Lopez, M. Gonzalez-Herraez, andS. Coen, “The role of pump incoherence in continuous-wavesupercontinuum generation,” Optics Express, vol. 13, no. 17,pp. 6615–6625, 2005.
[37] C. Lafargue, J. Bolger, G. Genty, F. Dias, J. M. Dudley, andB. J. Eggleton, “Direct detection of optical rogue wave energy
12 International Journal of Optics
statistics in supercontinuum generation,” Electronics Letters,vol. 45, no. 4, pp. 217–219, 2009.
[38] H. Kubota, K. R. Tamura, and M. Nakazawa, “Analysesof coherence-maintained ultrashort optical pulse trains andsupercontinuum generation in the presence of soliton-amplified spontaneous-emission interaction,” Journal of theOptical Society of America B, vol. 16, no. 12, pp. 2223–2232,1999.
[39] M. Erkintalo, G. Genty, and J. M. Dudley, “On the statisticalinterpretation of optical rogue waves,” European PhysicalJournal, vol. 185, no. 1, pp. 135–144, 2010.
[40] K. Hammani, B. Kibler, C. Finot, and A. Picozzi, “Emergenceof rogue waves from optical turbulence,” Physics Letters,Section A, vol. 374, no. 34, pp. 3585–3589, 2010.
[41] M. Taki, A. Mussot, A. Kudlinski, E. Louvergneaux, M.Kolobov, and M. Douay, “Third-order dispersion for generat-ing optical rogue solitons,” Physics Letters, Section A, vol. 374,no. 4, pp. 691–695, 2010.
[42] D. A. Sidorov-Biryukov, E. E. Serebryannikov, and A. M.Zheltikov, “Time-resolved coherent anti-Stokes Raman scat-tering with a femtosecond soliton output of a photonic-crystalfiber,” Optics Letters, vol. 31, no. 15, pp. 2323–2325, 2006.