˘ˇ ˆ ˙ ˝ ˙ ˇ ˙ ˛ˇ -...
TRANSCRIPT

������������� � ������������������������ ��������������������� � ���������������� ���� ������!�������"��� ������������������� ��������������������������������������������������������������������
7KHILQGLQJV� YLHZV� DQG LQWHUSUHWDWLRQV LQ WKLV UHSRUW DUH WKRVH RI WKH DXWKRUVDQG VKRXWOG QRW EH DWWULEXWHG WR DQ\ DRI WKH DJHQFLHV SURYLGLQJ ILQDQFLDO VXSSRUWWR WKH 60(58 5HVHDUFK ,QVWLWXWH DFWLYLWLHV DQG UHSRUWV�)RU IXUWKHU LQIRUPDWLRQ� SOHDVH FRQWDFW 60(58� 3KRQH� ���������������)DNV� ��������������� ZHE� ZZZ�VPHUX�RU�LG� H�PDLO� VPHUX#VPHUX�RU�LG�
�����������������
��"������ �
�������������
�������
������ ������� ����
#� ����
�������$%����
�� �&���'����
������(��%��
���)� ��� ��������&��
������&���
(�%�������%���
��" ���������
���������*++,�
������������ �
The SMERU Research Institute, September 2003
���
������������
������������ ������������
��
���������� ����� ������
������������������������
�� ��������������������������������������
���� ���������!� �����������������
��������������
���� ������������ �����!�" ���#�$��� ����������
!� ������������
�
This study is a revised version of a draft report based upon field work conducted in October and
November 1999. The original study was carried out by the Social Monitoring and Early Response Unit
established by The World Bank with support from AusAID, ASEM, and USAID. The draft report was
never published for technical reasons. However, the SMERU Research Institute believes that there are
sufficient valuable insights into the operation of the Scholarship and Block G rants Social Safety Net
Program and the wider problems of Indonesia�s education system to justify publishing this revised
version of the report.
The SMERU Research Institute, September 2003
����
� ������
������������Indonesia made extraordinary progress in developing a national education system during the
period prior to the economic crisis in mid 1997. This progress was seen in the sharp rise in
literacy levels, the average level of education, and enrollment rates (Jones, 1994). The higher
level of education of those entering the workforce has increased the level of productivity.
The World Bank�s most recent World Development Report states that the net primary
school enrollment figures for Indonesia have reached 97%. However, while the vast majority
of children enroll in school, the proportion of those actually completing primary school
education was not more than 80%.
One important development in education in Indonesia was the introduction of the National
Compulsory Education Program (Wajar Dikdas) in 1994, which makes 9 years of education
compulsory for all students. It is hoped that this target can be reached by the year 2004.
Since the introduction of this program, the enrollment rates for junior secondary school have
increased. The figures indicate that participation rates actually fell from 62% in 1988 to 58%
in 1994, but then rose considerably to 63% in 1995 and subsequently to 72% in 1997. At the
time of the economic crisis, there was considerable concern that the situation would
increase school dropout rates substantially, and hence reverse many of the achievements
already attained through previous programs. Consequently, the Indonesian Government
introduced the social safety net (SSN) scholarship and block grants programs. These
programs targeted students from poor families and operational support for their schools.
The scholarship program aimed to cover 6% of primary school children (SD/MI), 17% of
junior high school students (SLTP/MT), and 10% of senior high school students
(SMU/MA). The block grants provided to schools (Dana Bantuan Operasional - DBO) were
to be allocated to 60% of schools at all levels. The scholarships for each student were
Rp.120 000 per year for primary school students (grade 4, 5, and 6), Rp.240 000 per year for
junior high school students, and Rp.300 000 per year for senior high school students. These
scholarships are given to the student until they graduate from that level of schooling, fail
to move up to the next class, or drop out of school. The size of the block grants for primary,
junior high, and senior high schools are Rp.2 000 000, Rp.4 000 000, and Rp.10 000 000
per year respectively. The SSN scholarship and block grant programs will run for five years.
������������
This study aims to:
(i) Gain an overall understanding of the status of the education system prior to the crisis;
(ii) Identify those factors that caused students to remain at school, drop out, or discontinue
their studies after the onset of the crisis;
(iii) Examine the impact of the crisis on the quality of education and how it may have
facilitated further problems;
(iv) Assess the effectiveness of the SSN Scholarships and Block Grants Program, especially
regarding the suitability of the targets, the amount and forms of assistance, the benefits
and drawbacks, and the suitability of the mechanisms adopted to implement the
programs.
The SMERU Research Institute, September 2003
���
Research Area
In-depth assessments were conducted in four kabupaten located in four different provinces
over a period of three weeks during October and November 1999. First, Kabupaten
Pontianak (West Kalimantan) was chosen because the Kecamatan Survey results indicated
West Kalimantan was the region whose education sector was most greatly affected by the
crisis, both in urban and rural areas. Second, Kabupaten Tangerang in West Java
represented industrial areas which, as a result of the crisis, have seen mass retrenchments.
Third, Kabupaten Sleman in Yogyakarta represented one of the 25 kabupaten in Indonesia
involved in a trial regional autonomy project for the education sector. Last, Kabupaten
Lombok Timur (West Nusa Tenggara) was both the area with the highest poverty index in
West Nusa Tenggara and represented eastern Indonesia. The locations were selected based
on information obtained from the Kecamatan Survey Report about the impact of the crisis
and the poverty index, which was initially used to determine the allocation of scholarships
and Block Grants.
Two kecamatan were chosen from each kabupaten in the study, one from an urban area and
the other from a rural or remote area. Following this, two desa (villages) were selected in each
kecamatan. In addition, three primary schools (SD/MI), and three junior secondary schools
(SLTP/MTs) were selected, representing both public and private schools, as well as Madrasah
(Islamic-based schools). These schools were chosen regardless of whether or not they had
received SSN Scholarships or Block Grants program assistance.
Methodology
(i) At each administrative level and research area, in-depth interviews were conducted
with respondents who included;
(ii) Primary and junior high school students, both those receiving and those not receiving
scholarships;
(iii) Parents of school students;
(iv) Committee members at the provincial, kecamatan, and school level;
(v) School teachers not on the committee;
(vi) Members of the Board of Education Assistance (BP3);
(vii) Individuals from the Central Independent Monitoring Unit/Provincial Independent
Monitoring Unit and Non-Government Organizations;
(viii) Key informants and community leaders; and
(ix) Government officials linked with the programs, particularly those from Bappeda
(Regional Development Planning Board), the Regional/District Education Office, the
Ministry of Religion, BKKBN (National Family Planning Board), and the Post Office.
In addition, before and during field research, information was also obtained from
secondary data such as statistical data, reports, research findings, and standard
operating procedure manuals. Field research was conducted simultaneously by teams of
two researchers in the four study areas over a period of three weeks during October and
November 1999.
The SMERU Research Institute, September 2003
��
Conclusions
Education Conditions Prior to the Crisis. The conditions of the education system prior to
the crisis is reflected in the following:
(i) Completion rates in primary schools were still relatively low, around 80% (World
Bank, 1997: 68). In Kabupaten Tangerang and Kabupaten Pontianak, the proportion
of children who entered primary school in 1993/94 and reached Grade 6 was only
around 50%, in Kabupaten East Lombok, 65%, whereas in Kabupaten Sleman, the rate
was 89%;
(ii) School buildings and education facilities for government primary schools were
generally inadequate. On one hand, the INPRES Program (President Instruction
Scheme) resulted in the construction of more school buildings and consequently
higher school participation. On the other hand, dependency on government financial
support has increased and, except in a number of popular schools in urban areas which
are still able to collect adequate funding from parents, the self-sufficiency of the
schools and the participation of the community in education have consequently begun
to disappear;
(iii) In urban areas, the number of teachers is sufficient and in some areas even excessive,
yet in rural and isolated areas, where most of the students come from poor families,
there are now significant teacher shortages, and the level of the teacher education is
relatively low;
(iv) The school curriculum at present has too many subjects, particularly those drawing on
local content, while the learning of basic skills such as reading, writing, arithmetic,
and the teaching of manners and discipline are still deficient;
(v) Allocation of the government textbooks is insufficient, especially those for Madrasah
and rural primary schools. The students are usually not allowed to take the books
home, leaving them with less opportunities to study;
(vi) Apart from in urban areas, on average there is only one junior secondary school in
each kecamatan, and transportation to school has been a constant problem;
(vii) Operational expenses for the urban schools are covered by BP3 funding, while the rural
schools rely more on government support, such as the routine expense budgets, BOP
and SBPP. Private and madrasah schools rely more on tuition fees, BP3 contributions
and other contributions; and
(viii) An accurate data system is not available, and the data available are not used to
monitor school�s development, or for national education system planning.
Factors Resulting in Students Continuing at School, Dropping Out, or Failing to Progress
to the Next Grade during the Crisis. Some important factors influencing students to remain
studying at school, include:
(i) The existing institutional mechanisms which support the students to continue their
studies;
(ii) The level of economic prosperity in the family (income levels, time spent with the
parents and family members to meet the family�s need);
The SMERU Research Institute, September 2003
���
(iii) Geographical aspects;
(iv) The available education facilities and infrastructure;
(v) The labor market, including the available employment opportunities for school-age
children (for example: in an industrial area in Kabupaten Tangerang and a fishing
village in Kabupaten Pontianak), or employment opportunities requiring higher
education; and
(vi) The socio-economic condition of the community, and its traditional values such as
marriage at an early age (Madurese), elopement or divorce which results in children
becoming neglected and leaving school (Lombok), and children being married off at an
early age by their parents (Sleman). Such cultural influences were actually not often seen
in Sleman where community awareness of the importance of education is already high.
Crisis Impact on Education. The impact of the economic crisis on the quality of education
includes:
(i) Slightly lower than average NEM scores;
(ii) Drastic increases in school fees is a disincentive for parents with no increase in income;
(iii) Reduction in teachers� real income, due to less BP3 revenue and reduced income sources
among teachers in urban areas;
(iv) Less extra-curricular activities such as pramuka (scouts), sport, extra lessons, and
computer classes; and
(v) Reduced health and nutrition levels among students, lowering their capacity to absorb
the lessons;
These effects have also been felt by private schools and teachers as well asMadrasah schools, both
heavily dependent on funding from the Educational Management Contribution (SPP) and BP3.
To make matters worse, in Kabupaten Tangerang a Bupati Decree stipulated that every month all
primary schools in that region should submit 20% of the its BP3 funding (the amount charged to
students) to the Office of the Department of National Education to cover operational costs. Since
many students could not afford to pay their monthly BP3 contributions, the schools increasingly
had to bear this cost.
To cope with the crisis, many schools have adopted the following policies:
(i) New students are allowed to pay the school maintenance contribution in several
installments, while the poor students are exempt from paying this contribution;
(ii) There is more leeway in the payment of the BP3 contributions, while the poor students
are exempt;
(iii) Registration fees continue to be imposed on all students;
(iv) Some curricular activities have been suspended to reduce costs;
(v) Quarterly fees, expenses for school reports, Ebtanas, and the fee for graduation
certificates (ijazah) are still imposed, although these fees can be paid in installments,
without exemption for poor students; and

The SMERU Research Institute, September 2003
����
(vi) Various fund-raising activities for orphans and poor students.
Crisis Impact on Students and Parents. The crisis has put considerable burden on parents,
causing:
(i) Delayed payment of BP3 contributions;
(ii) Inability to purchase textbooks, resulting in students relying more on limited school
package text books;
(iii) Inability to buy school uniforms;
(iv) Less money to cover transport costs, especially for junior high school students who
live far from school; and
(v) Many students being unable to collect their graduation certificates due to the
inability to pay the EBTANAS fees.
The impact of the crisis has fallen more heavily on the students whose parents are industrial
workers or laborers. The students whose parents are plantation workers or fishermen have
fared better due to the increased price of export commodities. The crisis has affected the
family's income and the time parents can allocate for their children�s education; in the long
run this will also have a negative impact on the quality of the children's education.
Effectiveness of Scholarship and Block Grant Programs. Some of the important issues in
the implementation of SSN Scholarships and Block Grants Program are the targeted
recipients, sufficient level of funding, the use and disbursement of funding, and the
effectiveness of the Committees in program monitoring and supervision. The
implementation of the program in the field varies across the different regions. Several
findings include:
1. Targeting: (i) the criteria for selecting scholarship and block grant recipients would be
better suited to a poverty alleviation program rather than to a program intended to
address the impact of the crisis; (ii) the School Committees encountered problems
deciding upon the most eligible recipients because the number of potential beneficiaries
was far greater than the total number of allocated scholarships and block grants (except
in Kabupaten Pontianak); (iii) the allocated scholarships for primary school students
have been far from sufficient, but some scholarships have been given to non-
potential/non-achieving students who after receiving scholarships have to repeat their
grade and even became dropouts; (iv) there are cases (in Kabupaten Tangerang or
Kabupaten Sleman) where (contrary to the rules) scholarships have been provided to
ensure equal opportunity among those in need of assistance; (v) the introduction of the
IDT village criteria has resulted in an unbalanced quota of scholarships and block grants
between the IDT and non-IDT areas (especially among junior high schools); (vi) the
BKKBN's criteria for categorizing poor families is not applicable in all cases; (vii) the
cost for Grade 1 and Grade 3 junior high school students is usually higher than the cost
for Grade 2; also the expenses of Grade 1 and Grade 6 are higher than the other grades;
(viii) the allocated scholarships for primary schools are too few, and the dropout rate
seemed to increase among students above Grade 4. This means that many students were
not able to continue studying at the junior high school level, because they dropped out
even before finishing primary school; (ix) the provision that scholarships are not
transferable except among students of the same grade has resulted in an imbalance
among inter-grade recipients, particularly when the number of the allocated
scholarships was reduced; and (x) the aim of ensuring a good presentation of girls among

The SMERU Research Institute, September 2003
�����
scholarship recipients seems to have been achieved because the nomination process has
been carried out according to the Program Guidelines.
2. Orientation and transparency of the program: Sufficient information about the program has
been made available to program recipients in nearly all observed areas, although the general
public has not been well informed. Meanwhile, the transparency of the use of block grant
funds has been far from adequate, and in many instances even the members of the School
Committees and teachers have been neither consulted or received proper explanations about
the use of these funds.
3. Disbursement of funds: (i) The funding disbursement process was initially considered
complicated due to tight administrative requirements. In addition, there were indications
of deducted funds in some areas; (ii) methods used to disburse the program funds include:
(a) direct collection by the students accompanied by the school principal and one
Committee member; (b) collection by the school principal; or (c) delivery to schools by a
Post Office official (in Kabupaten Pontianak); (iii) in some remote areas (in Kabupaten
Pontianak), collection of the funds in three separate payments was considered
burdensome because of high transport costs involved, it was far more preferable to reduce
the number of disbursements to two payments at the most; (iv) payments via bank
accounts have been unsuccessful because of the limited number of saving books, and since
the money stays in the bank for a very short period this method is considered unprofitable;
(v) in some regions the scholarship funds have been managed by the schools, but the
students are able to ask for funds as required. Although it is claimed that this
arrangement is to ensure that the funds are well managed, steps must be taken to ensure
that students are not discouraged from collecting their scholarship money, otherwise it
may create opportunities for misappropriation.
4. Use of funds: The scholarship money received by students was generally used to buy
books, stationery, some textbooks, school uniforms, and sports wear. In some cases
parents have also used the money to buy food, to pay a midwife, or to meet other urgent
family needs. In one MT in Kabupaten Pontianak, the scholarships were not delivered
directly to the recipients, instead the funds were managed by the school to help finance
all students, most of whom are in need of financial assistance, for example to pay BP3
contributions, summative test fees, and examination fees. In Kabupaten Tangerang, the
funds were used to pay the unpaid BP3 contributions and the contributions of other
poor non-recipient students.
5. Number of scholarships allocated, the size of the scholarships and block grants.
Although the allocated number of scholarship recipients per school � especially in
primary schools � has been considered inadequate, the students have received a sufficient
amount of money, enabling them to continue their schooling. However, the adequacy of
the amount of the scholarship per student varied among different grades. For example,
Grade 6 primary school students and Grade 1 and 3 junior secondary school students need
more funding because they have to pay enrollment fees, building maintenance
contributions, examination fees, certificate fees, and farewell party contributions.
The size of block grants has been to be too small for most primary schools, and too large
for senior high schools, especially those with no laboratories and science classes. In most
cases, the use of the block grants has not been very effective, apart from in some
disadvantaged private schools, public primary schools, and madrasah. The grant has been
used more effectively in schools located in remote areas. The Team found that the SSN
Block Grants Program to some extent overlaps with the Education Operational Support
(BOP) and national budget (APBN) for education, increasing the risk of misappropriation
of the funds.

The SMERU Research Institute, September 2003
���
6. Role of Local Committees. The coordination, management and administration of the
program have been very weak at the kecamatan and lower government levels. School
Committees have invariably been dominated by the school principals, who have made
the decisions regarding the use of the block grants. Unfortunately, community
participation in the program has been low because the Board of Parents is often
considered to represent community. Basically the Kecamatan Committees have tended
to be dominated by officials from the Department of National Education Office,
whereas the Head of the Kecamatan has only forwarded the applications to the local
government, and the other committees have had a minimal role in the process. In terms
of program administration, the Post Offices and the Department of National Education
at the kabupaten level have been able to carry out their responsibilities reasonably well.
Based on the above findings, the following suggestions have been made:
(i) Allocation of Scholarships and Block Grant Recipients. To achieve more
appropriate targeting, more scholarships should be made available for Grade 1, 5 and 6
primary school students, and the amount of scholarships for Grade 1 and 6 students
should be larger than the scholarships for Grade 5 students. Likewise, the scholarship
funds for Grade 1 and Grade 3 junior secondary school students should be larger than
those for Grade 2 students. The amount of primary school scholarships should be
increased, if necessary by redirecting the funds away from junior and senior high
schools students, or from the block grants for junior and senior high schools.
(ii) Criteria for the Selection of Scholarship and Block Grant Recipients. The criteria
for selecting the scholarship and block grant recipients should be improved to achieve
more appropriate targeting by :
• Removing the IDT village criteria for scholarship and block grant recipients;
• Adding school performance criteria for block grant recipients, and student�s
potential or achievement criteria for the scholarship program recipients (for those
who meet the other criteria);
• If the allocation is too small, it is necessary to decide upon �final� criteria, which
should be indisputable for the community, while at the same time it should make
the work of the School Committees easier, for example by using the NEM score;
• Among communities with low education awareness, the parents should be
required to sign a written pledge that they will allow their children to finish that
level of schooling when they receive scholarships;
• Replace the school scholarship quota/allocation system with a bottom-up
selection system; and
• The quota/allocation system should only be applied to determine the number of
scholarships at kabupaten or provincial levels.
(iii) Appropriateness of the SSN Block Grants Program. Considering that most of the
scholarship funds will be received by the schools in the form of students' BP3
contributions, and that the schools have received operational funds from several
sources (including from the routine budget, Education Operational Support (BOP),
SBPP, etc), it is recommended that to avoid overlapped funding sources, the block
grants be used to increase the amount of scholarships, and some of this funding be used
The SMERU Research Institute, September 2003
��
as an incentive for the School and Kecamatan Committees. The block grant should
only be awarded to private schools and madrasah, which have suffered drastic decreases
in revenue due to the crisis, or the money should be allocated for public primary
schools, particularly those in rural and remote areas. If the Block Grant program is to
be continued, the size of the grant should not be the same for all schools, rather it
should be adjusted based on the number of students and conditions of the school.
However, adjusting the size of the Block Grant, based on the characteristics of the
schools will have two disadvantages: it makes the process more complicated, and it
may increase the chance of misappropriation. Despite these disadvantages, it was
important to readjust the Block Grants in line with the conditions of the schools.
The size of the block grants for high schools should be reconsidered, taking into
account whether they have laboratories and science classes, otherwise the size of the
block grant should be reduced. Based on the SMERU Team's observations, the size of
the block grants for public high schools is too large.
(iv) Program transparency. The important role of School Committees in the
implementation of the scholarships and block grant programs needs to be stressed. The
habit of leaving decision-making and the control of funds to the school principal needs
to be changed. Kabupaten education officials should use every available opportunity to
stress the need for school principals to hold open discussions with the members of the
School Committee about implementation plans for the block grant programs.
(v) Textbooks. For primary and junior secondary schools, the government textbooks and
textbooks from private publishers should not be replaced or changed too often. The
books should be assigned for at least 5 years, so that they can still be used by the
students� younger siblings or by other students. Sufficient number of textbooks should
be available according to the number of students, giving special attention to private
schools and madrasah.
(vi) School Funds. In the future, it is recommended that school funds should not only
be provided by the government, but also increasingly by the community. In the
transitional period, various ways of fundraising are still applicable, including: (i)
cross-subsidies using school fees or BP3 contributions; (ii) promoting community
fundraising by enhancing the community�s participation in school activities, for
example through zakat (tithe), infaq (contributions), shodakoh (alms), and
scholarships; and (iii) other methods of self-sufficient funding. These activities
should be carried out in phases, while taking into account the socio-economic
conditions of the community. The funds raised should not to be allocated for the
operational expenses of government offices (the Department of National Education
Office at the kabupaten and kecamatan levels).
(vii) Equitable Distribution and Access to Education. To ensure that the education system
provides equitable distribution and equal access and results, the existing dualism or
conflicts of interest in the management of education in Indonesia between the
Department of National Education and the Department of Religious Affairs, or
between the Department of National Education at the kabupaten and kecamatan levels,
should be improved in the near future. The management system should be simplified so
it falls under the responsibility of the Department of National Education. At the
kabupaten level, the management of the education system should be in the hands of the
kabupaten office. Such an arrangement will soon be unavoidable when the Law No.
22/1999 regarding regional autonomy becomes effective.

The SMERU Research Institute, September 2003
���
(viii) Data. A more accurate data system is greatly needed. The level of awareness regarding
the importance of useful data amongst the relevant education authorities should also
be improved. Data should be used for monitoring the school development and the
development planning of education at both national and regional levels.
�
The SMERU Research Institute, September 2003
����
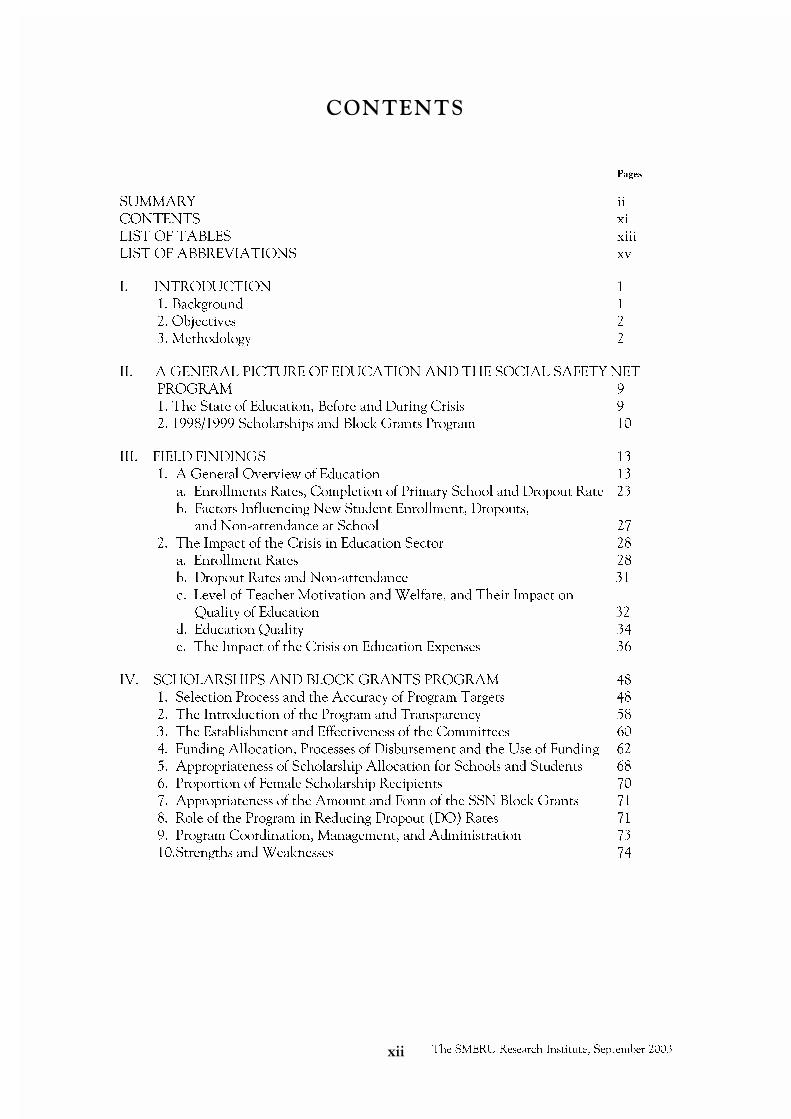
��� ���
Pages
SUMMARY ii
CONTENTS xi
LIST OF TABLES xiii
LIST OF ABBREVIATIONS xv
I. INTRODUCTION 1
1. Background 1
2. Objectives 2
3. Methodology 2
II. A GENERAL PICTURE OF EDUCATION AND THE SOCIAL SAFETY NET
PROGRAM 9
1. The State of Education, Before and During Crisis 9
2. 1998/1999 Scholarships and Block Grants Program 10
III. FIELD FINDINGS 13
1. A General Overview of Education 13
a. Enrollments Rates, Completion of Primary School and Dropout Rate 23
b. Factors Influencing New Student Enrollment, Dropouts,
and Non-attendance at School 27
2. The Impact of the Crisis in Education Sector 28
a. Enrollment Rates 28
b. Dropout Rates and Non-attendance 31
c. Level of Teacher Motivation and Welfare, and Their Impact on
Quality of Education 32
d. Education Quality 34
e. The Impact of the Crisis on Education Expenses 36
IV. SCHOLARSHIPS AND BLOCK GRANTS PROGRAM 48
1. Selection Process and the Accuracy of Program Targets 48
2. The Introduction of the Program and Transparency 58
3. The Establishment and Effectiveness of the Committees 60
4. Funding Allocation, Processes of Disbursement and the Use of Funding 62
5. Appropriateness of Scholarship Allocation for Schools and Students 68
6. Proportion of Female Scholarship Recipients 70
7. Appropriateness of the Amount and Form of the SSN Block Grants 71
8. Role of the Program in Reducing Dropout (DO) Rates 71
9. Program Coordination, Management, and Administration 73
10.Strengths and Weaknesses 74

The SMERU Research Institute, September 2003
�����
V. EFFORTSTO IMPROVETHE EDUCATIONSYSTEM INTHE FUTURE
(EQUITABLEOPPORTUNITIES,ACCESSANDRESULTS) 75
1. Data 75
2. Funding 75
3. Institutional and Education Systems 76
4. Quality of the Teachers 76
5. Curriculum and Provision of Textbooks 77
6. Supporting Facilities 77
7. Other Issues 77
VI. CONCLUSIONS AND RECOMMENDATIONS 78
1. Conclusions 78
2. Policy Recommendations 82

The SMERU Research Institute, September 2003
����
!"���#���! ��
Pages
%&� Administrative Area, Sources of Information and Research Methods 3
1a. Observation Area 4
'&� Scholarships and the Block Grants Program, 1998/1999 11
(&� Scholarship Allocation for 1998/1999: Four Kabupaten Visited during
SMERU�S Investigations (In Million Rupiah) 12
)&� Block Grants Allocations for 1998/1999 and 1999/2000
in the Four Kabupaten visited by SMERU (In Million Rupiah) 12
*&� The Number of Schools, Students and Teachers in the Schools Visited
by the SMERU Team 1998/1999 14
5a. Student/School, Student/Teacher, and Teacher/School Ratio 15
+&� Schools in Pontianak Visited by SMERU 16
,&� Schools in Tangerang Visited by SMERU 18
-&� Education in East Lombok 19
.&� Schools in East Lombok Visited by SMERU 20
%/&� Gross Primary School Enrollment Rate (APK) and Net Primary School
Enrollment Rate (APM) in Kabupaten Sleman 1994/1995 � 1998/1999 24
%%&� The Proportional Cohort of Students Entering Primary School Reaching
Grade 6 in a Survey Sample of Primary Schools 1991/1992 � 1995/1996 25
%'&� Continuation Rates of Primary School Students Before andAfter the Crisis (%) 26
%(&� Development of Net Enrollment Rates and Gross Enrollment Rates for
the Nine Years Basic Compulsory Education Program in East Lombok (%) 30
%)&� Number of Enrollment Students, Student Fallings and Dropouts in
One Junior Secondary School in Tangerang 31
%*&� Dropout Rates in Sleman 31
%+&� NEM Scores at the Kecamatan and Kabupaten Level 1995/1996 � 1998/1999 35
%,&� Primary and Secondary School NEM Scores, KecamatanMasbagik and
Pringgabaya, East Lombok, 1996/1997 � 1998/1999 36
%-&� EstimatedAnnual Expenses of Primary and Junior High Schools in East Lombok 38
%-�&�Estimated Annual Expenses of Primary and Junior High Schools in Tangerang 40

The SMERU Research Institute, September 2003
���
%.&� School Budget (RAPBS) for one Primary Schools in Tangerang 41
19a. School Budget (RAPBS) and Planned Expenditure of Block Grant (DBO)
Funds in 1999/2000, An Example of One State Junior Secondary School
(SLTP) in Tangerang 42
19b. School Budget (RAPBS) and Planned Expenditure of Block Grants (DBO)
Funds for 1999/2000, An Example of One State Junior Secondary School
(SLTP) in Pontianak 43
20. Average Monthly BP3 Contribution 44
21. School Levies in East Lombok 46
22. Total Number of Scholarship Recipients, Students and Proposed
Beneficiaries in Primary Schools/Madrasah Ibtidaiyah Schools 1998/1999
Visited by SMERU Team 50
23. Total Number of Scholarship Recipients, Students and Proposed Beneficiaries
in Primary Schools/Madrasah Tsanawiyah Schools 1998/1999 Visited
by SMERU Team 51
24. Total Allocation of SSN Scholarship and Block Grants to Students and
Schools per Kabupaten and Kecamatan, 1998/1999 and 1999/2000 63
25. Annual Components and Range of Expenditure of Scholarship Funds
KecamatanMasbagik and Pringgabaya, East Lombok 70

The SMERU Research Institute, September 2003
����
!"���#����� $"�"����
ADB Asian Development Bank
APK Angka Partisipasi Kasar
APM Angka Partisipasi Murni
BP3 Badan Pembantu Penyelenggara Pendidikan
Cawu Catur Wulan
CIMU Central Independent Monitoring Unit
DBO Dana Bantuan Operasional
Depag Departemen Agama
DikBud Pendidikan dan Kebudayaan
DIK Daftar Isian Kegiatan
DO Drop-Out (putus sekolah)
Ebta Evaluasi Belajar tahap Akhir
Ebtanas Evaluasi Belajar Tahap Akhir Nasional
FGD Focus Group Discussion
GOI Government of Indonesia
IDT Inpres Desa Tertinggal
Inpres Instruksi Presiden
Jabar Jawa Barat
JPS Jaring Pengaman Sosial
Juklak Petunjuk Pelaksanaan
Kandep Kantor Departemen
Kanin Kantor Inspeksi
Kanwil Kantor Wilayah
KK Kepala Keluarga
KUA Kantor Urusan Agama
LSM Lembaga Swadaya Masyarakat
NEM Nilai Ebtanas Murni
MA Madrasah Aliyah (setingkat SMU)
MI Madrasah Ibtidaiyah (setingkat SD)
MTs Madrasah Tsanawiyah (setingkat SLTP)
PAD Pendapatan Asli Daerah
P dan K Pendidikan dan Kebudayaan
PHK Pemutusan Hubungan Kerja
PIMU Provincial Independent Monitoring Unit
PLKB Petugas Lapangan Keluarga Berencana
RAPBS Rencana Anggaran Pendapatan dan Belanja Sekolah
SD Sekolah Dasar
SDLB Sekolah Dasar Luar Biasa
SLTP Sekolah Lanjutan Tingkat Pertama
SLTA Sekolah Lanjutan Tingkat Atas
SLTPLB Sekolah Lanjutan Tingkat Pertama Luar Biasa
SMERU Social Monitoring and Early Response Unit
SMU Sekolah Menengah Umum
SMLB Sekolah Menengah Luar Biasa
UU Undang-undang
Wajar DikDas Wajib Belajar Pendidikan Dasar
WB World Bank
Pontianak Kabupaten Pontianak
Tangerang Kabupaten Tangerang
Sleman Kabupaten Sleman
Lombok Timur Kabupaten Lombok Timur

The SMERU Research Institute, September 2003��
��� �����������
���� ����������Indonesia had made extraordinary progress in developing a national education system during
the period prior to the economic crisis in mid 1997. Many have claimed that by the late
1980s, a level of primary school education had been universally achieved in Indonesia, and
that since then this high level of participation has been sustained. The World Bank�s latest
World Development Report (based on data provided by the Indonesian Government to
UNESCO) states that the net primary school enrollment figures for Indonesia have reached
97%. A more careful assessment has revealed that enrollments fell considerably short of
�universal�. While the vast majority of children have enrolled, the proportion of those
actually completing primary school education was not more than 80%.
Increasing the enrollment numbers in the school system is only one quantitative aspect of
education, and Indonesia has generally been successful achieving this objective. Yet, it
should also be noted that the task of increasing net primary school enrollments (APM)1
has
been possible because of the declining number of children that fall within each of the
relevant age-groups. This is a direct result of the falling fertility rate which began in the early
1970s. The quality of education is a different matter, where there tends to be a lack of quality
indicators for education. This is apart from the valuable NEM2
scores for each level of
education, which provide comparative information about the educational performance of
different regions, districts, and individual schools. There has been very little analysis of the
dimensions of educational quality such as the quality of school buildings, the educational
background of teachers (including their formal qualifications as well as teaching experience)
as well as any other matters directly related to the quality of education.
One important development in education in Indonesia has been the introduction of
National Compulsory Education Program (Wajar Dikdas) in 1994, which makes 9 years of
education compulsory for all students. While this target has not been immediately achievable
due to insufficient resources such as school buildings and teachers, it is hoped that it will be
successfully implemented by the year 2004. Since the introduction of this program, the
enrollment percentages for junior secondary school have increased. The figures indicate that
participation rates actually fell from 62% in 1988 to 58% in 1994, then rose considerably to
63% in 1995 and subsequently to 72% in 1997. However, the increase in enrollment figures
has progressed slowly indicates that even despite the recent economic crisis, achieving the 9
Years Compulsary Education program aims it was never going to be easy.
At the time of the economic crisis, there was considerable concern that the situation
would generate substantial school dropout rates, and hence reverse many of the
achievements already attained through previous programs. Consequently, the Indonesian
Government, the World Bank, and the Asian Development Bank funded several aid
programs in order to alleviate these concerns and help reduce any potential negative
impact of the crisis. This funding targeted the provision of both scholarships for students
from poor families, and operational support for schools in poorer communities. These
objectives were instituted under the framework of the Social Safety Net Program (Jaring
1
Angka Partisipasi Murni (APM), the net school enrollment rate which calculates the sum of students
of the standard age enrolled at each school level as a proportion of the population of standard age at
each school level. For example,
APM (SD) = Sum of Primary School Students (aged 7-12 years)
Sum of Population of Citizens (aged 7-12 years)
2
NEM (Nilai EBTANAS Murni), the Raw Exam Results � National Evaluation of Final Year Studies.

The SMERU Research Institute, September 2003��
Pengaman Sosial - JPS). The scholarship program aimed to cover 6% of primary school
children (SD), 17% of junior secondary school students (SLTP), and 10% of senior
secondary school students (SMUA), while the Block Grants provided to schools (Dana
Bantuan Operasional - DBO) were to be allocated to 60% of schools at all levels. Further
details are presented in Table 2 (See Chapter II).
A number of studies have been already conducted that monitor the implementation of the
Scholarships and Block Grants Program, as well as assessing the impact of the program. The
Crisis Impact team at SMERU conducted a rapid assessment of the program which was
intended to complement and extend earlier studies. SMERU�s research was based on
intensive field studies in eight kecamatan (two kecamatan in each of four kabupaten). These
kecamatan were selected to give a broad picture of both the conditions in the education
sector in Indonesia, before and after the crisis, and of the effectiveness of the SSN
Scholarships and Block Grants Program.
���������������
(i) To gain an overall understanding of status of the education system prior to the crisis;
(ii) To identify those factors that caused students to remain at school, drop out, or
discontinue their studies after the onset of the crisis;
(iii) To examine the impact of the crisis on the quality of education and how it may have
facilitated further problems; and
(iv) To assess the effectiveness of the SSN Scholarships and Block Grants Program,
especially regarding the suitability of the targets, the amount and forms of assistance,
the benefits and drawbacks, and the suitability of the mechanisms adopted to
implement the programs.
������ ���!��"��
This rapid assessment was conducted in four kabupaten located in four different provinces
in October and November 1999: Pontianak (West Kalimantan), Tangerang (representing
Jakarta, Bogor, Tangerang and Bekasi, that being the Jabotabek area), Sleman (DI-
Yogyakarta), and East Lombok (West Nusa Tenggara). The locations were selected based
on information obtained from the Kecamatan Survey Report3
about the impact of the
crisis and the poverty index, which was initially used to determine the allocation of
scholarships and Block Grants.
Two kecamatan were chosen from each kabupaten in the study, one from an urban area
and the other from a rural or remote area. Following this, two desa (villages) were
selected in each kecamatan. In addition, three primary schools (SD/MI), and three junior
secondary schools (SLTP/MTs) were selected, representing both public and private
schools, as well as Madrasah (Islamic-based schools). These schools were chosen
regardless of whether or not they had received SSN Scholarships or Block Grants
program assistance.
The desa and schools were not always chosen simultaneously. In some instances, the location
of the desa was determined prior to the location of the school which enabled the SMERU
Team to gather preliminary information about the schools attended by the local children. It
is quite common for children to attend schools located in a desa which different from their
3
Kecamatan Crisis Impact Survey: Sudarno Sumarto, Anna Wetterberg, Lant Pritchett, 1998.

The SMERU Research Institute, September 2003��
place of residence and consequently this had to be considered during SMERU�s
investigations. The survey areas, information sources, and method of data collection are
summarized in Table 1 and Table 1a.
Table 1. Administrative Area, Sources of Information and Research Methods
No Administrative
Area
Source of Information
(Primary & Secondary)
Research Methods
1. Province Bappeda, Level I
Provincial Office, Dept. of Education
ProvincialOffice, Dept. of ReligiousAffairs
In-depth interview, secondary data
In-depth interview, secondary data
In-depth interview
2. Kabupaten,
Level II
1. Bappeda, Level II
2. Head of Dept. of Education, Level II
3. Officials from the Dept. of
Education, level II
4. Officials from the Inspection office
for the Dept. of Education, Level II
5. Dept. of Religious Affairs
6. PIMU (Provincial Independent
Monitoring Unit)
7. Local NGO leaders
In-depth interview, secondary data
In-depth interview, secondary data
In-depth interview, secondary data
In-depth interview, secondary data
In-depth interview
In-depth interview
In-depth interview
3. Kecamatan 1. Camat/Camat Sec./Staff of Kecamatan
2. Branch Office of Education
(Service Unit)
4. Kabupaten Office of Education
5. Sub-branch, Service Unit of Dept.
of Education
6. Kecamatan Post Office officials
7. Family Planning ExtensionWorkers
8. Members of KecamatanCommittee
In-depth interview
In-depth interview, secondary data
In-depth interview, secondary data
In-depth interview, secondary data
In-depth interview, secondary data
In-depth interview, secondary data
In-depth interview
4 Desa 1. VillageHead/Secretary/Administrative
2. Community leaders
3. Members of the School Committee
4. School Principals and Teachers
5. School BP3
6. NGO field workers
7. Community members and parents
8. Students
In-depth interview
In-depth interview
In-depth interview, secondary data
In-depth interview
In-depth interview & FGD *
In-depth interview
In-depth interview & FGD *
In-depth interview & FGD *
Note: * = Focus Group Discussion conducted in Sleman, Tangerang, and East Lombok .
The SMERU Research Institute, September 2003��
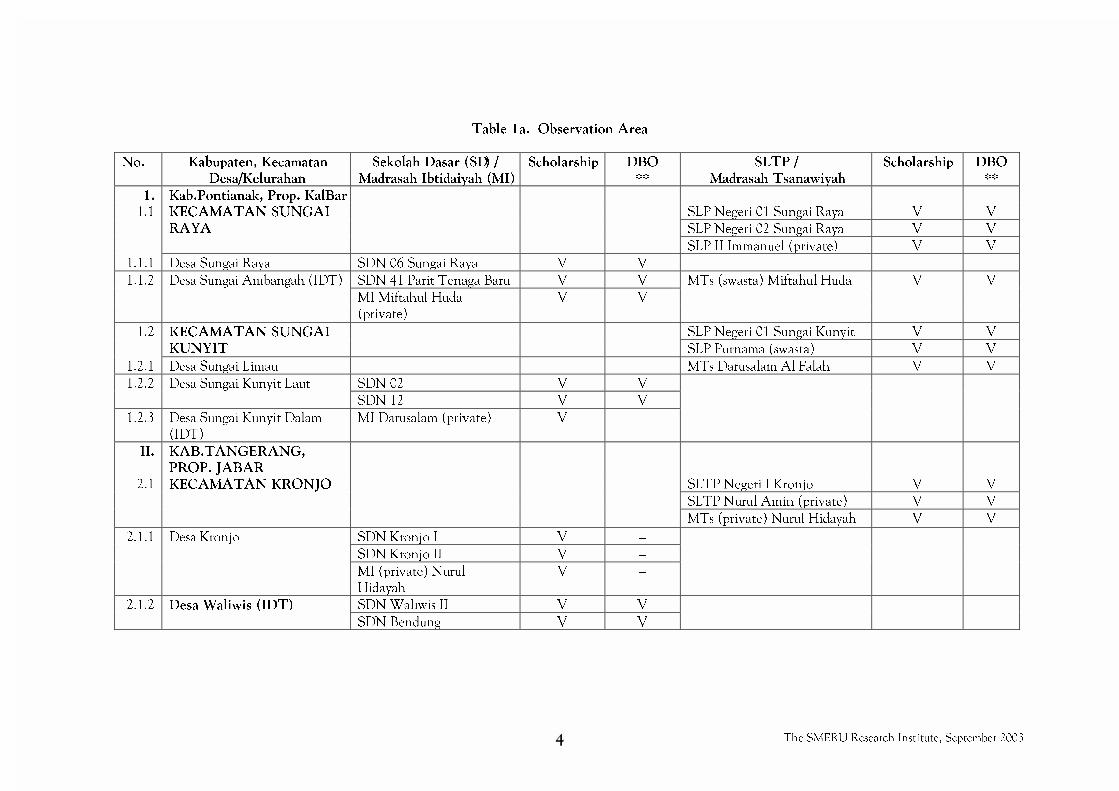
Table 1a. Observation Area
No. Kabupaten, KecamatanDesa/Kelurahan
Sekolah Dasar (SD) /Madrasah Ibtidaiyah (MI)
Scholarship DBO**
SLTP /Madrasah Tsanawiyah
Scholarship DBO**
1. Kab.Pontianak, Prop. KalBarSLP Negeri 01 Sungai Raya V V
SLP Negeri 02 Sungai Raya V V
1.1 KECAMATAN SUNGAIRAYA
SLP II Immanuel (private) V V
1.1.1 Desa Sungai Raya SDN 06 Sungai Raya V V
SDN 41 Parit Tenaga Baru V V1.1.2 Desa Sungai Ambangah (IDT)
MI Miftahul Huda
(private)
V V
MTs (swasta) Miftahul Huda V V
SLP Negeri 01 Sungai Kunyit V V1.2 KECAMATAN SUNGAIKUNYIT SLP Purnama (swasta) V V
1.2.1 Desa Sungai Limau MTs Darusalam Al Falah V V
SDN 02 V V1.2.2 Desa Sungai Kunyit Laut
SDN 12 V V
1.2.3 Desa Sungai Kunyit Dalam
(IDT)
MI Darusalam (private) V �
II. KAB.TANGERANG,PROP. JABAR
SLTP Negeri I Kronjo V V
SLTP Nurul Amin (private) V V
2.1 KECAMATAN KRONJO
MTs (private) Nurul Hidayah V V
SDN Kronjo I V �
SDN Kronjo II V �
2.1.1 Desa Kronjo
MI (private) Nurul
Hidayah
V �
SDNWaliwis II V V2.1.2 Desa Waliwis (IDT)
SDN Bendung V V

The SMERU Research Institute, September 2003��
Table 1a (Continued). Observation Area.
No. Kabupaten, KecamatanDesa/Kelurahan
Sekolah Dasar (SD) /Madrasah Ibtidaiyah (MI)
Scholarship DBO**
SLTP /Madrasah Tsanawiyah
Scholarship DBO**
SLTP Negeri I Rajeg V V
MTs Negeri I Rajeg V V
MTs (private) Daarul Archam V V
2.2 Kecamatan Rajeg
MTs (private) Nurul Iman V �
2.2.1 Desa Sukatani (masy.terPHK) SDN Sukamah III V V
SDN Rajeg II V �
SDN Rajeg V V �
2.2.2 Desa Rajeg
MI (private) Nurul Iman V V
III. Kab.Sleman,Prop.DI Yogyakarta *
SMPN Prambanan
(& Open Junior High School)
V V3.1 Kecamatan Prambanan(Rural)
Mts Palemsari V V
3.1.1 Desa Madurejo SDN Potrojayan II V V
SDN Karangsari V V3.1.2 Desa Sambirejo (IDT)
SDN Sumberwatu V V
SMP Muhamadiyah I V -3.2 Kecamatan Depok (urban)
SMPN III Depok V V
SDN Ambarukmo V V3.2.1 Desa Catur Tunggal
SDN Babarsari V �
MI Al Huda V �3.2.2 Desa Maguwohardjo
SDN Depok I V �

The SMERU Research Institute, September 2003��
Lanjutan Table 1a. Observation Area.
No. Kabupaten, KecamatanDesa/Kelurahan
Sekolah Dasar (SD) /Madrasah Ibtidaiyah (MI)
Scholarship DBO**
SLTP /Madrasah Tsanawiyah
Scholarship DBO**
IV. Kab.Lombok Timur,Prop.NTB
SLTP Negeri I Masbagik V V
SLTP Negeri IV Masbagik V �
4.1 Kecamatan Masbagik
MTs Dasan Malang V V
4.1.1 Desa Sangiang SDN Sangiang V V
4.1.2 Desa Masbagik Utara SDN 5 Masbagik V V
4.1.3 Desa Paok Motong MI Dasan Malang V V
SLTP Negeri Pringgabaya V V4.2 Kecamatan Pringgabaya
MTs Benyer V �
SDN 2 Labuhan Lombok V V4.2.1 Desa Labuhan Lombok
MI Labuhan Lombok V V
MTs Ketangga V V
4.2.2 Desa Bagik Papan SDN Bagik Papan V V
Note:
* The team of Kabupaten Sleman � DI Yogyakarta also visited some high schools including SMK Muhamadiyah (private), SMU De Britto (private),
and SMU Negeri I Depok.
** Program 1998/1999.
The SMERU Research Institute, September 2003��
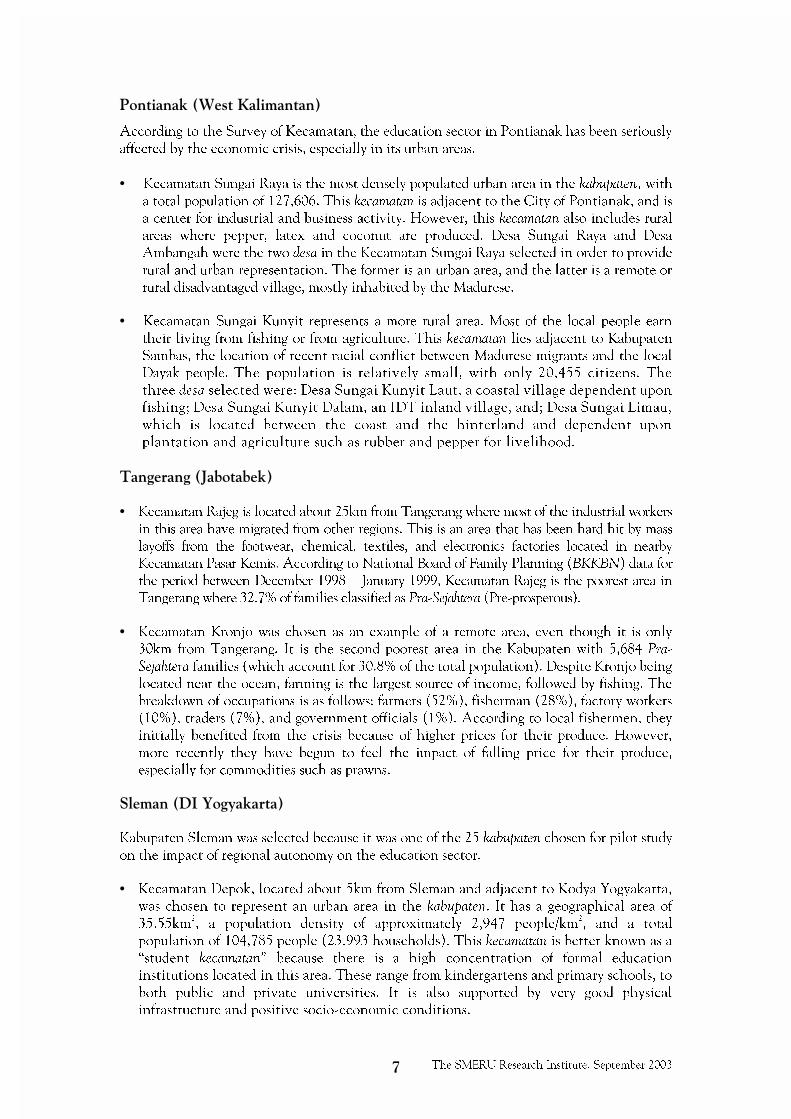
����������� ���������������
According to the Survey of Kecamatan, the education sector in Pontianak has been seriously
affected by the economic crisis, especially in its urban areas.
• Kecamatan Sungai Raya is the most densely populated urban area in the kabupaten, witha total population of 127,606. This kecamatan is adjacent to the City of Pontianak, and is
a center for industrial and business activity. However, this kecamatan also includes rural
areas where pepper, latex and coconut are produced. Desa Sungai Raya and Desa
Ambangah were the two desa in the Kecamatan Sungai Raya selected in order to provide
rural and urban representation. The former is an urban area, and the latter is a remote or
rural disadvantaged village, mostly inhabited by the Madurese.
• Kecamatan Sungai Kunyit represents a more rural area. Most of the local people earn
their living from fishing or from agriculture. This kecamatan lies adjacent to Kabupaten
Sambas, the location of recent racial conflict between Madurese migrants and the local
Dayak people. The population is relatively small, with only 20,455 citizens. The
three desa selected were: Desa Sungai Kunyit Laut, a coastal village dependent upon
fishing; Desa Sungai Kunyit Dalam, an IDT inland village, and; Desa Sungai Limau,
which is located between the coast and the hinterland and dependent upon
plantation and agriculture such as rubber and pepper for livelihood.
��������������������
• Kecamatan Rajeg is located about 25km from Tangerang where most of the industrial workers
in this area have migrated from other regions. This is an area that has been hard hit by mass
layoffs from the footwear, chemical, textiles, and electronics factories located in nearby
Kecamatan Pasar Kemis. According to National Board of Family Planning (BKKBN) data for
the period between December 1998 � January 1999, Kecamatan Rajeg is the poorest area in
Tangerang where 32.7% of families classified as Pra-Sejahtera (Pre-prosperous).
• Kecamatan Kronjo was chosen as an example of a remote area, even though it is only
30km from Tangerang. It is the second poorest area in the Kabupaten with 5,684 Pra-Sejahtera families (which account for 30.8% of the total population). Despite Kronjo being
located near the ocean, farming is the largest source of income, followed by fishing. The
breakdown of occupations is as follows: farmers (52%), fisherman (28%), factory workers
(10%), traders (7%), and government officials (1%). According to local fishermen, they
initially benefited from the crisis because of higher prices for their produce. However,
more recently they have begun to feel the impact of falling price for their produce,
especially for commodities such as prawns.
���������������������
Kabupaten Sleman was selected because it was one of the 25 kabupaten chosen for pilot study
on the impact of regional autonomy on the education sector.
• Kecamatan Depok, located about 5km from Sleman and adjacent to Kodya Yogyakarta,
was chosen to represent an urban area in the kabupaten. It has a geographical area of
35.55km2
, a population density of approximately 2,947 people/km2
, and a total
population of 104,785 people (23.993 households). This kecamatan is better known as a
�student kecamatan� because there is a high concentration of formal education
institutions located in this area. These range from kindergartens and primary schools, to
both public and private universities. It is also supported by very good physical
infrastructure and positive socio-economic conditions.
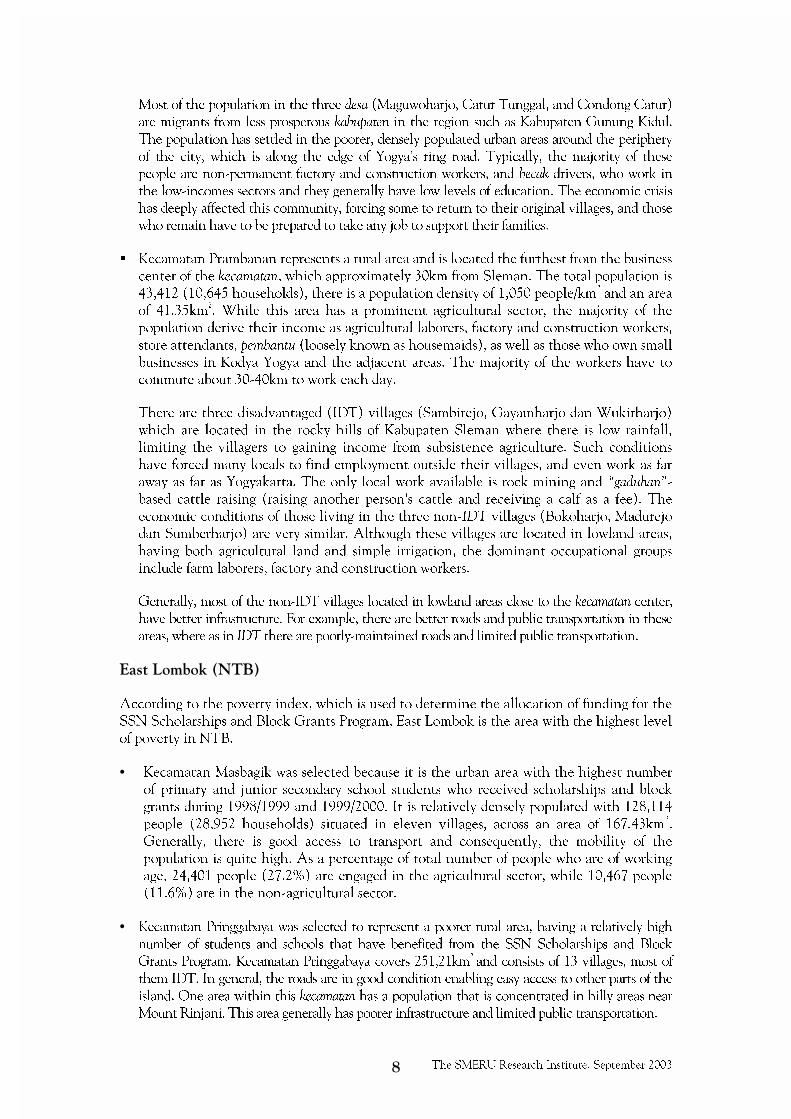
The SMERU Research Institute, September 2003��
Most of the population in the three desa (Maguwoharjo, Catur Tunggal, and Condong Catur)
are migrants from less prosperous kabupaten in the region such as Kabupaten Gunung Kidul.
The population has settled in the poorer, densely populated urban areas around the periphery
of the city, which is along the edge of Yogya�s ring road. Typically, the majority of these
people are non-permanent factory and construction workers, and becak drivers, who work in
the low-incomes sectors and they generally have low levels of education. The economic crisis
has deeply affected this community, forcing some to return to their original villages, and those
who remain have to be prepared to take any job to support their families.
� Kecamatan Prambanan represents a rural area and is located the furthest from the business
center of the kecamatan, which approximately 30km from Sleman. The total population is
43,412 (10,645 households), there is a population density of 1,050 people/km2
and an area
of 41.35km2
. While this area has a prominent agricultural sector, the majority of the
population derive their income as agricultural laborers, factory and construction workers,
store attendants, pembantu (loosely known as housemaids), as well as those who own small
businesses in Kodya Yogya and the adjacent areas. The majority of the workers have to
commute about 30-40km to work each day.
There are three disadvantaged (IDT) villages (Sambirejo, Gayamharjo dan Wukirharjo)
which are located in the rocky hills of Kabupaten Sleman where there is low rainfall,
limiting the villagers to gaining income from subsistence agriculture. Such conditions
have forced many locals to find employment outside their villages, and even work as far
away as far as Yogyakarta. The only local work available is rock mining and �gaduhan�-based cattle raising (raising another person�s cattle and receiving a calf as a fee). The
economic conditions of those living in the three non-IDT villages (Bokoharjo, Madurejo
dan Sumberharjo) are very similar. Although these villages are located in lowland areas,
having both agricultural land and simple irrigation, the dominant occupational groups
include farm laborers, factory and construction workers.
Generally, most of the non-IDT villages located in lowland areas close to the kecamatan center,have better infrastructure. For example, there are better roads and public transportation in these
areas, where as in IDT there are poorly-maintained roads and limited public transportation.
�� ���������� ��
According to the poverty index, which is used to determine the allocation of funding for the
SSN Scholarships and Block Grants Program, East Lombok is the area with the highest level
of poverty in NTB.
• Kecamatan Masbagik was selected because it is the urban area with the highest number
of primary and junior secondary school students who received scholarships and block
grants during 1998/1999 and 1999/2000. It is relatively densely populated with 128,114
people (28,952 households) situated in eleven villages, across an area of 167.43km2
.
Generally, there is good access to transport and consequently, the mobility of the
population is quite high. As a percentage of total number of people who are of working
age, 24,401 people (27.2%) are engaged in the agricultural sector, while 10,467 people
(11.6%) are in the non-agricultural sector.
• Kecamatan Pringgabaya was selected to represent a poorer rural area, having a relatively high
number of students and schools that have benefited from the SSN Scholarships and Block
Grants Program. Kecamatan Pringgabaya covers 251,21km2
and consists of 13 villages, most of
them IDT. In general, the roads are in good condition enabling easy access to other parts of the
island. One area within this kecamatan has a population that is concentrated in hilly areas near
Mount Rinjani. This area generally has poorer infrastructure and limited public transportation.
The SMERU Research Institute, September 2003!�
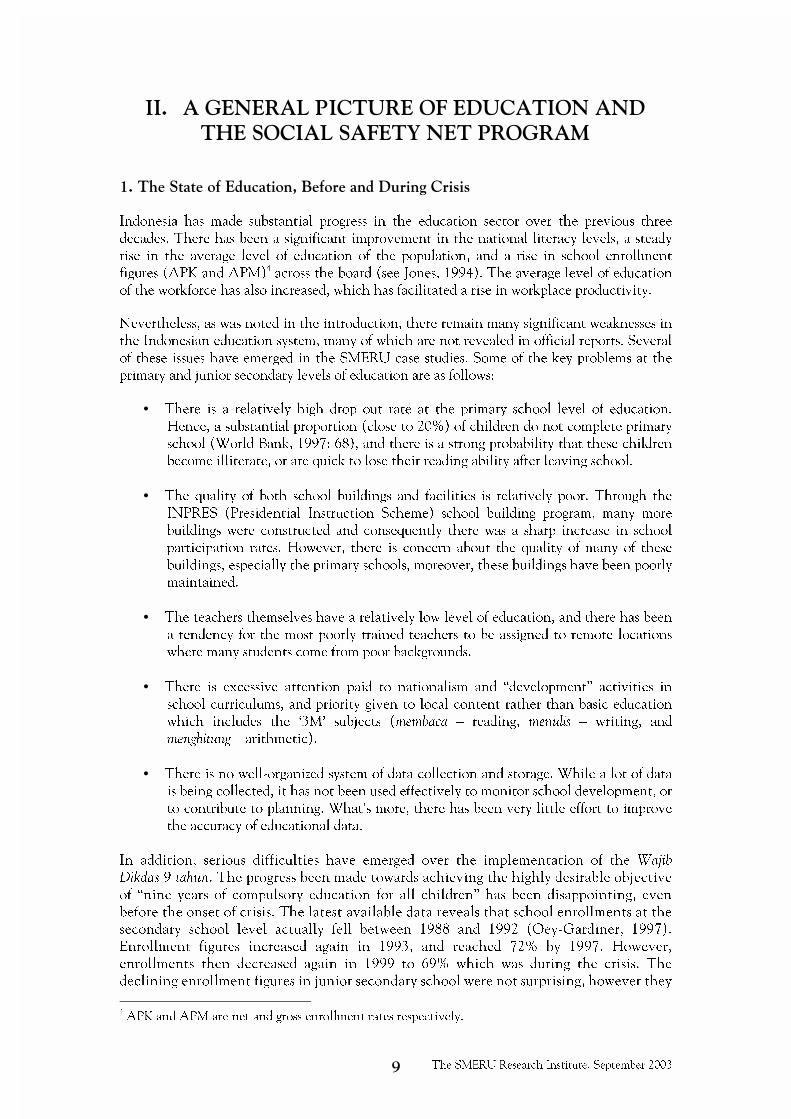
��"� #�$���%#����&�'%��()���'&#��(��#����*���(&�#���#)���������%($%#+�
,"��-���������.��/01�����2� �.������/��0�����&�� � ��
Indonesia has made substantial progress in the education sector over the previous three
decades. There has been a significant improvement in the national literacy levels, a steady
rise in the average level of education of the population, and a rise in school enrollment
figures (APK and APM)4
across the board (see Jones, 1994). The average level of education
of the workforce has also increased, which has facilitated a rise in workplace productivity.
Nevertheless, as was noted in the introduction, there remain many significant weaknesses in
the Indonesian education system, many of which are not revealed in official reports. Several
of these issues have emerged in the SMERU case studies. Some of the key problems at the
primary and junior secondary levels of education are as follows:
• There is a relatively high drop out rate at the primary school level of education.
Hence, a substantial proportion (close to 20%) of children do not complete primary
school (World Bank, 1997: 68), and there is a strong probability that these children
become illiterate, or are quick to lose their reading ability after leaving school.
• The quality of both school buildings and facilities is relatively poor. Through the
INPRES (Presidential Instruction Scheme) school building program, many more
buildings were constructed and consequently there was a sharp increase in school
participation rates. However, there is concern about the quality of many of these
buildings, especially the primary schools, moreover, these buildings have been poorly
maintained.
• The teachers themselves have a relatively low level of education, and there has been
a tendency for the most poorly trained teachers to be assigned to remote locations
where many students come from poor backgrounds.
• There is excessive attention paid to nationalism and �development� activities in
school curriculums, and priority given to local content rather than basic education
which includes the �3M� subjects (membaca � reading, menulis � writing, and
menghitung � arithmetic).
• There is no well-organized system of data collection and storage. While a lot of data
is being collected, it has not been used effectively to monitor school development, or
to contribute to planning. What�s more, there has been very little effort to improve
the accuracy of educational data.
In addition, serious difficulties have emerged over the implementation of the WajibDikdas 9 tahun. The progress been made towards achieving the highly desirable objective
of �nine years of compulsory education for all children� has been disappointing, even
before the onset of crisis. The latest available data reveals that school enrollments at the
secondary school level actually fell between 1988 and 1992 (Oey-Gardiner, 1997).
Enrollment figures increased again in 1993, and reached 72% by 1997. However,
enrollments then decreased again in 1999 to 69% which was during the crisis. The
declining enrollment figures in junior secondary school were not surprising, however they
4
APK and APM are net and gross enrollment rates respectively.
The SMERU Research Institute, September 2003,3�
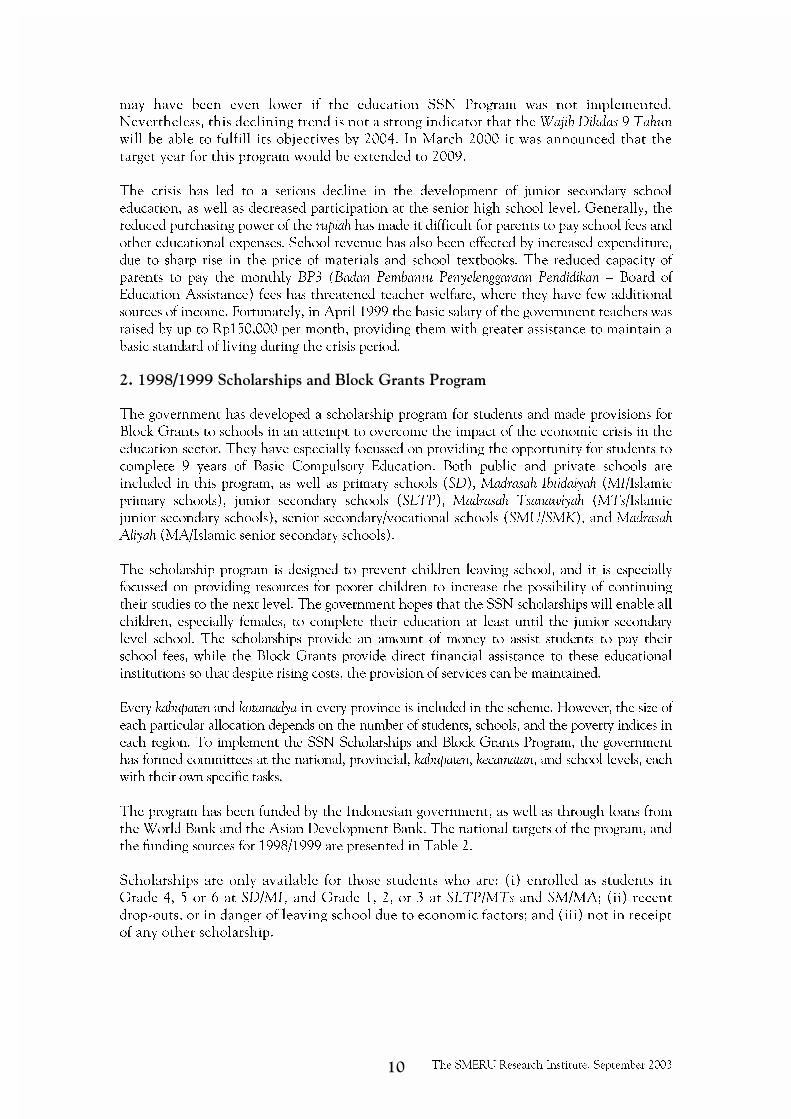
may have been even lower if the education SSN Program was not implemented.
Nevertheless, this declining trend is not a strong indicator that the Wajib Dikdas 9 Tahunwill be able to fulfill its objectives by 2004. In March 2000 it was announced that the
target year for this program would be extended to 2009.
The crisis has led to a serious decline in the development of junior secondary school
education, as well as decreased participation at the senior high school level. Generally, the
reduced purchasing power of the rupiah has made it difficult for parents to pay school fees and
other educational expenses. School revenue has also been effected by increased expenditure,
due to sharp rise in the price of materials and school textbooks. The reduced capacity of
parents to pay the monthly BP3 (Badan Pembantu Penyelenggaraan Pendidikan � Board of
Education Assistance) fees has threatened teacher welfare, where they have few additional
sources of income. Fortunately, in April 1999 the basic salary of the government teachers was
raised by up to Rp150,000 per month, providing them with greater assistance to maintain a
basic standard of living during the crisis period.
4"�,!!�5,!!!��1-���� -�6 ���/� ��1�$���� ���������
The government has developed a scholarship program for students and made provisions for
Block Grants to schools in an attempt to overcome the impact of the economic crisis in the
education sector. They have especially focussed on providing the opportunity for students to
complete 9 years of Basic Compulsory Education. Both public and private schools are
included in this program, as well as primary schools (SD), Madrasah Ibtidaiyah (MI/Islamic
primary schools), junior secondary schools (SLTP), Madrasah Tsanawiyah (MTs/Islamic
junior secondary schools), senior secondary/vocational schools (SMU/SMK), and MadrasahAliyah (MA/Islamic senior secondary schools).
The scholarship program is designed to prevent children leaving school, and it is especially
focussed on providing resources for poorer children to increase the possibility of continuing
their studies to the next level. The government hopes that the SSN scholarships will enable all
children, especially females, to complete their education at least until the junior secondary
level school. The scholarships provide an amount of money to assist students to pay their
school fees, while the Block Grants provide direct financial assistance to these educational
institutions so that despite rising costs, the provision of services can be maintained.
Every kabupaten and kotamadya in every province is included in the scheme. However, the size of
each particular allocation depends on the number of students, schools, and the poverty indices in
each region. To implement the SSN Scholarships and Block Grants Program, the government
has formed committees at the national, provincial, kabupaten, kecamatan, and school levels, each
with their own specific tasks.
The program has been funded by the Indonesian government, as well as through loans from
the World Bank and the Asian Development Bank. The national targets of the program, and
the funding sources for 1998/1999 are presented in Table 2.
Scholarships are only available for those students who are: (i) enrolled as students in
Grade 4, 5 or 6 at SD/MI, and Grade 1, 2, or 3 at SLTP/MTs and SM/MA; (ii) recent
drop-outs, or in danger of leaving school due to economic factors; and (iii) not in receipt
of any other scholarship.
The SMERU Research Institute, September 2003,,�
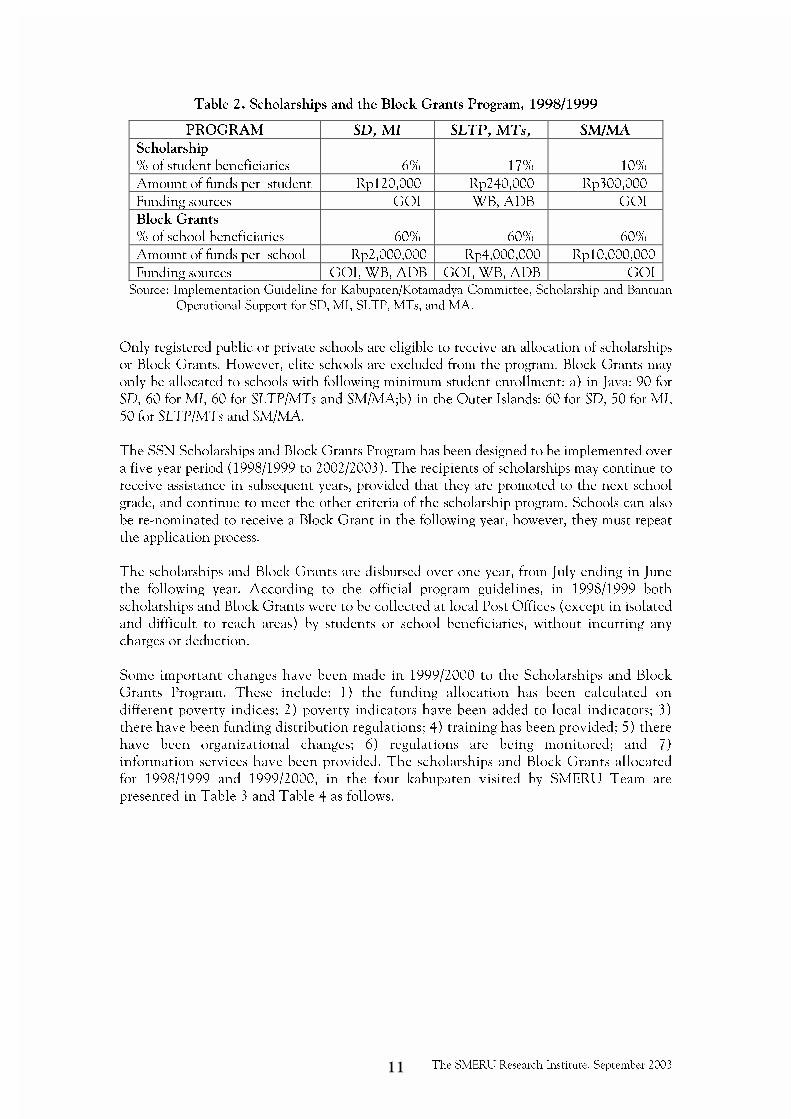
Table 2. Scholarships and the Block Grants Program, 1998/1999
PROGRAM SD, MI SLTP, MTs, SM/MA
Scholarship
% of student beneficiaries 6% 17% 10%
Amount of funds per student Rp120,000 Rp240,000 Rp300,000
Funding sources GOI WB, ADB GOI
Block Grants
% of school beneficiaries 60% 60% 60%
Amount of funds per school Rp2,000,000 Rp4,000,000 Rp10,000,000
Funding sources GOI, WB, ADB GOI, WB, ADB GOISource: Implementation Guideline for Kabupaten/Kotamadya Committee, Scholarship and Bantuan
Operational Support for SD, MI, SLTP, MTs, and MA.
Only registered public or private schools are eligible to receive an allocation of scholarships
or Block Grants. However, elite schools are excluded from the program. Block Grants may
only be allocated to schools with following minimum student enrollment: a) in Java: 90 for
SD, 60 for MI, 60 for SLTP/MTs and SM/MA;b) in the Outer Islands: 60 for SD, 50 for MI,50 for SLTP/MTs and SM/MA.
The SSN Scholarships and Block Grants Program has been designed to be implemented over
a five year period (1998/1999 to 2002/2003). The recipients of scholarships may continue to
receive assistance in subsequent years, provided that they are promoted to the next school
grade, and continue to meet the other criteria of the scholarship program. Schools can also
be re-nominated to receive a Block Grant in the following year, however, they must repeat
the application process.
The scholarships and Block Grants are disbursed over one year, from July ending in June
the following year. According to the official program guidelines, in 1998/1999 both
scholarships and Block Grants were to be collected at local Post Offices (except in isolated
and difficult to reach areas) by students or school beneficiaries, without incurring any
charges or deduction.
Some important changes have been made in 1999/2000 to the Scholarships and Block
Grants Program. These include: 1) the funding allocation has been calculated on
different poverty indices; 2) poverty indicators have been added to local indicators; 3)
there have been funding distribution regulations; 4) training has been provided; 5) there
have been organizational changes; 6) regulations are being monitored; and 7)
information services have been provided. The scholarships and Block Grants allocated
for 1998/1999 and 1999/2000, in the four kabupaten visited by SMERU Team are
presented in Table 3 and Table 4 as follows.
�
�
�
�
�
�
�
�
The SMERU Research Institute, September 2003,4�
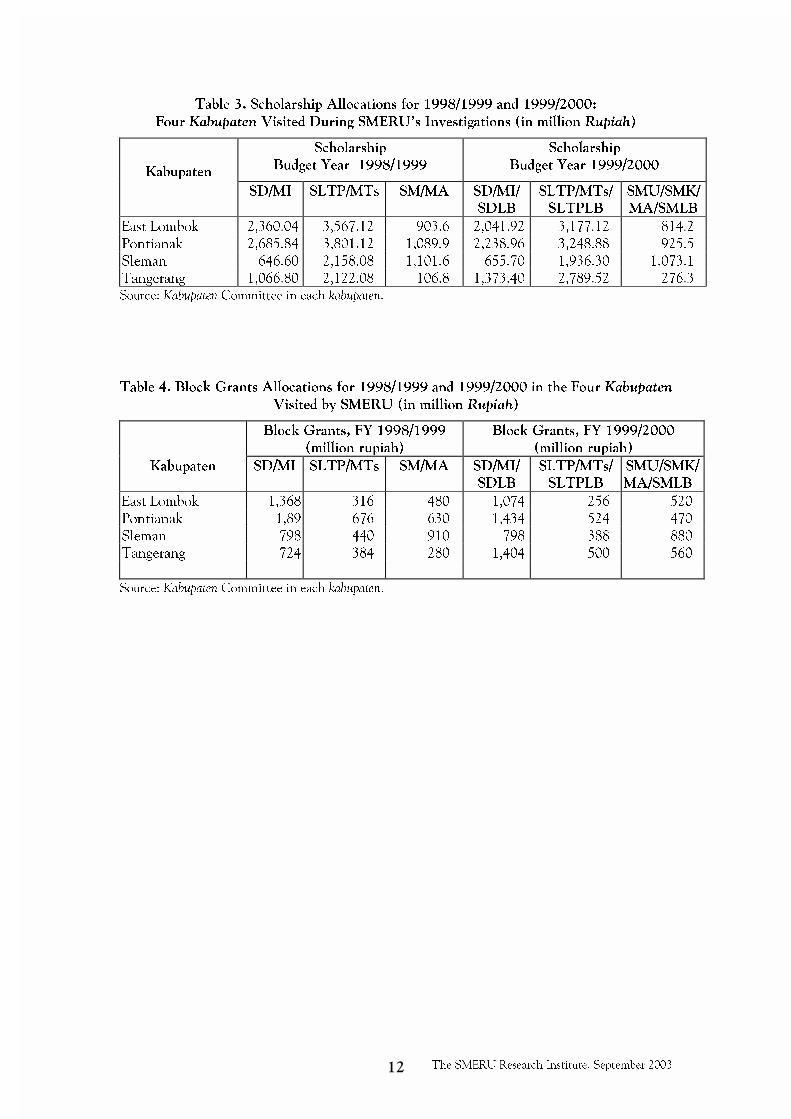
Table 3. Scholarship Allocations for 1998/1999 and 1999/2000:
Four Kabupaten Visited During SMERU�s Investigations (in million Rupiah)
Scholarship
Budget Year 1998/1999
Scholarship
Budget Year 1999/2000Kabupaten
SD/MI SLTP/MTs SM/MA SD/MI/
SDLB
SLTP/MTs/
SLTPLB
SMU/SMK/
MA/SMLB
East Lombok 2,360.04 3,567.12 903.6 2,041.92 3,177.12 814.2
Pontianak 2,685.84 3,801.12 1,089.9 2,238.96 3,248.88 925.5
Sleman 646.60 2,158.08 1,101.6 655.70 1,936.30 1.073.1
Tangerang 1,066.80 2,122.08 106.8 1,373.40 2,789.52 276.3Source: Kabupaten Committee in each kabupaten.
�
���Table 4. Block Grants Allocations for 1998/1999 and 1999/2000 in the Four Kabupaten
Visited by SMERU (in million Rupiah)
Block Grants, FY 1998/1999
(million rupiah)
Block Grants, FY 1999/2000
(million rupiah)
Kabupaten SD/MI SLTP/MTs SM/MA SD/MI/
SDLB
SLTP/MTs/
SLTPLB
SMU/SMK/
MA/SMLB
East Lombok 1,368 316 480 1,074 256 520
Pontianak 1,89 676 630 1,434 524 470
Sleman 798 440 910 798 388 880
Tangerang 724 384 280 1,404 500 560
Source: Kabupaten Committee in each kabupaten.
�
�
�
�
�
�
�
�
�

The SMERU Research Institute, September 2003,7�
���"� )�����)�����$��
,"�#�$�������(8��8��9��.��/01�������
During the course of this study SMERU monitored the general state of the education system
based several of the following criteria: the availability of schools (public, private, or
madrasah) and teachers, student-teacher ratios, student-school ratios, the quality of educationbased on NEM scores, parental attitudes regarding their children�s education and progress,
the attitude of government officials, the availability of school funding, and the travelling
distance for students to school each day.
In theory, data on Gross School Enrollment (APK) and Net School Enrollment (APM)
could also be used as indicators. However, as is apparent in many of the following tables (e.g.
Table 10) this data must be interpreted with caution, since the available figures for school-
age groups (for example 7-12 years or 13-15 years) are only estimates and may be inaccurate.
In general, the Team from SMERU found wide variations between educational institutions,
for example, there were differences between the provinces and the kabupaten, as well as
between the various kecamatan within the kabupaten. A general depiction of the education
system in these kabupaten and kecamatan is summarized in Table 5 and Table 5a, providing
data on the total number of schools, students, and teachers in the regions, as well as the
ratios between them.
• Pontianak. Based on information obtained from education officials in Kabupaten
Pontianak, both the quality and the level of student participation in elementary and
junior secondary schools in the kabupaten is relatively poor. Only 81.4% of SD graduates
were able to continue studying at the SLTP level, and only around 50.2% then continued
on to SMUA. However, the number of students who graduated compared to those
attended the National Final Educational Assessment (EBTANAS) in 1998/1999 was
relatively high, 95.2% for SD and 95% for SLTP.
The student-teacher ratios for SD and SLTP are relatively strong in this kabupaten. At the
provincial level there are about 23 students per teacher at the SD level, and 29 students per
teacher at the SLTP level. Kabupaten Pontianak has even better student-teacher ratios, with
21 students per teacher at the SD level, and 15 students per teacher at the SLTP the. Table 6provides an overview of general conditions in the schools in the two kecamatan visited by the
SMERU Team.

The SMERU Research Institute, September 2003���
Table 5. Number of Schools, Students and Teachers in the Schools Visited by The SMERU Team, 1998/1999
Number of Schools Number of Students Number of TeachersKabupaten/
Kecamatan SD MI SLTP MTs Open SD MI SLTP MTs Open
Sch.
SD MI SLTP MTs Open
Sch.
Kab. Pontianak 846 n.a 135 n.a n.a 134.128 n.a 29.705 n.a n.a 6.288 n.a 1.967 n.a n.a
Kecamatan 1 71 17 18 8 1 18..993 1.898 4.719 1.057 152 n.a n.a n.a n.a n.a
Kecamatan 2 21 3 2 2 n.a 2.963 455 634 117 n.a n.a n.a n.a n.a n.a
Kab.Tangerang* 1.091 289 164 142 18 324.796 45.367 74.779 30.426 2.696 7.564 1.493 3.504 2.730 n.a
Kecamatan 1 51 9 2 6 1 12.349 1.110 1.421 934 212 221 36 50 94 n.a
Kecamatan 2 39 16 1 8 1 13.151 2.030 1.350 1.425 137 223 50 40 116 n.a
Kab. Sleman 558 17 116 20 5 75.990 1.017 36.969 5.664 n.a n.a n.a n.a n.a n.a
Kecamatan 1 31 n.a 5 1 1 4.623 n.a 1.761 505 27 n.a n.a n.a n.a n.a
Kecamatan 2 64 4 12 4 n.a 10.778 192 3.364 1.152 n.a n.a n.a n.a n.a n.a
Kab.Lbk. Timur 666 147 58 131 21 144.947 21.807 21.159 21.063 3.165 5.340 1.468 947 2.459 163
Kecamatan 1 78 17 5 15 3 19.938 2.606 2.843 2.247 n.a 682 171 147 244 13
Kecamatan 2 79 14 8 10 2 18.667 1.499 3.823 1.096 n.a 580 103 172 144 18
Sources: Office of Department of National Education at Kecamatan, Kabupaten, or Provincial levels in each region.
Note: * Data from 1999/2000.

The SMERU Research Institute, September 2003���
Table 5a. Student/School, Student/Teacher, and Teacher/School Ratio
Student/Sschool Ratio Student/Teacher
Ratio
Teacher/School
RatioKabupaten/
KecamatanSD SLTP MI MTs SD SLTP SD SLTP
Pontianak 159 220 * * 21 15 7 15
kecamatan 1 268 262 112 132 * * * *
kecamatan 2 141 317 152 59 * * * *
Tangerang 298 456 157 214 43 21 7 21
kecamatan 1 242 711 123 156 56 28 4 25
kecamatan 2 337 1,350 127 178 59 34 6 40
Sleman 136 319 60 283 * * * *
kecamatan 1 149 352 * * * * * *
kecamatan 2 168 280 48 288 * * * *
Lombok Timur 218 365 148 161 27 22 8 16
kecamatan 1 256 569 153 150 29 19 9 29
kecamatan 2 236 478 107 110 32 22 7 22
Recapitulation:
Kabupaten
Pontianak 159 220 * * 21 15 7 15
Tangerang 298 456 157 214 43 21 7 21
Sleman 136 319 60 283 * * * *
Lombok Timur 218 365 148 161 27 22 8 16
Kecamatan 1
Pontianak 268 262 112 132 * * * *
Tangerang 242 711 123 156 56 28 4 25
Sleman 149 352 * * * * * *
Lombok Timur 256 569 153 150 29 19 9 29
Kecamatan 2
Pontianak 141 317 152 59 * * * *
Tangerang 337 1,350 127 178 59 34 6 40
Sleman 168 280 48 288 * * * *
Lombok Timur 236 478 107 110 32 22 7 22
��

The SMERU Research Institute, September 2003���
Table 6. Schools in Pontianak visited by SMERU 1999/2000
No. Name of SchoolNo. of
Students
No. of
Teachers
Student and
Teacher
Ratio
BP3 Fee
(Rp)
Per month
Condition
of school
buildings
Elementary School (SD)
1. SDN-06 Sungai Raya 213 20 11 1.000 Fair
2. SDN-41 Parit Baru 97 10 10 600 Good
3. SDN-02 Sungai Kunyit 190 14 14 500 Good
4. SDN-12 Sungai Kunyit 180 11 16 250 Poor
MI
5. MI Miftahul Huda 297 13 23 1.750-
2.500
Fair
6. MI Darussalam 60 7 9 1.000 Good
SLTP
7. SMPN-01 Sungai Raya 754 38 20 2.500 Fair
8. SMPN-02 Sungai Raya 845 49 17 2.500-
3.500
Fair
9. SMPN-01 Sungai Kunyit 553 29 19 2.500-
3.500
Fair
10. SMPS Immanuel II 444 21 21 21.000-
30.000
Good
11. SMPS-Purnama 81 9 9 4.500 Poor
MTs
12. MTs Miftahul Huda 77 11 7 3.500-
5.000
Fair
13. MTs. Dar. Al Fatah * 58 15 4 0- 3.000 Poor
Note: * Teachers also taught at the local MA, pesantren (traditional Islamic boarding school) an
Qur�an reading for housewives was organized by Yayasan Pondok Pesantren Darussalam
Al Falah.
�
Observations from the field suggest that in general, there are slight differences in the
quality of education available in urban areas compared with rural areas, especially in the
case of private school education. In urban areas, such as Kecamatan Sungai Raya, most of
the private schools have better buildings and facilities and are attended by students from
wealthy families. In contrast, in rural areas such as Kecamatan Sungai Kunyit, many
private schools offer both inferior conditions and quality of teaching, and are attended by
those students who were not able to gain admission to public schools. These schools often
use existing public school buildings and are organized by teachers from the state system.
These teachers are either assisting students overcome the shortage of educational
opportunities (especially at the junior secondary school level), or are those who are trying
to earn additional income. MI and MTs schools are mostly located in Madurese areas
throughout Kabupaten Pontianak, where at least some of these schools are housed in
school buildings of an acceptable standard.
School buildings in this kabupaten generally tend to be timber constructions, apart
from some junior secondary schools and recently established primary schools. While
many of these buildings are not in good condition, they can still be used for learning
and teaching activities. However, some of the public primary schools and MTs are in
very poor condition, and contend with a serious shortage of equipment.
The survey suggests that the quality of education in madrasah schools is generally
inferior to public schools. This is attributed to the following factors: (i) an excessive
number of subjects in the school curriculum reducing the capacity of students to
absorb the information; (ii) a shortage of teachers, especially in general knowledge

The SMERU Research Institute, September 2003���
subject areas; (iii) an insufficient supply of text books and teaching materials; (iv) the
dependence of private schools on student school fees, where the majority of students
come from poor families with a limited capacity to pay; (vi) the relatively poor quality
of teachers who do not have an official background in education (Teachers� Training
College); and (vii) a lack of coordination between the Department of Education and
the Department of Religious Affairs.
• Tangerang. Schools in the Kecamatan Rajeg and Kronjo rank poorly compared with
the general state of education in West Java. This is reflected in the 1998/1999 NEM
scores of West Java junior secondary schools, published by the West Java Regional
Office of the Department of Education. SLTP Negeri Rajeg was ranked number 1,179
out of 2,528 public and private junior secondary schools in West Java, while SLTP
Negeri I Kronjo was ranked number 2,118. The average NEM scores for students in
both these schools were 5.35 and 5.06 respectively � both were categorized as D (poor).
Out of a total of 256 public and private secondary schools in Kabupaten Tangerang,
SLTP Negeri I Rajeg was ranked number 125, and SLTP Negeri I Kronjo number 218.
There are also many indications that the quality of primary school education in both
kecamatan is relatively poor5
. Apart from sub-standard buildings and inadequate
conditions, many schools have an insufficient number of teaching staff. Some schools
only have two regular teachers and one School Principal and many schools are forced to
recruit part-time teachers. In one IDT village, there were two primary schools share the
same sub-standard school building, which only has three classrooms, all of them being in
poor condition. The other three classrooms collapsed two years ago. Students have to sit
on the floor, on the desks, or share one chair between several students due to the lack of
resources. In other schools, there are gaping holes on the floor and collapsing ceilings.
SMERU visited 4 public primary schools in Kecamatan Kronjo and found that they were
only situated in two locations (two schools share the same building). Although each
school has its own School Principal and teaching staff, many decisions regarding the
office of the teachers, class time tables, and other issues were applicable for both. Table 7
gives a summary of the condition of each school in the two kecamatan investigated by the
SMERU Team.
• Sleman. Kabupaten Sleman was selected for one of the pilot studies on regional autonomy
and its effect on education. The state of the education system in Sleman appears to be one
healthiest in all of the kabupaten in Yogyakarta. In addition, its educational facilities and
infrastructure have provided a strong basis for equal opportunity in accessing basic
education. However, the standard of the physical infrastructure for education in the
relatively isolated IDT villages (such as in Desa Sumberwatu or Desa Sambirejo), is still
considered adequate.
An important aspect of education in this kabupaten is the declining trend of
enrollment figures in primary schools in recent years. The data collected about student
cohorts from 1992/93 to 1998/1999 verify these findings. Similar trends have been
observed amongst primary school cohorts at the kabupaten, kecamatan and school
levels. According to sources in the Office of Education, this decline in elementary
student enrollments in Kabupaten Sleman and other kabupaten in Yogyakarta is due
the success of the Family Planning program in reducing the birth rate. The result of
this trend has been school closures and mergers in various locations.
5The SMERU team noted a relatively small number of cases where 4
thgrade elementary school students
were unable to read. This was denied by some teachers and Kabupaten officials, and yet was confirmed
by teaching staff in one local private junior secondary school who regularly came across such cases.
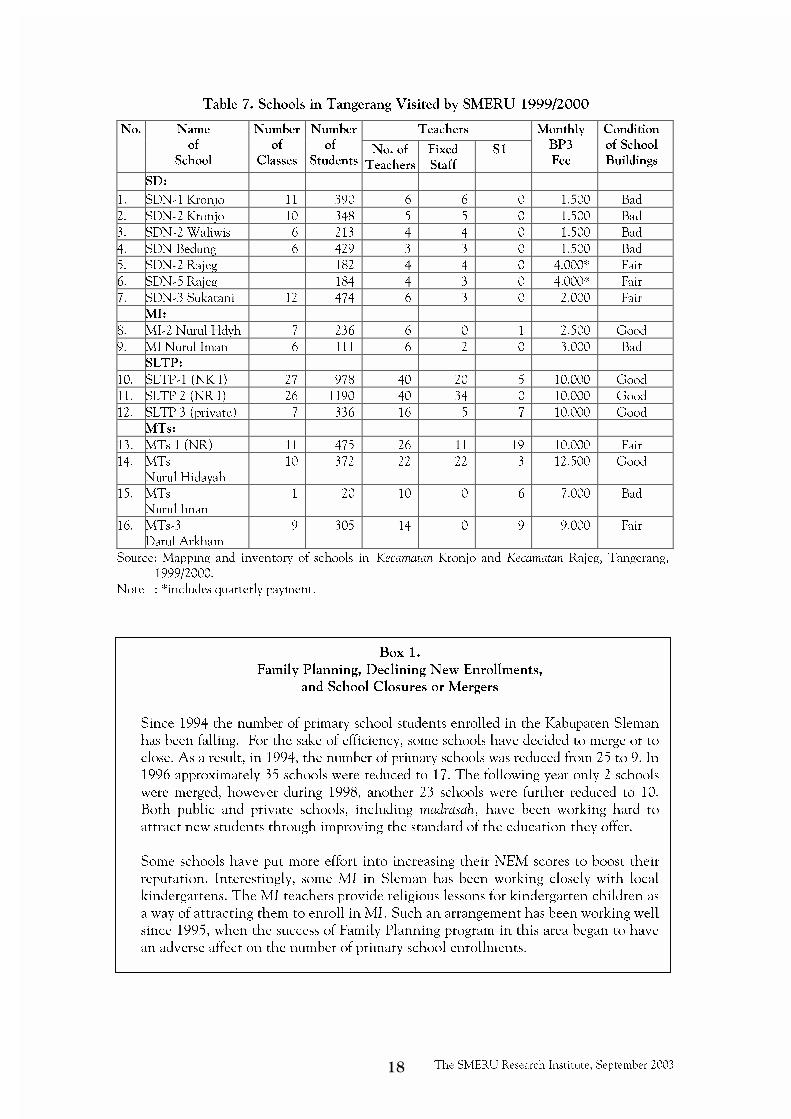
The SMERU Research Institute, September 2003���
Table 7. Schools in Tangerang Visited by SMERU 1999/2000
TeachersNo. Name
of
School
Number
of
Classes
Number
of
StudentsNo. of
Teachers
Fixed
Staff
S1
Monthly
BP3
Fee
Condition
of School
Buildings
SD:
1. SDN-1 Kronjo 11 390 6 6 0 1.500 Bad
2. SDN-2 Kronjo 10 348 5 5 0 1.500 Bad
3. SDN-2 Waliwis 6 213 4 4 0 1.500 Bad
4. SDN Bedung 6 429 3 3 0 1.500 Bad
5. SDN-2 Rajeg 182 4 4 0 4.000* Fair
6. SDN-5 Rajeg 184 4 3 0 4.000* Fair
7. SDN-3 Sukatani 12 474 6 3 0 2.000 Fair
MI:
8. MI-2 Nurul Hdyh 7 236 6 0 1 2.500 Good
9. MI Nurul Iman 6 111 6 2 0 3.000 Bad
SLTP:
10. SLTP-1 (NK I) 27 978 40 20 5 10.000 Good
11. SLTP 2 (NR I) 26 1190 40 34 0 10.000 Good
12. SLTP 3 (private) 7 336 16 5 7 10.000 Good
MTs:
13. MTs 1 (NR) 11 475 26 11 19 10.000 Fair
14. MTs
Nurul Hidayah
10 372 22 22 3 12.500 Good
15. MTs
Nurul Iman
1 20 10 0 6 7.000 Bad
16. MTs-3
Darul Arkham
9 305 14 0 9 9.000 Fair
Source: Mapping and inventory of schools in Kecamatan Kronjo and Kecamatan Rajeg, Tangerang,
1999/2000.
Note : *includes quarterly payment.
Box 1.
Family Planning, Declining New Enrollments,
and School Closures or Mergers��
Since 1994 the number of primary school students enrolled in the Kabupaten Sleman
has been falling. For the sake of efficiency, some schools have decided to merge or to
close. As a result, in 1994, the number of primary schools was reduced from 25 to 9. In
1996 approximately 35 schools were reduced to 17. The following year only 2 schools
were merged, however during 1998, another 23 schools were further reduced to 10.
Both public and private schools, including madrasah, have been working hard to
attract new students through improving the standard of the education they offer.
Some schools have put more effort into increasing their NEM scores to boost their
reputation. Interestingly, some MI in Sleman has been working closely with local
kindergartens. The MI teachers provide religious lessons for kindergarten children as
a way of attracting them to enroll in MI. Such an arrangement has been working well
since 1995, when the success of Family Planning program in this area began to have
an adverse affect on the number of primary school enrollments.�
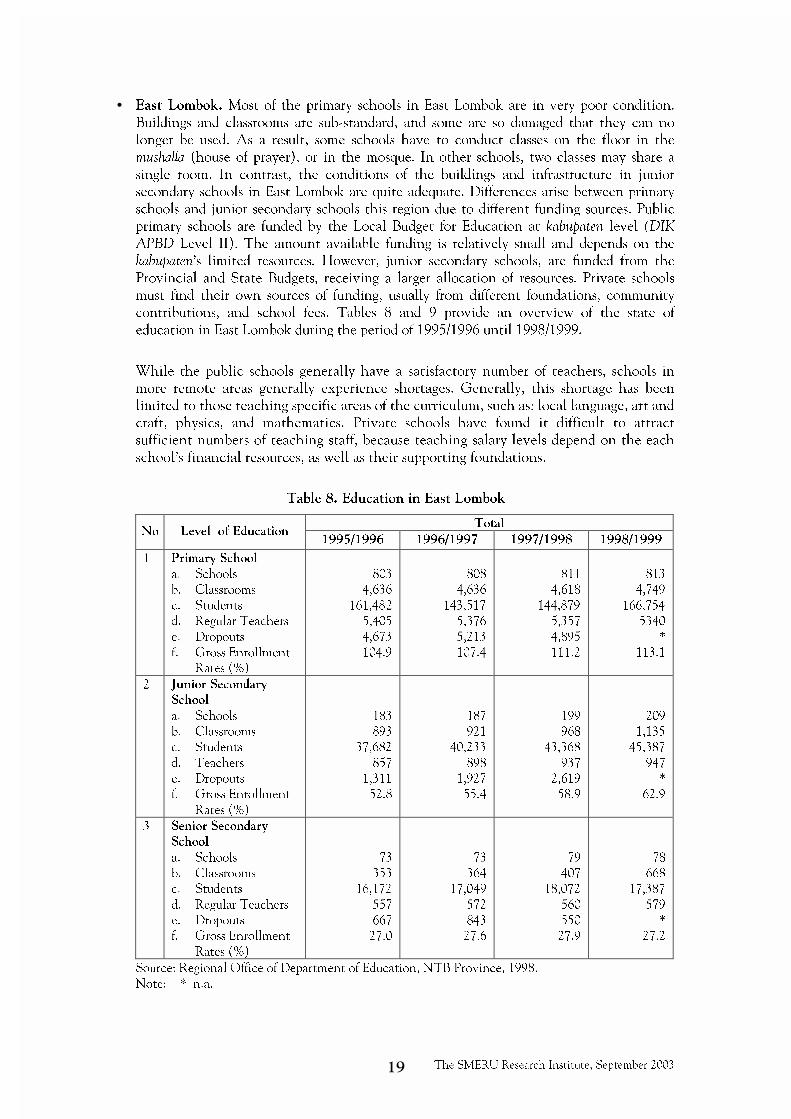
The SMERU Research Institute, September 2003���
• East Lombok. Most of the primary schools in East Lombok are in very poor condition.
Buildings and classrooms are sub-standard, and some are so damaged that they can no
longer be used. As a result, some schools have to conduct classes on the floor in the
mushalla (house of prayer), or in the mosque. In other schools, two classes may share a
single room. In contrast, the conditions of the buildings and infrastructure in junior
secondary schools in East Lombok are quite adequate. Differences arise between primary
schools and junior secondary schools this region due to different funding sources. Public
primary schools are funded by the Local Budget for Education at kabupaten level (DIK
APBD Level II). The amount available funding is relatively small and depends on the
kabupaten�s limited resources. However, junior secondary schools, are funded from the
Provincial and State Budgets, receiving a larger allocation of resources. Private schools
must find their own sources of funding, usually from different foundations, community
contributions, and school fees. Tables 8 and 9 provide an overview of the state of
education in East Lombok during the period of 1995/1996 until 1998/1999.
While the public schools generally have a satisfactory number of teachers, schools in
more remote areas generally experience shortages. Generally, this shortage has been
limited to those teaching specific areas of the curriculum, such as: local language, art and
craft, physics, and mathematics. Private schools have found it difficult to attract
sufficient numbers of teaching staff, because teaching salary levels depend on the each
school�s financial resources, as well as their supporting foundations.
Table 8. Education in East Lombok
TotalNo Level of Education
1995/1996 1996/1997 1997/1998 1998/1999
1 Primary School
a. Schools
b. Classrooms
c. Students
d. Regular Teachers
e. Dropouts
f. Gross Enrollment
Rates (%)
803
4,636
161,482
5,405
4,673
104.9
808
4,636
143,517
5,376
5,213
107.4
811
4,618
144,879
5,357
4,895
111.2
813
4,749
166,754
5340
*
113.1
2 Junior Secondary
School
a. Schools
b. Classrooms
c. Students
d. Teachers
e. Dropouts
f. Gross Enrollment
Rates (%)
183
893
37,682
857
1,311
52.8
187
921
40,233
898
1,927
55.4
199
968
43,368
937
2,619
58.9
209
1,135
45,387
947
*
62.9
3 Senior Secondary
School
a. Schools
b. Classrooms
c. Students
d. Regular Teachers
e. Dropouts
f. Gross Enrollment
Rates (%)
73
353
16,172
557
667
27.0
73
364
17,049
572
843
27.6
79
407
18,072
560
550
27.9
78
668
17,387
579
*
27.2
Source: Regional Office of Department of Education, NTB Province, 1998.
Note: * n.a.
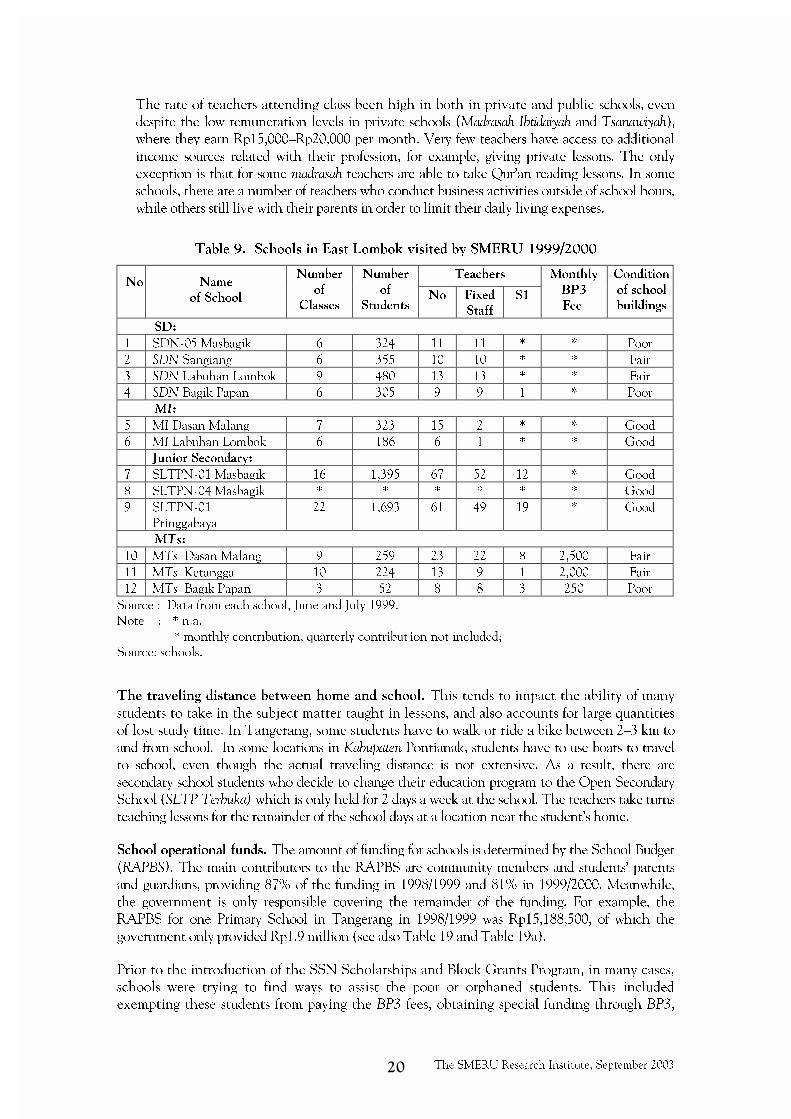
The SMERU Research Institute, September 2003��
The rate of teachers attending class been high in both in private and public schools, even
despite the low remuneration levels in private schools (Madrasah Ibtidaiyah and Tsanawiyah),
where they earn Rp15,000�Rp20,000 per month. Very few teachers have access to additional
income sources related with their profession, for example, giving private lessons. The only
exception is that for some madrasah teachers are able to take Qur�an reading lessons. In some
schools, there are a number of teachers who conduct business activities outside of school hours,
while others still live with their parents in order to limit their daily living expenses.
Table 9. Schools in East Lombok visited by SMERU 1999/2000
TeachersNo Name
of School
Number
of
Classes
Number
of
StudentsNo Fixed
Staff
S1
Monthly
BP3
Fee
Condition
of school
buildings
SD:
1 SDN-05 Masbagik 6 324 11 11 * * Poor
2 SDN Sangiang 6 355 10 10 * * Fair
3 SDN Labuhan Lombok 9 480 13 13 * * Fair
4 SDN Bagik Papan 6 305 9 9 1 * Poor
MI:
5 MI Dasan Malang 7 323 15 2 * * Good
6 MI Labuhan Lombok 6 186 6 1 * * Good
Junior Secondary:
7 SLTPN-01 Masbagik 16 1,395 67 52 12 * Good
8 SLTPN-04 Masbagik * * * * * * Good
9 SLTPN-01
Pringgabaya
22 1,693 61 49 19 * Good
MTs:
10 MTs Dasan Malang 9 259 23 22 8 2,500 Fair
11 MTs Ketangga 10 224 13 9 1 2,000 Fair
12 MTs Bagik Papan 3 52 8 8 3 250 Poor
Source : Data from each school, June and July 1999.
Note : * n.a.
* monthly contribution, quarterly contribut ion not included;
Source: schools.�
�
The traveling distance between home and school. This tends to impact the ability of many
students to take in the subject matter taught in lessons, and also accounts for large quantities
of lost study time. In Tangerang, some students have to walk or ride a bike between 2�3 km to
and from school. In some locations in Kabupaten Pontianak, students have to use boats to travel
to school, even though the actual traveling distance is not extensive. As a result, there are
secondary school students who decide to change their education program to the Open Secondary
School (SLTP Terbuka) which is only held for 2 days a week at the school. The teachers take turns
teaching lessons for the remainder of the school days at a location near the student�s home.
School operational funds. The amount of funding for schools is determined by the School Budget
(RAPBS). The main contributors to the RAPBS are community members and students� parents
and guardians, providing 87% of the funding in 1998/1999 and 81% in 1999/2000. Meanwhile,
the government is only responsible covering the remainder of the funding. For example, the
RAPBS for one Primary School in Tangerang in 1998/1999 was Rp15,188,500, of which the
government only provided Rp1.9 million (see also Table 19 and Table 19a).
Prior to the introduction of the SSN Scholarships and Block Grants Program, in many cases,
schools were trying to find ways to assist the poor or orphaned students. This included
exempting these students from paying the BP3 fees, obtaining special funding through BP3,
The SMERU Research Institute, September 2003���
and through acquiring resources from those students from more prosperous families (who were
asked to contribute Rp100 per month to support those in need). Other sources included
contributions from mosques and other scholarship programs. In West Java the regional
government has also raised funds through reriungan sarumpi.6
The size of the monthly BP3 contribution paid by students from both public and private schools
varies greatly, particularly across urban areas. In Pontianak, for example, it ranges from Rp150 to
Rp1,000 per month for primary schools. The exceptions in this kabupaten areMT schools, where
BP3 ranges between Rp1,500 and Rp2,500 per month, and in some elite private schools it
reaches Rp15,000 per month. For junior secondary schools, the BP3 fee is between Rp2,500 and
Rp5,000 per month, apart from one private SLTP where the rate was Rp30,000 per month. On
average only 60% of the students are able to pay their fees by the due date.
In Tangerang, the Bupati has instructed all primary schools to hand over 20% of their total
BP3 monthly revenue to the Kecamatan Office of Education, allegedly for the coordination of
BP3 activities.7
20% of the amount given to the Kecamatan office is then to be delivered to
the relevant authority at kabupaten level. The amount passed on to these offices is based on
the BP3 fees charged to all students, not the actual revenue that is collected. This is despite
some schools only receiving 60 % of BP3 fees. One school declared that the amount
submitted to the regional offices was 20% of the 80% of their total BP3 revenues. While other
schools complained that the submitted 20% is calculated based on the 100% of total BP3 fees
charged to students.
The attention and interest of parents. The time and attention parents commit to their
children�s education appears to vary between kabupaten. Based on SMERU�s observations, in
Kabupaten Sleman, parents are highly concerned about their children�s education and
progress. In contrast, parents in Tangerang show little interest, especially in regards to their
child�s educational performance, and the possibility of their children continuing on to a
higher level of education. This is similarly the case in Kabupaten Pontianak amongst various
sections of the population. In most cases, school reports are handed over directly to the
students instead of to the parents. However, in Yogyakarta, the schools invite the parents to
come to school to collect the reports. SMERU�s observations in East Lombok found that in
general, parents� interest in their children�s school performance was also very low. At the
same time, there were high expectations in this region that children would continue on to
higher levels of education. The employment situation in each area also influences the
attitudes of both parents and students. Furthermore, both groups are also affected by cultural
influences. Overall, it is not surprising that many students are prepared to quit school to work
as laborers, especially if there are few employment opportunities in the region for those with a
higher educational background (for example, in Tangerang and East Lombok, many factories
accept workers with primary school education).
• Pontianak. In coastal areas, children can find work by helping fishermen to sort prawns
and fish. They earn between Rp3,000 and Rp5,000 each day. This kind of work is usually
undertaken in the afternoon or evening. In the farming and inland areas, young children
help their parents in the rice-fields, tapping rubber, or by looking after their younger
siblings at home when their parents are absent. There is still a lack of awareness, amongst
parents in this area, of the importance of schooling. This is particularly the case within the
Madurese community, where daughters are married off at a very young age, sometimes even
before they have finished primary school. In the Chinese community, if children indicate 6Reriungan sarumpi is a local tradition of community sharing the burden. In this case students from
better off families contribute Rp200/month. The money collected is administered by a kecamatan officer
in charge of educational affairs and is used to assist those students in need.
7SK Bupati Tangerang No. 05/1993.

The SMERU Research Institute, September 2003���
a strong interest in continuing their studies, parents are generally supportive. However,
those who do not continue at school are encouraged to find employment.
• Tangerang. The parents in this kabupaten pay very little attention to their children�s
school performance, and their children�s educational development. Apart from the low
educational background of many parents, long working hours as farmers or fishermen also
effects their attitudes toward education. Some schools report that parents who are
newcomers to the region display greater interest in their children�s education. For
example, they ask about the school�s development and their children�s progress. This
could be the result of a better educational background and the greater mobility of these
migrant parents, compared to the local people.
• Sleman There appears to be a high level of interest amongst parents regarding their
children�s education, in the villages of the visited by SMERU in the Kabupaten Sleman.
There is also great desire for children to achieve a higher level of education. However,
because many of the families are poor, they are frustrated by limited economic resources.
There is a strong drive amongst parents to support their children�s education, and this is
evident in their attempts to: 1) borrow money from neighbors or relatives; 2) postpone
payment of school fees/BP3 fees for up to 12 months; and 3) visit the school to seek a
reduction (or if possible, an exemption) of the BP3 fees. In addition, parents are prepared to
try to enroll for their children in a good quality school. Children who manage to achieve
high NEM scores are given the freedom to select schools of their own choice. Consequently,
some parents have to pay higher education expenses and transport costs when their children
are accepted at a better school, especially if it is quite a distance from their village.
• East Lombok. In East Lombok, although many parents wish their children to achieve a higher
level of education, they pay inadequate attention to their children�s school performance. For
example, few parents review school reports when these are distributed, unless they themselves
have a higher level of education.
Choice of school. As a rule children and parents tend to choose public schools since these
schools offer a better standard of education than most private schools, and are generally much
cheaper. However, this may not apply in all cases. Public schools that are already considered
to have high educational standards will only accept students with high grades (mid to upper
rank). These schools also require a larger contribution from students for school facilities and
extra-curricular activities, such as computer classes. However, there are some exceptions to
this, where for example, many Moslem parents and students prefer to choose MI andMTs due
to their strong religious orientation.
• Pontianak. There appears to be some differences between schools in the urban and rural
areas in this kabupaten. In the urban areas, such as Kecamatan Sungai Raya, private
schools offer a better standard of education, and therefore are the preferred institution for
students from well-off families. In rural areas, such as Kecamatan Sungai Kunyit, private
schools generally of lower quality of education and school conditions. As a result, these
private schools are a last resort for those who have failed to gain a place in public schools.
Normally, private schools in urban areas have their own permanent school buildings,
whereas in rural areas they often use existing public school buildings. However, some
MI/MTs schools have reasonably good school buildings, especially those located in the
Madurese communities around Pontianak.
• Tangerang. In Tangerang, the MI and MTs schools have rapidly flourished, reflecting the
high demand for local Moslem schools. In Desa Kronjo, many public primary school students
also attend MI schools in the afternoon. During the National Final Educational Assessment
The SMERU Research Institute, September 2003��
(EBTANAS) many students choose between taking the examinations in MI schools or in
public schools. According to local informants, such a decision appears to be made not on the
basis of economic factors, but rather because of strongly held Islamic beliefs. Both types of
schools offer the same basic subjects, however MI schools allocate more time for Islamic
subjects. The classroom hours at the public schools have had to be decreased to make time for
a lunch break to cater for those students who attend theMI school in the afternoon.
Availability of school textbooks. In some relatively poor regions, for example in Tangerang,
textbooks are provided by schools but are kept at school, only being used during school hours. The
students are not obliged to own these books, and homework is given by copying exercises from the
textbooks. In both the kecamatan visited by SMERU in Tangerang, all public primary schools, MI,
junior secondary schools, and MTs, only provide textbooks for use during class time, not for use at
home. In the junior secondary schools, students are allowed to borrow books from the school library.
Consequently, each student is charged Rp600 per year to cover repairs and the replacement of
damaged books. However, the number of available textbooks in these schools is insufficient, where
two students frequently have to share the same book. These problems directly effect the quality of
education in these regions, especially when compared with those areas that have a higher standard of
living, where all children are able to afford textbooks.
��� ����������������������������������������� ������!�"����#���������
This section examines the data collected from the three regions during SMERU�s investigations, and
includes enrollment information as well as the drop out rates in these regions. The enrollment figures
are separated into theGross Enrollment Rate (APK)8
and theNet Enrollment Rate (APM).
It is important to obtain the clearest possible picture about school participation rates in the
years prior to the crisis. In order to examine this issue, the SMERU Team collected data on
enrollment from every school they visited. Efforts have also been made to obtain enrollment
data from the relevant education offices at the kecamatan and kabupaten levels, for all schools
in the kecamatan included in the study. This approach, however, has not been very effective.
Data on enrollments, broken down into grades over a period of several years, was only
available in two kecamatan in Kabupaten Sleman.
• Pontianak. Across the entire Province of West Kalimantan, the APM reached 94%, while
the APK exceeded 108%. However, at the junior secondary school level, the APM was still
very low, approximately 45%, while the APK was only 63%.
• Tangerang. Data obtained from the each of the Kecamatan Office of Education indicated that
gross enrollments in primary schools and MI in 1999/2000 in Tangerang were quite high, 115%
in Kecamatan Rajeg and 85% in Kecamatan Kronjo. However, the data at the kabupaten level
revealed that enrollments during the 1998/1999 period were much lower, both for SD/MI schools
and for SLTP/MTs schools. The enrollment rate in SD/MI schools at Kecamatan Rajeg was
77,5%(gross) and 67,7%(net), while at Kecamatan Kronjo it was 63,3% and 57,4% respectively.
8 The Gross Participation Rate shows the difference between the number of students at each level of
schooling (Primary School = 7-12 years; Junior High School = 13-15 years; Senior High School 16-18
years) and the total number of children in each respective age group for these s chool levels.
Gross Participation Rate = Number of students (Primary school)
Number of children aged 7-12 years old.
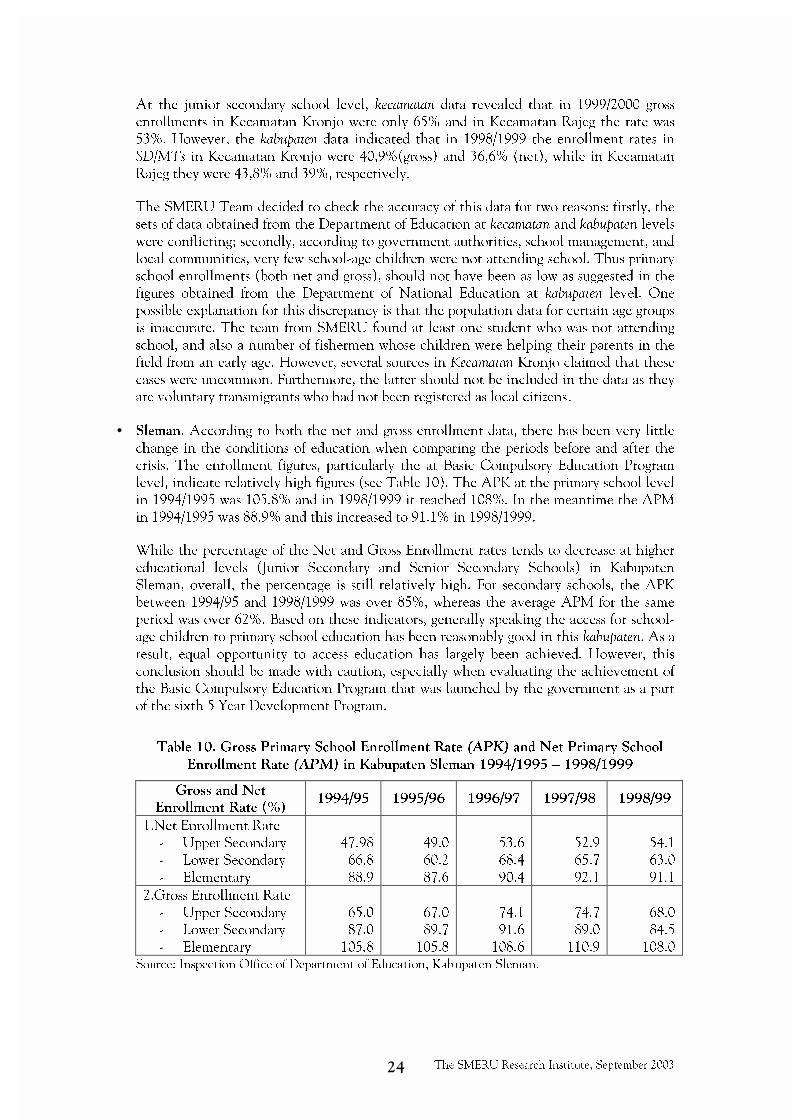
The SMERU Research Institute, September 2003�$�
At the junior secondary school level, kecamatan data revealed that in 1999/2000 gross
enrollments in Kecamatan Kronjo were only 65% and in Kecamatan Rajeg the rate was
53%. However, the kabupaten data indicated that in 1998/1999 the enrollment rates in
SD/MTs in Kecamatan Kronjo were 40,9%(gross) and 36,6% (net), while in Kecamatan
Rajeg they were 43,8% and 39%, respectively.
The SMERU Team decided to check the accuracy of this data for two reasons: firstly, the
sets of data obtained from the Department of Education at kecamatan and kabupaten levels
were conflicting; secondly, according to government authorities, school management, and
local communities, very few school-age children were not attending school. Thus primary
school enrollments (both net and gross), should not have been as low as suggested in the
figures obtained from the Department of National Education at kabupaten level. One
possible explanation for this discrepancy is that the population data for certain age groups
is inaccurate. The team from SMERU found at least one student who was not attending
school, and also a number of fishermen whose children were helping their parents in the
field from an early age. However, several sources in Kecamatan Kronjo claimed that these
cases were uncommon. Furthermore, the latter should not be included in the data as they
are voluntary transmigrants who had not been registered as local citizens.
• Sleman. According to both the net and gross enrollment data, there has been very little
change in the conditions of education when comparing the periods before and after the
crisis. The enrollment figures, particularly the at Basic Compulsory Education Program
level, indicate relatively high figures (see Table 10). The APK at the primary school level
in 1994/1995 was 105.8% and in 1998/1999 it reached 108%. In the meantime the APM
in 1994/1995 was 88.9% and this increased to 91.1% in 1998/1999.
While the percentage of the Net and Gross Enrollment rates tends to decrease at higher
educational levels (Junior Secondary and Senior Secondary Schools) in Kabupaten
Sleman, overall, the percentage is still relatively high. For secondary schools, the APK
between 1994/95 and 1998/1999 was over 85%, whereas the average APM for the same
period was over 62%. Based on these indicators, generally speaking the access for school-
age children to primary school education has been reasonably good in this kabupaten. As a
result, equal opportunity to access education has largely been achieved. However, this
conclusion should be made with caution, especially when evaluating the achievement of
the Basic Compulsory Education Program that was launched by the government as a part
of the sixth 5 Year Development Program.
Table 10. Gross Primary School Enrollment Rate (APK) and Net Primary School
Enrollment Rate (APM) in Kabupaten Sleman 1994/1995 � 1998/1999
Gross and Net
Enrollment Rate (%)1994/95 1995/96 1996/97 1997/98 1998/99
1.Net Enrollment Rate
- Upper Secondary
- Lower Secondary
- Elementary
47.98
66.8
88.9
49.0
60.2
87.6
53.6
68.4
90.4
52.9
65.7
92.1
54.1
63.0
91.1
2.Gross Enrollment Rate
- Upper Secondary
- Lower Secondary
- Elementary
65.0
87.0
105.8
67.0
89.7
105.8
74.1
91.6
108.6
74.7
89.0
110.9
68.0
84.5
108.0
Source: Inspection Office of Department of Education, Kabupaten Sleman.
�

The SMERU Research Institute, September 2003���
The available cohort data is presented in Table 11, and shows the proportion of one cohort
of students who entered the first year of primary school and then continued to study until
Grade 6. In the case of Kabupaten Sleman, the figures refer to the total enrollment rates in
the Kecamatan Prambanan and Kecamatan Depok, whereas in other areas they refer to the
total enrollment rates over time, in a number of schools.
�
Table 11. Proportional Cohort of Students Entering Primary School
Reaching Grade 6 in a Survey Sample of Primary Schools,1991/1992 � 1995/1996 (%)
Admission Year Pontianak1)
East Lombok2)
Sleman3)
Tangerang4)
1991 / 1992 56 n.a n.a 49
1992 / 1993 69 n.a n.a 48
1993 / 1994 52 65 89 51
1994 / 1995 67 70 * 96 * 56
1995 / 1996 78 * n.a n.a 72 *
Source: Data from each school.
Note: * Up to Grade 5.
1) Cohort data of admission year 1991/1992 and 1992/1993 based on figures from 2 schools,
1993/1994 from 3 schools, and 1994/ 1995 and 1995/1996 from 4 schools.
2) Cohort data of admission year 1993/94 based on figures from 3 schools, and admission year
1994/1995 on figures from 4 schools.
3) Based on figures from all schools at the surveyed kecamatan.
4) Based on figures from 3 schools.
If the above data is accurate, then it demonstrates the importance of providing information
about the proportion of students that have actually completed primary school during the 1990s.
However, before commenting on the results, several of weaknesses in the research approach
need to be clarified. Firstly, the data is not, strictly speaking, cohort data. We are not certain as
to exactly how many of the same students enrolling in Grade 1 have managed to successfully
reach Grade 6. This is because the calculations are based on the simple class enrollments in the
each grade over several consecutive years. If no students repeat any classes, and no students have
entered these schools at grades above Grade 1, then the number of students in Grade 6 in year
(x + 6) should be the same students registered in Grade 1 of year x.
In the case of the primary schools, SMERU�s estimates are quite reliable, due to the very low
number of students repeating grades, and small numbers of new students. The effect would be
even less significant if the number of those repeating a grade changes little from year to year,
and the number of newcomers, and those pupils leaving school are balanced.
Concerning the exit and entry of primary school students, it is reasonable to assume that
student entry and exit would be approximately equal. This is apart from those areas with high
levels of in-migration or out-migration rates, or those areas where students are likely to move
to schools located outside the area. Kabupaten Sleman was the region observed as having a
high migration rate, which results in students changing schools. Apart from Kabupaten
Sleman, it is realistic to assume that in the other areas investigated, there is a balance
between the number of students entering and exiting schools due to migration. It was also
noted that students at higher levels of education are the ones who tend to move to schools
located in different regions.
Another weakness in the data is that in most cases the information is only based on a small
number of schools. There may be special factors affecting the cohort continuation rates in these
schools, and consequently the results must be interpreted with caution. Nevertheless, the data
should be given greater credence if it is congruent with the other findings in the research.

The SMERU Research Institute, September 2003���
The data presented in the Table 11 highlights several important issues about the percentage
of primary school-age children in Indonesia that have completed primary school education.
The data from the two kecamatan investigated in Kabupaten Sleman shows a reasonably high
percentage (90% or more) of students who have completed primary school. However, in the
other three regions, the available data (which is based on only a small number of schools in
each region) indicates that only between half and three quarters of primary school students
have actually finished their primary education. This figure was well below the official national
continuation rate for students going to high school. Admittedly, these regions are not
statistically representative of the national state of education. Nevertheless, the findings should
be a matter of high concern because the state of education may well reflect more widespread
low levels of completing primary school.
The impact of the monetary crisis is not reflected in such data because it only indicates the
number of students continuing their education over a period of six consecutive years who
started before the crisis. For a number of cohorts (those enrolled in primary schools from
1991/1992 to 1992/1993) these six years covered the pre-crisis period, however, the following
cohorts also included some of the crisis period.
Table 12 highlights the effect of the crisis on continuation rates at the primary school level.
This table compares the continuation rates for two consecutive years of Grade 1, 2, 3 and 4
during the period immediately prior to the crisis, with the continuation rates for the same
grades and period, during the crisis. Thus, a brief comment about the overall pattern of
continuation in school is necessary to clarify the data. Apart from the pre-crisis period in
Kabupaten Pontianak and Kabupaten East Lombok, the data indicates that there have mainly
been problems with the continuation from Grade 4 to Grade 6, not with the continuation
rates in earlier grades. This is a reasonable deduction because the problems with school
continuation rates do not start until the later years in primary school when employment
opportunities begin to be available. In addition, the probability of marriage for some students
is unlikely, prior to the last years of primary school.
Table 12. Continuation Rates of Primary School Students
Before and After the Crisis (%)
Kabupaten Grade 1 To
Grade 3
Grade 2 To
Grade 4
Grade 3 To
Grade 5
Grade 4 To
Grade 6
Pontianak1)
Year 1994/1995 � 1996/1997 79 87 83 86
Year 1996/1997 � 1998/1999 99 98 92 71
Tangerang2)
Year 1994/1995 � 1996/1997 90 84 78 61
Year 1996/1997 � 1998/1999 112 100 80 70
Sleman3)
Year 1994/1995 � 1996/1997 97 95 93 91
Year 1996/1997 � 1998/1999 100 102 99 96
East Lombok4)
Year 1994/1995 � 1996/1997 78 100 79 73
Year 1996/1997 � 1998/1999 90 87 90 69
Source: Data from each school.
Note:1)Data from 4 schools.
3)Data from schools in 2 kecamatan.
2)Data from schools in all kabupaten.
4)Data from 4 schools. �
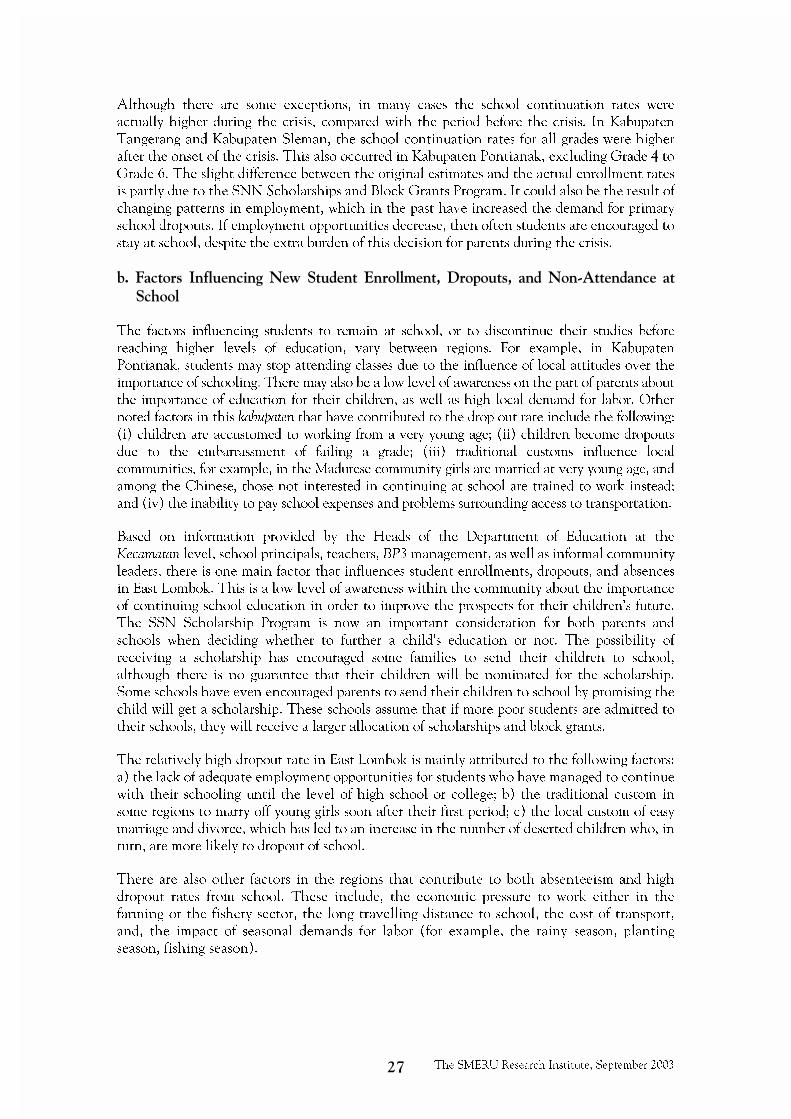
The SMERU Research Institute, September 2003���
Although there are some exceptions, in many cases the school continuation rates were
actually higher during the crisis, compared with the period before the crisis. In Kabupaten
Tangerang and Kabupaten Sleman, the school continuation rates for all grades were higher
after the onset of the crisis. This also occurred in Kabupaten Pontianak, excluding Grade 4 to
Grade 6. The slight difference between the original estimates and the actual enrollment rates
is partly due to the SNN Scholarships and Block Grants Program. It could also be the result of
changing patterns in employment, which in the past have increased the demand for primary
school dropouts. If employment opportunities decrease, then often students are encouraged to
stay at school, despite the extra burden of this decision for parents during the crisis.
%�� &������� '���#�����(�)�*� ��#!���� �����������"����#���� ��!�)��+,����!����� ����� ����
The factors influencing students to remain at school, or to discontinue their studies before
reaching higher levels of education, vary between regions. For example, in Kabupaten
Pontianak, students may stop attending classes due to the influence of local attitudes over the
importance of schooling. There may also be a low level of awareness on the part of parents about
the importance of education for their children, as well as high local demand for labor. Other
noted factors in this kabupaten that have contributed to the drop out rate include the following:
(i) children are accustomed to working from a very young age; (ii) children become dropouts
due to the embarrassment of failing a grade; (iii) traditional customs influence local
communities, for example, in the Madurese community girls are married at very young age, and
among the Chinese, those not interested in continuing at school are trained to work instead;
and (iv) the inability to pay school expenses and problems surrounding access to transportation.
Based on information provided by the Heads of the Department of Education at the
Kecamatan level, school principals, teachers, BP3 management, as well as informal community
leaders, there is one main factor that influences student enrollments, dropouts, and absences
in East Lombok. This is a low level of awareness within the community about the importance
of continuing school education in order to improve the prospects for their children�s future.
The SSN Scholarship Program is now an important consideration for both parents and
schools when deciding whether to further a child�s education or not. The possibility of
receiving a scholarship has encouraged some families to send their children to school,
although there is no guarantee that their children will be nominated for the scholarship.
Some schools have even encouraged parents to send their children to school by promising the
child will get a scholarship. These schools assume that if more poor students are admitted to
their schools, they will receive a larger allocation of scholarships and block grants.
The relatively high dropout rate in East Lombok is mainly attributed to the following factors:
a) the lack of adequate employment opportunities for students who have managed to continue
with their schooling until the level of high school or college; b) the traditional custom in
some regions to marry off young girls soon after their first period; c) the local custom of easy
marriage and divorce, which has led to an increase in the number of deserted children who, in
turn, are more likely to dropout of school.
There are also other factors in the regions that contribute to both absenteeism and high
dropout rates from school. These include, the economic pressure to work either in the
farming or the fishery sector, the long travelling distance to school, the cost of transport,
and, the impact of seasonal demands for labor (for example, the rainy� season, planting
season, fishing season).

The SMERU Research Institute, September 2003���
If the income earned by a child significantly contributes to the family income, then quite often
the introduction of the scholarship program is not considered important by the family. As a
result, in a number of cases scholarships have been turned down by parents, despite repeated
offers from the school involved. Thus, in these difficult circumstances, parents may adopt a
pragmatic approach, presuming that even if their children continue their schooling it will be
still difficult for them to find jobs after they complete their education. Consequently, some
parents prefer their children to find a job immediately, or, arrange for their child to be married.
���- ��'���������� ������������ !#��������������
In general, the impact of the crisis has not been significant in plantation areas and fishing
villages. Both of these have benefited from the crisis due to the increased prices of export
commodities such as pepper, rubber, palm oil, prawns and fish. The people in the fishing
villages in Kabupaten Tangerang, for example, have only recently begun to suffer from the
crisis after a recent fall in prices.
The crisis has more heavily affected workers in the industrial sector, rice farmers with
smallholdings, farm laborers, and small traders. Retrenched workers and industrial laborers
have also been hard hit by the crisis.
��� ����������������
The SMERU Team found that the APM and APK indicated that because of the crisis, there
were different trends between primary and junior secondary schools, and between different
kabupaten in those areas investigated by SMERU. This was reflected by significant changes in
new enrollments between 1997/1998, 1998/1999, and 1999/2000.
• Pontianak. The impact of crisis on new enrollments has not been significant since almost
all school-age children are sent to school. Nevertheless, a decline in the number of new
enrollments in this area has been noted due to the following factors: (i) a declining
number of school-age children resulting from the success of the local Family Planning
Program; (ii) relocation of one school displaced by a project in a location close to another
primary school, causing the prospective students to choose between the two schools; and
(iii) a mass exodus from rural villages to coastal areas or other safe areas due to recent
ethnic clashes in West Kalimantan. As of now, school re-grouping is being considered,
particularly among the primary schools. Several villages are also to be re-grouped because
there has been a sharp loss of inhabitants, such as in Kecamatan Sungai Kunyit.
• Tangerang. The Gross Enrollment Rate of the junior secondary schools has dropped from
56% to 49.6% between 1997/1998 and 1998/1999, but the Net Enrollment Rate slightly
increased over the same period. This rather strange finding appears to reflect inaccurate data
in Tangerang, particularly at Kecamatan Kronjo.
The impact of the crisis on education has also been reflected by the continuation rate to
junior secondary school. Based on data from the Office of the Department of Education in
Kabupaten Tangerang, the continuation rate from Grade 6 SD/MI schools to Grade 1
SLTP has gone down from 72% to only 54.3% between 1997/1998 and 1998/1999.
• Sleman. The crisis appears to have had no real impact on education. In fact, every year the
number of new enrollments in primary schools has been increasing. Trends in the enrollment
rates in primary schools in Yogyakarta as a whole were as follows: 88.9% (1994/1995), 88.95%
(1995/1996), 87.6% (1996/1997), 92.1% (1997/1998), and 91% in 1998/1999. However,
within the study area, one public primary school in Desa Madurejo, Kecamatan Prambanan,

The SMERU Research Institute, September 2003���
has experienced a decline in new Grade 1 students. In 1998/1999 the number of students per
class has come down to 21, compared to 35 in 1996/1997 and 22 in 1997/1998.
.�/���A poor IDT Village Girl Continues to Study in the Face of Adversity
Sami, a Grade 1 high school student, is from a low-income family in one of the IDT villages
in Yogyakarta. Her father works as a part-time laborer in the marble industry with an average
daily wage of Rp5,000/day, which supports seven members of the family. Her mother sometimes
sells firewood for additional income and collects grass to feed their cattle. Sami is the third
daughter of five children. For different reasons, her two elder siblings stopped attending junior
secondary school. The eldest child left school because the money was needed to pay for the
education of her younger siblings, while the elder brother dropped-out because he didn�t think he
would be able to catch up in class, after suffering a broken arm shortly before the examination day.
After finishing primary school, Sami did not enroll immediately at junior secondary school;
instead, she began to help her parents to collect fodder. Later she worked as a housemaid for 5
months in a neighboring kecamatan. One day, the School Principal of aMadrasah Tsanawiyah,
an Islamic Junior secondary school, called by and suggested that Sami continue her studies.
The school resolved to exempt her from paying most of the contributions and fees. All she
had to pay was half of her school fees. Despite this generous assistance, her parents were not
able to pay her tuition fees for nearly 2 years. After her graduation, Sami�s parents still had no
means to pay for their daughter�s education at the next level. She again helped her parents
collecting grass for the next 8 months. Then Sami found work with a family who owned a
satay food stall, and they were prepared to support her Upper Secondary School education.
Her employer was willing to pay all her school expenses, provided that she worked in the food
stall. After a few months, Sami found it hard to work and study at the same time. She left her
job but is now continuing her schooling, despite not being able to pay her school fees. �
• East Lombok. Instead of decreasing, student enrollment rates in East Lombok have
actually been increasing during the economic crisis for the following reasons: a) the
number of school-age children has increased, as has the number of school rooms; b) the
number of students graduating from every school level has increased, as has the number
of those who would like to continue to higher education level; c) the level of parents�
awareness about their children�s education appears to have grown; and d) motivated by
the expectation of obtaining Scholarships and Block Grants assistance, schools have
actively encouraged parents to send their children to school.
In terms of the Net Enrollment Rates and the Gross Enrollment Rates, there has been a
significant decrease in primary school enrollment rates during the 1999/2000 school year;
but at secondary school level, both rates have showed an increase. The complete data is
presented in the following Table 13.
When the declining proportion of the total number of primary school-age (7-12 years) in
1999/2000 is compared to the previous year, and this is compared to the total of population
in the 7-12 year age-group, the declining Net Enrollment Rate is rather a reflection of an
increase in the population of this age-group, i.e. from 147,399 to 168,191. At the same
time, the number of students enrolled only increased from 145,563 to 150,211. The same
trend was evident in the Net Enrollment Rate of SD and MI students and also in the
Package A Study Group (Kejar Paket A, an education package equal to primary school).

The SMERU Research Institute, September 2003�
If it is assumed that the economic crisis in East Lombok began to take effect in the
1997/1998 school year, the available data indicate that there has been no significant
negative impact on education sector as a result of the crisis. This is indicated by: a) the
increased number of students in all three levels of education (elementary, lower
secondary, and upper secondary schools); b) the decline in the number of dropouts; and
c) the data on Gross Enrollment Rates.
The increased number of students in all three levels was probably a result of the
following: a) an increase in the school-age population that may have led to higher
enrollments; b) increased number of graduates at each level (SD and SLTP) who
continued to higher education level. This has also been supported by significant
increase in the number of school buildings and classrooms.
If it is assumed that the economic crisis in East Lombok began to take effect in the
1997/1998 school year, the available data indicate that there has been no significant
negative impact on education sector as a result of the crisis. This is indicated by: a) the
increased number of students in all three levels of education (elementary, lower
secondary, and upper secondary schools); b) the decline in the number of dropouts; and
c) the data on Gross Enrollment Rates.
The increased number of students in all three levels was probably a result of the
following: a) an increase in the school-age population that may have led to higher
enrollments; b) increased number of graduates at each level (SD and SLTP) who
continued to higher education level. This has also been supported by significant increase
in the number of school buildings and classrooms.
Table 13. Development of Net Enrollment Rates and Gross Enrollment Rates for
the 9-years Basic Compulsory Education Program in East Lombok (%)
YearLevel of School
1994/
1995
1995/
1996
1996/
1997
1997/
1998
1998/
1999
1999/
2000
Primary School
1. SD +MI
2. Incl. Package A
90.8
(104.5)
91.2
(104.9)
92.9
(104.9)
93.4
(105.5)
93.9
(107.4)
94.8
(108.3)
96.7
(111.2)
97.5
(112.1)
98.8
113.1
99.5
(113.9)
89.3
(102.0)
89.6
(102.3)
Junior Secondary School
1. SLTP*)
2. SLTP**)
34.0
(47.5)
34.5
(48.1)
38.8
(52.8)
39.6
(39.6)
44.0
(55.4)
45.7
(45.7)
48.3
(58.9)
49.4
(49.4)
49.9
(63.6)
51.5
(51.5)
54.7
(71.8)
56.0
(73.0)
Source: Planning Consolidation Project Section, NTB Regional Office of Dept. of Education,
1998; and statistics for the 9-years Compulsory Education Program, NTB Regional Office
of Dept. of Education, 1999.
Note: *) = Net Enrollment Rates for SLTP +MTs + SLTP Terbuka.
**) = Net Enrollment Rates for SLTP + MTs + SLTP Terbuka + Package B (an education
package equal to junior secondary school ).
() = Figures in brackets are Gross Enrollment Rates.
�
�
�
�
�
�
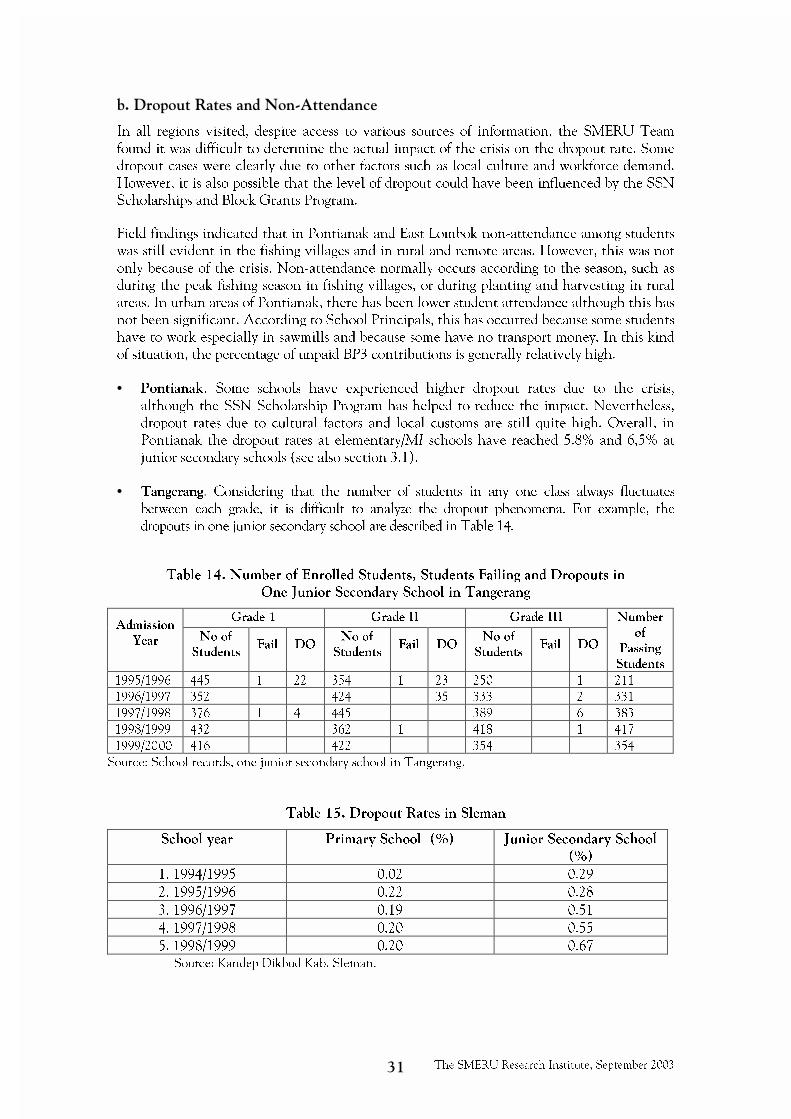
The SMERU Research Institute, September 2003��
%��"����#����������!�)��+,����!�������
In all regions visited, despite access to various sources of information, the SMERU Team
found it was difficult to determine the actual impact of the crisis on the dropout rate. Some
dropout cases were clearly due to other factors such as local culture and workforce demand.
However, it is also possible that the level of dropout could have been influenced by the SSN
Scholarships and Block Grants Program.
Field findings indicated that in Pontianak and East Lombok non-attendance among students
was still evident in the fishing villages and in rural and remote areas. However, this was not
only because of the crisis. Non-attendance normally occurs according to the season, such as
during the peak fishing season in fishing villages, or during planting and harvesting in rural
areas. In urban areas of Pontianak, there has been lower student attendance although this has
not been significant. According to School Principals, this has occurred because some students
have to work especially in sawmills and because some have no transport money. In this kind
of situation, the percentage of unpaid BP3 contributions is generally relatively high.
• Pontianak. Some schools have experienced higher dropout rates due to the crisis,
although the SSN Scholarship Program has helped to reduce the impact. Nevertheless,
dropout rates due to cultural factors and local customs are still quite high. Overall, in
Pontianak the dropout rates at elementary/MI schools have reached 5.8% and 6,5% at
junior secondary schools (see also section 3.1).
• Tangerang. Considering that the number of students in any one class always fluctuates
between each grade, it is difficult to analyze the dropout phenomena. For example, the
dropouts in one junior secondary school are described in Table 14.
Table 14. Number of Enrolled Students, Students Failing and Dropouts in
One Junior Secondary School in Tangerang
Grade 1 Grade II Grade IIIAdmission
Year No of
StudentsFail DO
No of
StudentsFail DO
No of
StudentsFail DO
Number
of
Passing
Students
1995/1996 445 1 22 354 1 23 250 1 211
1996/1997 352 424 35 333 2 331
1997/1998 376 1 4 445 389 6 383
1998/1999 432 362 1 418 1 417
1999/2000 416 422 354 354
Source: School records, one junior secondary school in Tangerang.
�
Table 15. Dropout Rates in Sleman
School year Primary School (%) Junior Secondary School
(%)
1. 1994/1995 0.02 0.29
2. 1995/1996 0.22 0.28
3. 1996/1997 0.19 0.51
4. 1997/1998 0.20 0.55
5. 1998/1999 0.20 0.67
� ���Source: Kandep Dikbud Kab. Sleman.
� �

The SMERU Research Institute, September 2003��
• Sleman. The number of dropouts occurring after the crisis has been higher compared
with the period before crisis. As is highlighted in Table 15, the crisis has not had much
effect on the dropout rates in primary schools, but the dropout rates in junior secondary
schools have risen significantly since the crisis. Nevertheless, the dropout rates at both
levels are relatively low.
The crisis appears to have affected the number of dropouts at the junior secondary school
level. Generally, the cost of education for junior secondary schools is higher than the
cost for attending primary schools; therefore, the financial capacity of the parents has a
significant influence on the dropout rates.
�• East Lombok. Kabupaten statistics indicate that while the number of dropouts at the
primary school level generally decreased during the crisis, they have tended to increase
at the secondary school level. Nevertheless, according to school principals in several
primary and junior secondary schools in two kecamatan visited by SMERU, the number
of dropouts at both levels has tended to decline. There are several contributing factors
such as: a) an increased parental awareness about the importance of education; b)
scholarships have successfully reached the intended beneficiaries (low-income families
or those students in danger of becoming dropouts); c) there has been a recent move
within certain communities to end the custom of marrying off young daughters (a
penalty of Rp100,000 to Rp300,000 has been imposed although this is yet not fully
effective). In addition, despite the crisis there are several villages where people have
actually begun to enjoy better living conditions because they have obtained steady jobs
in the informal sector. This has enabled them to continue sending their children to
school until the end of secondary school.
���0�1������-��� ���2���1��������!�3����������!�- ����'���������� ��4#��������� !#��������
The gross salary of public primary school teachers ranges from Rp350,000 to Rp1
million/month. This amount is considered reasonable, where most teachers are not forced to
find additional sources of income, even during the crisis. However, the situation is very
different for private school teachers, whose salaries are based on their actual number of
teaching hours as well as the school revenue generated from tuition fees, BP3 contributions
and other sources. The amount they earn is far lower than their counterparts in public
schools; it is sometimes even less than the minimum daily wage. The salary or honorarium of
part-time public or private school teachers ranges between Rp60,000 and Rp75,000. The
Team found in one case that teachers in a new MTs received only Rp12,500 per month.
Many teachers have relied on additional income from second jobs, even before the crisis
erupted. Some work in other schools as part-time teachers, others venture into small
businesses, or give private lessons.
SMERU found that the rate of teacher attendance at classes has not changed significantly
during the crisis, where in general teachers have continued to work according to their
schedules. Students also gave no indication of any changing pattern in teacher attendance
as a result of the crisis. Considering that efforts to earn additional income are not a new
phenomenon, any significant impact of the crisis on the quality of teaching is impossible
to detect.
• Pontianak. Teachers in remote areas have been hit hardest by the crisis because, unlike
their colleagues in urban areas, they have fewer opportunities to earn additional income,
such as giving private lessons. Nevertheless, the rate of teacher attendance has remained
high, apart from teachers or school administrators living long distances away from the school

The SMERU Research Institute, September 2003�
occasionally missing class because of public transport problems. In general, there has not
been a negative impact of the crisis on teaching standards as is clearly indicated by the
continuously high number of graduating students and steady average ofNEM scores.
The level of teacher motivation and activity has also been relatively good. For example,
only 2% of the approximately 800 primary school teachers in Kecamatan Sungai Raya
have been frequently absent from school, and at junior secondary school level the
percentage has also been relatively insignificant.
• Tangerang. Public school teachers, both permanent and temporary worker, receive
Rp25,000 per month as an incentive from the local government. However, there is no
similar incentive for madrasah teachers, where despite the same high level of
responsibility, they have always received salaries, which are significantly lower than
public school teachers. The remuneration of part-time madrasah teachers is around
Rp3,000 to Rp4,000/hour. In some madrasah, the payment of part-time teachers� salaries
has sometimes been delayed due to the late payment of students� fees. Despite this, there
has been little effect on teacher morale or their motivation to teach.
The mandatory number of teaching hours for primary/MI school teachers is 18 hours,
while teachers in secondary schools/MTs teach for 24 hours. Any additional teaching
hours are considered overtime. This arrangement also applies to those secondary school
teachers who teach in the Open Secondary School.
To cope with the impacts of the crisis, pressure from the Board of Teachers in one public
junior secondary school resulted in changes to the teaching schedule to allow each
teacher two days absence per week to earn additional income. This was also a strategy to
reduce transport expenses. However, to avoid any overall reduction in teaching hours,
each teacher now has to work from morning until afternoon on those days when they are
present. Although the teachers claim that there has been no impact on the quality of
their work, and those students interviewed had not noticed any difference, the SMERU
Team suspects that the work pressures will eventually affect teaching standards.
• Sleman. Even before the crisis, many teachers in Kabupaten Sleman had other sources of
income from either agricultural work, home industries, or small business. In addition,
some schools already have their own Savings and Loan Cooperatives (Koperasi Simpan
Pinjam � Kospin). During difficult times, or when members are in need of cash, Kospin are
able to provide low-interest loans (about 1% per month) of up to Rp2 million. Other
sources of loans (particularly for civil servants) include banking institutions such as Bank
Pembangunan Daerah and other private banks. Madrasah teachers can also apply for
loans from the Department of Religious Affairs Cooperative (Koperasi Departemen Agama
- KIPAS) which provides loans of up to Rp2 million at very low interest.
In one private senior secondary school in Desa Sewon, the teachers� salaries did not
exceed Rp100,000 per month, and most teachers received substantially less. This school
operates under the auspices of a religious foundation that is unable to fully fund the
activities of the school. Despite their limited salaries, teachers remain enthusiastic about
persuading poor lower secondary school graduates to continue their education to senior
secondary school level. Every new school year, two teachers are assigned to visit local
schools and the nearby homes, especially those of poor families, to persuade children to
continue their education. Most private school teachers in Desa Sewon have additional
jobs or other sources of income to compensate for their low incomes.

The SMERU Research Institute, September 2003$�
Because of the late payment of student fees, many private schools have found it difficult
to pay teachers� salaries and the costs of school maintenance. To relieve the burden on
the school, besides increasing the amount of BP3 contributions, government assistance
through the SSN Scholarships and Block Grants program has sometimes been used to
cover some of the unpaid student tuition fees and BP3 contributions, and especially with
the purpose of paying teachers� salaries.
• East Lombok. In general, nearly all teachers have been very active with normal
working hours, which range from 16 to 32 hours per week. SMERU found no evidence
of teachers failing to attend school or reducing their teaching hours due to economic
hardship. Those schools with fewer teachers would normally have significantly high
teaching hours, while in those with an adequate staffing ratios each teacher is required
to teach 16 hours per week.
Some teachers from public primary and junior secondary schools, who teach in the
morning, also teach in madrasah schools in the afternoon. Based on the existing salary
system, teachers who have civil servant status receive significantly higher incomes than
those teachers in private schools (depending on years of service), and also have less need
to find additional sources of income. The gross salaries of government school teachers in
the two kecamatan investigated, ranged from Rp389,000 per month to Rp950,000 per
month. In comparison, part-time private school teachers (MI and MTs), who have been
seriously affected by the monetary crisis, only receive Rp10,000 to Rp20,000 per month
or between Rp2,000 to Rp2,500 per hour.
Nevertheless, teachers in most of private schools visited by SMERU have stated that
neither they nor their wives have second jobs. There were only few also taught in other
schools (elementary, lower secondary or Madrasah schools), where they receive
approximately the same level of remuneration. From the 12 schools visited, in only one
school were teachers involved in informal sector activities. One teacher described how
he and his wife make coconut fiber brooms after school hours until late at night. Both
produce up to 250 pieces each month and this enables them to earn Rp500,000 per
month in additional income.
!�� !#�������4#�������
The quality of education can be determined by either examining the existing educational
process or through an analysis of the results achieved. The education process includes
teaching materials, methodology, school facilities, administrative support, infrastructure, and
other resources, as well as the supporting environment. Education results refer to the
achievements of schools over a specific period of time, which can be determined through
academic test results such as EBTANAS.
One of the yardsticks commonly used to evaluate the quality of education is the NEM scores
for individual students. These scores can be averaged to provide an overall NEM score for a
particular school or a particular area. By comparing the NEM scores achieved by particular
schools and regions over the last few years some tentative conclusions can be drawn about the
impact of the crisis on the quality of education. Table 16 provides the NEM scores from
before and after the crisis in those kecamatan and kabupaten visited by SMERU.
• Pontianak. In urban areas, the standard of education has been declining. One possible
reason for this decline is the increased price of school textbooks. For example, primary -
level textbooks that cost Rp2,000 prior to the crisis have increased to cost between
Rp7,000 and Rp10,000. Few students are able to afford to buy books, and this has to
affect students� learning process. Meanwhile, in rural areas, students seldom buy any
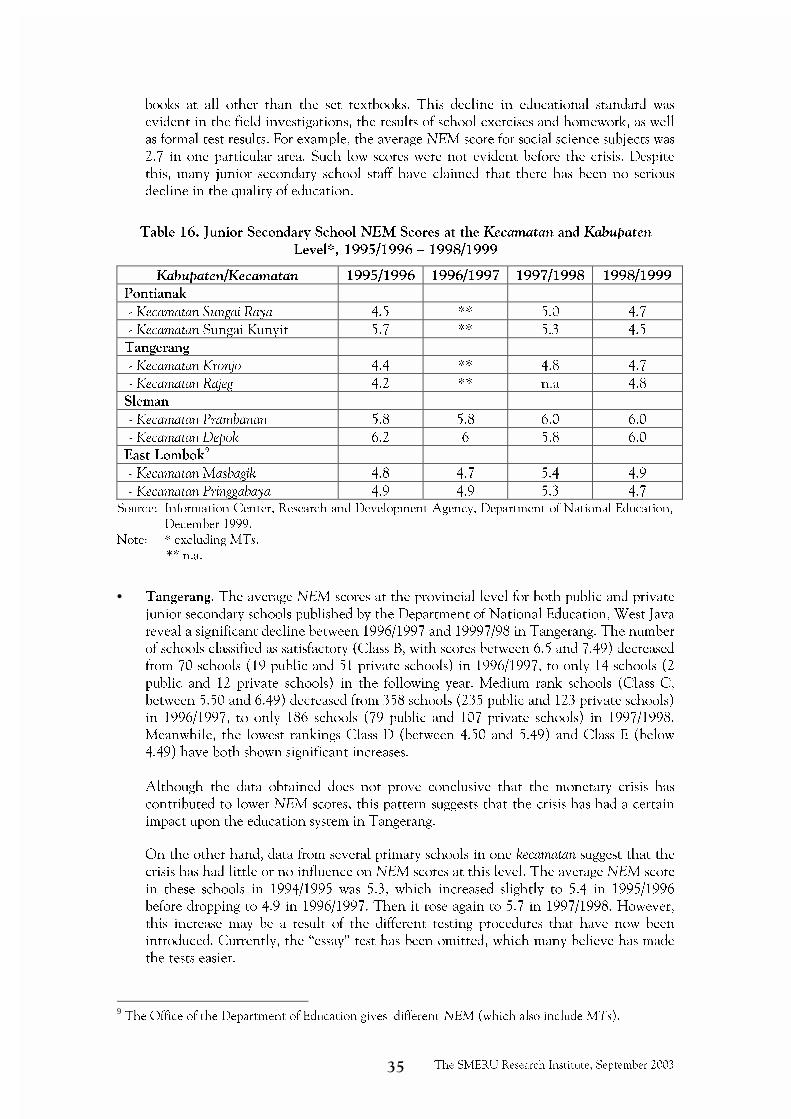
The SMERU Research Institute, September 2003��
books at all other than the set textbooks. This decline in educational standard was
evident in the field investigations, the results of school exercises and homework, as well
as formal test results. For example, the average NEM score for social science subjects was
2.7 in one particular area. Such low scores were not evident before the crisis. Despite
this, many junior secondary school staff have claimed that there has been no serious
decline in the quality of education.
Table 16. Junior Secondary School NEM Scores at the Kecamatan and Kabupaten
Level*, 1995/1996 � 1998/1999
Kabupaten/Kecamatan 1995/1996 1996/1997 1997/1998 1998/1999
Pontianak
- Kecamatan Sungai Raya 4.5 ** 5.0 4.7
- Kecamatan Sungai Kunyit 5.7 ** 5.3 4.5
Tangerang
- Kecamatan Kronjo 4.4 ** 4.8 4.7
- Kecamatan Rajeg 4.2 ** n.a 4.8
Sleman
- Kecamatan Prambanan 5.8 5.8 6.0 6.0
- Kecamatan Depok 6.2 6 5.8 6.0
East Lombok9
- Kecamatan Masbagik 4.8 4.7 5.4 4.9
- Kecamatan Pringgabaya 4.9 4.9 5.3 4.7
Source: Information Center, Research and Development Agency, Department of National Education,
December 1999.
Note: * excluding MTs.
** n.a.
• Tangerang. The average NEM scores at the provincial level for both public and private
junior secondary schools published by the Department of National Education, West Java
reveal a significant decline between 1996/1997 and 19997/98 in Tangerang. The number
of schools classified as satisfactory (Class B, with scores between 6.5 and 7.49) decreased
from 70 schools (19 public and 51 private schools) in 1996/1997, to only 14 schools (2
public and 12 private schools) in the following year. Medium rank schools (Class C,
between 5.50 and 6.49) decreased from 358 schools (235 public and 123 private schools)
in 1996/1997, to only 186 schools (79 public and 107 private schools) in 1997/1998.
Meanwhile, the lowest rankings Class D (between 4.50 and 5.49) and Class E (below
4.49) have both shown significant increases.
Although the data obtained does not prove conclusive that the monetary crisis has
contributed to lower NEM scores, this pattern suggests that the crisis has had a certain
impact upon the education system in Tangerang.
On the other hand, data from several primary schools in one kecamatan suggest that the
crisis has had little or no influence on NEM scores at this level. The average NEM score
in these schools in 1994/1995 was 5.3, which increased slightly to 5.4 in 1995/1996
before dropping to 4.9 in 1996/1997. Then it rose again to 5.7 in 1997/1998. However,
this increase may be a result of the different testing procedures that have now been
introduced. Currently, the �essay� test has been omitted, which many believe has made
the tests easier.
9 The Office of the Department of Education gives different NEM (which also include MTs).

The SMERU Research Institute, September 2003��
• East Lombok. The data in Table 17 indicates that while NEM scores have fluctuated
slightly each year from 1996/1997 to 1999/2000, they do not reflect any obvious
influence of the economic crisis on education. In 1998/1999, there was actually a slight
increase in NEM scores, confirming the view expressed by many teachers and school
principals that the crisis has had no significant negative impact on NEM scores.
Table 17. Primary and Secondary School NEM scores, Kecamatan Masbagik and
Pringgabaya, East Lombok, 1996/1997 � 1998/1999
YearNo
Kecamatan/
School Level1996/
1997
1997/
1998
1998/
1999
1999/
2000
I Kecamatan Masbagik
1. Primary Schools
2. Junior Secondary Schools
5.9
5.5
5.7
4.9
6.1
5.6
5.6
5.5
II Kecamatan Pringgabaya
1. Primary Schools
2. Junior Secondary Schools
6.1
5.3
6.1
4.8
6.1
5.0
5.9
5.0
III Kabupaten
1. Primary Schools
2. Junior Secondary School
5.9
5.3
5.8
4.8
6.1
5.2
5.5
5.0
Source: NTB Regional Office, the Dept. of Education, NTB, 1997-1999.
In some primary schools (both public and MI schools), the availability of scholarships
seems to have improved the performance of some students.10
In general, the economic
crisis has not affected education quality. Satisfactory teacher attendance in spite of the
shortage of books and equipment and limited facilities may have been another
contributing factor.
• Sleman. There has been no indication of declining student attendance as a result of the
crisis. Nevertheless, teachers report that more recently, some students seem to have less
capacity to absorb the lessons. In Kabupaten Sleman, according to teachers, the crisis has
affected the students� spirit. Some arrive late and appear to be disinterested during classes.
Teachers in one elementary school reported that several students from an IDT area fainted
during a recent school ceremony because they had no breakfast that morning. It appears
that the level of achievement of some students has declined recently. For example, in one
school in Kabupaten Sleman the average class scores in Grade 5 have fallen to below 6,
from the previous average of 7.
��� - ��'���������� ������������ !#��������� /��������
All parents throughout Indonesia are faced with the burden of spending a considerable
sum of money to send their children to school. When children are enrolled for the first
time in any school, they are required to pay an initial enrollment fee, widely known as
�building money� or �desk money�. The size of this payment depends on many factors �
the type of school, the area in which it is located, and its reputation. In addition, there
are many other expenses that paid on a monthly or even daily basis. These include the
10In one particular school both students and teachers spoke about the impact of an announced school
policy to cancel scholarships if recipients failed to achieve a satisfactory level of performance in their
quarterly school report.

The SMERU Research Institute, September 2003��
monthly BP3 levy, transport fares, the OSIS11
contribution, and daily pocket money. At
the secondary level, which includes junior secondary schools, there are also additional
extracurricular expenses, including payments for computer classes and various vocational
skills training classes. Other significant expenses incurred on a regular basis include: (1)
stationary and textbooks; (2) school uniforms (apart from the regular uniform, there are
also special uniforms for scouts, sport, appropriate clothing for madrasah schools), shoes,
and school bags; (3) test and examination fees, including those for quarterly tests, class
progress reports, national EBTANAS examinations, certificates, and photographs. In spite
of the continuing crisis, parents still need to find sufficient funds to cover all these
expenses. A rough estimate of the annual amount required is presented in Table 18 and
18a. The information was obtained through interviews with students, parents, teachers,
stores selling school uniforms, and peddlers selling food and drinks near schools in two of
the studied regions (Kabupaten Tangerang and Kabupaten East Lombok).
The School Budget and BP3: BP3 contributions have always been the main source of
school funding. As outlined before, parents and the community through the BP3
contributions provide a large portion of the School Budget (RAPBS) in many schools,
while the government�s share tends to be much smaller. Although the contribution from
parents has declined since the crisis began, parents and the community remain the largest
contributors in most schools. Examples of RAPBS in primary and junior secondary schools
are presented in Table 19 � 19b.
It is certainly apparent that an increasing number of students have delayed paying their BP3
contributions because of the ongoing crisis. In fact, in the poor areas of Kabupaten Tangerang
such delays were already occurring even before the crisis, where in one area some students
even delayed paying their BP3 fees until they had finished their schooling. In rural areas,
delays are often related to seasonal factors, since many farmers are unable to pay the tuition
fees until after the harvest. Consequently, children from these families are unable to collect
their school reports or certificates until after the harvest when their fees are paid.
Rising prices and increased school expenses as a result of the crisis, have forced many schools
to charge a higher BP3 levy. Many parents object to this increase because of their own
difficult economic position. The actual amount of the BP3 levy varies between schools and
from one region to another. Some examples of the BP3 contributions, from the last three years
across the four kabupaten investigated by SMERU, are presented in Table 20.
11OSIS =Intra-school Student Organization.

The SMERU Research Institute, September 2003���
Table 18. Estimates of Yearly Expenses for Primary School and Junior High School Students in East Lombok
SD dan MI SLTPN dan MTsType of Expanse
SD MI SLTPN MTs
Tuition Fees
Enrollment Fee *** *** *** - 20,000
Re-enrollment Fee *** *** *** -
Desk Contribution *** *** *** - 15,000
Building and Maintenance
Contribution*
*** *** *** - 30,000
Sub Total - 65,000
Expanses/mounth
BP3 100 - 1,000 - 1,000 3,500 - 6,000 825 - 2,000
OSIS
SPP - 100 - 250 2,000 - 3,500
Sub Total 100 - 1,100 - 1,250 3,500 - 6,000 2,825 - 5,500
Extraculicular Expenses
Computer/month *** *** ***
Art and craft/cawu *** *** - 10,000 ***
Sub Total - 10,000
Test and Examination Fees/Test
Semester Tests *** *** 1,500 *** 1,000 2,500
Final Examinations ** *** *** *** ***
Certificate ** *** *** *** ***
Ebtanas + Photo *** *** 8,500 *** ***
Report *** *** *** 3,000
Sub Total 10,000 1,000 5,500

The SMERU Research Institute, September 2003���
Table 18 (continued)
SD dan MI SLTPN dan MTsType of Expanse
SD MI SLTPN MTs
Uniform Expense -
School Uniform (2 ) 20,000 - 100,000 30,000 - 100,000 60,000 - 110,000 120,000 - 180,000
Female School Uniform (2)
Scouts Uniform (1) - 25,000 - 30,000 30,000 - 75,000 - 75,000
Physical Education Uniform
(t-shirt)
7,500 - 25,000 25,000 - 35,000
Shoes 20,000 - 50,000 15,000 - 45,000 15,000 - 45,000 15,000 - 35,000
Bag 15,000 - 25,000 - 22,000 - 60,000 25,000 - 50,000
Sub Total 62,500 - 225,000 45,000 - 175,000 127,000 - 290,000 185,000 - 375,000
Study Expenses
Religious Education Textbooks 45,000 - 40,000
Other Textbooks 45,000 - 75,000
Exercuse and Drawing Books 22,500 - 30,000 18,000 - 80,000 22,000 - 80,000 30,000 - 60,000
Stationary 5,000 - 40,000 5,000 - 20,000 10,000 - 40,000 - 24,000
Desk - 30,000
Sub Total 27,500 - 70,000 23,000 - 145,000 32,000 - 195,000 30,000 - 199,000
Other
Food and Snacks - 250,000 - 125,000 - 250,000
Transport - 125,000
Sub Total - 250,000 - 125,000 - 375,000
Total I 90,100 - 546,100 68,000 - 456,250 162,500 - 876,000 218,825 - 650,000
Note: * New students (grade 1).
** Graduating students (grade 6 SD, grade 3 SLTP).
The above figures for uniform expenses are for female students at MTs, whereas uniform expenses for male students at MT s
and SLTP are between Rp.100.000 and Rp.150.000.
*** Information not available.
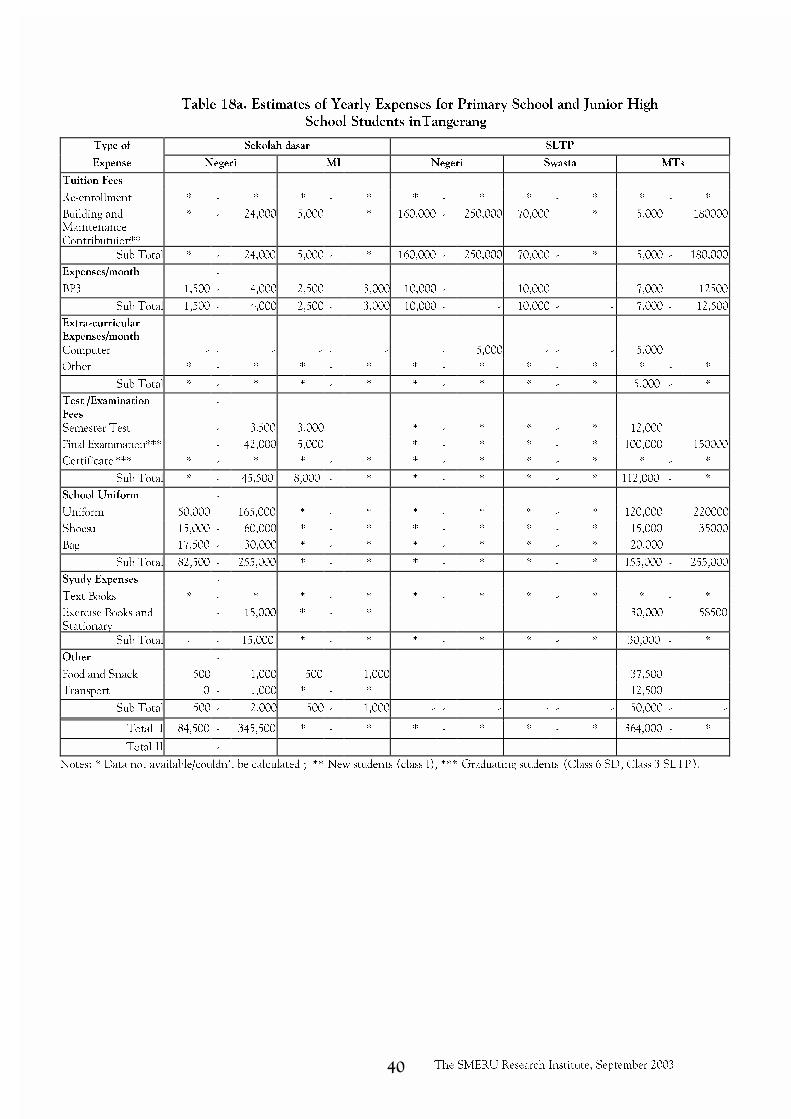
The SMERU Research Institute, September 2003���
Table 18a. Estimates of Yearly Expenses for Primary School and Junior High
School Students inTangerang
Type of Sekolah dasar SLTP
Expense Negeri MI Negeri Swasta MTs
Tuition Fees
Re-enrollment * - * * - * * - * * - * * - *
Building andMaintenanceContributuion**
* - 24,000 5,000 * 160,000 - 250,000 70,000 * 5,000 180000
Sub Total * - 24,000 5,000 - * 160,000 - 250,000 70,000 - * 5,000 - 180,000
Expenses/month -
BP3 1,500 - 4,000 2,500 3,000 10,000 - 10,000 7,000 12500
Sub Total 1,500 - 4,000 2,500 - 3,000 10,000 - - 10,000 - - 7,000 - 12,500
Extra-curricular
Expenses/month
Computer - - - - - - - 5,000 - - - 5,000
Other * - * * - * * - * * - * * - *
Sub Total * - * * - * * - * * - * 5,000 - *
Test /Examination
Fees-
Semester Test - 3,500 3,000 * - * * - * 12,000
Final Examination*** - 42,000 5,000 * - * * - * 100,000 150000
Certificate *** * - * * - * * - * * - * * - *
Sub Total * - 45,500 8,000 - * * - * * - * 112,000 - *
School Uniform -
Uniform 50,000 165,000 * - * * - * * - * 120,000 220000
Shoesu 15,000 - 60,000 * - * * - * * - * 15,000 35000
Bag 17,500 - 30,000 * - * * - * * - * 20,000
Sub Total 82,500 - 255,000 * - * * - * * - * 155,000 - 255,000
Syudy Expenses -
Text Books * - * * - * * - * * - * * - *
Exercise Books andStationary
- 15,000 * - * 30,000 58500
Sub Total - - 15,000 * - * * - * * - * 30,000 - *
Other -
Food and Snack 500 1,000 500 1,000 37,500
Transport 0 - 1,000 * - * 12,500
Sub Total 500 - 2,000 500 - 1,000 - - - - - - 50,000 - -
Total I 84,500 - 345,500 * - * * - * * - * 364,000 - *
Total II -
Notes: * Data not available/couldn�t be calculated ; ** New students (class I), *** Graduating students (Class 6 SD, Class 3 SLTP).
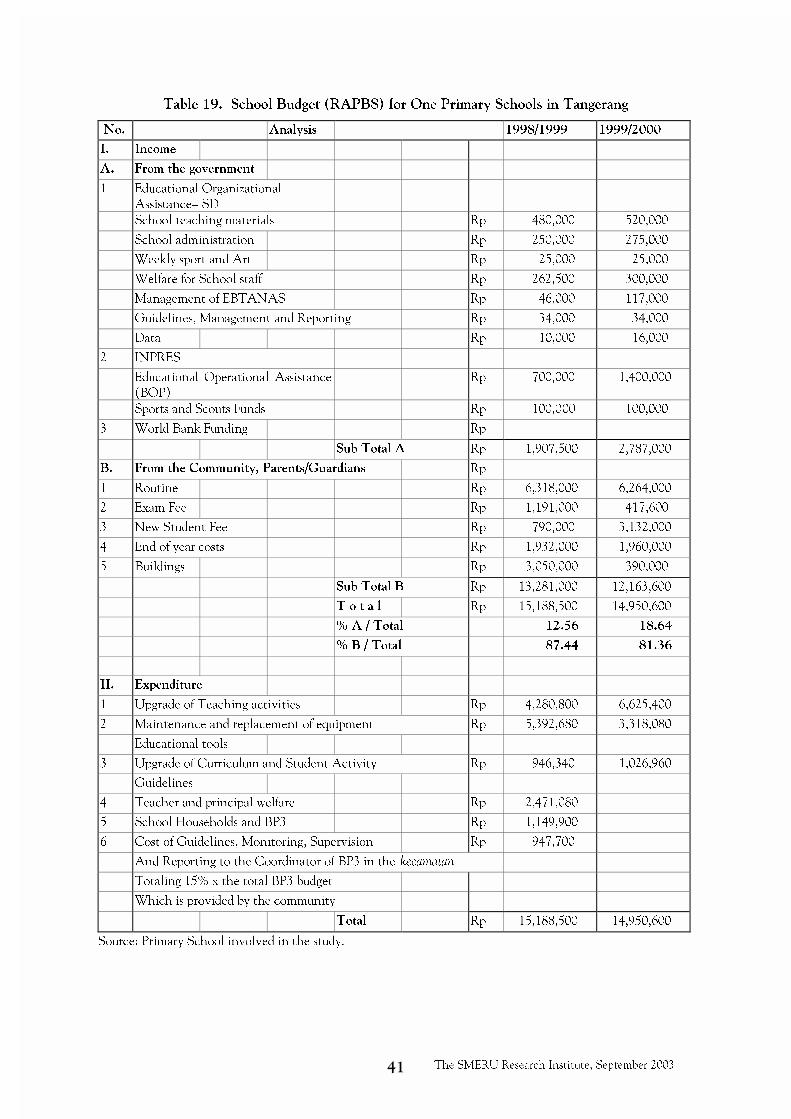
The SMERU Research Institute, September 2003���
Table 19. School Budget (RAPBS) for One Primary Schools in Tangerang
No. Analysis 1998/1999 1999/2000
I. Income
A. From the government
1 Educational Organizational
Assistance� SD
School teaching materials Rp 480,000 520,000
School administration Rp 250,000 275,000
Weekly sport and Art Rp 25,000 25,000
Welfare for School staff Rp 262,500 300,000
Management of EBTANAS Rp 46,000 117,000
Guidelines, Management and Reporting Rp 34,000 34,000
Data Rp 10,000 16,000
2 INPRES
Educational Operational Assistance
(BOP)
Rp 700,000 1,400,000
Sports and Scouts Funds Rp 100,000 100,000
3 World Bank Funding Rp
Sub Total A Rp 1,907,500 2,787,000
B. From the Community, Parents/Guardians Rp
1 Routine Rp 6,318,000 6,264,000
2 Exam Fee Rp 1,191,000 417,600
3 New Student Fee Rp 790,000 3,132,000
4 End of year costs Rp 1,932,000 1,960,000
5 Buildings Rp 3,050,000 390,000
Sub Total B Rp 13,281,000 12,163,600
T o t a l Rp 15,188,500 14,950,600
% A / Total 12.56 18.64
% B / Total 87.44 81.36
II. Expenditure
1 Upgrade of Teaching activities Rp 4,280,800 6,625,400
2 Maintenance and replacement of equipment Rp 5,392,680 3,318,080
Educational tools
3 Upgrade of Curriculum and Student Activity Rp 946,340 1,026,960
Guidelines
4 Teacher and principal welfare Rp 2,471,080
5 School Households and BP3 Rp 1,149,900
6 Cost of Guidelines, Monitoring, Supervision Rp 947,700
And Reporting to the Coordinator of BP3 in the kecamatan
Totaling 15% x the total BP3 budget
Which is provided by the community
Total Rp 15,188,500 14,950,600
Source: Primary School involved in the study.
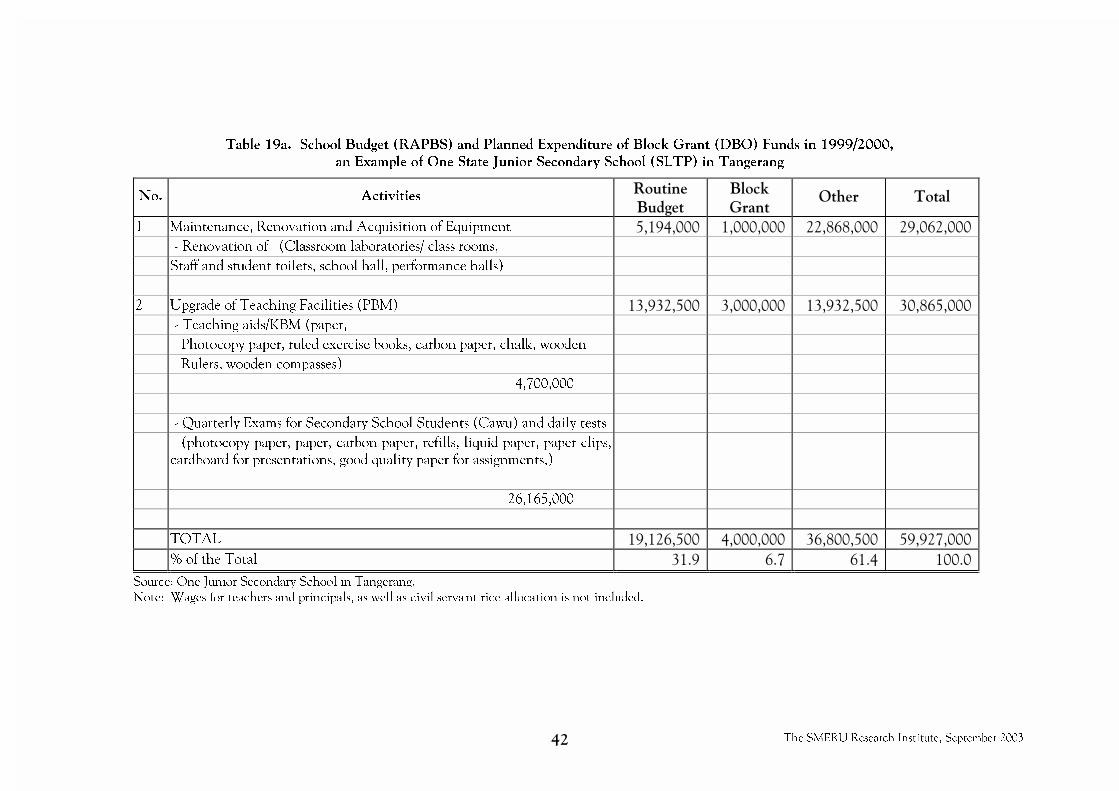
The SMERU Research Institute, September 2003���
Table 19a. School Budget (RAPBS) and Planned Expenditure of Block Grant (DBO) Funds in 1999/2000,
an Example of One State Junior Secondary School (SLTP) in Tangerang
No. Activities��������� ��
�����������
����� ������
1 Maintenance, Renovation and Acquisition of Equipment ���������������� �������������������������� ��������������
- Renovation of (Classroom laboratories/ class rooms, � � � �
Staff and student toilets, school hall, performance halls) � � � �
� � � �
2 Upgrade of Teaching Facilities (PBM) ��������������� ����������������������������� �������������
- Teaching aids/KBM (paper, � � � �
Photocopy paper, ruled exercise books, carbon paper, chalk, wooden � � � �
Rulers, wooden compasses) � � � �
4,700,000 � � � �
� � � �
- Quarterly Exams for Secondary School Students (Cawu) and daily tests � � � �
(photocopy paper, paper, carbon paper, refills, liquid paper, paper clips,
cardboard for presentations, good quality paper for assignments,)� � � �
26,165,000 � � � �
� � � �
TOTAL �������������� ��������������������������� ���������������
% of the Total ���������������� ��� �������������� ������������������ ��� ��������������� ���
Source: One Junior Secondary School in Tangerang.
Note: Wages for teachers and principals, as well as civil servant rice allocation is not included.
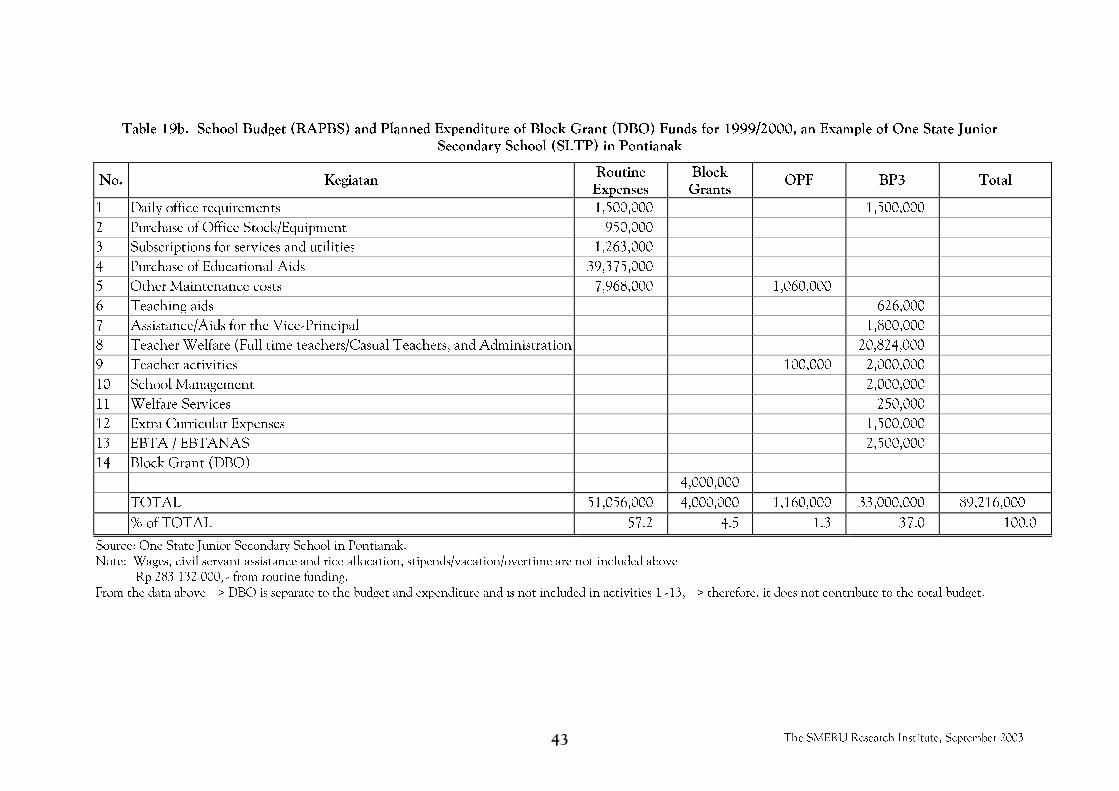
The SMERU Research Institute, September 2003���
Table 19b. School Budget (RAPBS) and Planned Expenditure of Block Grant (DBO) Funds for 1999/2000, an Example of One State Junior
Secondary School (SLTP) in Pontianak
No. KegiatanRoutine
Expenses
Block
GrantsOPF BP3 Total
1 Daily office requirements 1,500,000 1,500,000
2 Purchase of Office Stock/Equipment 950,000
3 Subscriptions for services and utilities 1,263,000
4 Purchase of Educational Aids 39,375,000
5 Other Maintenance costs 7,968,000 1,060,000
6 Teaching aids 626,000
7 Assistance/Aids for the Vice-Principal 1,800,000
8 Teacher Welfare (Full time teachers/Casual Teachers, and Administration 20,824,000
9 Teacher activities 100,000 2,000,000
10 School Management 2,000,000
11 Welfare Services 250,000
12 Extra Curricular Expenses 1,500,000
13 EBTA / EBTANAS 2,500,000
14 Block Grant (DBO)
4,000,000
TOTAL 51,056,000 4,000,000 1,160,000 33,000,000 89,216,000
% of TOTAL 57.2 4.5 1.3 37.0 100.0
Source: One State Junior Secondary School in Pontianak.
Note: Wages, civil servant assistance and rice allocation, stipends/vacation/overtime are not included above
Rp 283.132.000, - from routine funding.
From the data above �> DBO is separate to the budget and expenditure and is not included in activities 1 -13, �> therefore, it does not contribute to the total budget.

The SMERU Research Institute, September 2003���
Table 20. Average Monthly BP3 Contribution
Average BP3 Monthly Contribution (Rp)No.
Type of School /
Kabupaten 1997/1998 1998/1999 1999/2000
I. Kab. Pontianak
1. Public Primary School n.a 150�1,000 250�1,000
2. MI n.a 1,000�1,500 1,000�2,000
3. Public Junior Secondary
School
2,000-2,500 2,000�2,500 2,500�3,500
4. Private Junior Secondary
School
n.a 2,500�4,500 3,000�5,500
5. MTs n.a 2,500�4,000 3,000�6,000
II. Kab. Tangerang
1. Public Primary School 1,000 1,000�1,500 1,500
2. MI 1,000 1,000� 1,500 2,500
3. Public Junior Secondary
School
9,000 9,000 10,000
4. Private Junior Secondary
School
6,000 8,000 10,000
5. MTs 7,500�12,500 7,000�12,500*
III. Kab. Sleman
1. Public Primary School n.a n.a n.a
2. MI n.a n.a n.a
3. Public Junior Secondary
School
n.a n.a n.a
4. Private Junior Secondary
School
n.a n.a n.a
5. MTs n.a n.a n.a
IV. Kab. East Lombok
1. Public Primary School n.a n.a 200�1,000**
2. MI n.a n.a n.a
3. Public Junior Secondary
School
n.a n.a 2,000�%,000**
4. Private Junior Secondary
School
n.a n.a 2,000�4,000**
5. MTs n.a n.a n.a
Source: Data from each school.
Note: These amounts do not include quarterly fees and other payments.
* Rp7,000 in a new MTs with only 18-20 students.
** BP3 and OSIS (Intraschool Student Organization).
n.a = Data not available.
�
• Pontianak. During the crisis, not all schools have been forced to increase the BP3
contribution. If this did occur, it amounted to approximately Rp1,000. The BP3 fees for
primary schools range between Rp250�Rp1,000 and for junior secondary schools, the rate
is approximately Rp2,500�Rp3,500. Some public primary schools in remote areas decided
to impose a BP3 levy of only Rp500 per family. Consequently, these schools have only
been able to collect around Rp200,000 per year. By comparison, schools in more
prosperous areas have been able to collect up to Rp6 million per year.
Private junior secondary schools and MTs have been especially affected by the impact
of the crisis due to students� inability to pay tuition fees, and parents� requests for
exemptions. One MTs school was compelled to exempt all students from paying their
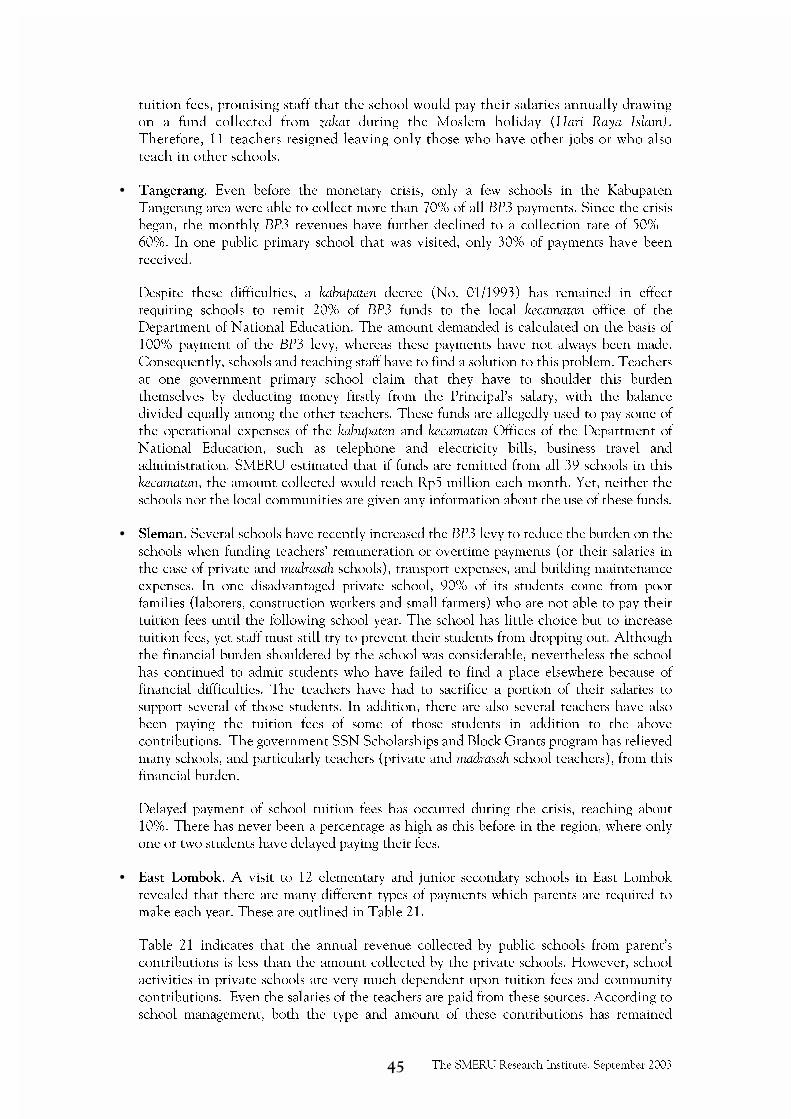
The SMERU Research Institute, September 2003���
tuition fees, promising staff that the school would pay their salaries annually drawing
on a fund collected from zakat during the Moslem holiday (Hari Raya Islam).
Therefore, 11 teachers resigned leaving only those who have other jobs or who also
teach in other schools.
• Tangerang. Even before the monetary crisis, only a few schools in the Kabupaten
Tangerang area were able to collect more than 70% of all BP3 payments. Since the crisis
began, the monthly BP3 revenues have further declined to a collection rate of 50% �
60%. In one public primary school that was visited, only 30% of payments have been
received.
Despite these difficulties, a kabupaten decree (No. 01/1993) has remained in effect
requiring schools to remit 20% of BP3 funds to the local kecamatan office of the
Department of National Education. The amount demanded is calculated on the basis of
100% payment of the BP3 levy, whereas these payments have not always been made.
Consequently, schools and teaching staff have to find a solution to this problem. Teachers
at one government primary school claim that they have to shoulder this burden
themselves by deducting money firstly from the Principal�s salary, with the balance
divided equally among the other teachers. These funds are allegedly used to pay some of
the operational expenses of the kabupaten and kecamatan Offices of the Department of
National Education, such as telephone and electricity bills, business travel and
administration. SMERU estimated that if funds are remitted from all 39 schools in this
kecamatan, the amount collected would reach Rp5 million each month. Yet, neither the
schools nor the local communities are given any information about the use of these funds.
• Sleman. Several schools have recently increased the BP3 levy to reduce the burden on the
schools when funding teachers� remuneration or overtime payments (or their salaries in
the case of private and madrasah schools), transport expenses, and building maintenance
expenses. In one disadvantaged private school, 90% of its students come from poor
families (laborers, construction workers and small farmers) who are not able to pay their
tuition fees until the following school year. The school has little choice but to increase
tuition fees, yet staff must still try to prevent their students from dropping out. Although
the financial burden shouldered by the school was considerable, nevertheless the school
has continued to admit students who have failed to find a place elsewhere because of
financial difficulties. The teachers have had to sacrifice a portion of their salaries to
support several of those students. In addition, there are also several teachers have also
been paying the tuition fees of some of those students in addition to the above
contributions. The government SSN Scholarships and Block Grants program has relieved
many schools, and particularly teachers (private and madrasah school teachers), from this
financial burden.
Delayed payment of school tuition fees has occurred during the crisis, reaching about
10%. There has never been a percentage as high as this before in the region, where only
one or two students have delayed paying their fees.
• East Lombok. A visit to 12 elementary and junior secondary schools in East Lombok
revealed that there are many different types of payments which parents are required to
make each year. These are outlined in Table 21.
Table 21 indicates that the annual revenue collected by public schools from parent�s
contributions is less than the amount collected by the private schools. However, school
activities in private schools are very much dependent upon tuition fees and community
contributions. Even the salaries of the teachers are paid from these sources. According to
school management, both the type and amount of these contributions has remained

The SMERU Research Institute, September 2003���
relatively unchanged despite the crisis. The essential problem has been a sharp decline in
the number of payments. Before the crisis, 80% of parents paid their contributions every
year, but since the crisis began the figure has ranged between 40% and 60%.
Table 21. School Levies in East Lombok
Primary Schools Secondary SchoolsNo Type of Levy
Public Private Public Private
1 BP3 and OSIS fees 2,400�12,000 500�1,000 24,000�60,000 24,000�48,000
2 Examination fees *) 0 1,000�13,500 0 45,000�50,000
3 Quarterly test fees 0�3,000 4,500�9,000 0 3,000�10,500
4 Building money 0 45,000 0�18,000 5,000�20,000
5 Monthly
contribution
0 0 0 2,000
6 Others **) 0�2.400 0 0 0
Source: Primary Data.
Remarks: *) = Only paid by students of Grade 6 Primary Schools and Grade 3 Lower .
Secondary School.
**) = Contribution for repairing school fences, etc. ����
Textbooks. According to the parents interviewed by SMERU, irrespective of the crisis,
almost no one purchases printed textbooks because the school provides them. Since the
crisis, began parents have been even more reluctant to buy textbooks because these are now
even more expensive than previously. In urban areas, a few students may buy certain kinds of
books, particularly science textbooks or those books containing exercises designed to prepare
students for the final EBTANAS test. Parents only provide writing books for their children
but the number and frequency is very much dependent on the type of school and the level.
Older students, and those who are more studious, usually require more writing books, and
parents often buy books by the dozen to be used during one quarter of school year. Students
attending Madrasah (MI and MTs) usually need more writing books than public school
students do, because they have more subjects. On average, an elementary student needs 4
dozen writing books every year, and secondary school students 6 dozen per year.
School uniforms. In general, the purchasing power of parents and the physical growth of
their children are key factors determining when, and how often, students buy school
uniforms. Some students may buy a new uniform each year, others only once every few years,
while a small minority may buy several uniforms within the same year. Many students,
however, wear old uniforms passed down from their older brothers or sisters to save some
money. On average, primary school students wear their uniforms for about two years, but
junior secondary school students' uniform might last for a longer period.
Poor students in Sleman obtained uniforms through various contributions. Some schools have
also asked foster parents to help relieve the burden on poor families. According to respondents,
before the economic crisis, on average a set of uniform cost Rp20000. At the time of the study it
was between Rp30,000 and Rp60,000 per set, excluding additional items of clothing required by
girls attending Madrasah schools. In addition to uniforms, parents have to provide shoes and
school bags which also cost a considerable amount, and places an extra burden on poor families.
For scholarship recipients, the money received is sufficient to buy most of these items. When
visiting to some primary schools, it was not uncommon to find small number of students from
poor families not wearing shoes (only sandals or bare-footed) although they have uniforms.
Transport. The way in which students travel to school varies between regions and depends
on the availability of local transport, the distance between home and school, and the amount
of money parents can afford. Some children just walk or ride bicycles. Others take whatever
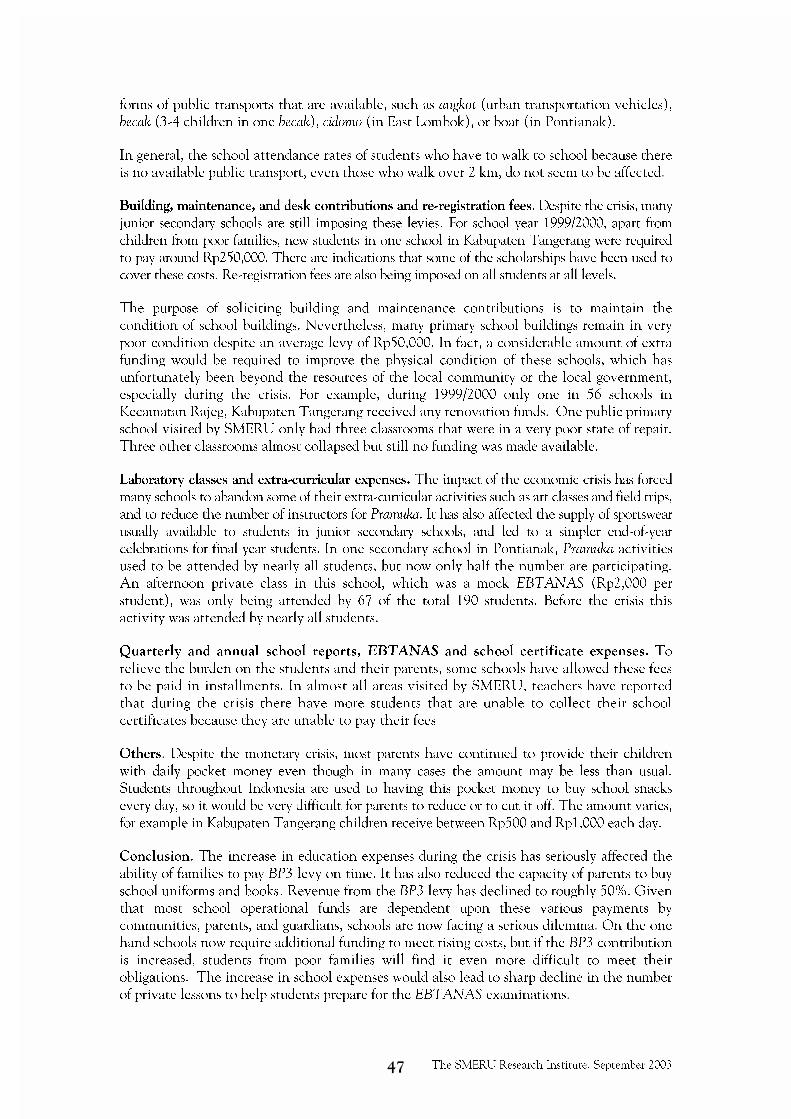
The SMERU Research Institute, September 2003���
forms of public transports that are available, such as angkot (urban transportation vehicles),
becak (3-4 children in one becak), cidomo (in East Lombok), or boat (in Pontianak).
In general, the school attendance rates of students who have to walk to school because there
is no available public transport, even those who walk over 2 km, do not seem to be affected.
Building, maintenance, and desk contributions and re-registration fees. Despite the crisis, many
junior secondary schools are still imposing these levies. For school year 1999/2000, apart from
children from poor families, new students in one school in Kabupaten Tangerang were required
to pay around Rp250,000. There are indications that some of the scholarships have been used to
cover these costs. Re-registration fees are also being imposed on all students at all levels.
The purpose of soliciting building and maintenance contributions is to maintain the
condition of school buildings. Nevertheless, many primary school buildings remain in very
poor condition despite an average levy of Rp50,000. In fact, a considerable amount of extra
funding would be required to improve the physical condition of these schools, which has
unfortunately been beyond the resources of the local community or the local government,
especially during the crisis. For example, during 1999/2000 only one in 56 schools in
Kecamatan Rajeg, Kabupaten Tangerang received any renovation funds. One public primary
school visited by SMERU only had three classrooms that were in a very poor state of repair.
Three other classrooms almost collapsed but still no funding was made available.
Laboratory classes and extra-curricular expenses. The impact of the economic crisis has forced
many schools to abandon some of their extra-curricular activities such as art classes and field trips,
and to reduce the number of instructors for Pramuka. It has also affected the supply of sportswear
usually available to students in junior secondary schools, and led to a simpler end-of-year
celebrations for final year students. In one secondary school in Pontianak, Pramuka activities
used to be attended by nearly all students, but now only half the number are participating.
An afternoon private class in this school, which was a mock EBTANAS (Rp2,000 per
student), was only being attended by 67 of the total 190 students. Before the crisis this
activity was attended by nearly all students.
Quarterly and annual school reports, EBTANAS and school certificate expenses. To
relieve the burden on the students and their parents, some schools have allowed these fees
to be paid in installments. In almost all areas visited by SMERU, teachers have reported
that during the crisis there have more students that are unable to collect their school
certificates because they are unable to pay their fees
Others. Despite the monetary crisis, most parents have continued to provide their children
with daily pocket money even though in many cases the amount may be less than usual.
Students throughout Indonesia are used to having this pocket money to buy school snacks
every day, so it would be very difficult for parents to reduce or to cut it off. The amount varies,
for example in Kabupaten Tangerang children receive between Rp500 and Rp1,000 each day.
Conclusion. The increase in education expenses during the crisis has seriously affected the
ability of families to pay BP3 levy on time. It has also reduced the capacity of parents to buy
school uniforms and books. Revenue from the BP3 levy has declined to roughly 50%. Given
that most school operational funds are dependent upon these various payments by
communities, parents, and guardians, schools are now facing a serious dilemma. On the one
hand schools now require additional funding to meet rising costs, but if the BP3 contribution
is increased, students from poor families will find it even more difficult to meet their
obligations. The increase in school expenses would also lead to sharp decline in the number
of private lessons to help students prepare for the EBTANAS examinations.
The SMERU Research Institute, September 2003���
��� �� ������������� ����������� �����
A variety of scholarships for primary and secondary school students were already available
before the crisis, including those from GN-OTA. The GN-OTA (National Foster Parents
Movement) scholarships normally provide assistance of Rp60,000 a year to eligible students
in the form of clothes, shoes and writing books. There are also a variety of other scholarships
such as Outstanding Performance (Supersemar) scholarships, those from private institutions
and NGOs, as well as scholarships from companies or foundations such as the Danone and
the Fortune Foundations in Kabupaten Pontianak, and foster friends (teman asuh) and
reriungan sarumpi in West Java. However, besides being too few in numbers, the continuity of
many of these scholarships has been unreliable. For example, each school receives an
allocation for of between 1 � 8 students for both the Outstanding Performance Scholarships
and the GN-OTA assistance, or only about 1% of the currently enrolled students in one
school year. The scholarships are still available, although at the time of survey students had
not received any assistance during the 1999/2000 school year. As more scholarships are
available for more students through the SSN Scholarships and Block Grants Program, and its
sustainability was affirmed, the SSN program received a positive response.
Unlike scholarship funds, the operational funds for schools come from the government
routine budget (DIK). However, not all schools receive these funds. Based on education
operational funding sources, public primary schools receive operational funds from the
Anggaran Pendapatan and Belanja Daerah Tingkat II (Regional Government Budget at the
Kabupaten Level � APBD Level II), whereas public secondary schools are funded by the
APBD Level I (Provincial budget) and APBN (National budget). Therefore, it should not
be surprising that many primary schools are in worse conditions compared to public
secondary schools. The financial strength of the APBD Level II is relatively low. In
addition, one can find primary schools in almost all villages. The SSN Block Grants
program provided by the government for schools to maintain their education services for
the less-privileged members of society can only cover a small fraction of the much needed
funding. For example, one secondary school in Kabupaten Tangerang received only 6.7%
of their total budget of Rp60 million (which does not include employees� salaries and rice
allowances for teachers and school principals), but another primary school received far less
than that (See Table 19 and 19a).
The implementation of SSN Scholarships and Block Grants program varied across regions
and schools. When the field survey was conducted, the SSN Education program for
1998/1999 has been completed, while the 1999/2000 program was just being started (funding
would be available from 1 November 1999 for 40 days). The following field findings describe
the implementation of SSN Scholarships during the 1998/1999 program and provide some
accounts of the first stages and planning of the 1999/2000 program.
��������� ��!���""�# $��%�����&!#�'��(��!�)!#*��#!)��"��
Generally, each school will nominate as many students as possible according to the number
of poor students. However, the number available scholarship is much lower than the number
of applicants. In some primary schools, the number of the recipients is less than 20% of the
eligible candidates. In the junior secondary schools the percentage was higher, approximately
50% of the total proposed number.

The SMERU Research Institute, September 2003�+�
Apart from Kabupaten Pontianak, it is generally considered that scholarship programs have
accurately targeted the scholarship beneficiaries. Even those who were not awarded a
scholarship were still considered the right targets and could be classified as poor and in
need of assistance.
A comparison of the number of scholarships, with the number of enrolled students and
nominated scholarship candidates, is presented in Table 22 and 23. Table 22 highlights that
compared to the number of students in Kabupaten Tangerang, the percentage of scholarship
beneficiaries is still far below the designated national percentage (6%). Yet, in Kabupaten
Pontianak the percentage is in accordance with this rate. However, at the junior secondary
level (Table 23), the percentage of beneficiaries in Kabupaten Pontianak has been almost
four times higher than the national percentage (17%). This has resulted in some non-
targeted beneficiaries receiving scholarships, such as the children of schoolteachers, bank
employees, and even the children of members of Local House of Representatives and of a
Deputy School Principal.
Several schools have been complaining about low scholarship allocations, especially for
primary schools, on the following grounds: (i) the number of eligible candidates has been
far higher than available scholarship allocations; (ii) the school has to conduct a two-
phase selection process, and has found it difficult to determine those who are most
eligible; (iii) parents who have registered and submitted a statement about their level of
poverty have found it hard to accept that the funding was limited, and (iv) there is some
suspicion that the school has carried out corrupt activities with the funds.
Although the selection process is described in the Implementation Guidelines, sometimes it
has been modified at the local level based on other (school) factors, such as: the involvement
of non-committee members; the involvement of parents and teachers; changing performance
criteria; rotation of scholarship beneficiaries; exploiting passing grade rules for new junior
secondary school students, and; amongst others, the submission of poverty statement from
the Head of the Village. Among the 4 provinces visited, East Lombok is the only province
that has actually implemented the program according to the Guidelines.
���������������������
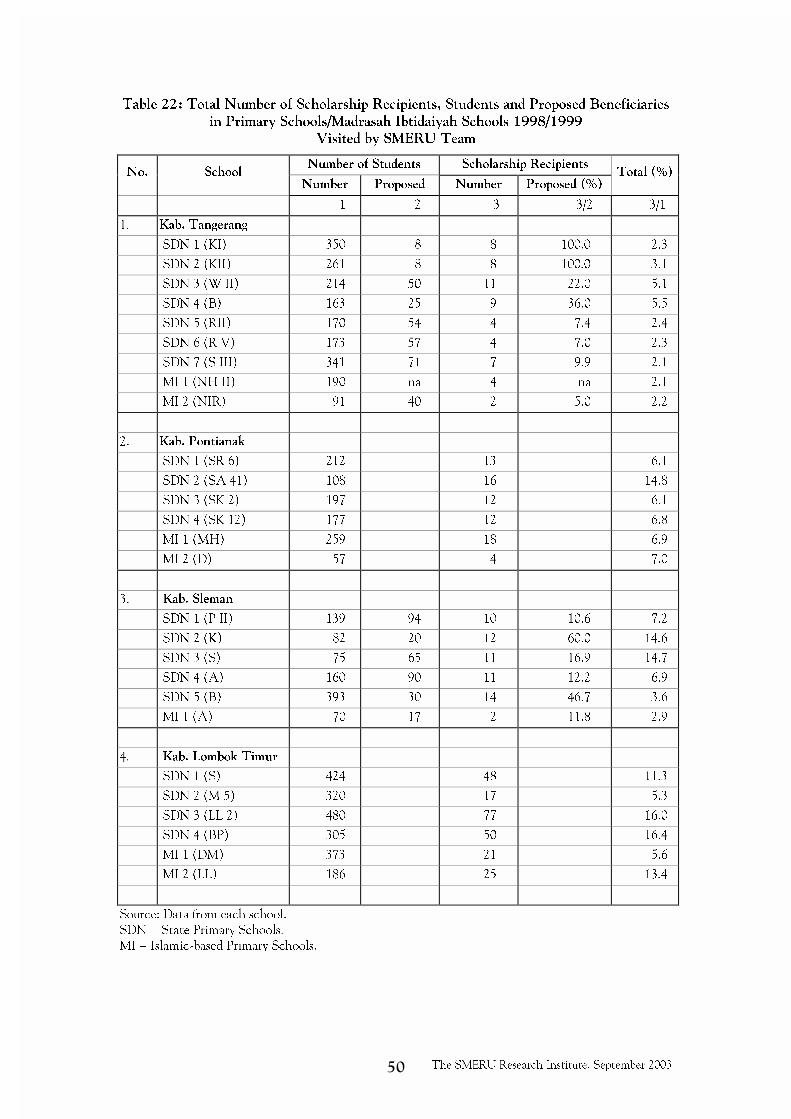
The SMERU Research Institute, September 2003�,�
Table 22: Total Number of Scholarship Recipients, Students and Proposed Beneficiaries
in Primary Schools/Madrasah Ibtidaiyah Schools 1998/1999
Visited by SMERU Team
Number of Students Scholarship RecipientsNo. School
Number Proposed Number Proposed (%)Total (%)
1 2 3 3/2 3/1
1. Kab. Tangerang
SDN 1 (KI) 350 8 8 100.0 2.3
SDN 2 (KII) 261 8 8 100.0 3.1
SDN 3 (W II) 214 50 11 22.0 5.1
SDN 4 (B) 163 25 9 36.0 5.5
SDN 5 (RII) 170 54 4 7.4 2.4
SDN 6 (R V) 173 57 4 7.0 2.3
SDN 7 (S III) 341 71 7 9.9 2.1
MI 1 (NH II) 190 na 4 na 2.1
MI 2 (NIR) 91 40 2 5.0 2.2
2. Kab. Pontianak
SDN 1 (SR 6) 212 13 6.1
SDN 2 (SA 41) 108 16 14.8
SDN 3 (SK 2) 197 12 6.1
SDN 4 (SK 12) 177 12 6.8
MI 1 (MH) 259 18 6.9
MI 2 (D) 57 4 7.0
3. Kab. Sleman
SDN 1 (P II) 139 94 10 10.6 7.2
SDN 2 (K) 82 20 12 60.0 14.6
SDN 3 (S) 75 65 11 16.9 14.7
SDN 4 (A) 160 90 11 12.2 6.9
SDN 5 (B) 393 30 14 46.7 3.6
MI 1 (A) 70 17 2 11.8 2.9
4. Kab. Lombok Timur
SDN 1 (S) 424 48 11.3
SDN 2 (M 5) 320 17 5.3
SDN 3 (LL 2) 480 77 16.0
SDN 4 (BP) 305 50 16.4
MI 1 (DM) 373 21 5.6
MI 2 (LL) 186 25 13.4
Source: Data from each school.
SDN = State Primary Schools.
MI = Islamic-based Primary Schools.�
�
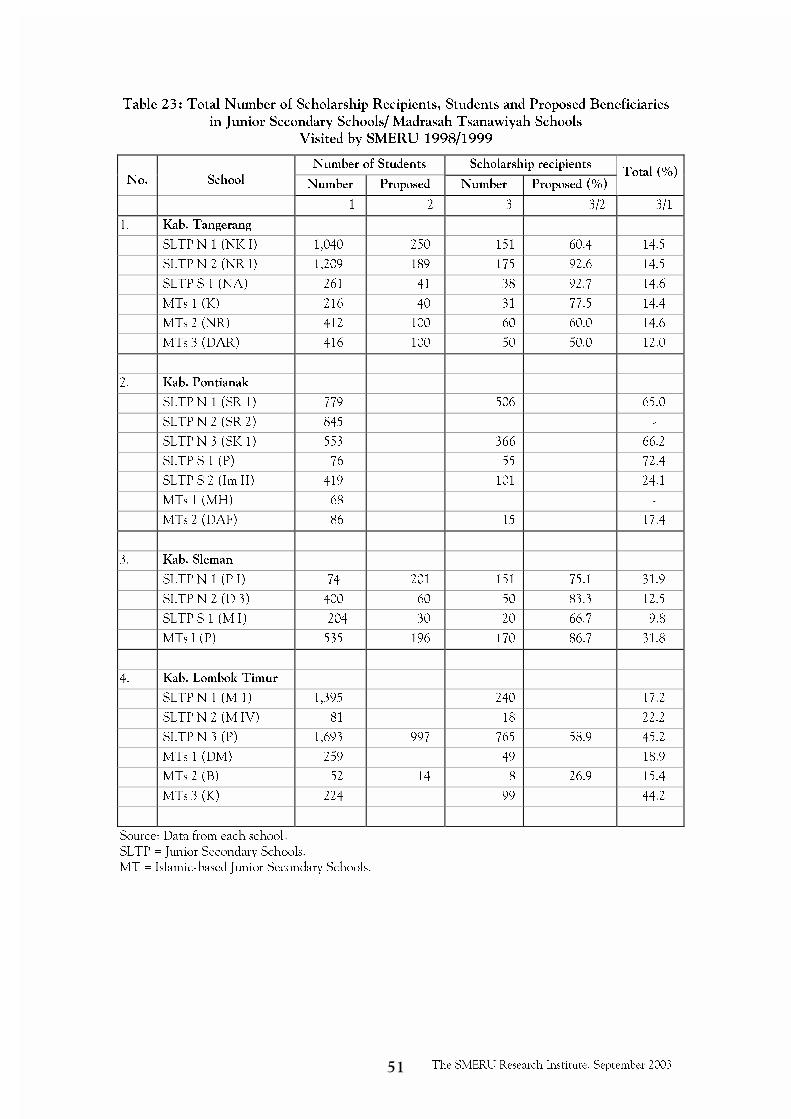
The SMERU Research Institute, September 2003���
Table 23: Total Number of Scholarship Recipients, Students and Proposed Beneficiaries
in Junior Secondary Schools/ Madrasah Tsanawiyah Schools
Visited by SMERU 1998/1999
Number of Students Scholarship recipients
No. School Number Proposed Number Proposed (%)Total (%)
1 2 3 3/2 3/1
1. Kab. Tangerang
SLTP N 1 (NK I) 1,040 250 151 60.4 14.5
SLTP N 2 (NR I) 1,209 189 175 92.6 14.5
SLTP S 1 (NA) 261 41 38 92.7 14.6
MTs 1 (K) 216 40 31 77.5 14.4
MTs 2 (NR) 412 100 60 60.0 14.6
MTs 3 (DAR) 416 100 50 50.0 12.0
2. Kab. Pontianak
SLTP N 1 (SR 1) 779 506 65.0
SLTP N 2 (SR 2) 845 -
SLTP N 3 (SK 1) 553 366 66.2
SLTP S 1 (P) 76 55 72.4
SLTP S 2 (Im II) 419 101 24.1
MTs 1 (MH) 68 -
MTs 2 (DAF) 86 15 17.4
3. Kab. Sleman
SLTP N 1 (P I) 74 201 151 75.1 31.9
SLTP N 2 (D 3) 400 60 50 83.3 12.5
SLTP S 1 (M I) 204 30 20 66.7 9.8
MTs I (P) 535 196 170 86.7 31.8
4. Kab. Lombok Timur
SLTP N 1 (M 1) 1,395 240 17.2
SLTP N 2 (M IV) 81 18 22.2
SLTP N 3 (P) 1,693 997 765 58.9 45.2
MTs 1 (DM) 259 49 18.9
MTs 2 (B) 52 14 8 26.9 15.4
MTs 3 (K) 224 99 44.2
Source: Data from each school.
SLTP = Junior Secondary Schools.
MT = Islamic-based Junior Secondary Schools.

The SMERU Research Institute, September 2003�-�
� Pontianak. The decision regarding the number of scholarship beneficiaries per school was
made based on quota decided by the Kabupaten Committee. This quota was calculated
based on the stipulated criteria in the Implementation Guidelines. Based on the received
quota, student selections would be conducted based on the standard format containing
student's information, including names, status/condition of the student, gender, family
economic conditions, distance from the school, other sources of income, and whether the
students have been selected or not. In order to make appropriate selections, some schools
have also involved the teachers, homeroom teachers or the management staff of the
foundation in the selection process, or have otherwise asked for a statement of poverty
from Head of the Village. Yet, there is evidence that the allocation of scholarships has not
reached the targeted objectives due to some biases. These are outlined below.
1. There was the general impression that the committee prioritizes the children of the
Department of National Education officials. Some people dubbed the Aku Anak
Sekolah scholarship with �Department of National Education Scholarship Program�
(Program Beasiswa Dikbud). Biases in the selection of students occurred due to the
inability of many Islamic schools (MI, MTs) and private schools to comply with the
administrative requirements. Unlike in urban areas or large cities, the Islamic schools
and private schools in rural areas are mostly second-rate schools accommodating poor
families. Consequently, these schools deserve more assistance through this SSN in
education field.
2. The introduction of �IDT village� criteria has caused some ineffectiveness in
achieving program objectives. Firstly, the number of those located in IDT villages
who are targeted by the program has become larger than those in non-IDT villages;
secondly, several schools in non-IDT villages have far poorer students, compared to
those living in IDT villages; thirdly, some students who go to school in the IDT
villages do not live there, and in one or two cases students from IDT villages go to
school in non-IDT villages. The School Principal admitted that this situation has
made it difficult for the School Committee to select candidates, because all
students from poor families have already received scholarships. It was revealed that
some students were the children of former members of the Regional House of
Representatives, deputy principals or bank employees. It was proposed that the
criteria of �classified as IDT village� should not be used.
3. The quota of scholarship funding for the 1999/2000 program is small compared with
the previous year. This has resulted in smaller allocations for Grade 4 primary school
students and Grade 1 junior secondary school students, because the allocation for
Grade 5 and Grade 6 primary schools and Grade 2 and 3 junior secondary schools
could not be reduced. It was only replaceable by students of the same grade, for
example, in cases where the recipient has to repeat, move to another school or the
parents are now considered capable of paying the school expenses. Some principals
proposed that the inter-grade transfer of scholarships should be made possible, and to
be endorsed by a circular from the Central Committee to avoid any possible
suspicions of non-compliance and KKN (Corruption, Collusion and Nepotism).
4. The scholarships are not available for Grade 1 primary school students. In fact, these
students need more funding to be enrolled in school, such as to pay the school
building contributions, BP3 levy, as well as for school uniforms, shoes, bags, and
school books.
5. For the implementation of the 1998/1999 program, the criteria used were not only
the level of poverty of the students, but also their performance. Students with a
strong academic performance could be nominated even if they were from a wealthy

The SMERU Research Institute, September 2003�.�
family. Ideally the performance criteria should only be applied at the final decision
making stage if there are too many students who satisfy all criteria. This is fair for the
students who deserve a scholarship but are unable to obtain one. Meeting the poverty
criteria must be mandatory.
6. The scholarship allocation for primary schools (6% of the total number of primary
schools in Indonesia) is considered too small relative to the allocation for secondary
schools (17%) and high schools (10%).
The lack of opportunities for school officials to attend training programs has resulted in
many the wrong students being targeted for scholarships in 1998/1999. However, more
training programs have been conducted during 1999/2000 to reduce or eliminate the
possibility of incorrect targeting. Nevertheless, due to the inflexible Implementation
Guidelines (for example, scholarships can only be transferred among students of the same
grade), School Committees have been reluctant to make their own policy - for example
by transferring the scholarships for Grade 5 and Grade 6 students to Grade 4 students.
Kabupaten Pontianak was provided with a high quota in 1998/1999 as a result of the riots
in Sambas that forced many refugees to leave their villages and seek shelter and safety in
the Kabupaten Pontianak. During the planning of the program, the refugees were just
arriving and therefore special allocations were designated for the children of the refugees.
However, later when the scholarships were disbursed, some incorrect targeting and surplus
allocations were evident.
In order to be more accurate when allocating scholarships, some respondents proposed
that the selection of recipients should be based on bottom-up proposals, not just based on
criteria specified in the guidelines. The program allocations would preferably be decided
at the Provincial level. Subsequently, the Provincial level should decide the allocations
for the kabupaten, and the kabupaten should decide the allocations at the school level.
Alternatively, the Central Committee can determine the program allocations, and then
this information can be sent to the Kabupaten Committee. The Central Committee can
then report back to the Provincial Committee.
• Tangerang. The selection of the scholarship recipients in 1998/1999 first involved
selecting a number of students who deserved to be nominated to the Committee at the
level higher than the School Committee (Kecamatan Committee for SD/MI schools, and
the Kabupaten Committee for SLTP/MTs schools). Many schools had to produce shorter
lists after they were made aware of the limited number of scholarships available from the
Kecamatan Committee. Thus, the final list of nominated students would match the
estimated number of available scholarships.
During the first stage of selecting the eligible students, the principal usually involved the
teachers, especially the homeroom teachers. Some primary schools involved the BP3
members, while the junior secondary schools the Intra School Student Organization
(OSIS)/Teachers Working Team (BP). These people were considered persons who are
familiar with the actual living conditions of the students and their families. During the
next stage, the school principal was the sole decision-maker at nearly all levels of primary
schools. In the junior secondary schools, especially public schools, the principals involved
other teachers from the Committee because the secondary schools had a larger allocation
of scholarships (some obtained up to 175 scholarships, compared with the primary school
quota which was only for between 2 � 11 students). Consequently, it was too difficult for
the Principal to make the final selection alone.

The SMERU Research Institute, September 2003���
The criteria used by schools to nominate the scholarship recipients include: (1) children
with single parents (or orphans) in poor families; (2) students who had unpaid BP3
contributions, and; (3) the nature of the parents� employment. These groups of students
are known as AUSKM or Anak Usia Sekolah Kurang Mampu (Poor School-Aged
Children). Beside these criteria, schools also applied additional criteria such as the level
of student�s academic performance, in order to select scholarship recipients from amongst
the poorer students. In the junior secondary schools where students come from different
geographical areas, monitoring the economic conditions of the students has not been easy.
Students from poor families have to provide a statement of poverty which originates from
the Head of the village.
The criteria regarding the type of employment held by the students� parents was intended
to provide information about the students� family economic conditions and has assisted
the Committee to locate eligible students whose parents have lower incomes. In
Kecamatan Kronjo, a fishing village, the scholarship recipients have generally been
chosen from families whose income is derived from fishing and manual labor, whereas
in Kecamatan Rajeg, an agricultural area, students from families of farm laborers and
workers were targeted. As a result of these criteria, the children of retrenched workers
have never been considered as eligible recipients.
Based on the existing regulations, the SD/MI students of Grade 4 and 5 who received
scholarships for the 1998/1999 program and entered Grade 5 and 6 the following year,
automatically received another scholarship under the 1999/2000 program. This was the
case for SLTP/MTs students who were in Grade 1 and 2 in the previous year and are
now in Grade 2 and 3. However in practice, not all schools have actually applied this
policy. Several schools replaced some or all of the scholarship recipients, based on the
number of the AUSKM students being far higher than those included in the quota
during the previous program. Therefore, the scholarships have been rotated amongst
these students so that the benefits of the program have been able to be enjoyed by more
students. This approach has also been the measure used to avoid social jealousy amongst
the students. Some SLTP only continued awarding scholarships to a small number of
the previous year�s beneficiaries because the following year there were more new Grade
1 AUSKM students. Despite such efforts, the additional quota, which includes the
number of scholarships already available for the graduated Grade 3 students, is still
inadequate.
Schools applying revolving scholarship systems for the 1999/2000 program have been
using a similar approach. However, a different approach has been used for newly enrolled
Grade 1 SLTP/MTs students. All newly enrolled students from poor families are entitled
to receive scholarships by submitting a poverty statement issued by the Head of the
Village. In addition, those who satisfied the passing grade specified by the Office of the
Department of National Education were automatically awarded the scholarships. The
passing grade for these students is no different from the grade for regular students.
After the disbursement of the 1999/2000 scholarship program funds, many schools
have waived the scholarship recipients from paying BP3 contributions and other
financial obligations, including those for computer classes. However, the new students
who are also scholarship recipients, still have to pay enrollment fees. The enrollment
fees and BP3 contributions were to be settled after the scholarship money was
disbursed. Nevertheless, one school insisted that all students should pay their
financial obligations, without exception, because the school was worried that the
students might not actually receive the scholarships.

The SMERU Research Institute, September 2003���
In general, the targeting of scholarship beneficiaries has been accurate, where all of
them are from poor families. Unfortunately, due to the limited scholarship quota, there
are still many of poor students who could not be included in the program. There was
one case where a student could not continue on to the next level of education because
his family was poor and his application had been turned down because his elder brother
was one of the beneficiaries and they went to the same school.
It should be noted that the criteria for classifying families as poor has been too
closely identified with the condition of their homes. In one case, there was a student
from a family who had suffered from the economic crisis (the parents are retrenched
factory workers) did not receive a scholarship because his family lived in a housing
area. This student may now have to leave school.
The accuracy of allocating scholarships at the SD/MI level has been better than at the
SLTP/MTs level because most of the students live within the vicinity of the school. This
has meant that teachers and BP3 staff are familiar with the actual conditions of the
students and their families. Nevertheless, a village official informed SMERU that some
SLTP candidates had requested a statement of poverty, although their families were living
comfortably. As their neighbor, he could not reject such request.
• East Lombok. The selection process for the 1998/1999 scholarship beneficiaries has been
carried out according to the Implementation Guidelines of the Kabupaten/Kotamadya
Committee through School Committee meetings. The School Committee carried out the
process in several steps to determine the eligible candidates. Firstly, the School
Committee assigned one member, accompanied by some teachers, to visit the family in
person and determine the living conditions of the candidate. Secondly, it assigned the
homeroom teachers from Grade 4, 5 and 6 to select the eligible students. Thirdly, the
Heads of the Villages were asked to make a list of the parents whose children were still
attending school, and who meet the eligibility criteria.
After the list of names of proposed candidates was prepared, it was sent to the Kecamatan
Committee. The Kecamatan Committee then decided on the number of available
scholarships, and consequently, not all proposed students would receive the scholarships.
The School Committee then had to explain to the parents of those who missed out, that
the students receiving the scholarships were the ones who really met all criteria. Some of
the parents were disappointed but they could accept the fact that others were in greater
need. However, they continued to hope that their children would receive a scholarship
the following year. These high expectations were not only evident amongst poor parents,
but also amongst those who were relatively well off. They believed that the opportunity to
receive a scholarship in the future would increase the determination and motivation of
their children.
�
�
�
�
�
�

The SMERU Research Institute, September 2003���
Box 3
Poor Students Who did not Receive Scholarships (Kabupaten Tangerang)
Case 1
M finished his primary school with a high NEM score. However, his parents were too
poor to send him to secondary school. When interviewed, M was at home. His elder
brother was about to go to school. While M wished he could continue his study, his
parents had decided to only send the elder child, to school. They did not have enough
money to send them both. When M and his brother were going to enroll in a secondary
school, their parents only had Rp250,000, which was a loan from a neighbor. The
enrollment fee/school building contribution was about Rp300,000. M had to accept his
fate. According to the teacher, his brother has now been proposed as one of the SSN
Scholarship candidates.
Case 2
Iin has four children,; three of them are already married. The only child she has to
support is the youngest, now in Grade 3 SLTP. Before the crisis, this family had a
reasonably good standard of living from selling satay in Jakarta. From the business they
could afford to make a down payment of Rp9 million for a house, including a plot land
attached. The monthly installment was Rp300,000 to be paid over 15 years. From her
savings, this family could manage to build additional room for a warung makan (food
stall) next to their house. Because of the crisis, their business turnover in Jakarta fell
drastically, forcing them to close the business and later open a warung makan in their
house. Unfortunately, the warung that relied heavily on the customers around their
housing area did not work well. Many of her neighbors were retrenched workers from
the local factories. Again, lack of potential customers forced Iin to close her warung. To
support the family now Iin sells peanut crackers, which are consigned to some food
stalls. Sometimes she made pepes ikan or botok that can barely support her family. Under
such difficult conditions, Iin has not been able to pay the monthly installments for the
last 2 years. Because her son needs Rp400 to Rp600 everyday for transport costs, she
has asked her son to stop going to school. However, because of his strong desire to
continue with his education, he has asked his teacher if he could be listed as one of the
scholarship beneficiaries. Unfortunately, the selection had already been made. Iin�s son
decided to stay with his parent�s friends who live simply, but have a house close to
school. Now he is able go to school with worrying bout transport costs.
�
The Accuracy of Block Grant Targets. The accuracy of the targeted recipients varies
among the surveyed regions. According to the Guidelines, in Kabupaten Pontianak the
targeted recipients have been inaccurate, while in East Lombok there was better targeting
even though the allocation was far less than the number of schools needing assistance:
• Pontianak. During the first year of implementation of the DBO program (1998/1999),
almost all primary and junior secondary schools in Kabupaten Pontianak received block
grant assistance, except schools those with less than 50 students those which were
unregistered. Consequently, even �expensive� schools also received block grant assistance.
The criteria in the Implementation Guidelines which allowed �expensive� schools to
receive assistance was based on the school conditions in Jakarta (which of course are more
expensive compared to other regions). For example, according to the Guidelines,
�expensive� schools are schools that charge tuition fees at least Rp75,000 at the secondary
school level. No schools in Kabupaten Pontianak charge this much, not even the most
The SMERU Research Institute, September 2003���
expensive schools. The highest tuition fees were between Rp15,000 and Rp30,000 per
student per month, while most of them only charged between Rp500 and Rp3,000.
In the second year of the program (1999/2000), the number of the block grant
beneficiaries was reduced. According to the field survey, cases of inappropriate targeting were
no longer evident. To be able to make objective selections, all candidates were required to
attach school pictures and School Annual Budget Plan.
The accuracy of the block grant targeted beneficiaries could be assessed based on the use
of the funding. Appropriate block grant recipients usually use the funding for education
programs at school or to cover urgent expenses. Amongst the inappropriate recipients, the
funds were used for non-urgent matters, for example to buy musical instruments, sound
system, and as an incentive for teachers.
• East Lombok. The selection of the block grant beneficiaries followed the stipulated
provisions in the Implementation Guidelines. The registration of the primary schools was
conducted by the Kecamatan Committee, while the Kabupaten Committee organized
registration for the junior secondary schools. However, because the quota of recipients was
determined by the Central Committee, both Kabupaten Committee and Kecamatan
Committee had difficulties selecting the most eligible candidates. Nearly all schools in the
two kecamatan visited are not in good condition, especially the private SD and SLTP/MTs
schools. Basically, all of them need financial assistance. A ranking system was developed
for selection purposes, and those ranking highest were selected.
Table 23 shows that the number of schools receiving the SSN Scholarship funding is far
less than the number of existing schools. In addition, the number of beneficiary schools
for the block grant assistance during the 1999/2000 program has been cut down, although
many schools are still in an unsatisfactory condition.
The Block Grant beneficiaries in East Lombok were considered accurately targeted,
despite a case of one junior secondary school obtaining a block grant just after it finished
building the school. The school explained that it has been financing the school
construction for two years without any assistance or funding from the government. The
Kecamatan Committee recommended that this school should receive the Block Grant for
other activities.
The criteria stipulating the minimum or maximum number of enrolled students have created
funding allocation problems. Many schools eligible to receive the SSN Block Grants
Program, mainly private schools, have failed to obtain the assistance simply because the
number of enrolled students did not meet the criteria. According to the Guidelines, schools
with small numbers of students are not eligible to receive the assistance. During crisis, such
schools found it more difficult to rely on tuition fees and BP3 contributions. Consequently,
these schools would become increasingly incapable of maintaining school buildings or
facilitating school activities. In addition, the successful Family Planning program has had an
impact on new enrollment rate in primary schools. Thus, it has been even more difficult to
satisfy the Block Grants program requirement of a minimum of 60 students. Such a case was
found in Kabupaten Sleman. In order to solve the problem, the Kabupaten Committee split
the block grant funding between the beneficiary schools and other schools in need. As a
result, the actual program beneficiaries only received half of the total grant available.�
�
The SMERU Research Institute, September 2003���
-��%��� �!�$&���� ��(��%���!�)!#*�# $��!# "/#!� �'���
The program introduction activities were conducted over one week at the central level of
government and the members of the Provincial Committees attended. Sufficient
information about the program was made available for program recipients in nearly all
monitored areas, especially in Kabupaten Sleman and Kabupaten Pontianak. However,
there was still not enough information provided for the general community and for those
who did not receive funding. Program transparency was also inadequate, where the list of
funding recipients was not posted on the announcement board in the schools as instructed
in the Implementation Guidelines. It was argued that while the community�s enthusiasm
for the program was widespread, the number of students applying for the scholarships was
far bigger than the available quota. Consequently, the schools decided not to announce the
names of the students in order to avoid dissatisfaction amongst those students who did not
receive a scholarship. Other reasons include not posting the names of the students
receiving scholarships so that the beneficiaries did not feel inferior when their names were
announced publicly.
There has been good transparency on the part of the Post Offices. There were no difficulties
for the SMERU Team in obtaining complete data from the Post Offices, often without even
asking for the information. Compared with the transparent distribution of scholarship funds,
the use of the Block Grant funds was less transparent in nearly all the studied regions, even
amongst the School Committees. The only exception to this was in Kabupaten Sleman.
• Pontianak. The distribution of scholarship funding has been tightly controlled because
the funds were either sent directly to the students by the Post Office, or collected by the
principal based on an Authorization Letter from student. If the principal collected the
scholarship funds, this occurred with the full knowledge of the other School Committee
members and the parents of the students. However, in context of the Block Grant
funding, the School Committees were not transparent to those teachers who were not
members of the Committee.
Due to the non-transparent use of the grants, some Local Government officials, as well as the
Department of National Education suggested that the Block Grants program should be
terminated and the allocation of funding be transferred to the Scholarship program. The
rationale behind this recommendation has been: i) public schools have already received
Education Operational Assistance/BOP (Bantuan Operasi Pendidikan). For the school year
1999/2000 the assistance was to be between Rp1.5 million and Rp500,000 per school.
Overlapping assistance may occur because of these two kinds of assistance. This may also
become a potential source of corruption; (ii) the block grant has been designed to support
operational costs of school. Basically, all less-resourceful schools should receive such
assistance, where it is unfair if some are excluded; (iii) in non-urban areas, most children from
poor families go to Islamic or private schools, which operate without BOP funds. These
schools are actually the ones that need the block grants.
• Tangerang. The introduction to the program at the Provincial level (West Java) was
divided into three periods, 5 days for each period, covering all kabupaten Committee
members. Subsequently, at the kabupaten level, similar introductions were held for
Kecamatan Committees, SLTP/MTs Schools, and SMUA/MAs School Committees. At
the kecamatan level, the Kecamatan Committees conducted the program for SD/MI
schools within the area. The financial support for the program for SD/MI schools was
Rp2 million per kecamatan, Rp4 million for SLTP/MTs schools, and Rp6 million for
SMUA/MAs schools. The funds were used for the operational expenses in the
training, which includes incentives for Committee members/training instructors, food
The SMERU Research Institute, September 2003�+�
and accommodation during training, and also honoraria for the School
Principals/training members.
Information about the program for students and parents has been provided in different
ways, in accordance with the policy of each school. Some methods included: 1) the
parents of the student beneficiaries were invited to the school when the funding was made
available, to inform them that their children were entitled a scholarship, as well as to
discuss the use of the scholarships; or 2) the school only informed student beneficiaries
without advising the parents. A small number of schools have been quite transparent
through detailing the amount of scholarship given to each student, as well as the source
and uses of the scholarship. Other schools only advised the students that they were
scholarship recipients and therefore did not have to pay BP3 fees anymore. Those school
managing their students� scholarships tended to provide this kind of information.
In general, information about the program reached many students and members of
community, which at least made them aware of the program. Public advertisements on
many television networks also contributed to the increased the awareness of the program
(I�m a School Kid or Aku Anak Sekolah) at almost all levels in community. The
requirement for the AUSKM students needing a statement of poverty from the Village
Head has indirectly become the of information dissemination about the program. The
high level awareness about the program is reflected by the magnitude of the community�s
interest in registering their children as AUSKM students.
Naturally, it has become common to identify the SSN Scholarship recipients with being
poor, especially amongst the students themselves. The scholarship beneficiaries and
non-beneficiaries call the SSN Scholarship �a scholarship for poor students�, in order to
distinguish it from other scholarships, such as Performance Scholarship (Beasiswa
Prestasi). Such perceptions help the program to more accurately target recipients,
because the non-poor families are generally ashamed to apply for this scholarship. For
example, a SLTP student who felt that one of his parents had a steady job as a
fisherman, refused the scholarship and suggested that the scholarship should be
transferred to an orphaned student.
Transparency about those schools receiving block grants has been considered quite good.
The school principal was able to request information from higher committees about the
allocation and distribution of the grants. The schools that did not receive the grants were
also able to identify the names of those schools who were given the block grants, and they
were able to accept the reasons as to why their applications were turned down. However,
the transparency at the School Committee level was still inadequate. The school
principal was the only person who had access to the information about the allocation and
use of the block grants, and in one or two cases the principals� trusted associates also had
access to this information.
• Sleman. The introduction of the 1998/1999 Scholarship and Block Grants Program has
been carried out in Sleman within a limited timeframe. The effective introduction of the
program can be measured by examining: 1) the level of knowledge of students and parents
about the scholarship; 2) the recruitment of public figures and ordinary community
members to join the Committees; and 3) level of understanding of the processes involved
in selecting the recipients. Not all of the four sources interviewed by the SMERU Team
were satisfactorily aware of the program, particularly those who ordinary members of
community. However, most of the informal leaders, primary students, and parents of
scholarship recipients generally had a good understanding of the program.
The SMERU Research Institute, September 2003�,�
In general, transparency in the implementation of the SSN Scholarship and Block
Grants program was considered good. This is reflected by several indicators such as: 1)
the level awareness of Committee members, both at the kabupaten and school levels, of
the selection of scholarship and block grant recipients; 2) the allocation process and
mechanisms for collecting and distributing the scholarship and block grant funds; 3)
data consistency between funding allocation and funding disbursement at the Post
Office; and 4) use of the scholarship and block grant funds by schools and students.
Other parties, including the members of the Kabupaten Committee, admitted that there
were a few schools which were not quite transparent about the details and the use of
their block grants.
• East Lombok. Not all levels of community were reached in this kabupaten because the
introduction of the program at each committee level was only conducted within one day.
Consequently, many community members were unaware that the scholarship program had
been implemented. Some relatively well off families received the information through
electronic media (TV). Most parents obtained information about the program from their
own children. One School Committee provided a very good orientation program for
parents although only on a small scale. It should be noted that the transparency about the
use of the funds was still inadequate.
While the awareness of the SSN Block Grants Program was limited, the management of
the program in some schools was considered quite good, apart from one school where its
Committee members were unaware of the use of the block grants.
.��%��0"�#1��"%*� ��# $�0((����2� �""��(��%����**�����"��
According to the Implementation Guidelines, all provinces have three levels of Committees:
the Kabupaten Committee, Kecamatan Committee, and the School Committee. The
Committee members at each level consist of various community members, including
government officials and general members of community. The School Committee includes
teachers and parents (BP3). However, apart from Kabupaten Sleman, this constituency was
just considered a formality. There was the strong impression that the chairperson and
members of the Committee were selected because of their official positions. Decision making
process have frequently been dominated by members from the Department of National
Education and the Office of Education, as well as one or two committee members from the
kabupaten and kecamatan levels, and the school principals.
Considering the large number of Committee members, the Team found that the Committees
worked more effectively if the appointed members and the Chairpersons of the Committees
were assigned mutually supporting tasks and responsibilities. Each member has been expected
to do his/her tasks according to the specified field. This has avoided the delegation of tasks
from committee members to their subordinates. It is suspected that some Committees have
been ineffective because the Implementation Guidelines have been too rigid and there have
not been enough incentives for the Committee members.
In their role as Committee members at the Kecamatan level, all Post Offices in the areas
visited by SMERU have been very effective. Despite limited number of personnel (1-3
persons), they have been working professionally and transparently, which also includes their
administrative work. This is the result of their clearly specified tasks and authority.
In almost every school and province visited, the operations of the Board in the BP3 have been
less effective. Basically, they have been informed about the schools receiving scholarships, but
they have had no role in the decision-making process because the decisions were made by the

The SMERU Research Institute, September 2003���
schools. In one primary school in Kabupaten Tangerang, the BP3 has been very active and was
able to produce a well-prepared list of proposed candidates. However, they were not involved in
the final decision-making process.
In the junior secondary schools, in addition to the school principals, many teachers have also
been involved, for example through acting as the Committee Secretary. In the primary
schools, only the principals had a significant role. Some teachers who listed as members of
the Committee did not even know that they had been appointed as Committee members.
• Pontianak. On many occasions, community members were not involved in the School
Committee because the Chairman of the BP3 was considered to be the community
representative. Usually the role of the BP3 on the Committee was quite insignificant, and
only a formality to meet the requirements of establishing a School Committee. On the
other hand, some teachers who were not Committee members were assigned to �screen�
the eligible students.
• Tangerang. Generally, the Committees were structured according to the Implementation
Guidelines. Yet, the head of the local government office frequently appointed the personnel
or local office representatives in relation to their own functions and tasks. The selection of
Committee members from the NGO representatives and public figures was undertaken by
other previously appointed members of the Committee. In West Java the public figures
involved were members of the Indonesian Ulemas Council/MUI, where it was hoped that
they would have more influence over the community, as well as LPM IKIP which is an
education foundation familiar with the local education problem. In Kabupaten Tangerang,
the selected public figures were also from the Indonesian Ulemas Council. At the time of
SMERU�s visit, the members from the NGOs had not yet been selected. The Pemuda
Pancasila was invited but did not attend. Meanwhile, at the school level, the appointment of
the School Committee members, other than the BP3, has been very much been at the
discretion of the school principal.
• Sleman. At several levels, the Committees have been established according to the
Implementation Guidelines. This is indicated by: 1) the decree which was issued
regarding the establishment of the Committees (from the kabupaten level down to the
school level) and the appointment of Committee members; and 2) the several meetings
held, followed by the public awareness program.
The effectiveness of these different Committees can be measured by: 1) the accuracy in
targeting scholarships and block grant beneficiaries; 2) the implementation of committee
meetings and program information activities; 3) the use of the scholarship funds by the
students and the block grants by the schools.
• East Lombok. There is the impression that the Committees have been established
based on their members� occupations. Consequently, the structure of the Committees
was similar to that of a government organization. For example, those public officials
(such as Local Planning Board (Bappeda) Chairman, Head of Department of National
Education at the Provincial Level or the Bappeda Chairman and Head of Department
of National Education at the Kabupaten Level) who have been appointed as the Head
of the Committee and the Committee Deputy/Secretary, have appointed some officers
in the organizations to carry out tasks which are actually the responsibility of the
Committee members. Similar case was also found at the kecamatan level. In other
words, the Committees have been established according to the Guidelines, but the
effectiveness, efficiency and workload depends on certain technical offices. Based on
several sources of information, some institutions such as Health Service Unit,
Department of Religious Affairs, BKKBN, and BAPPEDA did not play significant
The SMERU Research Institute, September 2003�-�
roles in the Committee. According to the Guidelines, the number of Kabupaten
Committee members should total 16 people, but the East Lombok Bupati issued a
decree, which allowed for the appointment of 27 persons. Another regulation issued
by the Directorate General of Regional Development (Dirjen Bangda) stipulated that
the Committee should consist of 20 persons.
��3& $� )������#��� 4��!���""�"��(���"1&!"�*� �4�# $��%��5"���(�3& $� )��
Apart from Kabupaten Tangerang, in all of the areas visited the funding allocation for the
SSN Scholarship and Block Grants for the 1999/2000 Financial Year has decreased,
compared to last year�s allocation as shown in Table 3 (see Chapter II). Allocations per
kabupaten and kecamatan are presented in Table 24.
The scholarship allocation at the provincial level was determined directly by the central
government (committee) based on several criteria, including the number of Keluarga Pra
Sejahtera and Keluarga Sejahtera I (KPS/KS1) families. Subsequently, the allocation for junior
secondary schools and high schools were decided by the Kabupaten Committee based on (i)
the number of KPS/KS1 from the National Family Planning Board, and the number of IDT
villages from the regional government; (ii) the amount of BP3 contributions of each school;
and (iii) the number of students.
• Pontianak. The decreased allocation of funding for the SSN Scholarship and Block
Grants program has manifested a specific problem for the regional government,
especially for the local offices of the Department of National Education. This was
mainly because the condition of the schools in this region are relatively similar, except
amongst the relatively large and prosperous private schools (supported by private
businesses), or amongst the relatively more financially secure Christian/Catholic
schools. Some of the non-flexible provisions in the Implementation Guidelines have
created difficulties for the program implementers whenever they have to make
adjustments to different field conditions, particularly when deciding the most eligible
program beneficiaries. Currently Grade 4 primary schools and Grade 1 junior secondary
and high schools receive smaller allocations.
• Tangerang. The Kabupaten Committee decided the size of the scholarship allocation for
primary/MI schools in each kecamatan and this was subsequently distributed by the Kecamatan
Committee based on the same 4 criteria used by the Kabupaten committee. The number of
scholarship beneficiaries at the primary/MI schools level was far smaller compared to the
number of junior secondary/MTs beneficiaries. This was in accordance with the national
policy on scholarship allocations, where for primary/MI schools the funding must be allocated
to 6% of the total number of students, while for the junior secondary schools/MTs schools this
figure reaches 17%. Based on this policy, the allocation for the Kecamatan Kronjo and
Kecamatan Rajeg, particularly for primary/MI schools, was below the national level (only 2%).
Although the number of scholarship beneficiaries in Kabupaten Tangerang has increased,
the funding is still inadequate. It was estimated that the program has covered only
approximately 40% of the eligible students. This estimate is supported by data from
several junior secondary/MTs schools, indicating that the number of scholarships
available only targeted 30% � 55% of the total no of suitable applicants. This condition
was even worse in the primary/MI schools because there were only 3 � 14 beneficiaries in
each primary/MI schools (see Table 22 and 23).
However, a comparison of the allocations between different primary/MI schools indicates
that the allocation has been appropriate. The schools receiving the largest allocation (SD
3 and SD 4 at Kecamatan Kronjo) were the poorest schools. Nevertheless, if the
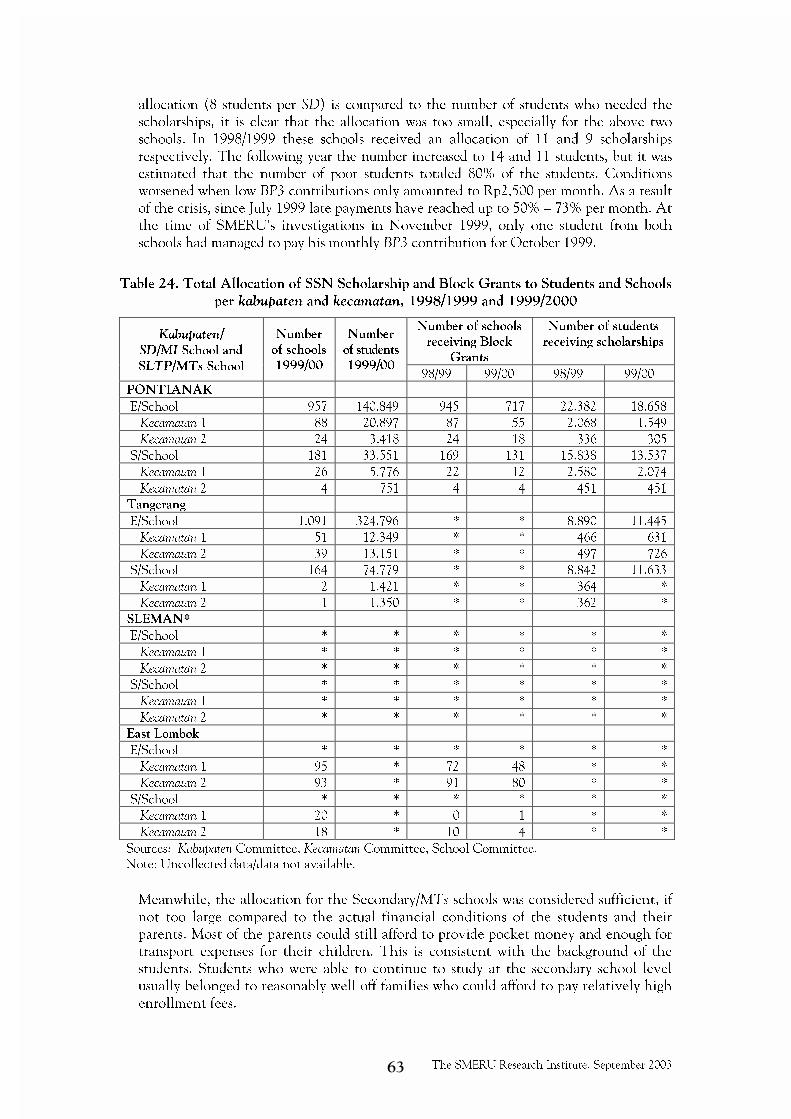
The SMERU Research Institute, September 2003�.�
allocation (8 students per SD) is compared to the number of students who needed the
scholarships, it is clear that the allocation was too small, especially for the above two
schools. In 1998/1999 these schools received an allocation of 11 and 9 scholarships
respectively. The following year the number increased to 14 and 11 students, but it was
estimated that the number of poor students totaled 80% of the students. Conditions
worsened when low BP3 contributions only amounted to Rp2,500 per month. As a result
of the crisis, since July 1999 late payments have reached up to 50% � 73% per month. At
the time of SMERU�s investigations in November 1999, only one student from both
schools had managed to pay his monthly BP3 contribution for October 1999.
Table 24. Total Allocation of SSN Scholarship and Block Grants to Students and Schools
per kabupaten and kecamatan, 1998/1999 and 1999/2000
Number of schools
receiving Block
Grants
Number of students
receiving scholarshipsKabupaten/
SD/MI School and
SLTP/MTs School
Number
of schools
1999/00
Number
of students
1999/0098/99 99/00 98/99 99/00
PONTIANAK
E/School 957 140.849 945 717 22.382 18.658
Kecamatan 1 88 20.897 87 55 2.068 1.549
Kecamatan 2 24 3.418 24 18 336 305
S/School 181 33.551 169 131 15.838 13.537
Kecamatan 1 26 5.776 22 12 2.580 2.074
Kecamatan 2 4 751 4 4 451 451
Tangerang
E/School 1.091 324.796 * * 8.890 11.445
Kecamatan 1 51 12.349 * * 466 631
Kecamatan 2 39 13.151 * * 497 726
S/School 164 74.779 * * 8.842 11.633
Kecamatan 1 2 1.421 * * 364 *
Kecamatan 2 1 1.350 * * 362 *
SLEMAN*
E/School * * * * * *
Kecamatan 1 * * * * * *
Kecamatan 2 * * * * * *
S/School * * * * * *
Kecamatan 1 * * * * * *
Kecamatan 2 * * * * * *
East Lombok
E/School * * * * * *
Kecamatan 1 95 * 72 48 * *
Kecamatan 2 93 * 91 80 * *
S/School * * * * * *
Kecamatan 1 20 * 0 1 * *
Kecamatan 2 18 * 10 4 * *
Sources: Kabupaten Committee, Kecamatan Committee, School Committee.
Note: Uncollected data/data not available. �
�
Meanwhile, the allocation for the Secondary/MTs schools was considered sufficient, if
not too large compared to the actual financial conditions of the students and their
parents. Most of the parents could still afford to provide pocket money and enough for
transport expenses for their children. This is consistent with the background of the
students. Students who were able to continue to study at the secondary school level
usually belonged to reasonably well off families who could afford to pay relatively high
enrollment fees.

The SMERU Research Institute, September 2003���
• East Lombok. At both school levels in Kabupaten East Lombok there were fewer
1999/2000 recipients than in the previous year. The findings indicate that the number of
eligible candidates was far bigger than the available allocation. This has forced the School
Committee to eliminate many candidates who badly needed the scholarships.
Funding Allocation for the Block Grant Program. Similar to the scholarship program, the
allocation of the Block Grant funds for the selected schools was determined by the Kabupaten
Committee for junior secondary schools, and the Kecamatan Committee for primary schools.
The role of the Kecamatan Committee in accurately selecting the beneficiaries for block
grants in their region has been quite good, especially the role of the Head of the Department
of Education at kecamatan level who was also the Chairman of the Committee.
Funding Disbursement Process. In principle, the Post Office preferred to make bulk
distributions of the scholarships in order to avoid too many students visiting the Paying
Post Office. In addition, this method reduced the burden of the cost of transport for the
students. Among the areas visited, only Kabupaten Sleman implemented the disbursement
process according to the 1998/1999 Implementation Guidelines, where the students were
required to visit the Post Office themselves to collect their scholarships. In Kabupaten
Tangerang and Kabupaten East Lombok, the scholarships were distributed in bulk. In
Kabupaten East Lombok, the school principal collected the funds from the Post Office with
an Authorization Letter from the scholarship recipients that was approved by the School
Committee and witnessed by one School Committee member. In Kabupaten Tangerang,
the principals asked the students to sign receipts to be presented to the Post Office.
Although the funds were collected in bulk, the disbursement of the scholarship funds in
East Lombok was considered satisfactory.
Even though a circular from the Department of National Education stated that the
scholarship and block grant funds for the 1999/2000 program would be disbursed by
November 1, 1999, the funds could not be collected until the 10th
of November. It was
suspected that the delay originated with the Inspecting Post Offices at the kabupaten level.
Similar events occurred last year, although the SMERU Team requires further confirmation
from the kabupaten and provincial Post Offices regarding this matter.
• Pontianak. Funding disbursement was carried out in three ways, mainly: a) the students
came to the Post Office to collect scholarships; b) a Post Office officer brought the
scholarships to the students; or c) the School Committee collected the funds in bulk on
behalf of the students. In Sungai Kunyit, a Post Office official came to schools to deliver
the scholarship funds directly to the students. However, due to the limited number of staff
(only two staff members), not all Post Offices were able to provide such service. The Post
Offices preferred a bulk collection. The students also found it too much of a burden to
pick up the scholarship themselves at the Post Office because of limited time and
transportation facilities. Therefore, collective disbursement was considered more
convenient by the Post Office, School Committee, as well as by the students.
• Tangerang. The Paying Post Office at Kecamatan Kronjo was located near the center of
the kecamatan. The Post Office at Kecamatan Rajeg was located in another kecamatan but
the access to the kecamatan center was quite easy. The Post Office suggested collective
distribution because it would be difficult for them to serve almost 900 students per
kecamatan when they only have one or two staff members.
While the distribution of the funds to the schools may have provided the opportunity
for the misappropriation of funds by the school itself, this method has some advantages.
These include reducing the workload of the Post Office, as well as the burden on the
students, especially those living far from the Post Office. To ensure the students actually
The SMERU Research Institute, September 2003���
received the money, the Post Office at Kecamatan Rajeg took the initiative, and
prepared a declaration to be signed by the principals that the money would be submitted
to the recipients.
After collecting the scholarship money from the Post Office, each school had different
policies in regards to the disbursement of the funds to the recipients. This may have
affected the use of the scholarship funds. In general, many schools preferred to use the
money to cover the financial obligations of the beneficiary students. Methods of
disbursement from the schools to the students include:
��The money was given directly to the students after deducting the cost of their financial
obligations, such as BP3 contributions, quarterly fees, unpaid dues (for some months)
and advanced payments for the rest of the school year. The use of the remainder of the
money very much depended on the students themselves. However, they were
encouraged to spend their scholarship money on educational expenses. Nearly all
students interviewed used the remainder of the scholarship money to meet their school-
related costs, which included buying shoes, uniforms and stationary. Some also used the
money to buy clothes.
��The recipients received no cash because the money was used to cover unpaid dues
starting from the time when the students enrolled at the school. It was also used to
cover tuition fees for the rest of the school year. The balance was to be passed on to
other students who had a large amount of outstanding dues.
��The school managed the scholarship funds after deducting the total amount of the
recipients' financial obligation, in order that the objectives of the scholarship could
be achieved. Otherwise, the students may have used the money for consumption
purposes. The scholarship funds were managed by the school in a similar manner to a
savings account for the students, available as needed to buy school bags, uniforms, or
for transport costs. In terms of achieving the objectives of the program, this method
was considered quite good since the expenditure was controlled. The disadvantage of
this approach is that placed extra burden on the teachers in charge of the students. It
also limited the students in their use of the scholarship funds, because not all of them
had enough courage to ask for the funds. Another disadvantage of this approach was
that it provided the opportunity for schools to use the funds, temporarily or
permanently, for other purposes.
• East Lombok. The disbursement process at the Post Offices in East Lombok was relatively
fast (within a single day), provided the money was available at the Paying Post Offices. To
manage the speedy disbursement of the scholarships, the Kecamatan and Kabupaten
Committees sent a circular informing the schools of the collection schedule.
The first disbursement of the scholarship money to primary and junior secondary school
students was conducted through a school meeting attended by the School Committee
and parents of the recipients. The next disbursement was given directly to the students.
The scholarship funds for primary school students were mostly retained by the parents,
whereas for junior secondary school students some funds were retained by parents, and
others by the students themselves. Decisions regarding the use of the scholarship were
entirely dependent on the students and their parents. The School Committee only
provided information and guidance about spending the scholarship funds wisely,
supporting school activities.
The SMERU Research Institute, September 2003���
Disbursement of the Block Grants. In general, the school principals went to the Post Office
to collect the funds. In some cases, the principals assigned a Committee member or the
Treasurer to collect the money. Collecting the Block Grant funds was easy because the sum
of funding was quite small and it was completed in three stages. The funds could only able to
be collected if the withdrawal slip was approved and signed by three persons: the Committee
Chairman or principal, BP3, and the Committee Treasurer. Based on these procedures, it
should not have been difficult to withdraw the money from the Post Office, apart from when
there was not enough money available and withdrawal was postponed until the funding was
available. In Kabupaten Pontianak, when the money was available at the Post Office, the
Post Office would directly notify the Department of Education and Culture at the kecamatan
level, which would then notify the recipient schools. Unlike scholarship funds, the Block
Grant funds were transferred to a Batara Bank savings account opened by the principal. The
funds could then be used according to the needs of each school. It should be noted that in
many schools in Kabupaten Tangerang, the Principal withdrew the entire sum of funds as
soon as the funds were available.
Use of Scholarship Funds. Each region investigated in the study had different priorities
for the use of the money. The most common uses were to pay the financial obligations of
the students, such as to pay BP3 contributions, test/examination fees, school certificates,
building maintenance contributions, and transport costs, as well as to buy school uniforms,
shoes, stationary.
• Pontianak. According to the program objectives, the scholarships could be used to pay BP3
contributions, or to fund school requirements which includes school uniforms, shoes, bags,
writing books, textbooks and other school-related needs. Nevertheless, there have been
several schools which have �required� their students to pay tuition fees and BP3 contributions
for the whole year or for the on-going quarter, as well as to settle other unpaid dues. Some
parents directed their children to only use the money for their study expenses, or for savings.
However, the Team found that some used the money to pay for the family�s living costs or for
other urgent needs, such as to pay a midwife, for house repairs, or to buy bicycles.
There were some indications that in the MI and MTs, the recipients did not receive the
whole amount of the scholarship. For example, in response to an appeal from the parents,
one MT exempts all students from paying their tuition fees and BP3 contributions.
Consequently, the schools were unable to pay the teachers� monthly salaries. The
principal promised to pay an unspecified amount once a year. The expected sources of
funding for this expense were infaq (contributions), shodaqoh (alms), and zakat mal/zakat
fitrah (contribution during the Islamic Eid) from the local community members. Because
of this policy, 16 teachers had to resign. Only senior teachers and others having other
sources of income could afford to continue teaching. In such a situation, the scholarships
received by the MTs schools were not handed over to the student recipients, but instead
were used to meet the needs of all enrolled students, based on the principle of �sharing the
fun and the pain together�. The money was used to replace the exempted BP3
contributions, as well as to buy writing books, pens, and exercise books for the final
exams. By doing this, the schools were able to maintain the level of school enrollments.
• Tangerang. The students used their scholarship money to pay BP3 contributions, for
transport costs, as well as to buy writing pens and school uniforms. Several junior
secondary schools used the funds to pay quarterly fees, Ebtanas fees and long standing BP3
contributions. The new students were to pay building maintenance contributions that
were subsequently deducted from their 1999/2000 scholarships. The recipients of the
1999/2000 scholarships were exempt from paying their BP3 contributions. They received
The SMERU Research Institute, September 2003���
school uniforms from the School Cooperatives. The uniforms were to be paid after the
scholarships were disbursed.
• East Lombok. Normally it was the parents of primary students who bought the school
necessities, together with their children. The junior secondary students also preferred to
purchase school requirements with their parents or by themselves. The money was used to
buy school requirements such as uniforms (for school, sport and pramuka), shoes, books
and writing pens. Some also bought food and drinks for their friends. There was a big
difference between the cost of school uniforms for male and female SLTP and MTs
students. Female MTs students required more materials for their uniform (consisting of
long skirts, long-sleeved shirts, and veils) compared to SLTP female students. In addition,
male MTs students are required to wear long trousers, unlike the SLTP male students who
wear short trousers. The MTs students are required to wear long trousers during school
days as well as for pramuka activities. Based on interviews with SLTP/MTs respondents,
the scholarship funds kept by their parents were used for other purposes, including for the
family�s daily living costs. One female MTs student mentioned that her scholarship
money was retained by three different persons: her mother, grandmother and aunt.
The students and parents informed SMERU that there were a number of schools imposing
a levy on scholarship recipients. A small amount of funds was to be set aside for the
School Committee. Based on a mutual agreement between the BP3 and the parents, the
recipients were to contribute as follows: a) a contribution of Rp1,000 � Rp1,500 deducted
from each disbursement for the Committee�s transport costs, because the students did not
have to go to the Paying Post Office themselves; and b) a one-time contribution of
Rp10,000 for the construction of school�s flag pole.
These policies were actually in contradiction of the Implementation Guidelines. Each
recipient was expected to collect his or her own money in the Post Office. However,
these guideline had some disadvantages for both the students and the Paying Post
Office, mainly: 1) the students would have had to pay transportation expenses which
were at least equal to the amount of the transportation money for the Committees; 2)
some villages had limited means of transportation, so the students would have had to
spend hours going to the post office to collect their funds, consequently missing classes;
3) the Paying Post Office has limited number of staff, so it would have been too
burdensome for each beneficiary to go directly to the Post Office to collect the funds. In
light of these circumstances, it was more practical for all parties that the collection of
the scholarship funds was delegated to the principal in his or her capacity as the School
Committee Chairperson.
Use of Block Grant Funds. The authority of the principals in deciding the use of the Block
Grants was obvious, not only in Islamic and in private schools, but also among public
primary schools. In the absence of transparency and accountability, it was difficult to control
the use of the funds, despite satisfactory administration of the funds according to the
regulations. A staff member of the Department of National Education suggested that to
ensure the proper and correct use of the block grant funds, the evidence of procurement and
inventory receipts at schools should have been cross checked.
In Kabupaten Pontianak, the block grant funds could only be used for small upgrades to the
schools, assistance or subsidies for students, procurement of teaching aids and tools, and
school activities/Kegiatan Belajar Mengajar (ATK). It was revealed that the School
Committees had difficulties in setting priorities for spending the funds due to several reasons:
a) the amount of funds was too small (especially for primary schools) compared to real needs;
b) according to the Guidelines the funds were to be collected in two disbursements, meaning
that the amount available in each disbursement was only Rp1 million which would then be
The SMERU Research Institute, September 2003���
used for at least four activities. The School Committee expects more flexible program
implementation in the future regarding the disbursement of the funds, so that the funds can
be used as needed.
In Kabupaten Tangerang, the funds were used to cover three types of expenses, mainly small
school upgrades (to buy building materials and pay the construction workers), the procurement
of office stationary, and school activities (sports equipment). In one school, the payment of
BP3 contributions was very low, and most students had not paid their quarterly fees. Therefore,
the school could not pay its monthly contribution to the Office of the Education at the
kecamatan level. This school has no choice but to use the funds to cover these expenses. There
was the impression that the grant was for the school, but how the funds were to be used was at
the discretion of each school. Therefore, other Committee members outside the School
Committee were either unaware of the decision making process or simply not involved. The
school principals mostly determined the policy regarding the use of each block grant.
Decision Making and the Use of Funds. The above findings indicate that the use of
scholarships and block grant funds in Kabupaten Tangerang have been very much decided by
the schools. Although several schools have involved parents in the decision making process,
many schools have not included other parties because most of the community members such
as those in Kecamatan Kronjo and Rajeg (particularly the poor ones) tended agree to any
suggestions without any question due to a lack of knowledge and experience in the area. In
addition, having been exempted from paying the BP3 and quarterly contributions, they were
too grateful to make any further demands. In Kabupaten Pontianak, the decisions regarding
the use of funds was generally at the discretion of the school principal as the Chairman of the
Committee. Some schools delegated this task to the Committee members and the principal
had little involvement. In Kabupaten East Lombok these decisions were made at a group
meeting and subsequently, became a Working Program based on provisions in the
Implementation Guidelines.
Constraints on the Disbursement of Funds. Several areas in Kabupaten Pontianak have
experienced some constraints with the disbursement of funds, especially those in remote
areas. Collecting the funds not only involved extensive transport costs, but was also
consuming because of limited access to water transportation. For example, the cost of
transport to the nearest Post Office is Rp75,000 per trip and it takes 3 days for a return trip.
Therefore, it was proposed that for these remote areas the funds could be disbursed in one
phase instead of in three phases. The 1999/2000-program policy regarding bulk collection of
funds had widespread support.
���//!�/!�#�� �""��(��%��#!"%�/������#��� �(�!��%���"�# $��&$� �"��
The number of scholarships and total amount of the block grants was determined according
to various criteria, including: 1) the number of Keluarga Pra-Sejahtera/KS1;2) and their
average BP3 contribution per month for each student; and 2) the number of IDT villages in
the each area. In light of this IDT criteria, some economically prosperous schools have also
been awarded large block grants and scholarships simply because they were located in a
disadvantaged region. On the other hand, some desa/kelurahan in the urban areas with large
populations of poor families were not classified as IDT villages hard hit by the crisis and they
only received a small amount of block grants.
The amount of scholarship per student (Rp10,000 per month for SD/MI students, and
Rp20,000 per month for SLTP/MTs students) was considered sufficient. However, the
number of allocated scholarships per school, especially for primary schools, was considered
inadequate compared to the number of students who needed them. Amongst the secondary
The SMERU Research Institute, September 2003�+�
schools, there were some SLTP that received large numbers of scholarships (especially among
public schools) whereas others received relatively few scholarships���
Some factors contributing to the above conditions include: a) the result of evaluations of the
percentage of IDT villages as stated in Form SD 01 regarding the Criteria of Eligible
Nominated Beneficiaries of SSN Scholarships and Block Grant funds at the Kecamatan level.
The conditions of the non-IDT regions are not always better than those in IDT regions, and
vice versa; b) the same conditions also apply for the evaluation of the percentage of the Pra-
Sejahtera and Keluarga Sejahtera 1 families, stipulated in Form SD 01 regarding the Criteria of
Eligible Nominated Beneficiaries at the kecamatan level.
• Pontianak. In Kabupaten Pontianak, the amount of scholarship money was deemed
sufficient to meet the student's needs. The money from the scholarship was usually
spent on buying writing books, shoes, and to pay BP3 contribution. Only in urban area
was the money used to buy textbooks. Most of the students from rural areas rely on the
package books provided by the schools. One primary school student was able to buy a
golden ring worth Rp50,000, and one junior high school student saved Rp120,000.
This was because the students already had their school gear before they received the
scholarships. Some students from Grade 6 primary schools or Grade 3 junior secondary
schools deliberately saved some of their scholarship money so that they could enroll in
Junior High or High School.
• Tangerang. Assuming that the scholarship money was safely received by the recipients,
the adequacy of the amount (Rp10,000/month for SD/MI students and Rp20,000/month
for SLTP/MTs students) depends on various factors. These factors include the distance to
school, financial obligations, and the level of schooling. In general, the size of the
allocation for primary school students was deemed sufficient because most of them do not
live far from their schools and consequently they do not incur transport costs. In
addition, the BP3 contribution for the primary school students was relatively small
(Rp2,500/month), so the rest of the money could used for other purposes, such as to buy
stationary, school uniforms and shoes. As for the junior secondary school students, the
travelling distance to school and level of enrollment (Grade 1, 2 or 3) are significant
factors the adequacy of the scholarship. Students whose house is far from school needed
more money for daily transport, while Grade 1 and Grade 3 of junior secondary school
students have more educational expenses. A new Grade 1 student needs a considerable
amount of money for enrollment, especially if the student is enrolled in a well-known or
popular school. The enrollment fee for SLTP is between Rp160,000 and Rp250,000,
excluding for uniforms and shoes. Grade 3 students have to pay additional expenses for
Ebtanas, school certificates and other school program activities. For example, during the
school year 1998/1999 Grade 3 students had to pay Rp150,000 per student for
examination fees and study tours. However, for Grade 2 students the amount of the
scholarship has been quite sufficient because they only have to pay BP3 contributions of
around Rp10,000 per month. Some schools charge Rp5,000 per month for computer
classes. Nevertheless, the scholarship has indeed helped relieve the burden on poor
families and it would be even more useful if the students received the whole amount of
the scholarship with no deductions.
• East Lombok. The condition of the community at the Kecamatan Masbagik and
Pringgabaya could not be evaluated based on the BKKBN�s criteria of KPS or KS-1. Some
respondents from School Committees suggested that the scholarship allocation per school
should have been decided based on the Committee�s field survey. The School Committees
directly visited the families of the candidates to observe their living conditions, therefore
the total sum allocated for scholarships per school could have been determined based on
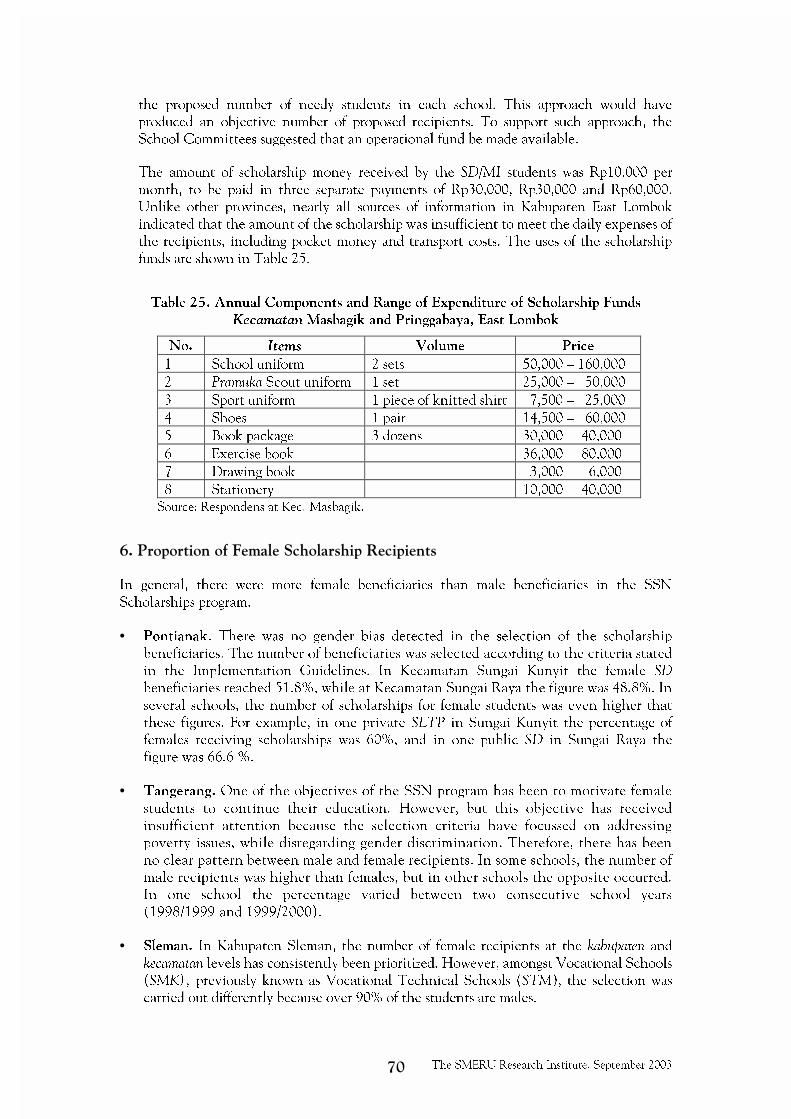
The SMERU Research Institute, September 2003�,�
the proposed number of needy students in each school. This approach would have
produced an objective number of proposed recipients. To support such approach, the
School Committees suggested that an operational fund be made available.
The amount of scholarship money received by the SD/MI students was Rp10,000 per
month, to be paid in three separate payments of Rp30,000, Rp30,000 and Rp60,000.
Unlike other provinces, nearly all sources of information in Kabupaten East Lombok
indicated that the amount of the scholarship was insufficient to meet the daily expenses of
the recipients, including pocket money and transport costs. The uses of the scholarship
funds are shown in Table 25.
�
Table 25. Annual Components and Range of Expenditure of Scholarship Funds
Kecamatan Masbagik and Pringgabaya, East Lombok
No. Items Volume Price
1 School uniform 2 sets 50,000 � 160,000
2 Pramuka Scout uniform 1 set 25,000 � 50,000
3 Sport uniform 1 piece of knitted shirt 7,500 � 25,000
4 Shoes 1 pair 14,500 � 60,000
5 Book package 3 dozens 30,000 � 40,000
6 Exercise book 36,000 � 80,000
7 Drawing book 3,000 � 6,000
8 Stationery 10,000 � 40,000
Source: Respondens at Kec. Masbagik.
�
���!�/�!��� ��(�3�*#����%��#!"%�/�����/�� �"���
In general, there were more female beneficiaries than male beneficiaries in the SSN
Scholarships program.
• Pontianak. There was no gender bias detected in the selection of the scholarship
beneficiaries. The number of beneficiaries was selected according to the criteria stated
in the Implementation Guidelines. In Kecamatan Sungai Kunyit the female SD
beneficiaries reached 51.8%, while at Kecamatan Sungai Raya the figure was 48.8%. In
several schools, the number of scholarships for female students was even higher that
these figures. For example, in one private SLTP in Sungai Kunyit the percentage of
females receiving scholarships was 60%, and in one public SD in Sungai Raya the
figure was 66.6 %.
• Tangerang. One of the objectives of the SSN program has been to motivate female
students to continue their education. However, but this objective has received
insufficient attention because the selection criteria have focussed on addressing
poverty issues, while disregarding gender discrimination. Therefore, there has been
no clear pattern between male and female recipients. In some schools, the number of
male recipients was higher than females, but in other schools the opposite occurred.
In one school the percentage varied between two consecutive school years
(1998/1999 and 1999/2000).
• Sleman. In Kabupaten Sleman, the number of female recipients at the kabupaten and
kecamatan levels has consistently been prioritized. However, amongst Vocational Schools
(SMK), previously known as Vocational Technical Schools (STM), the selection was
carried out differently because over 90% of the students are males.

The SMERU Research Institute, September 2003���
• East Lombok. Information from the School Committee, and data on scholarship
beneficiaries compiled by the East Lombok Office of Education, indicates that 60% of
the beneficiaries were female and 40% male. The high percentage of female beneficiaries
resulted from the Committee�s high awareness of the objectives of the program,
particularly in regards to the proportion of female students who should receive the funds.
So far the SSN Scholarship program has enabled female students to continue their
education and preventing them from marrying at an early age. A Focus Group Discussion
revealed that most female students have strong will to pursue higher education but are
often hindered by their parents� economic situation and low level of education.
Many parents expressed their desire for their daughters could attend high school/MA so
that they could work as government employees. Many respondents after finishing high
school/MA would like to become small traders, selling goods in the market and following
traditional work practices based on their background. The expectations of female
students seemed to be greatly influenced by their parents� economic condition and
awareness of the importance of education.
���//!�/!�#�� �""��(��%���*�& ��# $�3�!*��(��%��������6��!# �"�
Based on the Implementation Guidelines, each school level in the provinces is entitled to receive
similarly sized Block Grants, that being Rp2 million for SD/MI schools, Rp4 million for
SLTP/MTs, and Rp10 million for SM/MA. It was noted that in Kabupaten East Lombok the
block grants for SM/MA with no laboratories were too large. According to the local School
Committee and NGOs, the government�s policy about the provision of similarly sized block
grants to all provinces was irrational. Most primary schools are in poor condition, but they only
receive Rp2 million, whereas� the secondary schools and high schools have already received
allocations from the APBD Level I and APBN, received much larger grants. They suggested that
it would be more appropriate if the block grants for primary schools were Rp6-8 million, for junior
secondary schools Rp4-6 million, and for high schools Rp5-8 million.
The problems of the SSN Block Grants include: (i) the similar size of block grants for all
education levels, disregarding number of students or school conditions. For example, a school
with 50 students or 800 students received the same sized block grant. Schools with poor
building infrastructure are not distinguished from schools with buildings in good condition;
(ii) the amount of the SSN Block Grant for primary schools was insufficient compared to
those for junior secondary and high schools. Indeed, in certain areas, the size of grant needed
by all levels of schooling was relatively similar.
Several respondents suggested that: i) the size of block grants should be based on the number
of students in the category of small (>100 students), medium (100 � 350 students), and large
(<350 students) schools; ii) the size of the grants should also be based on the physical
conditions and activities of each school (has science classes or laboratories). A strong
recommendation from Kabupaten Pontianak and Kabupaten Tangerang, was that the SSN
Block Grants should be formally awarded as additional scholarship funds and formal
incentive for teachers (School Committee).
��������(��%���!�)!#*�� ���$&�� )��!�/�&��7� 8��#��"��
Even though the SMERU team received information from various parties when they were in
the field, evaluation on the role of the SSN program in reducing DO rates should be carried
carefully and supported by accurate data. The dropout rates have to be correlated with the
general conditions of education in each area, prior to the crisis. As an illustration, in
Kabupaten Sleman where the awareness of the importance of education has generally been
quite high on the part of parents and teachers, the crisis has not stopped the parents from

The SMERU Research Institute, September 2003�-�
supporting their children�s education even if they have to borrow money or work harder. In
this respect, the SSN Scholarship or Block Grant program has had no impact on the
reduction of the DO rates. However, where parents� attention to their children's education
has been inadequate (such as in Kabupaten Pontianak), even a slight problem has been be
used as a good reason to immediately terminate the child�s education. In such cases, the
SMERU Team suspects that the SSN Scholarship Program may had made a significant
impact in reducing dropout rates.
The field findings have indicated that the SSN Scholarship Program has had some influence in
reducing the DO rates in all regions except Kabupaten Sleman. The program was also
considered very useful in helping poor students to pay tuition fees/BP3 contributions and to buy
school necessities, as well as to help the schools to buy textbooks and other teaching aids.
• Pontianak. The local teachers informed SMERU that the SSN Scholarship Program has
reduced the DO rates. Most of the DO students were those who could not afford to pay
BP3 contributions over a long period of time. They felt ashamed and finally decided to
stop attending classes. In Kabupaten Pontianak, the program has helped these students to
settle their financial obligations and buy school necessities, hence preventing them from
becoming dropouts. However, among certain ethnic groups, the tendency to stop
attending school before finishing primary school is part of their custom. In such
communities, the SSN Scholarship Program did not affect the dropout rate.
• Tangerang. Despite minimum quantitative data, several government agencies, schools,
students and parents indicated that the SSN program was quite effective in reducing the
number of dropouts. At these schools, the beneficiaries were poor, school-age students
(AUSKM group), who were unable to pay the BP3 contribution. With the introduction of
SSN program, any payments and other financial obligations of these students were
covered for the rest of the school year. This has motivated the students to attend school
regularly without feeling ashamed of being unable to pay their dues. In one school, a
student who was prevented from attending school due to lack of transport money now
could go to school regularly after receiving scholarship.
The policy of nominating new school-age students from poor families as scholarship
beneficiaries has been appropriate because these students need financial assistance to
enroll in the higher levels of education. The assistance may not have met all their needs,
but it has motivated these new students to keep attending school. At the same time, it has
reduced some of the burden of their parents. Under this program, the primary and
secondary school students in this category have been able to obtain scholarships as long as
their NEM scores meet the requirements. Two primary school students almost failed to
continue their studies due to their inability to pay enrollment fees, but with a letter from
the School Principal acknowledging their financial difficulties they were able to enroll by
paying their enrollment fee of Rp250,000 in installments. In the meantime, they were
exempted from other dues, including the BP3 contribution, computer classes, and school
uniform costs. These expenses could be paid after the scholarship was disbursed.
• Sleman. SMERU�s findings in Kabupaten Sleman indicate that the SSN Scholarship
Program did not really have an impact on the dropout level in Kabupaten Sleman.
Nevertheless, the program was considered very useful to boost school activities, cover the
operational costs, and help a number of new school-age students from poor families to pay
their education expenses, reducing the burden on parents who had to work harder or
borrow more money because of the crisis. The commitment to not to give up easily and
become a dropout in spite of all difficulties faced by the parents and teachers before the
introduction of the program has also helped to maintain low dropout levels.
The SMERU Research Institute, September 2003�.�
• East Lombok. The 1998/1999 Scholarship Program had a significant role in reducing
dropout level in this kabupaten. Undeniably, some recipients became dropouts, but it was
not solely due to the economic factors. For example, some students preferred to earn
money by working as food peddlers, manual laborers, in the market, or at the harbor,
without their parents� knowledge. The SSN Scholarship Program has indeed increased the
parent�s motivation to continue sending their children to school, according to their
capacity to do so.
After being informed of the benefits of the scholarships, many parents hoped that their
children would continue receiving scholarship until they reached university. In anticipating
the increasing dependency on program assistance, the parents were informed that the initial
objective of the program was to assist the community in coping with the impact of the crisis,
particularly in terms of their children's education. Such dependency increases in the
absence of additional income sources. The junior secondary school students expressed their
strong desire to continue studying at higher levels of education, even though their parents
may not be able to afford it. To solve this problem, some students earned their own money
by selling food or working as laborers in the market, as long as they could continue studying.
Committee members have some ideas about how to anticipate the time when they will
be terminated in 2003, which include: a) approaching the business community in
Kabupaten East Lombok and asking them to allocate some of their profits for the
economically disadvantaged students who still want to continue their education; b)
appealing to the better-off parents to contribute by paying higher BP3 contributions as a
cross-subsidy; c) raising scholarship funds through zakat, infak and shodaqoh every year
for poor students. This last approach has been carried out in some schools for several
years, and is still being applied.
+��!�)!#*����!$� #��� 4��# #)�*� �4�# $��$*� �"�!#��� ��
The coordination, management and administration of the program implementation have
been considered weak. In general, the coordination of the scholarship program was only
intensive during the preparation of the program, training for program implementers, and
funding disbursement. After the scholarships were available, the administration of the
program was limited to answering questions about Implementation Guidelines. However,
many were not interested in the Guidelines. As of now, many problems in the field have
not been completely solved due to weak coordination. In the absence of supporting funds
at both the kecamatan and school levels, the weaknesses program coordination,
management and administration have been made more acute. The coordination was
flexible with no set schedules.
The coordination among the higher government agencies in the implementation of the SSN
Scholarships and Block Grants program has not been effective. This was reflected in the
limited available data in various agencies, such as in the Department of Religious Affairs,
Bureau of Statistics, and the Office of the Department of National Education at kabupaten
and kecamatan levels. The only agencies that have shown good performance and reasonably
good management in the implementation of SSN program are the Department of National
Education at the kabupaten levels and the Post Office.
It was recommended that the SSN Scholarships and Block Grants Committees should
consist of a smaller number of members in order to work more effectively and with better
coordination. Nevertheless, even the smaller Committees did not demonstrate good levels of
coordination. In addition, although the SSN Scholarship and Block Grant program is a
national program, in reality its implementation relies heavily on its local Committees
without involving other parties. For example, the National Family Planning Board

The SMERU Research Institute, September 2003���
(BKKBN)/Family Planning Extension Worker (PLKB) have seldom been involved. The
involvement of related agencies in this national program has been limited to their role as
organizing committees or as members of committees. The non-committee member agencies
have not been involved, and therefore they have not been concerned about the program.
In terms of program administration, the Implementation Guidelines were complete based on
a report stating the problems in the field. As a result, the Committees at nearly all levels are
unaware of the real problems and conditions in the field. The administration of the program
between kecamatan within a single kabupaten has varied greatly. For example, in Kabupaten
East Lombok, the program management and program administration in Kecamatan
Pringgabaya was deemed far better than in Kecamatan Masbagik.
In general, program implementation at the Committee level (except for the School
Committee) and at the Paying Post Offices has been well administered. At the school level,
however, the administration has been very weak, particularly regarding the documentation of
local decisions (for example: meeting minutes with the BP3 members). This is because they
did not follow the Implementation Guidelines, creating the impression of noncompliance.
The implementation of the program in many schools has not been well documented, or well
administered where more than half of schools visited had no written records. For example the
program documentation has not been well integrated and finding certain files is difficult.
�,��!� )�%"�# $�9�#6 �""�"��
The strengths of the SSN Scholarship and Block Grant program are as follows: i) the
program has increased the awareness of parents, teachers, and the community of the of the
importance of education; ii) the procedures have been easy to use and clear; iii), while the
field study has not been able to detect a strong indication that the program has reduced the
dropout rates, in general many students have received assistance during the crisis; iv) the
block grants have assisted in covering the school�s operational expenses, especially in non-
urban schools which in the past have only received funding for operational expenses from the
BP3 contributions (between Rp100 and Rp3,000/student/month), so the block grant of up to
Rp900,000 per school has been beneficial; v) considering that the funding has been directly
transferred from the Post Office to the School Committees, the possibility of misuse of the
funds has been reduced.
The weaknesses of the program are: i) involving too many committees, including those at the
central, provincial, kabupaten, and kecamatan levels, down to those at the school levels.
Committee members received no incentives or operational funds, particularly those at the
kecamatan and school levels. Consequently, they could not work effectively; ii) the available
scholarship funding was not able to meet the students� actual needs; iii) each school across
the regions received similarly sized block grants, regardless of number of the students or
school activities. This distribution pattern was often considered unfair, both among schools
and regions; iv) it is possible that that the SSN Block Grant overlapped with the Education
Operational Assistance (BOP) from the local governments; v) there was weak accountability
and transparency may have increased the opportunity for the corrupt use of the block grants;
vi) there were difficulties in the disbursement of funds to schools in remote areas, especially
those with high transport costs and extensive traveling time; vii) few local modifications
could be accommodated through participatory planning and implementation; vii) the was a
weak monitoring and control system at the bottom levels of the program administration,
despite involvement of community representatives and parents.
The SMERU Research Institute, September 2003���
���033 ���� ����� �0���0�0�5���� ��:�0�������0�35�5�0�70;5�����0� �� ��5����04�
���0������05��8�
����#�#��
Useful data is a very important factor for the future planning and monitoring of the
education system. Apart from Kabupaten Sleman, the awareness of the importance and the
use of data at school and kecamatan levels were quite low. It is difficult to obtain data,
particularly time series data. Every month each school has to fill in forms detailing the
number of students, teachers, and physical conditions of the school. Despite such efforts, the
data collected has never been used properly as a tool to support planning or policy-making.
The data is used only when there is a specific project, such as a mapping project.
The accuracy of the data collected is still questionable. The SMERU team suspicious of the
low Net and Gross Enrollment Rates recorded in Kabupaten Tangerang. After further
investigation, the Team encountered four different figures between the kabupaten, kecamatan
and Family Planning Extension Worker (PLKB).
In order to have a better education system in future, it is necessary to improve the system of
data collection and increase awareness of the importance of data at all levels, including
amongst the government agencies, such as the education offices at kecamatan level, and the
school principals.
-�3& $� )��
The introduction of the SSN for education has led to relatively high dependency on the
funding amongst schools and students. Therefore, it is important to consider alternative
sources of funding in anticipation of the assistance being terminated. Schools that have been
supported by various types of funding, including those from the Education Operational
Assistance (BOP), Contribution for Education (SBPP/Sumbangan Bantuan Penyelenggaraan
Pendidikan), and the BP3 contributions, will not be adversely affected if the SSN Block
Grant program is terminated. However, in terms of the actual needs of the schools, it is
suggested that the BOP fund should be increased. The amount required can be estimated by
reviewing: (1) the school conditions; (ii) the number of students per school; (iii) the types of
school activities; (iv) any fund-raising by the schools themselves (such as the BP3
contributions, etc); and (v) other specific conditions.
The selection criteria for scholarship recipients should be simplified through a bottom-up
approach. This way the scholarships can be restricted and only provided for poor students.
Using this bottom-up approach, the number of beneficiaries will be smaller and focused on
the right targets. The criteria of students with a strong academic performance can be used as
the final requirement after all other criteria (poverty, orphaned, many siblings) have been
satisfied. In the future, fundraising can also be undertaken by: (i) increasing community
participation in school programs at the local and national levels; (ii) introducing cross
subsidies in schools and BP3 contributions; (iii) conducting other self-managed businesses,
taking into account the principles of transparency.
In the future, the government can not expect the community to be its sole source of funding,
particularly those with relatively low-incomes. Nevertheless, considering that many Islamic
private schools survive to date and operate well, it can be concluded that the Madrasah's

The SMERU Research Institute, September 2003���
funding system is a useful model. The funding system uses infak, shodaqoh, zakat and other
forms of contributions. As an illustration, from the five Madrasah schools (MIT and MTs)
visited, one MTs managed its school well by using the above funding system, and two
Madrasah (MIT and MTs) have been doing fairly well through individual or institutional
support. The other two madrasah have not been able to manage well because of limited
funding and the absence of other sources. The proposed solutions for alternative funding
sources include applying the madrasah system, community contributions (e.g. BP3),
education insurance, and company contribution.
Should the responsibility of funding lie with communities, especially in the context of public
schools, in addition to transparency, the generated funding should not be used to finance
government agencies (referring to the Kabupaten Tangerang case, where 20% of the collected
BP3 contributions had to be submitted to the education offices).
.�� "���&��� #��# $�0$&�#��� �'"��*"��
The two existing education systems under the Department of National Education and the
Department of Religious Affairs have resulted in different standards of education. This is
obvious in the lower quality general subjects taught in religious schools. It is also frequently
reflected in the administrative gap and management aspects of the education programs. For
example (i) there has been the tendency for institutions and students under the Department
of National Education to be given priority for the SSN Scholarship and Block Grant
program; (ii) education institutions under the Department of National Education also
received priority in obtaining government textbooks; (iii) there has been a lack of
administrative capability and flow of information/data collection at schools under the
Department of Religious Affairs; (iv) there has been the tendency for program implementers
to prioritize the public education system, while in fact many of the poor students who need
scholarships are from religious schools (MI,MST).
Despite there being no overlap of responsibilities between the local Department of National
Education and the Office of the Department of National Education at the kecamatan and
kabupaten levels, neither have been working efficiently. Based on these facts, and considering
the limited government funding, it is recommended that these three education institutions
should be merged under the umbrella of the Department of National Education, with three
integral functions: Curriculum Division, 3 M Division, and Religious Education Division.
��;&#���'��(��%����#�%�!"��
The quality of the teachers is very much influenced by their level of education and welfare,
the changes to the curriculum, the number of subjects taught, the nature of each subject, the
teacher�s motivation, their comprehension of the subject, and their opportunities for
training.
The decrease in the quality of teachers has been the result of the frequently modified and
changed curriculum, too many subjects, and the wide range of aspects that require discussion
and further study according to each field, which very often are not followed by relevant
training. To solve this problem, some regions have conducted monthly meetings through the
Principals Working Group (K3S/Kelompok Kerja Kepala Sekolah), as a refresher for principals
and officials from the local Office of Department of National Education. At the kecamatan
level, this has been carried out through a meeting of the Teachers Working Group
(KKG/Kelompok Kerja Guru). The placement of teachers has also been a recognized as a
problem where, in urban areas, there is an excessive supply of teachers; however, in rural and
remote areas the teacher-student ratio is low.
The SMERU Research Institute, September 2003���
���&!!��&�&*�# $��!�2�"�� ��(���<�1��6"���
Most teachers agree that there are too many subjects offered, particularly subjects with local
content. Each student has to choose three subjects, but quite often there are timetable
clashes between these subjects. It has been proposed that each student should choose only
one �local content� subject of interest. With too many subjects to teach, the main concern of
many teachers has been to meet the curriculum targets, without further evaluating whether
the students have understood the subject or not.
Besides the excessive number of subjects, there are also too many �sub-subjects�, which
actually are unnecessary for primary school students because they are too detailed. Core
subjects are really all that is needed at this level. The main problems with the present
curriculum are: (i) too many teaching materials to be used within a limited teaching time;
(ii) an absence of upgrading/training programs for the teachers, resulting in inadequate
comprehension of the subjects taught; (iii) students having too much homework and other
workloads because all teachers tend to give assignments. Therefore, the present curriculum
should be simplified, and the teachers should be able to select their teaching materials, taking
the local conditions into consideration.
One subject, which so far has been overlooked, is the �manners and discipline�. Many
teachers have suggested that this subject be reintroduced. In addition, 4 (four) periods per
week should be allocated for religion classes for primary and junior secondary school students,
instead of only 2 periods.
The government textbooks are considered inadequate, especially for the Islamic and private
schools in rural areas. This has occurred because the coordination between the two
departments (the Department of National Education and the Department of Religious
Affairs) that were supposed to take care of the education affairs has not effective, also
because both have different education systems.
��&//�!�� )�3#�������"��
Besides textbooks, other teaching aids such as globes, demonstration kits, are still inadequate.
Many teachers are unfamiliar with the demonstration kits because of their lack of training in
the uses for the kits and their application, coupled with the teachers� low motivation for self-
improvement. Consequently, these kits are not even used and the resources wasted.
Most of the available supporting facilities in the schools are standard facilities which do not
reflect the special requirements of each school, and therefore not relevant for the students.
�� �%�!��""&�"��
Respondents from several areas have indicated that the parents� awareness of the importance
of education in providing a better future for their children, has reduced the drop out rate and
has prevented early marriages. People have realized that education should be the first priority
for ensuring a better future. Another important factor reducing the dropout level is the
dedication of the teachers. However, the opportunities for employment should not be
ignored. In Kabupaten Tangerang, for example, many factories readily employ primary school
graduates, and this has clearly lowered the local community�s motivation to allow their
children to continue with higher levels of education. In the future, more serious attention
should be given to these issues.
�

The SMERU Research Institute, September 2003���
��� � ���5� �������0� ��0����� ��
���� ��&"�� "��
Education Condition Prior to Crisis. The conditions of the education system prior to the
crisis is reflected in the following:
(i) Completion rates in primary schools were still relatively low. In Kabupaten Tangerang
and Kabupaten Pontianak, the proportion of children entering primary schools in
1993/1994 who reached Grade 6 was approximately 50%, in Kabupaten East Lombok
the rate was 65%, whereas in Kabupaten Sleman the rate was 89%;
(ii) School buildings and education facilities for primary schools were generally
inadequate. On one hand, the INPRES Program (President Instruction Scheme)
resulted in the construction of more school buildings, followed by higher school
participation. On the other hand, dependency on the government financial support
has increased and as a result the self-sufficiency of the schools and the participation of
the community in the education have begun to disappear, except in some popular
schools in urban areas which are still able to collect adequate funding from parents;
(iii) In urban areas the number of teachers is sufficient and even excessive, yet in rural and
isolated areas, where most of the students come from poor families, there are now
significant teacher shortages, and the level of the teachers� education is relatively low;
(iv) The School curriculum at present has too many subjects, particularly those drawing on
the local content, while basic instructions such as reading, writing, arithmetic, and the
teaching of manners and discipline is still deficient;
(v) Allocation of the government textbooks is insufficient, especially those forMadrasah and
rural primary schools. The students are usually not allowed to take the books home, the
books are only used at school, leaving the students with less opportunities to study;
(vi) Apart from in urban areas, on average there is only one junior secondary school in
each kecamatan, and transportation to school has been a constant problem;
(vii) Operational expenses for the urban area schools are covered by BP3 funding, while the
rural area schools rely more on government support, such as the routine expense
budgets, BOP and SBPP. The private and madrasah schools rely more on tuition fees,
BP3 contributions and other contributions; and
(viii) An accurate data system is not available, and the data available are not used to
monitor school�s development, or for national education system planning.
Factors Resulting in Students Continuing at School, Dropping Out, or Failing to Progress
to the Next Grade during the Crisis. Some important factors influencing the students to
remain studying at school, include:
(i) The existing institutional mechanisms which support the students to continue their
studies;
(ii) The level of economic prosperity in the family (income levels, time spent with the
parents and family members to meet the family�s need);
The SMERU Research Institute, September 2003�+�
(iii) Geographical aspects;
(iv) The available education facilities and infrastructure;
(v) The labor market, including the available employment opportunities for school-age
children (for example: in an industrial area in Kabupaten Tangerang and a fishing
village in Kabupaten Pontianak), or employment opportunities requiring higher
education; and
(vi) The socio-economic condition of the community, and its traditional customs. Cultural
biases not in favor of educational progress, such as marrying daughters off at an early
age, tend to disappear in communities where the level of awareness of the importance
of education is high.
Crisis Impact on Education. The madrasah and the low status private schools have been worst
affected by the crisis because their ability to pay teachers was heavily dependent on the tuition
fees, and other factors such as BP3 contributions. If the crisis is protracted, some of these schools
may face the threat of having to shut down, which in turn will affect their students. Some of
these factors can be expected to adversely affect to quality of education, especially over the longer
term. The impact of the economic crisis on the quality of education includes:
(i) Slightly lower than average NEM scores;
(ii) Drastic increases in school fees is a disincentive for parents with no increase in
income;
(iii) Reduction in teachers� real take home pay, due to less BP3 revenue and reduced
income sources among teachers in urban areas;
(iv) Less extra-curricular activities such as pramuka (scouts), sport, extra lessons, and
computer class;
(v) Reduced health and nutrition levels among students, lowering their capacity to absorb
the lessons; and
(vi) Insufficient numbers of school textbooks for all students.
To make matters worse, in Kabupaten Tangerang a Bupati Decree stipulated that every month all
primary schools in that region should submit 20% of the its BP3 funding (the amount charged to
students) to the Office of the Department of National Education to cover operational costs. Since
many students could not afford to pay their monthly BP3 contributions, the schools had to bear
the burden.
To cope with the crisis, many schools have adopted the following policies:
(i) New students are allowed to pay the school maintenance contribution in several
installments, while the poor students are exempted from paying this contribution;
(ii) There is more leeway in the payment of the BP3 contributions, while the poor students
are exempted;
(iii) Registration fees continue to be imposed to all students;
(iv) Some curricular activities have been suspended to reduce costs;
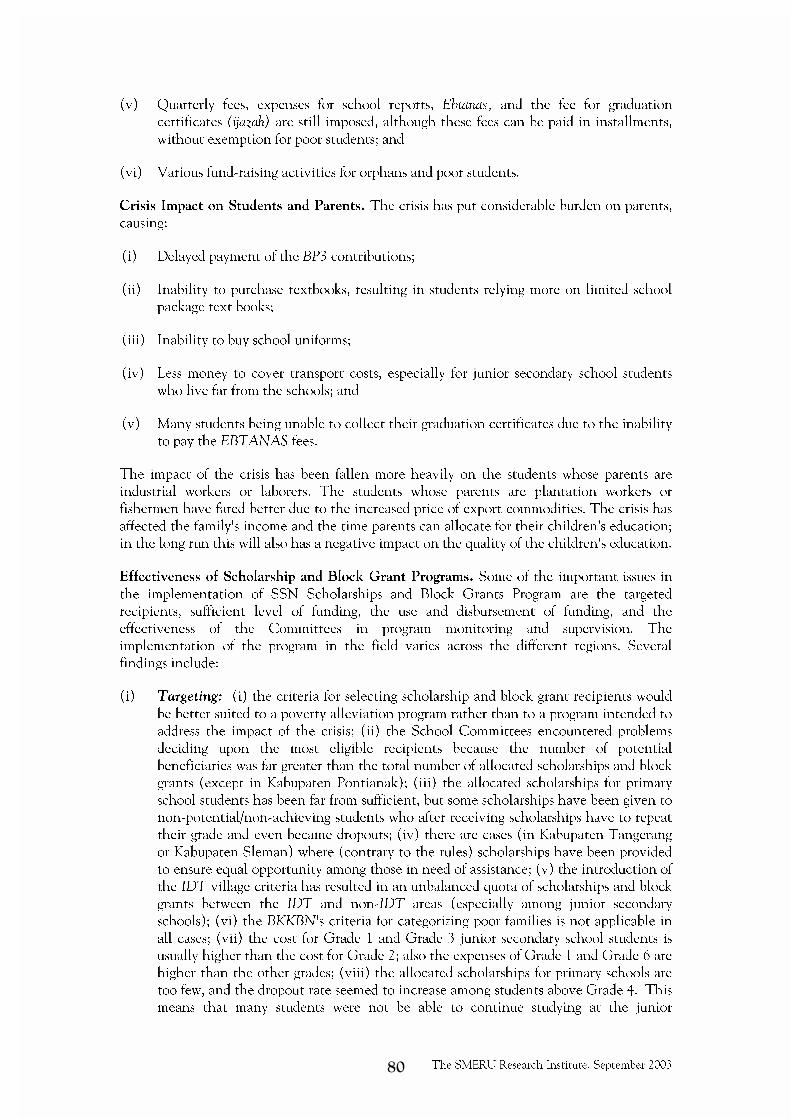
The SMERU Research Institute, September 2003�,�
(v) Quarterly fees, expenses for school reports, Ebtanas, and the fee for graduation
certificates (ijazah) are still imposed, although these fees can be paid in installments,
without exemption for poor students; and
(vi) Various fund-raising activities for orphans and poor students.
Crisis Impact on Students and Parents. The crisis has put considerable burden on parents,
causing:
(i) Delayed payment of the BP3 contributions;
(ii) Inability to purchase textbooks, resulting in students relying more on limited school
package text books;
(iii) Inability to buy school uniforms;
(iv) Less money to cover transport costs, especially for junior secondary school students
who live far from the schools; and
(v) Many students being unable to collect their graduation certificates due to the inability
to pay the EBTANAS fees.
The impact of the crisis has been fallen more heavily on the students whose parents are
industrial workers or laborers. The students whose parents are plantation workers or
fishermen have fared better due to the increased price of export commodities. The crisis has
affected the family's income and the time parents can allocate for their children�s education;
in the long run this will also has a negative impact on the quality of the children's education.
Effectiveness of Scholarship and Block Grant Programs. Some of the important issues in
the implementation of SSN Scholarships and Block Grants Program are the targeted
recipients, sufficient level of funding, the use and disbursement of funding, and the
effectiveness of the Committees in program monitoring and supervision. The
implementation of the program in the field varies across the different regions. Several
findings include:
(i) Targeting: (i) the criteria for selecting scholarship and block grant recipients would
be better suited to a poverty alleviation program rather than to a program intended to
address the impact of the crisis; (ii) the School Committees encountered problems
deciding upon the most eligible recipients because the number of potential
beneficiaries was far greater than the total number of allocated scholarships and block
grants (except in Kabupaten Pontianak); (iii) the allocated scholarships for primary
school students has been far from sufficient, but some scholarships have been given to
non-potential/non-achieving students who after receiving scholarships have to repeat
their grade and even became dropouts; (iv) there are cases (in Kabupaten Tangerang
or Kabupaten Sleman) where (contrary to the rules) scholarships have been provided
to ensure equal opportunity among those in need of assistance; (v) the introduction of
the IDT village criteria has resulted in an unbalanced quota of scholarships and block
grants between the IDT and non-IDT areas (especially among junior secondary
schools); (vi) the BKKBN's criteria for categorizing poor families is not applicable in
all cases; (vii) the cost for Grade 1 and Grade 3 junior secondary school students is
usually higher than the cost for Grade 2; also the expenses of Grade 1 and Grade 6 are
higher than the other grades; (viii) the allocated scholarships for primary schools are
too few, and the dropout rate seemed to increase among students above Grade 4. This
means that many students were not be able to continue studying at the junior

The SMERU Research Institute, September 2003���
secondary school level, because they became dropouts even before finishing primary
school; (ix) the provision that scholarships are not transferable except among students
of the same grade has resulted in an imbalance among inter-grade recipients,
particularly when the number of the allocated scholarships was reduced; and (x) the
aim of ensuring a good presentation of girls among scholarship recipients seems to have
been achieved because the nomination process has been carried out according to the
Program Guidelines.
(ii) Orientation and Transparency of the Program: Sufficient information about the program
has been made available to program recipients in nearly all observed areas, although the
general public has not been well informed. Meanwhile, the transparency of the use of
block grant funds has been far from adequate, and in many instances even the members of
the School Committees and teachers have been neither consulted or received proper
explanations about the use of these funds.
(iii) Disbursement of Funds: (i) The funding disbursement process was initially considered
complicated due to tight administrative requirements. In addition, there were
indications of deducted funds in some areas; (ii) methods used to disburse the program
funds include: (a) direct collection by the students accompanied by the school
principal and one Committee member; (b) collection by the school principal; or (c)
delivery to schools by a Post Office official (in Kabupaten Pontianak); (iii) in some
remote areas (in Kabupaten Pontianak), collection of the funds in three separate
payments was considered burdensome because of high transport costs involved, it was
far more preferable to reduce the number of disbursements to two payments at the
most; (iv) payments via bank account have been unsuccessful because of limited
number of saving books, and since the money stays in the bank for a very short period
this method is considered unprofitable; (v) in some regions the scholarship funds have
been managed by the schools, but the students are able to ask for funds as required.
Although it is claimed that this arrangement is to ensure that the funds are well
managed, steps must be taken to ensure that students are not discouraged from
collecting their scholarship money, otherwise it may create opportunities for
misappropriation.
(iv) Use of Funds: The scholarship money received by students was generally used to buy
books, stationary, some of the textbooks, school uniforms, and sport wear. In some cases
parents have also used the money to buy food, to pay a midwife, or to meet other urgent
family needs. In one MTs in Kabupaten Pontianak, the scholarships were not delivered
directly to the recipients, instead the funds were managed by the school to help finance all
students, most of whom are in need of financial assistance, for example to pay BP3
contributions, summative test fees, and examination fees. In Kabupaten Tangerang, the
fund was used to pay the unpaid BP3 contributions and the contributions of other poor
non-recipient students.
(v) Number of Scholarships Allocated, the Size of the Scholarships and Block Grants.
Although the allocated number of scholarship recipients per school � especially in
primary schools � has been considered inadequate, the students have received a
sufficient amount of money, enabling them to continue their schooling. However, the
adequacy of the amount of the scholarship per student varied among different grades.
For example, the Grade 6 students of the primary schools and Grade 1 and 3 of the
junior secondary schools need more funding because they have to pay enrollment fees,
building maintenance contributions, examination fees, certificate fees, and farewell
party contributions.

The SMERU Research Institute, September 2003�-�
The size of block grant has been to be too small for most primary schools, and too large
for senior high schools, especially those with no laboratories and science classes. In
most cases, the use of the block grants has not been very effective, apart from in some
disadvantaged private schools, public primary schools, and madrasah. The grant has
been used more effectively in schools located in remote areas. The Team found that
the SSN Block Grants Program to some extent overlaps with the Education
Operational Support (BOP) and national budget (APBN) for education, resulting in
the risk of the misappropriation of the funds.
(vi) Role of Local Committees. The coordination, management and administration of
the program have been very weak at the kecamatan and lower government levels.
School Committees have invariably been dominated by the school principals, have
made the decisions regarding the use of the block grants. Unfortunately, community
participation in the program has been low because the Board of Parents is often
considered to represent community. Basically the Kecamatan Committees have
tended to be dominated by the Office of Department of National Education officials,
whereas the Head of the Kecamatan has only forwarded the applications to the local
government, and the other committees have had a minimal role in the process. In
terms of program administration, the Post Offices and the Office of Department of
National Education at the Kabupaten level have been able to carry out their
responsibilities reasonably well.
-������'�����**� $#��� "��
(i) Allocation of Scholarships and Block Grant Recipients. To achieve more
appropriate targeting, more scholarships should be made available for Grade 1, 5 and 6
primary school students, and the amount of scholarship for Grade 1 and 6 students
should be larger than the scholarship for Grade 5 students. Likewise, the scholarship
funds for Grade 1 and Grade 3 junior secondary school students should be larger than
those for Grade 2 students. The amount of primary school scholarships should be
increased, if necessary by redirecting the funds away from junior secondary and high
schools students, or from the block grants for junior and senior high schools.
(ii) Criteria for the Selection of Scholarship and Block Grant Recipients. The criteria
for selecting the scholarship and block grant recipients should be improved to achieve
more appropriate targeting by :
- Removing the IDT village criteria for scholarship and block grant recipients;
- Adding school performance criteria for block grant recipients, and student�s potential
or achievement criteria for the scholarship program recipients (for those who meet
the other criteria);
- If the allocation is too small, it is necessary to decide upon �final� criteria, which
should be indisputable for the community, while at the same time it should make the
work of the School Committees easier, for example by using the NEM score;
- Among communities with low education awareness, the parents should be required to
sign a written pledge that they would allow their children to finish that level of
schooling when they receive scholarships;
- Replace the school scholarship quota/allocation system with a bottom-up selection
system; and
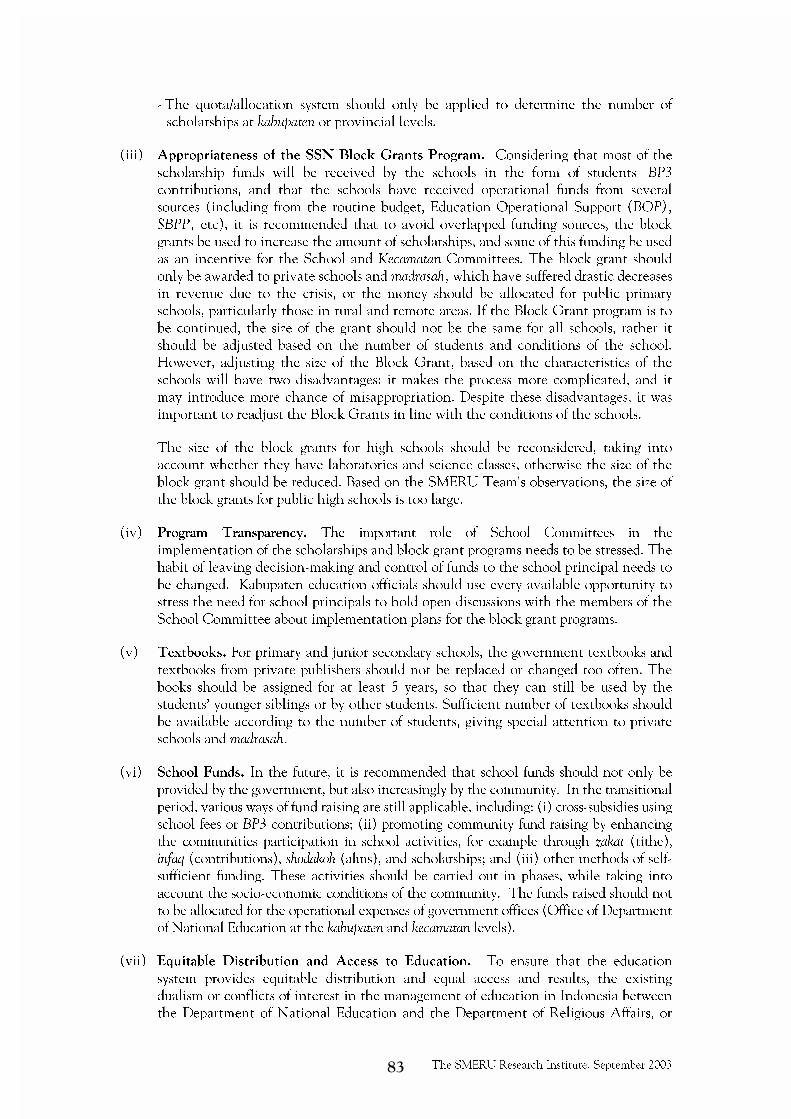
The SMERU Research Institute, September 2003�.�
- The quota/allocation system should only be applied to determine the number of
scholarships at kabupaten or provincial levels.
(iii) Appropriateness of the SSN Block Grants Program. Considering that most of the
scholarship funds will be received by the schools in the form of students' BP3
contributions, and that the schools have received operational funds from several
sources (including from the routine budget, Education Operational Support (BOP),
SBPP, etc), it is recommended that to avoid overlapped funding sources, the block
grants be used to increase the amount of scholarships, and some of this funding be used
as an incentive for the School and Kecamatan Committees. The block grant should
only be awarded to private schools and madrasah, which have suffered drastic decreases
in revenue due to the crisis, or the money should be allocated for public primary
schools, particularly those in rural and remote areas. If the Block Grant program is to
be continued, the size of the grant should not be the same for all schools, rather it
should be adjusted based on the number of students and conditions of the school.
However, adjusting the size of the Block Grant, based on the characteristics of the
schools will have two disadvantages: it makes the process more complicated, and it
may introduce more chance of misappropriation. Despite these disadvantages, it was
important to readjust the Block Grants in line with the conditions of the schools.
The size of the block grants for high schools should be reconsidered, taking into
account whether they have laboratories and science classes, otherwise the size of the
block grant should be reduced. Based on the SMERU Team's observations, the size of
the block grants for public high schools is too large.
(iv) Program Transparency. The important role of School Committees in the
implementation of the scholarships and block grant programs needs to be stressed. The
habit of leaving decision-making and control of funds to the school principal needs to
be changed. Kabupaten education officials should use every available opportunity to
stress the need for school principals to hold open discussions with the members of the
School Committee about implementation plans for the block grant programs.
(v) Textbooks. For primary and junior secondary schools, the government textbooks and
textbooks from private publishers should not be replaced or changed too often. The
books should be assigned for at least 5 years, so that they can still be used by the
students� younger siblings or by other students. Sufficient number of textbooks should
be available according to the number of students, giving special attention to private
schools and madrasah.
(vi) School Funds. In the future, it is recommended that school funds should not only be
provided by the government, but also increasingly by the community. In the transitional
period, various ways of fund raising are still applicable, including: (i) cross-subsidies using
school fees or BP3 contributions; (ii) promoting community fund raising by enhancing
the communities participation in school activities, for example through zakat (tithe),
infaq (contributions), shodakoh (alms), and scholarships; and (iii) other methods of self-
sufficient funding. These activities should be carried out in phases, while taking into
account the socio-economic conditions of the community. The funds raised should not
to be allocated for the operational expenses of government offices (Office of Department
of National Education at the kabupaten and kecamatan levels).
(vii) Equitable Distribution and Access to Education. To ensure that the education
system provides equitable distribution and equal access and results, the existing
dualism or conflicts of interest in the management of education in Indonesia between
the Department of National Education and the Department of Religious Affairs, or

The SMERU Research Institute, September 2003���
between the Office of Department of National Education at the kabupaten and
kecamatan levels, should be improved in the near future. The management system
should be simplified fall under the responsibility of the Department of National
Education. At the kabupaten level, the management of the education system should be
in the hands of the kabupaten office. Such an arrangement will soon be unavoidable
when the Law No. 22/1999 regarding regional autonomy becomes effective.
(viii) Data. A more accurate data system is greatly needed. The level of awareness regarding
the importance of useful data amongst the relevant education authorities should also
be improved. Data should be used for monitoring the school development and the
development planning of education at both national and regional levels.
�
�
�
�