· discriminant analysis dr.a.shyamala economics 39-41 14 socio-economic evaluation of shg’s in...
TRANSCRIPT

ISSN - 2250 - 1991Volume : 1 Issue : 5 May 2012` 200
www.paripex.inListed in International ISSN Directory, Paris.
Journal for All Subjects


INDEXSr. No. Title Author Subject Page No.
1 Convergence of India Gaap with International GAAP / IFRS
Prof. Kalola Rimaben A. Accountancy 1-3
2 Global Scenario of Business Ethics With Corporate Governance
Prof. Dr.Kishor V. Bhesaniya
Accountancy 4-6
3 VAT & ACCOUNTING Miss. Mira J. Bhanderi Accountancy 7-8
4 Carbon Trading: An Emerging Business Dr. Basanta Khamrui, Dilip Kumar Karak
Commerce 9-11
5 Developments in Indian Non Life Insurance Industry Ms.Kiran Sood, Ms.Supriya Tandon
Commerce 12-14
6 Parameters And Costs Influencing Transportation Decisions In Small Manufacturing Firms
Vipul Chalotra,Prof Neetu Andotra
Commerce 15-17
7 Foreign Trade Policy of India (2009-14) Dr. M. K. MARU Commerce 18-20
8 “A Comparative Analysis on Profitability of Selected Petroleum Industries”
Dr. Ramesh A. Dangar Commerce 21-23
9 An Empirical study on Consumer Awareness on Internet Banking in Gujarat
Dr. Vinod K. Ramani Commerce 24-26
10 Study of Factors Affecting HNIs’ Preferences for their Banks in South Mumbai Area
Shri. Arvind A. Dhond Commerce 27-31
11 Promotion mix straregy of jammu and kashmir co-operatives supply and marketing federation limited in jammu district of J&K state
Tarsem Lal Commerce 32-35
12 Intelligent Brain Tumor Tissue Segmentation from Magnetic Resonance Image using forward and backward anisotropic diffusion
S.Nithya Roopa,P. Vasanthi Kumari
Computer Science
36-38
13 Share of Women in Total Family Income – A Two Group Discriminant Analysis
Dr.A.Shyamala Economics 39-41
14 Socio-Economic Evaluation of Shg’s in Bidar District of Karnataka
Dr.Sangappa V. Mamanshetty
Economics 42-44
15 The Development of Chemical and Petrochemicals Industry in Gujarat
Dr.D.G.Ganvit Economics 45-46
16 How Can Primary Teachers Help To Assist The Development Of Positive Self-Esteem In Students Through Their Ordinary Teaching Practice?
Jigar L. Dave Education 47-48
17 Primary Mission Of Colleges Jigar L. Dave Education 49
18 Effectiveness of Readers Theatre on English Reading Comprehension
Ramesh B. Sakhiya Education 50-51
19 The Role of a Computerized Package on EFL Students' Writing Skills
Abdallah Ahmad, Baniabdelrahman, Abdulaziz A. Abanomey
Education 52-57
20 The Use of Team Teaching and its Effect on Saudi EFL Students' English Proficiency
Abdallah Ahmad, Baniabdelrahman, Abdulaziz A. Abanomey
Education 58-63
21 Study and Development of Road Traffic Noise Model Bhavna K. SutharV. R. Gor, A. K. Patel
Engineering 64-66

22 Weather Forecast Using Artificial Neural Network Laxmikant Raskar, Rohit Waghchaure, Md. Danish Raza,Mayuresh Lande
Engineering 67-68
23 Pavement Subgrade Stabilisation with Rice Husk Ash Patil N. L.,Dr. Sanjay Sharma,Dr. Hemant Sood
Engineering 69-71
24 Study of Precipitation and Stream Flow Data- A Case Study of Kim Basin
Prashant A. Ramani Engineering 72-76
25 “Estimation of Revised Capacity for Deo Reservoir of Gujarat, India”
Hiral Shah,N. N. Borad, R. K. Jain
Engineering 77-79
26 Nanotechnology in Cellular Lightweight Concrete Mr. Nakul Shah, Prof. Jayeshkumar Pitroda
Engineering 80-82
27 Plate Load (Model) Test for Bearing Capacity of Layered Deposite
Patel Ankit D., B.R. Dalwadi
Engineering 83-85
28 Effect of Service Bridge on natural frequency of structurally coupled multistory building
Upadhyay Nishith H., Prof. A.N. Desai
Engineering 86-88
29 “Controling the Soil & Land Pollution in Sabarkantha District by Using an App Lication of Remote Sensing and Geographical Information System”
Gaurang J Patel,R.B Khasiya
Engineering 89-91
30 Control The Soil Erosion & Land Pollution By Flood Reduction in The Tapi River,Surat District, Gujarat, India.
Harshad M.Rajgor,K B Khasiya
Engineering 92-95
31 Methodology for managing irrigation canal system with optimum irrigation scheduling for Meshwo irrigation Scheme
Jitendrasinh D. Raol, Roshani A.Patel,Prof S.A.Trivedi
Engineering 96-98
32 Analyis of regional water supply scheme in rural areas (Case Study: Kutch)
Niketa Patel Engineering 99-103
33 Security For Near Field Communication in Cell Phone Biren M Patel, Vijay B Ghadhvi,Mr Ashish Kumar
Engineering 104-106
34 Heterogeneous Traffic Flow Simulation at Urban Roundabout using ‘VISSIM’
Dipti S. Thanki, Asst. Prof. Ashutosh K. Patel
Engineering 107-109
35 Planning of Facilities for Pedestrian Movement in Urban Area: A Case Study of Vadaj Circle, Ahmedabad
Hitesh A. Patel,Pinak. S. Ramanuj
Engineering 110-113
36 Planning for Non-Motorized Transportation Jignesh C.Prajapati, Prof. N.G.Raval
Engineering 114-116
37 Intersection Design for Pedestrians and Cyclist Jignesh C.Prajapati, Prof. N.G.Raval
Engineering 117-120
38 Theoretical Consideration for optimum irrigation scheduling for irrigation Scheme
Jitendrasinh D. Raol, Prof S.A.Trivedi
Engineering 121-124
39 Overall Equipment Effectiveness Measurement and Review of Total Productive Maintenance
Kadiya Pinjal, Navinchandra
Engineering 125-128
40 To Study the Effect Of Stiffness on the Expansion Joint of a Building Subjected to Earthquake Forces
M.D.SHAH, P. G. Patel Engineering 129-132
41 Side Friction and Side Friction Factor (FARIC) In Ahmedabad Road Link
Parmar Dushyant J, Asst. Prof. Ashutosh K. Patel
Engineering 133-134
42 Fiber Reinforced Selfcompacting Concrete Patel Nikunj R,Elizabeth George
Engineering 135-137

43 Modal Analysis of Helical Gear Purusharth J. Patel,D.A. Patel
Engineering 138-140
44 Impact Strength of Ternary Blended Steel fiber Reinforced concrete
Samir M. Gami., D.A.Sinha
Engineering 141-143
45 Identify issues of traffic movement at landside area & remedial measures
Samir P. Mulani,Prof- Naurdin Hajiani
Engineering 144-147
46 Identification of Truck Transportation Issues at a Junction: a case study of Sarkhej Area
Himanshu. B. Shrimali, Prof- Naurdin Hajiani
Engineering 148-152
47 Assessment of Vehicular Carbon Footprint and its Reduction Measures
Chintan Patel,Prof. H.K.Dave
Engineering 153-155
48 Study of Solar Air Heaters with Different Operating Configurations
Ajaypalsinh Gangasinh Barad
Engineering 156-158
49 Traffic Flow Characteristics on Roads of Small Urban Centre
Axay S. Shah,Dr. L.B.Zala
Engineering 159-162
50 Failure in tensile testing on single lap multi-fastener joint with bolted connection
Jagdish N.Prajapati, Dr.Rajula.k.Gujjar, Prof.M.M.Pomal
Engineering 163-167
51 Study Of Infiltration Capacity At Anjar, Kutch Ravi C Ahir, Sagar D Patel
Engineering 168-169
52 Comparison of Temperature-Base Methods For Calculating Reference Evapotranspiration With Standard Penman-Monteith Method
M.R.Popat, S.N.Chavda, B.H.Pandit
Engineering 170-172
53 Electronic customer relationship management: benefits and trend
Tanuja Nair Engineering 173-174
54 VIRTUAL CLASS ROOM USING MOBILE AD-HOC NETWORK
Gaurav Katariya, Yogesh Parkhe, Devendra Patil,Pawan Pawar
Engineering 175-176
55 PARKING EVALUATION: A CASE STUDY OF AMUL DAIRY ROAD ANAND
Jaydipsinh P. Chudasama, Dr. L.B.Zala
Engineering 177-180
56 ENERGY ANALYSIS OF SOLAR AIR HEATER BY USING DIFFERENT TYPES OF ABSORBER PLATES
Vivek B. Patel,Dr. L.B.Zala
Engineering 181-183
57 Effect of Aspect Ratio W/L ,Body Bias ,and supply Voltage (vDD) for NMOS & PMOS transistor.
Rubina Siddiqui, Angeeta Hirwe, Rahul Parulkar
Engineering 184-186
58 Spider diversity of Wan Wild life Sanctuary, Vidharbha , India.
Taktode N.M. Environment 187-188
59 The Initial Human Behavioural Response to Rapid On set Natural Disaster: Earthquake
S.S. Patil, K.L. Karkare, I.B. Ghorade
Environmental Science
189-190
60 Spatio-temporal Distribution of Surface Water for Irrigation in Satara District of Maharashtra: An Analytical Study
Pawar D. H., Jadhav K.R.
Geography 191-193
61 Nagarcha wadh v kushi bhumi upyog badal nanded-vaghan ek abhyas pahani
Prof. Mane Deshmukh R. S., Dr. S. B Rathod
Geography 194-196
62 Socio-Economic and Nutritional Status of Children with Mental Retardation
Dr. S. S. Vijayanchali Home Science 197-199
63 Motivating Employees under Adverse Conditions Dr Alpesh B Joshi Human Resource
200-202
64 “Strategic Human Resource Management” Dr. M. Venkatasubba Reddy, B. Swetha,S. Jaya Krishna
Human Resource Management
203-204

65 Identifying Crosscutting Concerns for Software Requirement Engineering
Velayutham Pavanasam, Chandrasekaran Subramaniam
Information Technology
205-207
66 Gate pass Automation with Image,Barcode reading and Biometrics
Sumant C. Murke,Tejas N. Athavale, Sangram A. Nalawade
Information Technology
208-210
67 Plight of Rape Victims With Special Reference to India Dr. Monica Narang, Richa Sabharwal
Law 211-212
68 Libraries: An Essential Tool for the Advancement of Knowledge Resources & Research in Recent Era
Dr. Umesh Patel Library Science 213-215
69 An Analytic Study of BA/BSc/BCA/BCom Part I General English Syllabus Prescribed by the University of Jammu
Dr. Wajahat Hussain Literature 216-217
70 A Study on Quality of Work Life Dr.N.Thenpandian Management 218-219
71 Best HR Practices Kavita Trivedi Management 220-221
72 A Study on Employee Retention Practices of Automobile Industry in INDIA
Dr.K.Balanaga Gurunathan, Ms. V.Vijayalakshmi
Management 222-224
73 A Study on Innovation for Organizational Excellence in Health Care Industry in a Private Multi-Speciality Organization
Dr. C. Swarnalatha,T.S. Prasanna
Management 225-227
74 “Performance measurement of Top 10 Mutual Funds with the help of Sharpe, Treynor & Jenson Model”
Monal Patel, Dr. Deepak H. Tekwani
Management 228-230
75 Strategic Expansion for Growth A Case Study on Codescape Consultants Pvt Ltd. (Infinite Possibilities)
Akshay Arora,Abhilansh Bhargava, Preeti Sharma
Management 231-232
76 Role Of Education In Innovation For Economic Development - A Case Study
Dr. Ananthapadhmanabha Achar
Management 233-238
77 ROLE OF HR PROFESSIONAL IN DEALING DISCIPLINARY PROCEEDINGS CONSTRUCTIVELY - AN OVERVIEW
C Santhanamani, Dr. N. Panchanatham
Management 239-241
78 Power of Advertising Supriya Tandon Management 242-244
79 Enhancing Employee Engagement: A Need of The Hour Urmila Vikas Patil Management 245-247
80 Role of E-Learning to Enhance Qualities of Physical Education Teachers and Coaches
Gohil Rajendrasinh K. Physical Education
248-250
81 “Eco – Environmental Study on Nutrient Removal Potential of Eichhornia Crassipes from Domestic Wastewater”
D. K. Patel, V. K. Kanungo
Science 251-253
82 Aphasia – a loss of linguistic faculty Dr Alpesh B Joshi Social Sciences 254-256
83 Workaholism – A Modern Day Nuisance Dr Alpesh B Joshi Social Sciences 257-258
84 Vartman me Dalit Varg ki Samasya Dr. H. L. Chavda Sociology 259-260

Volume : 1 | Issue : 5 | May 2012 ISSN - 2250-1991
PARIPEX - INDIAN JOURNAL OF RESEARCH X 125
Research Paper
* M.E. (Production), LDRP ITR, Gandhinagar
Engineering
Overall Equipment Effectiveness Measurement and Review of Total Productive Maintenance
* Kadiya Pinjal Navinchandra
Keywords : Total Productive Maintenance; Overall Equipment Effectiveness
This paper will review the goals and benefits of implementing Total Productive Maintenance, and also focusing on calculating the overall equipment effectiveness in one of Steel Company in India, and it also discuss the big six losses in any industry. A case study taken from Company, the data taken along 15 working days and teams formed to find out the benefit of formation a multidiscipline team from different department to eliminate any boundaries between the departments and make the maintenance process more effectively, labors included in way to adopt the autonomous (daily) maintenance. As a result the company achieved 99% in quality factor of overall equipment effectiveness equation and 76% in availability where in performance it got 72%. Set of techniques like Single minute exchange die, computer maintenance management system, and production planning were suggested to industry after calculating the OEE to improve their maintenance procedures and improve the productivity.
ABSTRACT
1. IntroductionMaintenance was activity where all companies applying it without knowing its importance, but after the improving in production strategies and improve the flexibility of production line to produce a wide range of different products, the need for good maintenance strategy becomes bigger, and in the present times especially, because of automation and large-scale mechanization, higher plant availability, better product quality and long equipment life had assumed considerable significance [1]. Now many companies focus to optimize their assets, and use equipments more effectively, and one of the main parts of is the maintenance department or the employ-ees responsible for that [2]. The main idea behind the main-tenance is to make the parts and machine ready to do what are required.
Total productive maintenance (TPM) is new maintenance strategy developed to meet the new maintenance needs [3]. It is closely tied to JIT (Just in Time) and TQM (Total Quality Management) and it is extension of PM (preventive mainte-nance), where the machines work at high productivity and efficiency, and where the maintenance is all employee re-sponsibility, and focus to prevent the problem before it may occurs [4].
Bamber (1998) presents the two definitions of TPM, first one depend on the Japanese approach and the other depend on western approach. The Japanese approach to TPM is consid-ered to be that a full definition which contains five main points:
1. To use the equipment more efficiently.2. It establishes a total preventive maintenance system.3. It requires a full participation from all department operator 4. It involves everyone in the company shop floor to the top
management.5. It promotes and implements preventive maintenance
based on autonomous, small group activities.
In the UK, TPM has been pioneered by Edward Willmott (1997), the managing director of willmott Consulting Group, acknowledges the five point of the which being considered definition the Japanese approach to TPM and consequently accepts this as being an accurate and true reflection of the main principles; however he provides a definition that is more
suited to Western manufacturing and which is:
“TPM seeks to engender a company-wide approach towards achieving a standard of performance in manufacturing, in terms of the overall effectiveness of equipment, machines and processes, which is truly world class”
2. TPM GoalsTPM seeks to minimize all the potential losses in the produc-tion and to operate equipment with full design capability. TPM also take the quality in consideration by making a zero prod-uct defect rate, which means no production scrap or defect, no breakdown, no accident, no waste in the process running or changeover [6]. TPM can be defined by considering the following goals:
1. Improving equipment effectiveness, This mean looking into the six big losses which divided from three main losses:
a. Down time losses: classified as Equipment breakdowns and, Setup and adjustment slowdowns.
b. Speed losses: which can be found as Idling and short-term stoppages and Startup/restart losses.
c. Defects or Quality losses: everything about Scrap and re-work and Startup losses.
d. Involving operators in daily maintenance, this means to achieve autonomous maintenance where the workers who operate the equipment are allowed to take responsi-bility for some of maintenance activities [5]
e. Improving maintenance efficiency and effectiveness, this mean having a systematic approach to all maintenance activities. This involves the level of preventive mainte-nance required for each piece of equipment, the creation of standards for condition-based maintenance, and the setting of respective responsibilities for operating and maintenance staff. The respective roles of “operating” and “maintenance” staff are seen as being distinct. Main-tenance staff are seen as developing preventive actions and general breakdown services, whereas operating staff take on the “ownership” of the facilities and their general

Volume : 1 | Issue : 5 | May 2012 ISSN - 2250-1991
126 X PARIPEX - INDIAN JOURNAL OF RESEARCH
care. Maintenance staffs typically move for more facilitat-ing and supporting role where they are responsible for the training of operators, problem diagnosis, and devising and assessing maintenance practice [2].
f. Educating and training personnel, is most important in the TPM; it involves everyone in the company: Operators are taught how to work and. Because operators will be performing some of the inspections, routine machine ad-justments, and other preventive tasks, training involves teaching operators how to do those inspections and how to work with maintenance in a partnership. Also involved is training supervisors on how to supervise in a TPM en-vironment.
g. Designing and managing equipment for maintenance prevention. Equipment is costly and should be viewed as a productive asset for its entire life. Designing equip-ment that is easier to operate and maintain than previous designs is a fundamental part of TPM. Suggestions from operators and maintenance technicians help engineers design, specify, and procure more effective equipment. By evaluating the costs of operating and maintaining the new equipment throughout its life cycle, long-term costs will be minimized. Low purchase prices do not necessar-ily mean low life-cycle costs [2].
3. Six Big LossesOne of the major goals of TPM and OEE is to reduce the six big losses which are the most common causes of efficiency loss in manufacturing. The link of the losses and the effec-tiveness in TPM is defined in terms the quality of the prod-uct and the equipment availability. Any operation time may face losses and these can be visible like scrap, changeovers and breakdowns or invisibles such as the slow running, the frequent adjustment to maintain the production within toler-ance, Nakajima summarized the loss in a six big losses as following:
• Downtime Losses:It found if the output is zero and the system produces noth-ing, where the unused segments of time, during the examined period are downtime losses, and mainly it can be one of two:
2. Breakdown losses this loss is due to parts failure where they cannot work anymore and they need either repair or replace. These losses are measured by how long it takes from labor or parts for fixing the problem.
3. Setup and adjustment time, These losses are due to the changes in the operating conditions, like the start of the production or the start of the different shifts, changes in products and condition of the operation. The examples of this kind of losses are equipments changeovers, ex-change of dies, jigs and tools.
• Speed Losses:When the output is smaller than the output at references speed these are called speed losses. When considering speed losses, one dose not check if the output conforms to quality specifications. This can be found in two forms:
Minor stoppage losses these losses are due to the reason of machine halting, jamming, and idling. Many companies are considering these minor stoppages as the breakdowns in or-der to give importance to this problem [8].
1. Speed losses these losses are due to the reduction in speed of the equipment. In other words the machine is not working at the original or theoretical speed. If the quality defect and minor stoppages occurs regularly then the machine is run at low speed to cover the problems. It is measure by comparing the theoretical to actual working load.
• Defect or quality losses:The produced output either dose or dose not confirm to speci-
fications. If it does not comply, this is considering a quality loss.
1. Rework and quality defects; these losses are due to the defective products during the routine production. These products are not according to the specifications. So that rework is done to remove the defects or make a scrap of these products. Labor is required to make a rework which is the cost for the company and material become a scrap is also another loss for the company. The amount of these losses is calculated by the ratio of the quality products to the total production.
2. Yield losses; are due to wasted raw materials .The yield losses are split into two groups. The first one is the raw materials losses which are due to the product design, manufacturing method etc. The other is the adjustment losses due to the quality defects of the products.
4. Overall Equipment EffectivenessOEE is a result can be expressed as the ration of the actual output of the equipment divided by the maximum output of the equipment under the best performance condition. The Overall Equipment Effectiveness was originated from the Total Pro-ductive Maintenance practices, developed by S.Nakajima at the Japan Institute of Plant Maintenance, the aims of TPM is to achieve the ideal performance and achieve the Zero loss [6] which means no production scrap or defect, no breakdown, no accident, no waste in the process running or changeover.
4.1. OEE CalculationOEE is equal to the multiplication of the three main bases for the main six big losses:
1. Availability indicates the problem which caused by down-time losses.
2. Performance indicates the losses caused by speed loss-es and
3. Quality indicates the scrap and rework losses. OEE = Availability x Performance rate x Quality rate
_______ (1)
4.1.1 AvailabilityThe availability is calculated as the required availability minus the downtime and then divided by the required availability. This can be written in the form of formula as
Availability = [(Required availability - Downtime)/ Required availability] * 100 _______ (2)
The required availability can be defined as the time of pro-duction to operate the equipment minus the other planned downtime like breaks, meetings etc. The down time can be defined as the actual time for which the equipment is down for repairs or changeovers. This time is also sometimes known as the breakdown time. The output of this formula gives the true availability of the equipment. This value is used also in the overall equipment effectiveness formula to measure the effectiveness of the equipment.
4.1.2. PerformanceThe performance rate can be defined as the ideal or design cycle time to produce the item multiplied by the output of the equipment and then divided by the operating time. This will give the performance rate of the equipment. The formula to calculate the performance rate can be expressed as
Performance rate = ((design cycle time * output)/Operating time) * 100____ (3)
The design cycle time or the production output will be in the unit of production, like parts per hour and the output will be the total output in the given time period interval. The operat-ing time will be the availability value of the availability formula. The result of this formula will be in the percentage of the per-formance of the equipment.
Volume : 1 | Issue : 5 | May 2012 ISSN - 2250-1991
PARIPEX - INDIAN JOURNAL OF RESEARCH X 127
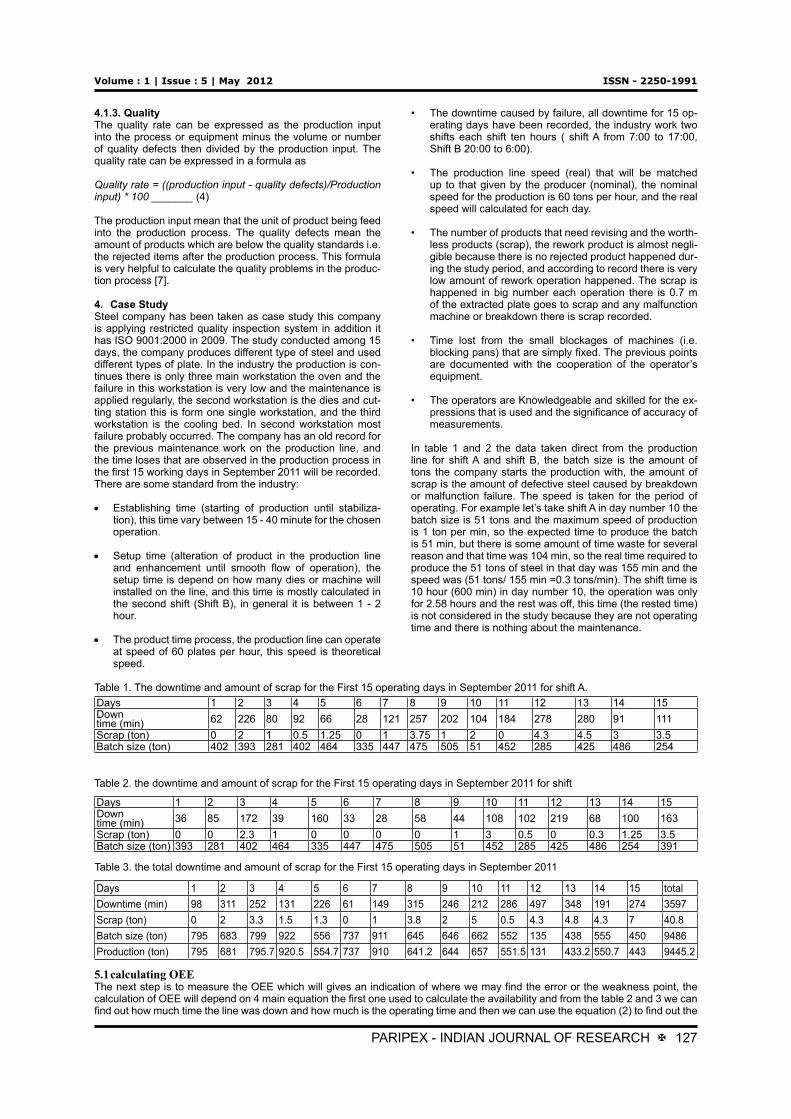
4.1.3. QualityThe quality rate can be expressed as the production input into the process or equipment minus the volume or number of quality defects then divided by the production input. The quality rate can be expressed in a formula as
Quality rate = ((production input - quality defects)/Production input) * 100 _______ (4)
The production input mean that the unit of product being feed into the production process. The quality defects mean the amount of products which are below the quality standards i.e. the rejected items after the production process. This formula is very helpful to calculate the quality problems in the produc-tion process [7].
4. Case StudySteel company has been taken as case study this company is applying restricted quality inspection system in addition it has ISO 9001:2000 in 2009. The study conducted among 15 days, the company produces different type of steel and used different types of plate. In the industry the production is con-tinues there is only three main workstation the oven and the failure in this workstation is very low and the maintenance is applied regularly, the second workstation is the dies and cut-ting station this is form one single workstation, and the third workstation is the cooling bed. In second workstation most failure probably occurred. The company has an old record for the previous maintenance work on the production line, and the time loses that are observed in the production process in the first 15 working days in September 2011 will be recorded. There are some standard from the industry:
• Establishing time (starting of production until stabiliza-tion), this time vary between 15 - 40 minute for the chosen operation.
• Setup time (alteration of product in the production line and enhancement until smooth flow of operation), the setup time is depend on how many dies or machine will installed on the line, and this time is mostly calculated in the second shift (Shift B), in general it is between 1 - 2 hour.
• The product time process, the production line can operate at speed of 60 plates per hour, this speed is theoretical speed.
• The downtime caused by failure, all downtime for 15 op-erating days have been recorded, the industry work two shifts each shift ten hours ( shift A from 7:00 to 17:00, Shift B 20:00 to 6:00).
• The production line speed (real) that will be matched up to that given by the producer (nominal), the nominal speed for the production is 60 tons per hour, and the real speed will calculated for each day.
• The number of products that need revising and the worth-less products (scrap), the rework product is almost negli-gible because there is no rejected product happened dur-ing the study period, and according to record there is very low amount of rework operation happened. The scrap is happened in big number each operation there is 0.7 m of the extracted plate goes to scrap and any malfunction machine or breakdown there is scrap recorded.
• Time lost from the small blockages of machines (i.e. blocking pans) that are simply fixed. The previous points are documented with the cooperation of the operator’s equipment.
• The operators are Knowledgeable and skilled for the ex-pressions that is used and the significance of accuracy of measurements.
In table 1 and 2 the data taken direct from the production line for shift A and shift B, the batch size is the amount of tons the company starts the production with, the amount of scrap is the amount of defective steel caused by breakdown or malfunction failure. The speed is taken for the period of operating. For example let’s take shift A in day number 10 the batch size is 51 tons and the maximum speed of production is 1 ton per min, so the expected time to produce the batch is 51 min, but there is some amount of time waste for several reason and that time was 104 min, so the real time required to produce the 51 tons of steel in that day was 155 min and the speed was (51 tons/ 155 min =0.3 tons/min). The shift time is 10 hour (600 min) in day number 10, the operation was only for 2.58 hours and the rest was off, this time (the rested time) is not considered in the study because they are not operating time and there is nothing about the maintenance.
Table 1. The downtime and amount of scrap for the First 15 operating days in September 2011 for shift A.Days 1 2 3 4 5 6 7 8 9 10 11 12 13 14 15Downtime (min) 62 226 80 92 66 28 121 257 202 104 184 278 280 91 111Scrap (ton) 0 2 1 0.5 1.25 0 1 3.75 1 2 0 4.3 4.5 3 3.5Batch size (ton) 402 393 281 402 464 335 447 475 505 51 452 285 425 486 254
Table 2. the downtime and amount of scrap for the First 15 operating days in September 2011 for shift
Days 1 2 3 4 5 6 7 8 9 10 11 12 13 14 15Downtime (min) 36 85 172 39 160 33 28 58 44 108 102 219 68 100 163Scrap (ton) 0 0 2.3 1 0 0 0 0 1 3 0.5 0 0.3 1.25 3.5Batch size (ton) 393 281 402 464 335 447 475 505 51 452 285 425 486 254 391
Table 3. the total downtime and amount of scrap for the First 15 operating days in September 2011
Days 1 2 3 4 5 6 7 8 9 10 11 12 13 14 15 totalDowntime (min) 98 311 252 131 226 61 149 315 246 212 286 497 348 191 274 3597Scrap (ton) 0 2 3.3 1.5 1.3 0 1 3.8 2 5 0.5 4.3 4.8 4.3 7 40.8Batch size (ton) 795 683 799 922 556 737 911 645 646 662 552 135 438 555 450 9486Production (ton) 795 681 795.7 920.5 554.7 737 910 641.2 644 657 551.5 131 433.2 550.7 443 9445.2
5.1 calculating OEEThe next step is to measure the OEE which will gives an indication of where we may find the error or the weakness point, the calculation of OEE will depend on 4 main equation the first one used to calculate the availability and from the table 2 and 3 we can find out how much time the line was down and how much is the operating time and then we can use the equation (2) to find out the

Volume : 1 | Issue : 5 | May 2012 ISSN - 2250-1991
128 X PARIPEX - INDIAN JOURNAL OF RESEARCH
availability of the production line. The study was taking during 15 days, all the days were normal working days; if we want to calculate them there were 4 weekend only which extend the study period to 19 days, so the theoretical operating time will be 19 days * 24 hours/days = 456 hours, and the available operating time will be 19 days - 4 days = 15 days. And there are two shifts only with 10 working hours per shift which make the available operating time is equal to 15 days * 2 shift/day * 10 hours/shift = 300 hours. And there is stoppage/pause one hour per day for 1 hour, which gives in total 15 hours 300 - 15 = 285 hours available operating time.
5.1.1. The Availability FactorTotal downtime is equal to 59.95 hours as shown in table 4, for the 1st 15 operating days, the valuable operating time for the 15 days will calculated by adding the amount of theoreti-cal time needed to produce the batch size to the amount of down time. We know that the time needed to produce one ton is one minute, so the total time needed to produce the whole batch for 15 days is equal to 158 hours (9486 tons * 1 hour/ 60 tons = 158.1 hours), and with addition
To the amount of downtime equal 59.95 hours that gives 158.1 hours + 59.95 hours = 218.05 hours valuable operating time.Availability = valuable operating time / available operating timeAvailability = 218 hours / 285 hours = 0.76 = 76%
5.1.2. The Performance FactorTo calculate the performance we need two factors, the first one is the designed cycle time which is 60 ton/hour, and the total output is 9445.2 ton by applying equation result is below:Performance rate = ((design cycle time * output)/ Operating time) = (1min/ton * 9445.2 ton)/ (218*60) = 0.72 = 72%
5.1.3. The Quality FactorTo calculate the quality factor we need the total amount of defect and scrap plate for the 15 operating days and we find it from the table 4, total scrap or defect amount is 40.8 tons and the total batch size is 9486 tons, and the quality factor isQuality rate = ((production input - quality defects)/ Production input)* 10 = (9486 tons - 40.8 tons)/ 9486 tons = 0.996 = 99.6%
5.1.4. The Overall Equipment EffectivenessAfter we got the three main factors we can now calculate the overall equipment by using the following equation OEE = Availability * performance * Quality = 0.76 * 0.72 * 0.996 = 0.55 = 55%
The world class manufacturing OEE is 85%, and the best OEE score in the company was calculated by the machines designer and it was 72%, the equipment effectiveness is re-duced by 17%.
5.2. Implementation TPM StrategyThe company was motivated to implement TPM to cope with the new market need and to increase their production per-formance, eliminate the waste which don’t add value to the production like waste of time and waste of material. The first initiative was towards to increase the quality, by implementing good quality inspection system and monitoring, and that was through the quality improvement team, and uses the data for a continuous improvement. As the result the steel company reaches ISO 9001:2000 by 2009.
Launch autonomous maintenance to setup, inspecting and adjust the equipments while cleaning it and checking the bolt tightness. The creation of multidisciplinary teams involving all the departments, even the supplier is invited to the meeting to discuss the quality of the raw material supplied. There was a creation of three teams, the first team called SBU solve prob-lem unit its job is to identify and resolve a problem if it occurs in the plant, and record in the ‘Gap list’ if it is not solved means the gap not closed. The second team which is the focus team takes the problem in charge; this team solves it at a system-atic level. This team is responsible as well for the evaluation of the equipments and the processes and set up an optimum practice to eliminate any losses and ensure the continuous improvement. The third team involves all the managers and the heads of department in the objective is to plan a safe and profitable strategy for the entire productivity journey.
6. DiscussionIn Company they never thought to have system which calcu-lates their performance while they have a standard OEE since the installation of the line. But without calculated it we cannot improve it, we saw the performance of the company as overall equipment effectiveness is 55%, where the availability of the line was 76% of the production time and the performance was 72% while the quality factor is 99.6%. Table 5 shows the com-parison between world class measurement and the company measurement
Table 4. The comparison between WCM and company
OEE company OEE world classAvailability 76% 90%Performance 72% 95%Quality 99% 99%
As we see from the table 4 the company achieved the world class quality factor, and as presented above the company had ISO 9001:2000 certificate in 2011, and they are applied a strong quality measurement and inspection system start from the raw materials inventory to the work in process finished with finish goods inventory. But the company needs to work hard to improve their system machines and reduce the waste time.
7 ConclusionBy implementing the TPM they can eliminate most of the waste happened like the time waste while changeover or the downtime losses, with this maintenance strategy the respon-sibility of maintain the equipment is all operator and engineer-ing responsibility, there will be no more “his or my” fault the break down will be solved as fast as possible. The operator in the shop floor should involve in each maintenance operation because he is the one close to the machine and he know what are the abnormality of the machine.
There are three main techniques will have a very good impact to improve the production line and make the maintenance process more effectively, CMMS, production planned, and SMED, those techniques will help the company to operate at high rate of performance without losses.
The project gives new huge step to the company in calcula-tion the performance and how they can focus on the prob-lems, when we formed a group from each department the company got a chance to see how the team work is impor-tant in solving the problem. Calculating the OEE also give the company where they are and where is the weakness point and how to improve.
REFERENCES
[I] Rajiv Kumar Sharma, Dinesh Kumar and Pradeep Kumar, "Manufacturing excellence through TPM implementation: a practical analysis", Industrial Management & Data System, Vol. 106 No. 2, 2006, 256-280. | [2] Terry Wireman, Total Productive Maintenance, 2nd edition, 2004. | [3] Muhammad Shahid Tufail, Investigation of the ways to improve the performance of a plant, Vaxjo University School of Technology and Design, 2011, http://www.vxu.se/td. | [4] Heinz P. Loch, "Improving machinery reliability", 1998. | [5] E. Nadarajah, M. Sambasivan, S. Yahya, "Autonomous Maintenance - An Effective Shop-Floor Tool to Improve Productivity, Institute of Technology Management and Entrepreneurship Kolej University Technical KebangsaanMalaysia, 2006. | [6] Nakajima S., Introduction to TPM, productivity press, Portland , 1988. | [7] Bamber, "Factors affecting successful implementation of total productive maintenance'', University of Salford, 1998. | [8] Willmott, P, TPM: Total Productive Maintenance: The Western Way, Butterworth-Heinemann, 1997, Oxford

Editor,PARIPEX - Indian Journal Of Research8-A, Banans, Opp. SLU Girls College,New Congres Bhavan, Paldi, Ahmedabad-380006.Contact.: +91-8866003636 E-mail : [email protected]
Printed at Unique Offset, Novatsing Rupam Estate, Opp. Abhay Estate, Tavdipura, Shahibaug, Ahmedabad
Sara Publishing AcademyPARIPEX - Indian Journal Of Research
Journal for All Subjects
International Index JournalFor English, Hindi, Gujarati,
Marathi, Sanskrit