© copyright mcgraw-hill 2000 11-1 chapter 11 other chi-square tests
TRANSCRIPT
© Copyright McGraw-Hill 200011-1
CHAPTER 11
Other Chi-Square Tests
© Copyright McGraw-Hill 200011-2
Objectives
Test a distribution for goodness of fit using chi-square.
Test two variables for independence using chi-square.
Test proportions for homogeneity using chi-square.
© Copyright McGraw-Hill 200011-3
Introduction
The chi-square distribution can be used for tests concerning frequency distributions, such as: “ If a sample of buyers is given a choice of automobile colors, will each color be selected with the same frequency?”
The chi-square distribution can also be used to test the independence of two variables. For example, “Are senators’ opinions on gun control independent of party affiliations?”
© Copyright McGraw-Hill 200011-4
Introduction (cont’d.)
The chi-squared distribution can be used to test the homogeneity of proportions. For example: “Is the proportion of high school seniors who attend college immediately after graduating the same for the northern, southern, eastern, and western parts of the United States?”
© Copyright McGraw-Hill 200011-5
Test for Goodness-of-Fit
The chi-square statistic can be used to see whether a frequency distribution fits a specific pattern. This is referred to as the chi-squared goodness-of-fit test.
© Copyright McGraw-Hill 200011-6
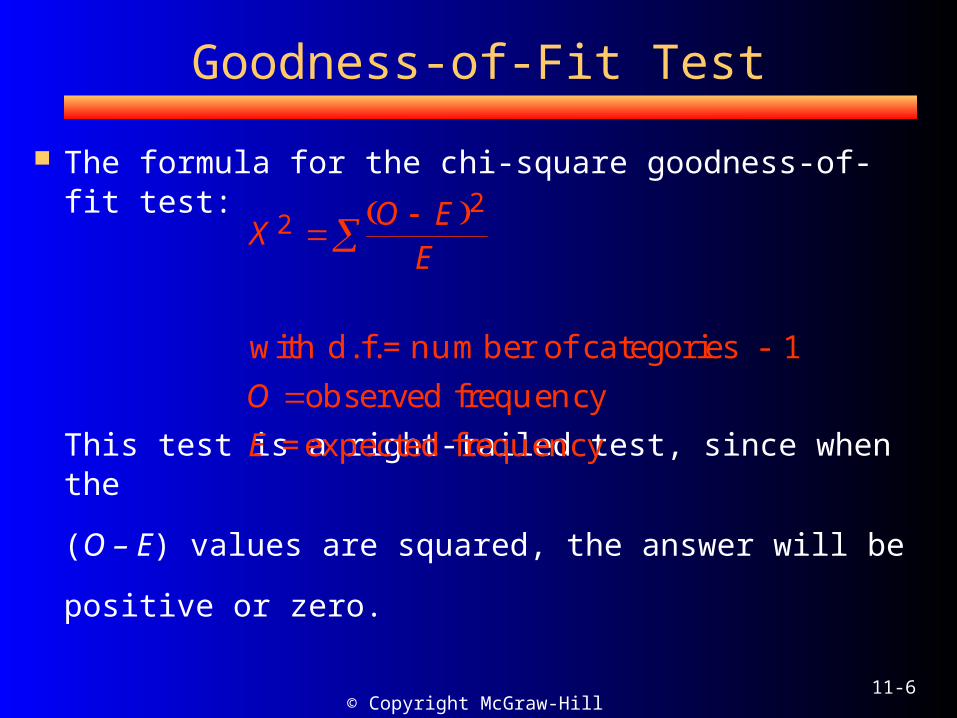
Goodness-of-Fit Test
The formula for the chi-square goodness-of-fit test:
This test is a right-tailed test, since when the
(O – E) values are squared, the answer will be
positive or zero.
XO E
E
O
E
22
1
with d.f.=number of categories -
observed frequency
=expected frequency
© Copyright McGraw-Hill 200011-7
Goodness-of-Fit Test Assumptions
The data are obtained from a random sample.
The expected frequency for each category must be 5 or more.
© Copyright McGraw-Hill 200011-8
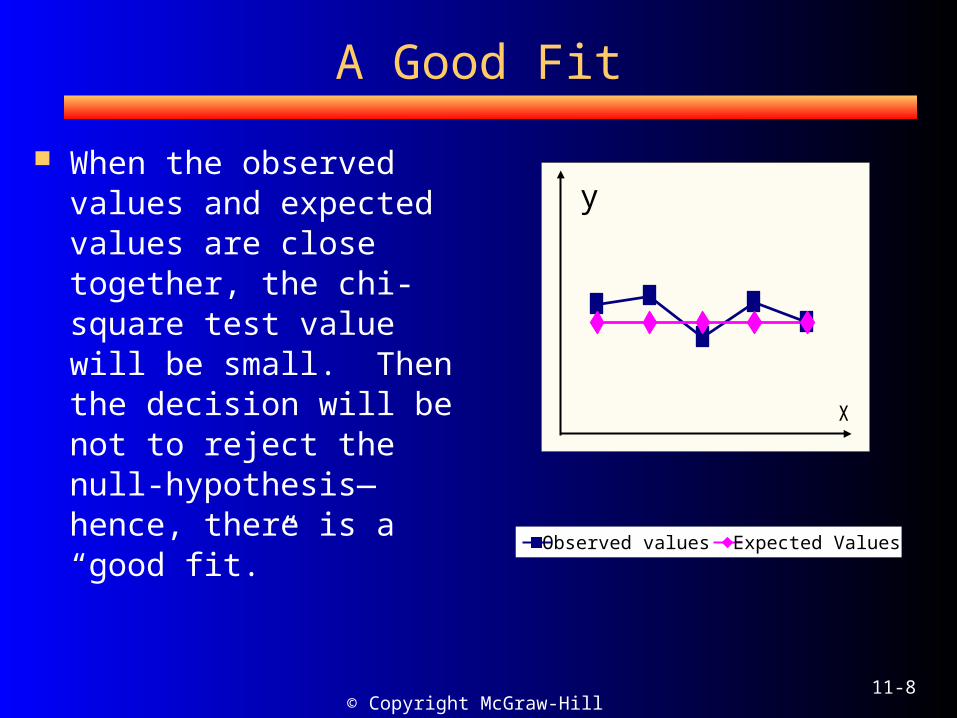
A Good Fit
When the observed values and expected values are close together, the chi-square test value will be small. Then the decision will be not to reject the null-hypothesis—hence, there is a “good fit.”
x
y
Observed values Expected Values
© Copyright McGraw-Hill 200011-9
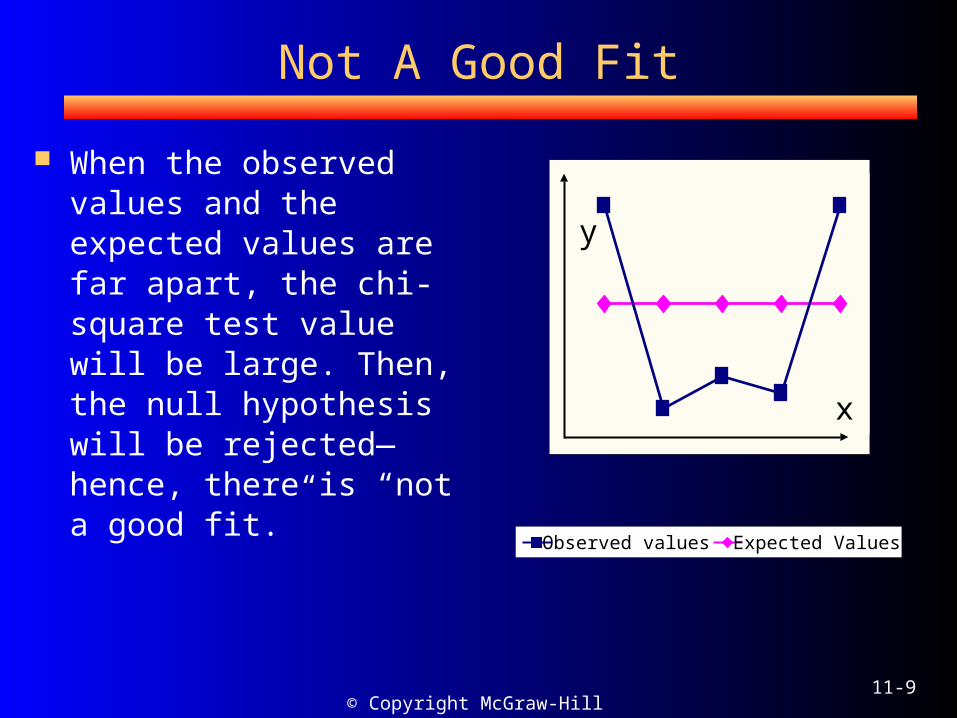
Not A Good Fit
When the observed values and the expected values are far apart, the chi-square test value will be large. Then, the null hypothesis will be rejected—hence, there is “not a good fit.”
Observed values Expected Values
y
x
© Copyright McGraw-Hill 200011-10
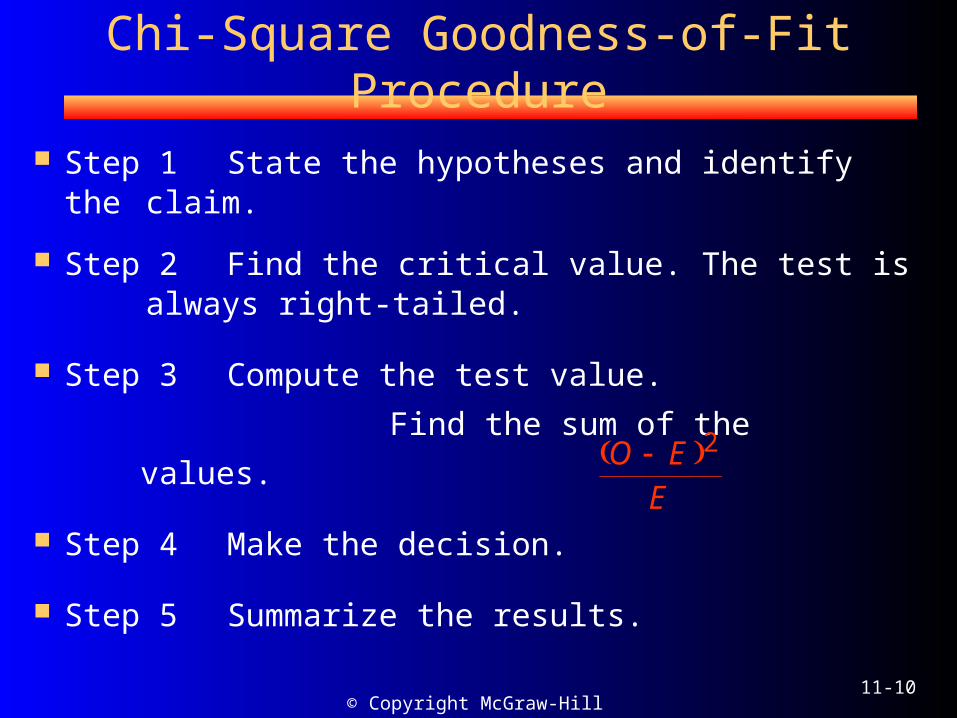
Chi-Square Goodness-of-Fit Procedure
Step 1 State the hypotheses and identify the claim.
Step 2 Find the critical value. The test is always right-tailed.
Step 3 Compute the test value.
Find the sum of the values.
Step 4 Make the decision.
Step 5 Summarize the results.
O EE 2
© Copyright McGraw-Hill 200011-11
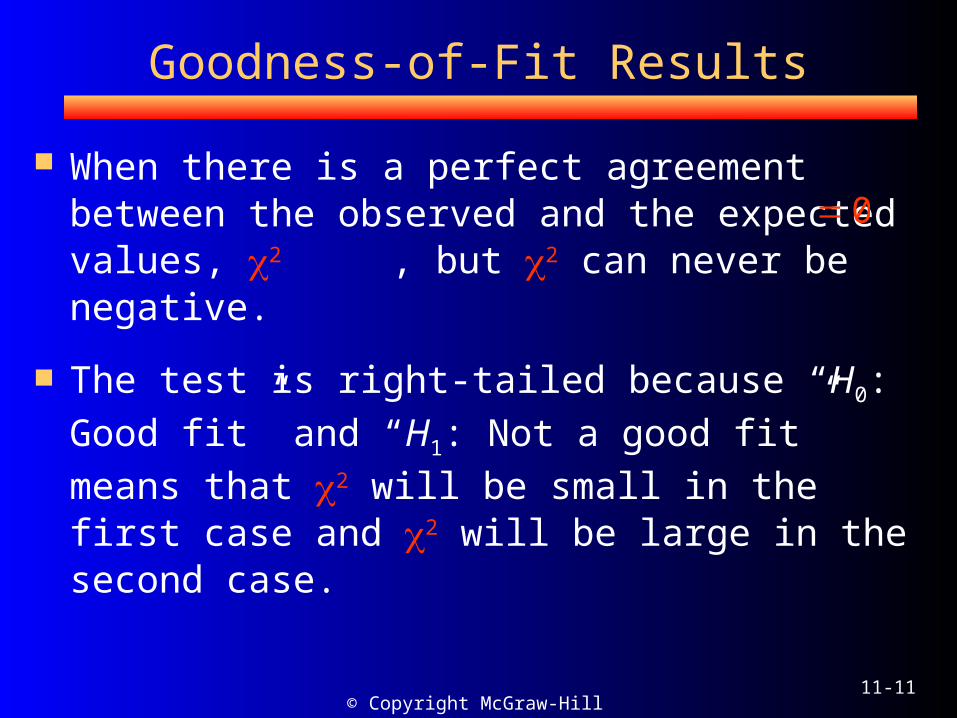
Goodness-of-Fit Results
When there is a perfect agreement between the observed and the expected values, 2 , but 2 can never be negative.
The test is right-tailed because “H0: Good fit” and “H1: Not a good fit” means that 2 will be small in the first case and 2 will be large in the second case.
0
© Copyright McGraw-Hill 200011-12
Test of Normality
The chi-square goodness-of-fit test can be used to test a variable to see if it is normally distributed.
The null hypotheses are:
H0: The variable is normally distributed.
H1: The variable is not normally distributed.
© Copyright McGraw-Hill 200011-13
Independence Test
The chi-square independence test can be used to test the independence of two variables.
H0: There is no relationship between two variables.
H1: There is a relationship between two variables.
If the null hypothesis is rejected, there is some relationship between the variables.
© Copyright McGraw-Hill 200011-14
Chi-Square Independence Test
In order to test the null hypothesis, one must compute the expected frequencies, assuming the null hypothesis is true.
When data are arranged in table form for the independence test, the table is called a contingency table.
© Copyright McGraw-Hill 200011-15
Contingency Table
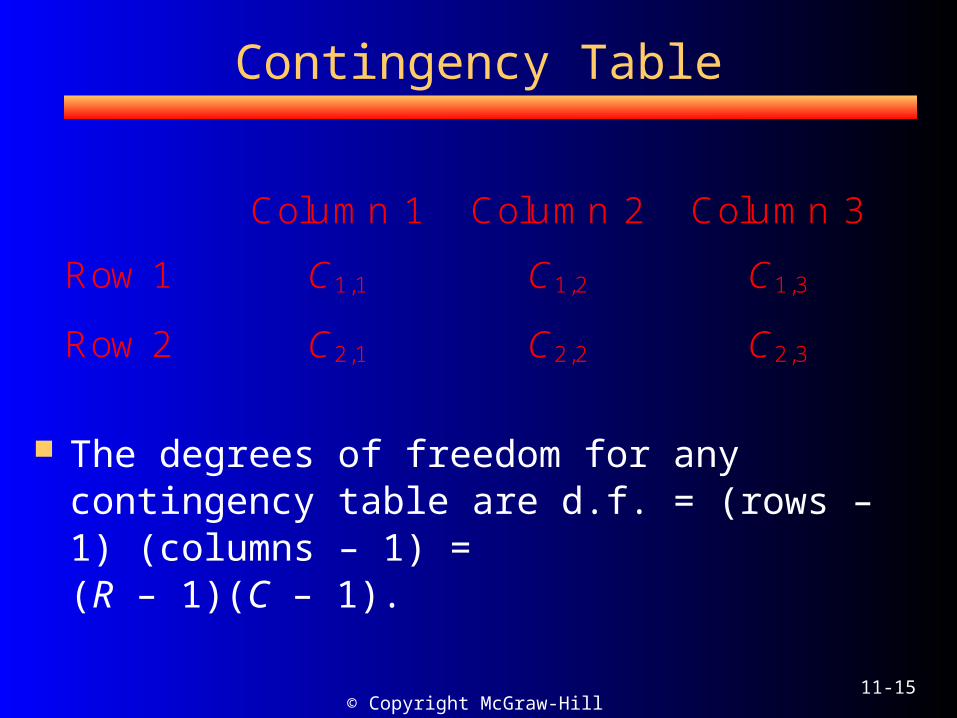
Column 1 Column 2 Column 3
Row 1 C1,1 C1,2 C1,3
Row 2 C2,1 C2,2 C2,3
The degrees of freedom for any contingency table are d.f. = (rows – 1) (columns – 1) = (R – 1)(C – 1).
© Copyright McGraw-Hill 200011-16
Independence Test Value
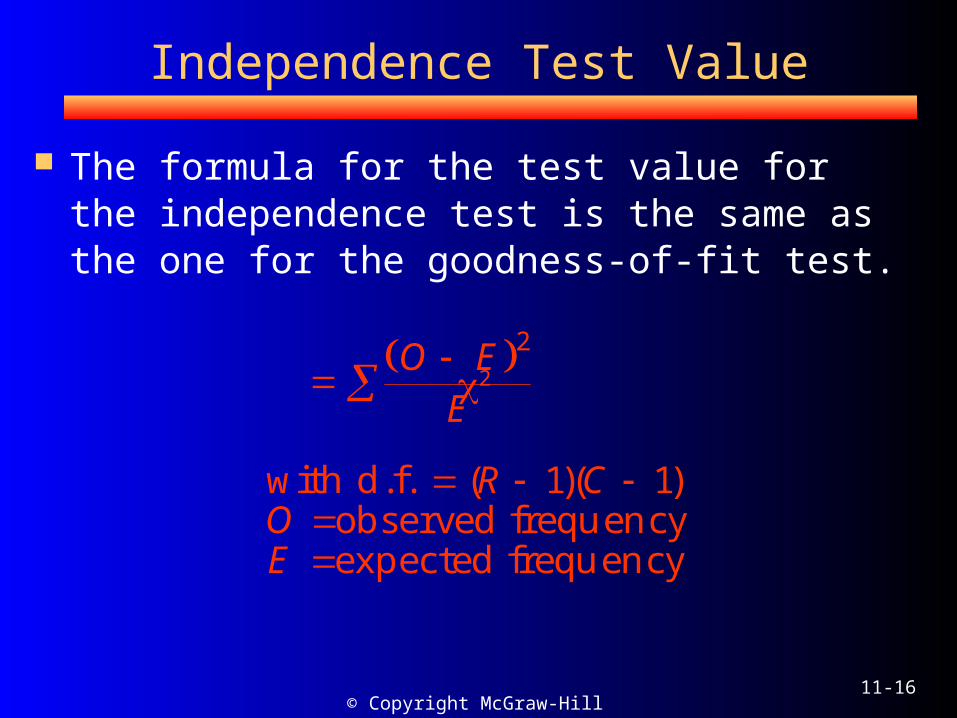
The formula for the test value for the independence test is the same as the one for the goodness-of-fit test.
2 2
1 1
O EE
R COE
with d.f. ( )( )observed frequencyexpected frequency
© Copyright McGraw-Hill 200011-17
Homogeneity of Proportions Test
Homogeneity of proportions test is used when samples are selected from several different populations and the researcher is interested in determining whether the proportions of elements that have a common characteristic are the same for each population.
© Copyright McGraw-Hill 200011-18
Homogeneity of Proportions Test (cont’d.)
H0: p1 = p2 = p3 =… = pn.
H1: At least one proportion is different from the others.
When the null hypothesis is rejected, it can be assumed that the proportions are not all equal.
© Copyright McGraw-Hill 200011-19
Independence and Homogeneity
The procedures for the chi-square independence and homogeneity tests are identical and summarized below.
Step 1 State the hypotheses and identify the claim.
Step 2 Find the critical value in the right tail.
© Copyright McGraw-Hill 200011-20
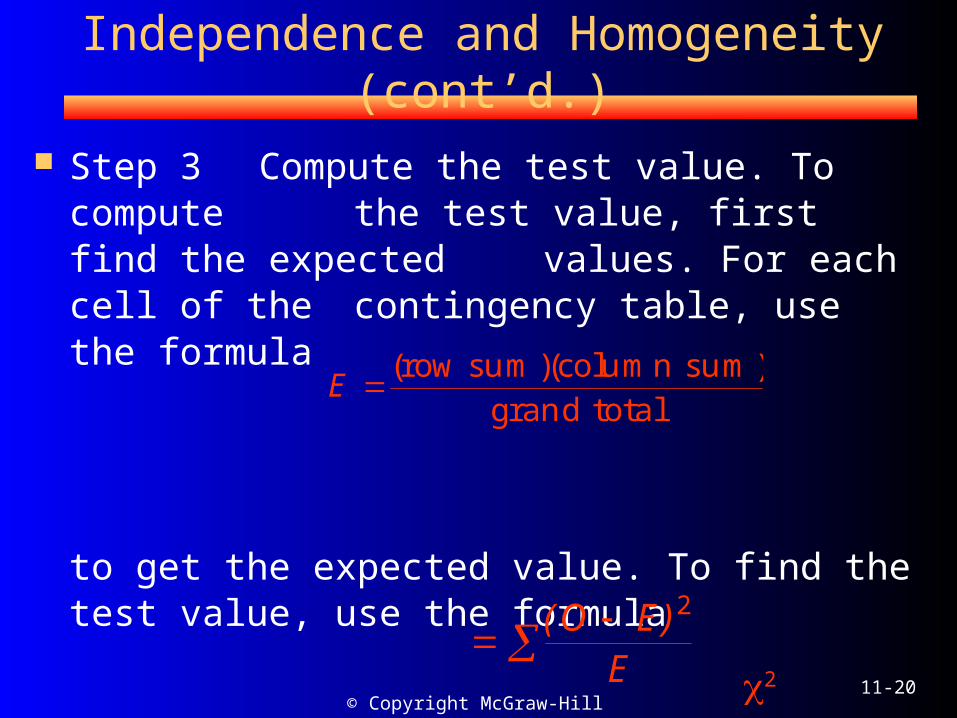
Independence and Homogeneity (cont’d.)
Step 3 Compute the test value. To compute the test value, first find the expected values. For each cell of the contingency table, use the formula
to get the expected value. To find the test value, use the formula
2
E ( )( )row sum column sumgrand total
2( )O EE
© Copyright McGraw-Hill 200011-21
Independence and Homogeneity (cont’d.)
Step 4 Make the decision.
Step 5 Summarize the results.
© Copyright McGraw-Hill 200011-22
Assumptions
The assumptions for the chi-square independence and homogeneity tests:
1. The data are obtained from a random
sample.
2. The expected value in each cell must be
5 or more.
© Copyright McGraw-Hill 200011-23
Summary
There are three main uses of the chi-square distribution:
1. The test of independence is used to
determine whether two variables are
related or are independent.
2. It can be used as goodness-of-fit test, in
order to determine whether the
frequencies of a distribution are the same
as the hypothesized frequencies.
© Copyright McGraw-Hill 200011-24
Summary (cont’d.)
3. The homogeneity of proportions test is
used to determine if several proportions
are all equal when samples are selected
from different populations.
© Copyright McGraw-Hill 200011-25
Conclusions
The chi-square distribution is useful in a variety of hypotheses tests that can be applied to many different everyday situations.