© copyright giacomo luciani the politics and economics of international energy lecture 1...
TRANSCRIPT

© C
opyri
gh
t G
iaco
mo L
uci
an
i
The Politics and Economics of International Energy
Lecture 1Introduction – Long-Term Energy Scenarios – Dimensions of the Energy Issue in International Relations
Prof. Giacomo Luciani
© C
opyri
gh
t G
iaco
mo L
uci
an
i
Contact details
[email protected] Office telephone: +41 22 7162730 Office hours:
By appointmentc/o Gulf Research Center Foundation49, Avenue Blanc, 1202 Genève
© C
opyri
gh
t G
iaco
mo L
uci
an
i
Readings
Too much to read… You should:
Learn to read selectively Make sure that you can retrieve, not
necessarily recall, relevant information Separate the gold from the sand

© C
opyri
gh
t G
iaco
mo L
uci
an
i
Readings availability
CD-Rom containing a large part of the readings and other important documentation.
The contents of the CD-Rom will also be available on the Intranet and a copy of the CD will be deposited in the Library. Readings MUST be completed IN ADVANCE of each class.
However, you are not expected to read everything: you should use your judgment in selecting what is truly important.
Readings that are available only on paper are highlighted in yellow.
Background reading: Daniel Yergin, “The Prize: The Epic Quest for Oil, Money, and Power”
You are expected to read this book in parallel with class proceeding although it is not listed as reading for any class. It is fun to read anyhow.

© C
opyri
gh
t G
iaco
mo L
uci
an
i
Requirements
A mid term and a final Short (max 700 words) professional
memo on one out of three or four topics proposed
You will be able to use all course material and sources
Topics will be drawn from current developments

© C
opyri
gh
t G
iaco
mo L
uci
an
i
Global Energy Trends
© C
opyri
gh
t G
iaco
mo L
uci
an
i
The Global Crisis We have witnessed an earthquake of 9+
magnitude (Richter scale – 1 every 20 years) in the global political economy.
Earthquakes are caused by movement in the tectonic plates: over time, these movements accumulate unresolved stress – the quake releases the stress.
Unresolved stress = unadjusted disequilibria
© C
opyri
gh
t G
iaco
mo L
uci
an
i
Which tectonic plates
The recent earthquake is the result of the clash of several tectonic plates Finance Energy Globalization and division of labor Military power Global governance
The epicenter has been in the US

© C
opyri
gh
t G
iaco
mo L
uci
an
i
Finance stress lines in the US
Excessive indebtedness of families Large and rapidly growing
government deficit Large and growing trade deficit CURRENT TRENDS ARE NOT
SUSTAINABLE
© C
opyri
gh
t G
iaco
mo L
uci
an
i
Energy stress lines
Global warming Alienation of companies from
resources and vice-versa Huge gaps in energy consumption
standards CURRENT TRENDS ARE NOT
SUSTAINABLE

© C
opyri
gh
t G
iaco
mo L
uci
an
i
© C
opyri
gh
t G
iaco
mo L
uci
an
i

© C
opyri
gh
t G
iaco
mo L
uci
an
i

© C
opyri
gh
t G
iaco
mo L
uci
an
i

© C
opyri
gh
t G
iaco
mo L
uci
an
i
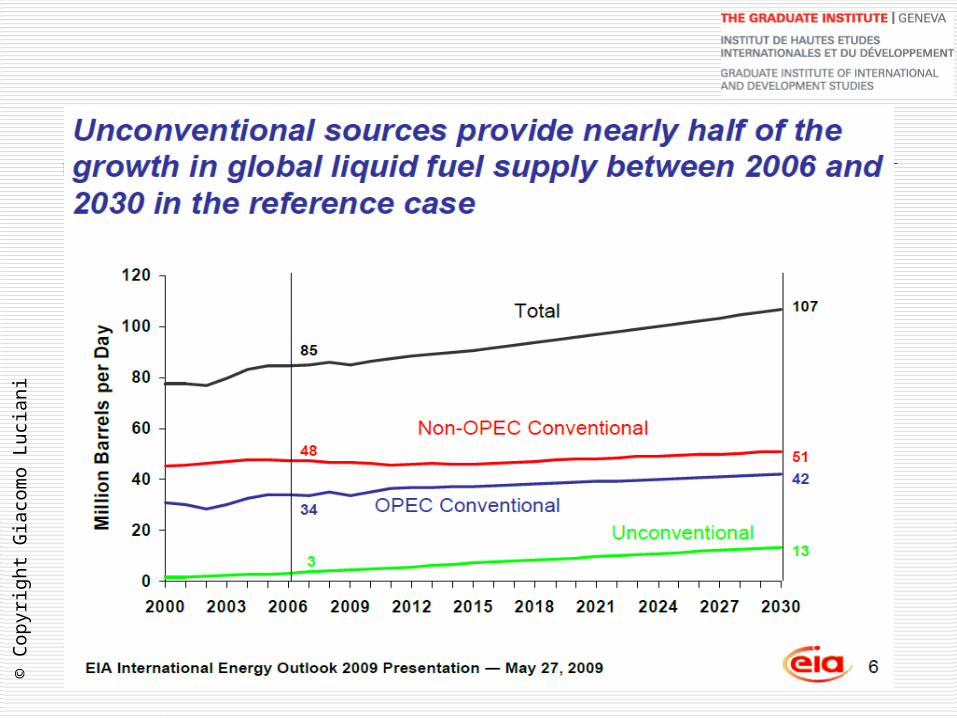
A word about scenarios 1 Global energy scenarios are complex– only
few institutions can afford to produce them The most widely quoted are IEA’s and EIA’s;
also to be considered: OPEC (for oil), EU Commission, ExxonMobil, Shell; other institutions produce occasional scenarios
IEA: World Energy Outlook (WEO) published in November each year
EIA: International Energy Outlook (IEO) published in June each year
© C
opyri
gh
t G
iaco
mo L
uci
an
i
A word about scenarios 2 Scenarios are not meant to be realistic
images of the future They extrapolate trends under certain
assumptions They allow exploring the sustainability or
coherence of policies They generally contain one or more
“messages” They reflect the politics of the institution
producing them

© C
opyri
gh
t G
iaco
mo L
uci
an
i
Determinants of energy demand

© C
opyri
gh
t G
iaco
mo L
uci
an
i
Diminishing energy intensity

© C
opyri
gh
t G
iaco
mo L
uci
an
i
Limited catch-up
© C
opyri
gh
t G
iaco
mo L
uci
an
i
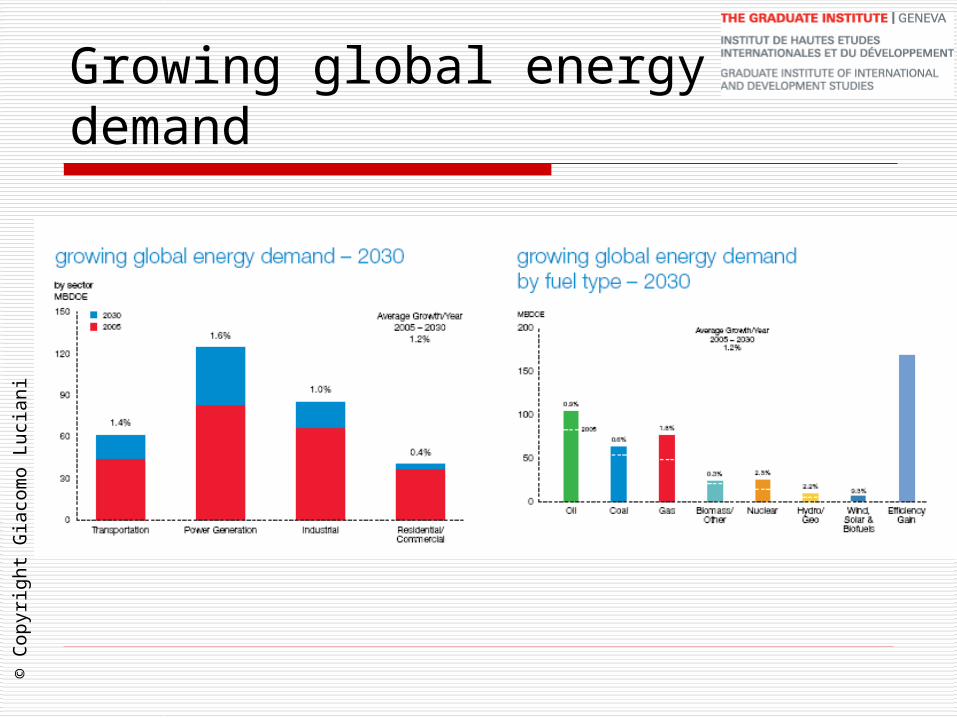
Growing global energy demand
© OECD/IEA - 2008
0
2 000
4 000
6 000
8 000
10 000
12 000
14 000
16 000
18 000
1980 1990 2000 2010 2020 2030
Mto
e
Other renewables
Hydro
Nuclear
Biomass
Gas
Coal
Oil
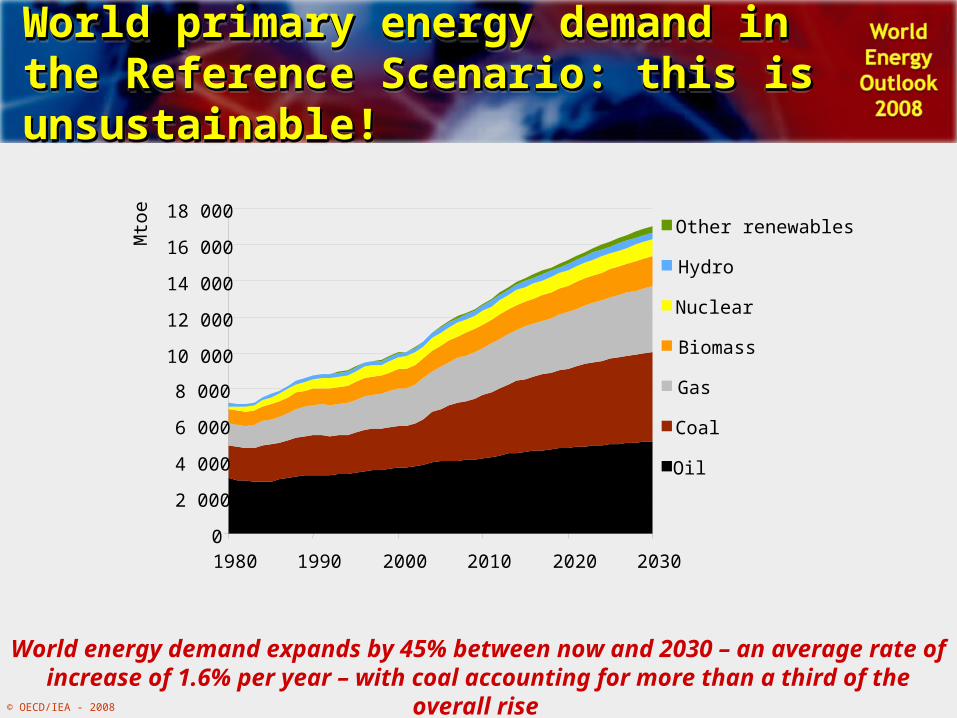
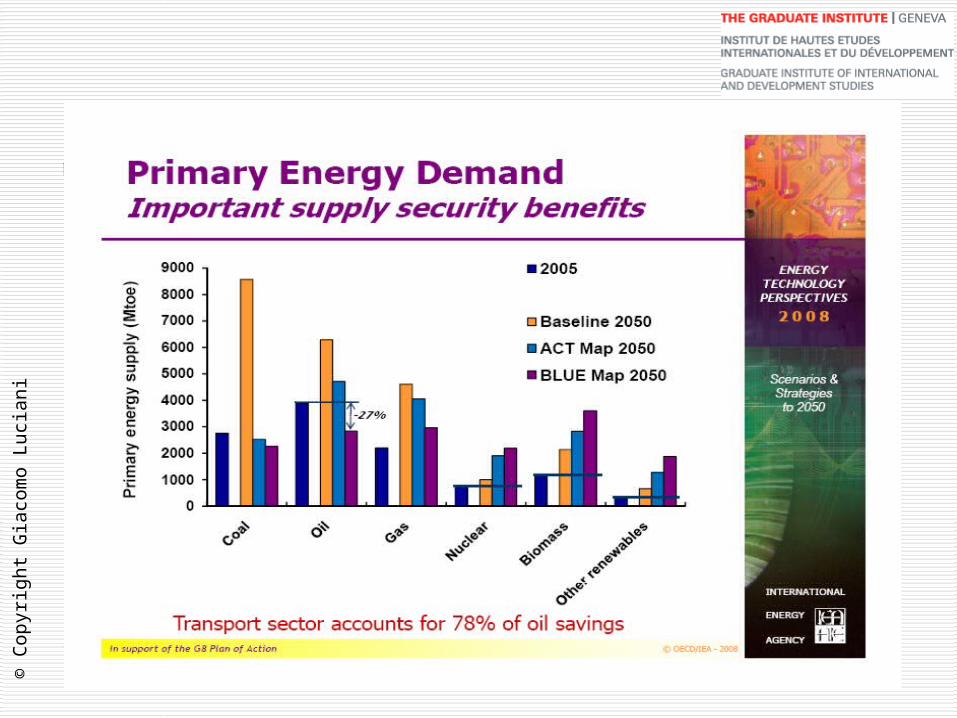
World energy demand expands by 45% between now and 2030 – an average rate of increase of 1.6% per year – with coal accounting for more than a third of the overall rise
World primary energy demand in tWorld primary energy demand in the he Reference Scenario: this is unsustainable!Reference Scenario: this is unsustainable!World primary energy demand in tWorld primary energy demand in the he Reference Scenario: this is unsustainable!Reference Scenario: this is unsustainable!

© OECD/IEA - 2007
Reference Scenario:
The Emerging Giants of World Energy
China & India will contribute more than 40% of the increase in global energy demand to 2030 on
current trends
0%
20%
40%
60%
80%
100%
Total energy
Coal Oil Nuclear Hydro Power sectorinvestments
Rest of the worldIndiaChina
Increase in Primary Energy Demand & Investment Between 2005 & 2030 as Share of World Total

© OECD/IEA - 2008
Energy-related COEnergy-related CO22 emissions emissions in the Reference Scenarioin the Reference ScenarioEnergy-related COEnergy-related CO22 emissions emissions in the Reference Scenarioin the Reference Scenario
97% of the projected increase in emissions between now & 2030 comes from non-OECD countries – three-quarters from China, India & the Middle East alone
0
5
10
15
20
25
30
35
40
45
1980 1990 2000 2010 2020 2030
Gig
aton
nes
Internationalmarine bunkersand aviation
Non-OECD - gas
Non-OECD - oil
Non-OECD - coal
OECD - gas
OECD - oil
OECD - coal

© OECD/IEA - 2007
Energy-Related CO2 Emissions by Region, 1900-2005
Over the last century, China has contributed only 8% of global emissions & India 2%
0
2 000
4 000
6 000
8 000
10 000
1900 1915 1930 1945 1960 1975 1990 2005
milli
on to
nnes
Rest of the
world
33%
India
2%
China
8% Japan
4%
European
Union
23%
United States
30%
Cumulative emissions

© OECD/IEA - 2007
Reference Scenario:
World’s Top Five CO2 Emitters
2005 2015 2030
Gt rank Gt rank Gt rank
US 5.8 1 6.4 2 6.9 2
China 5.1 2 8.6 1 11.4 1
Russia 1.5 3 1.8 4 2.0 4
Japan 1.2 4 1.3 5 1.2 5
India 1.1 5 1.8 3 3.3 3
China overtook the US to become the largest emitter in 2007, while India becomes the third-largest by
2015

© OECD/IEA - 2008
World primary energy demand in tWorld primary energy demand in the he Reference ScenarioReference ScenarioWorld primary energy demand in tWorld primary energy demand in the he Reference ScenarioReference Scenario
0
1 000
2 000
3 000
4 000
5 000
6 000
1980 1990 2000 2010 2020 2030
Mto
e
Oil
Coal
Gas
Biomass
Nuclear
Hydro
Otherrenewables
World energy demand expands by 45% between 2006 and 2030 – an average rate of increase of 1.6% per year – with coal accounting for more than a third of the overall rise

© OECD/IEA - 2008
Cumulative energy-supply investment Cumulative energy-supply investment in the Reference Scenarioin the Reference Scenario, 2007-2030, 2007-2030Cumulative energy-supply investment Cumulative energy-supply investment in the Reference Scenarioin the Reference Scenario, 2007-2030, 2007-2030
Investment of $26 trillion, or over $1 trillion/year, is needed, but the credit squeeze could delay spending, potentially setting up a supply-crunch once the economy recovers
Power generation
50%
Transmission & distribution
50%Mining
91%
Shipping & ports
9%
Exploration and development
80%
Refining16%
Shipping4%
Exploration & development
61%LNG chain
8%
Transmission & distribution
31%
Power 52%
$13.6 trillion
Oil 24%
$6.3 trillion
Gas21%
$5.5 trillion
Coal 3%
$0.7 trillion
Biofuels <1%
$0.2 trillion

© OECD/IEA - 2008
World energy-related COWorld energy-related CO22 emissions emissionsin 2030 by scenarioin 2030 by scenarioWorld energy-related COWorld energy-related CO22 emissions emissionsin 2030 by scenarioin 2030 by scenario
OECD countries alone cannot put the world onto a 450-ppm trajectory, even if they were to reduce their emissions to zero
World
World
0
5
10
15
20
25
30
35
40
Reference Scenario 550 Policy Scenario 450 Policy Scenario
Gig
aton
nes
© OECD/IEA - 2008
Share of renewables in electricity Share of renewables in electricity generation in the Reference Scenario generation in the Reference Scenario Share of renewables in electricity Share of renewables in electricity generation in the Reference Scenario generation in the Reference Scenario
0% 5% 10% 15% 20% 25% 30%
2030
2015
2006
2030
2015
2006
2030
2015
2006
Non
-OEC
DO
ECD
Wor
ld
HydroOther (wind, solar, etc)
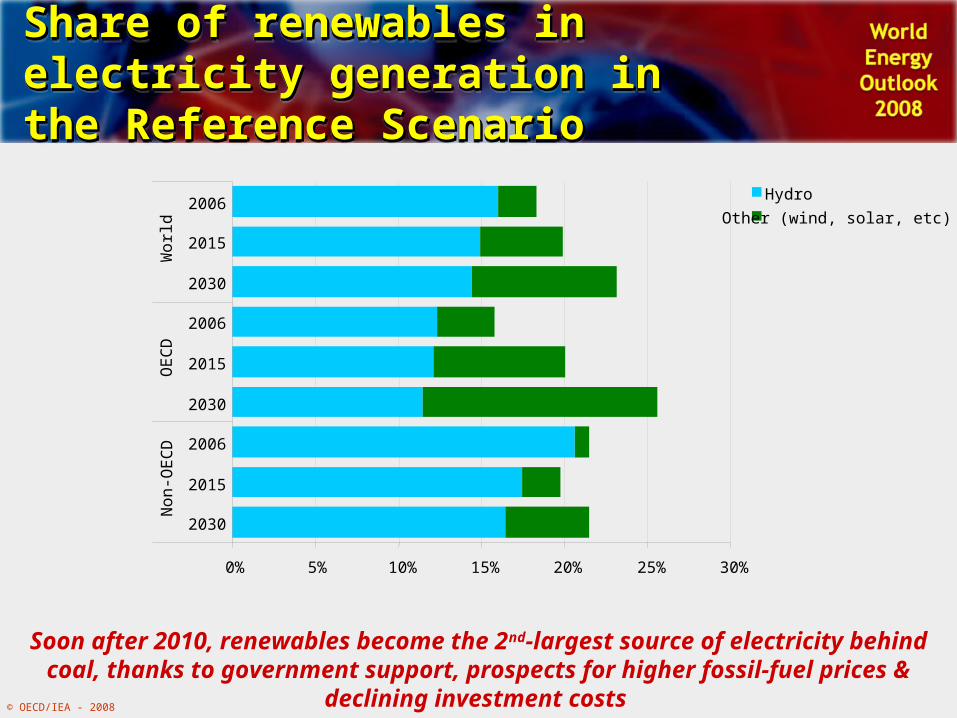
Soon after 2010, renewables become the 2nd-largest source of electricity behind coal, thanks to government support, prospects for higher fossil-fuel prices & declining investment costs

© OECD/IEA - 2008
Total oil production in 2030 by Total oil production in 2030 by scenarioscenarioTotal oil production in 2030 by Total oil production in 2030 by scenarioscenario
Curbing CO2 emissions would improve energy security by cutting demand for fossil fuels, but even in the 450 Policy Scenario, OPEC production increases by 12 mb/d from now to 2030
0
20
40
60
80
100
120
2007 Reference Scenario2030
550 Policy Scenario2030
450 Policy Scenario2030
Non-OPECOPEC
9 mb/d 16 mb/dmb/
d
© OECD/IEA - 2008
Reductions in energy-related COReductions in energy-related CO22 emissions in the climate-policy scenariosemissions in the climate-policy scenariosReductions in energy-related COReductions in energy-related CO22 emissions in the climate-policy scenariosemissions in the climate-policy scenarios
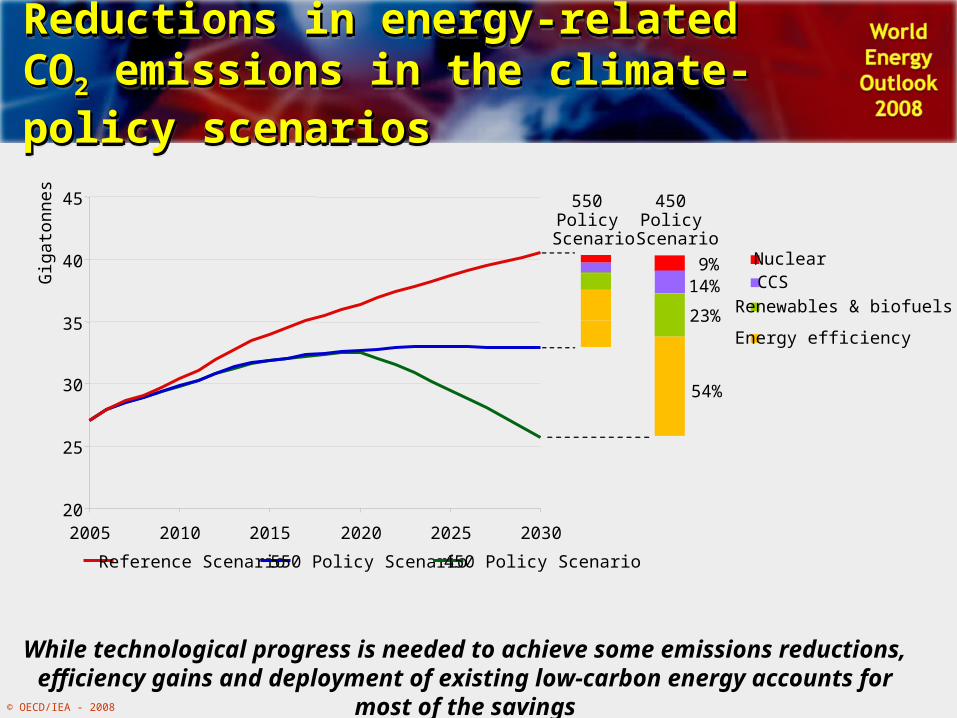
While technological progress is needed to achieve some emissions reductions, efficiency gains and deployment of existing low-carbon energy accounts for most of the savings
20
25
30
35
40
45
2005 2010 2015 2020 2025 2030
Gig
aton
nes
Reference Scenario 550 Policy Scenario 450 Policy Scenario
CCS Renewables & biofuels
Nuclear
Energy efficiency
550 Policy
Scenario
450 Policy
Scenario
54%
23%
14% 9%

© OECD/IEA - 2008
Total power generation capacity today Total power generation capacity today and in 2030 by scenarioand in 2030 by scenarioTotal power generation capacity today Total power generation capacity today and in 2030 by scenarioand in 2030 by scenario
In the 450 Policy Scenario, the power sector undergoes a dramatic change – with CCS, renewables and nuclear each playing a crucial role
0 1 000 2 000 3 000
Other renewables
Wind
Hydro
Nuclear
Coal and gas with CCS
Gas
Coal
GW
1.2 x today
1.5 x today
13.5 x today
2.1 x today
1.8 x today
12.5 x today
15% of today’s coal & gas capacity
Today Reference Scenario 2030 450 Policy Scenario 2030

© OECD/IEA - 2007
Average Annual Power Generation Capacity Additions in the 450 Stabilisation Case, 2013-2030
A large amount of capacity would need to be retired early, entailing substantial costs
22 CCS coal-fired plants (800 MW)
20 CCS gas-fired plants (500 MW)
30 nuclear reactors (1000 MW)
2 Three Gorges Dams
400 CHP plants (40 MW)
17 000 turbines (3 MW)
0 10 20 30 40 50 60
Other Renewables
Wind
Biomass and waste
Hydropower
Nuclear
Gas CCS
Coal CCS
GW

© OECD/IEA - 2008
Key results of the post-2012 Key results of the post-2012 climate-policy analysisclimate-policy analysisKey results of the post-2012 Key results of the post-2012 climate-policy analysisclimate-policy analysis
550 Policy Scenario Corresponds to a c.3C global
temperature rise Energy demand continues to
expand, but fuel mix is markedly different
CO2 price in OECD countries reaches $90/tonne in 2030
Additional investment equal to 0.25% of GDP
450 Policy Scenario Corresponds to a c.2C global
temperature rise Energy demand grows, but half as
fast as in Reference Scenario Rapid deployment of low-carbon
technologies – particularly CCS Big fall in non-OECD emissions CO2 price in 2030 reaches
$180/tonne OPEC production still 12mb/d higher
in 2030 than today Additional investment equal to 0.6%
of GDP
© OECD/IEA - 2008
Summary & conclusionsSummary & conclusionsSummary & conclusionsSummary & conclusions
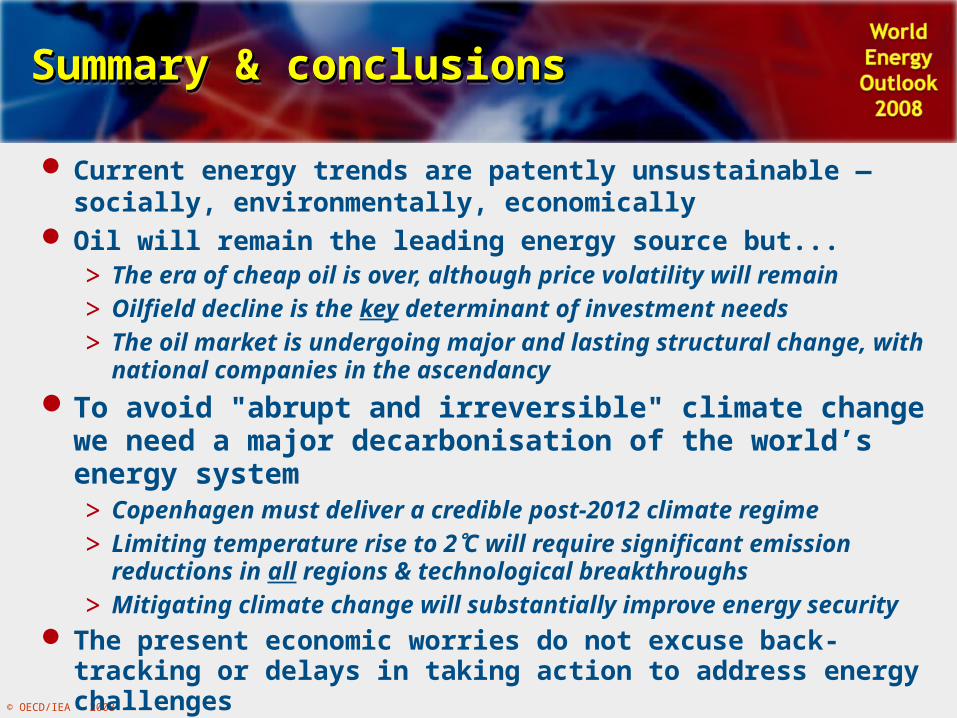
Current energy trends are patently unsustainable — socially, environmentally, economically
Oil will remain the leading energy source but...> The era of cheap oil is over, although price volatility will remain> Oilfield decline is the key determinant of investment needs> The oil market is undergoing major and lasting structural change, with
national companies in the ascendancy To avoid "abrupt and irreversible" climate change we need a
major decarbonisation of the world’s energy system> Copenhagen must deliver a credible post-2012 climate regime> Limiting temperature rise to 2C will require significant emission
reductions in all regions & technological breakthroughs> Mitigating climate change will substantially improve energy security
The present economic worries do not excuse back-tracking or delays in taking action to address energy challenges

© OECD/IEA - 2008
National policies and measures
The 550 Policy Scenario The 450 Policy Scenario
Cap and trade
Copenhagen: aCopenhagen: a plausible plausible post-2012 global post-2012 global climate-change policy regime climate-change policy regime Copenhagen: aCopenhagen: a plausible plausible post-2012 global post-2012 global climate-change policy regime climate-change policy regime
A combination of policy mechanisms – reflecting nations’ varied circumstances & current negotiating positions – is a realistic outcome at the Copenhagen COP at end-2009
Cap and tradePower
generation
Buildings
Transport
Industry
International sectoral approaches
National policies and measures
International sectoral approaches
OECD+Other Major Economies
Other Countries
National policies and measures

© OECD/IEA - 2008
Change in world energy investment in the 550 Policy Change in world energy investment in the 550 Policy relative to the Reference Scenario, 2010-2030relative to the Reference Scenario, 2010-2030Change in world energy investment in the 550 Policy Change in world energy investment in the 550 Policy relative to the Reference Scenario, 2010-2030relative to the Reference Scenario, 2010-2030
Most of the incremental investment in the 550 Policy Scenario is in existing technologies
-3 000
-2 000
-1 000
0
1 000
2 000
Power plants Powertransmission
anddistribution
Fossil fuelsupply
Biofuels Efficiency -buildings
Efficiency -transport
Efficiency -industry
Billi
on d
olla
rs (2
007)

© OECD/IEA - 2008
Additional investments in the climate-policy Additional investments in the climate-policy scenarios versus the Reference Scenarioscenarios versus the Reference ScenarioAdditional investments in the climate-policy Additional investments in the climate-policy scenarios versus the Reference Scenarioscenarios versus the Reference Scenario
Power-sector investment in the last decade of the Outlook period in the 450 Policy Scenario is almost double that in the Reference Scenario
0
1 000
2 000
3 000
4 000
5 000
2010-2020 2021-2030 2010-2020 2021-2030
Power plants Energy efficiency
Billi
on d
olla
rs (2
007)
450 Policy Scenario(additional to 550)
550 Policy Scenario

© C
opyri
gh
t G
iaco
mo L
uci
an
i
WEO 2009 Preliminary results
Given the present crisis, the IEA now forecasts that the global oil demand will only grow by 0.6% per year during the 2008-2014 period to reach 89m b/d in 2014.

© C
opyri
gh
t G
iaco
mo L
uci
an
i

© C
opyri
gh
t G
iaco
mo L
uci
an
i

© C
opyri
gh
t G
iaco
mo L
uci
an
i

© C
opyri
gh
t G
iaco
mo L
uci
an
i
© C
opyri
gh
t G
iaco
mo L
uci
an
i
© C
opyri
gh
t G
iaco
mo L
uci
an
i

© C
opyri
gh
t G
iaco
mo L
uci
an
i
© C
opyri
gh
t G
iaco
mo L
uci
an
i
© C
opyri
gh
t G
iaco
mo L
uci
an
i

© C
opyri
gh
t G
iaco
mo L
uci
an
i

© C
opyri
gh
t G
iaco
mo L
uci
an
i

© C
opyri
gh
t G
iaco
mo L
uci
an
i
Other Scenarios

© C
opyri
gh
t G
iaco
mo L
uci
an
i

© C
opyri
gh
t G
iaco
mo L
uci
an
i

© C
opyri
gh
t G
iaco
mo L
uci
an
i

© C
opyri
gh
t G
iaco
mo L
uci
an
i

© C
opyri
gh
t G
iaco
mo L
uci
an
i

© C
opyri
gh
t G
iaco
mo L
uci
an
i
© C
opyri
gh
t G
iaco
mo L
uci
an
i

© C
opyri
gh
t G
iaco
mo L
uci
an
i
© C
opyri
gh
t G
iaco
mo L
uci
an
i

© C
opyri
gh
t G
iaco
mo L
uci
an
i
© C
opyri
gh
t G
iaco
mo L
uci
an
i
© C
opyri
gh
t G
iaco
mo L
uci
an
i
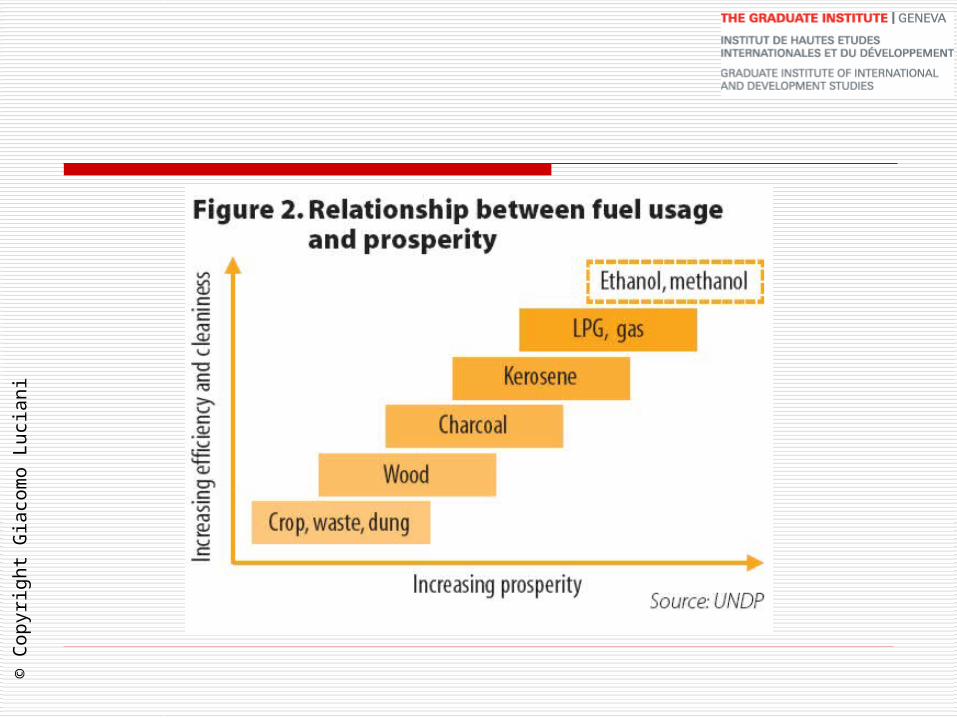
Energy and Poverty

© OECD/IEA - 2007
Population without electricity, 2006
In 2030, if no major new policies are implemented, there will still be 1.4 billion people without electricity.

© OECD/IEA - 2007
Energy Poverty: Annual Deaths from Indoor Air Pollution
The number of people using dirty traditional biomass for cooking is set to grow from 2.5 billion now to 2.7
billion in 2030 absent new policies
2.8
1.6
1.2 1.3
0
1
2
3
Malaria Smoke frombiomass
Tuberculosis HIV/AIDS
milli
ons
Source: World Health Organization
© C
opyri
gh
t G
iaco
mo L
uci
an
i

© C
opyri
gh
t G
iaco
mo L
uci
an
i