© copyright 2005 thomas j. minichillo
TRANSCRIPT

© Copyright 2005 Thomas J. Minichillo
Middle Stone Age Lithic Study, South Africa: An Examination of Modern Human Origins
Thomas J. Minichillo
A dissertation submitted in partial fulfillment of the
requirements for the degree of
Doctor of Philosophy
University of Washington
2005
Program Authorized to Offer Degree: Department of Anthropology

University of Washington Graduate School
This is to certify that I have examined this copy of a doctoral dissertation by
Thomas J. Minichillo
and have found that it is complete and satisfactory in all respects, and that any and all revisions required by the final
examining committee have been made.
Chair of the Supervisory Committee: __________________________________________________________________ Angela E. Close Reading Committee: __________________________________________________________________ Angela E. Close __________________________________________________________________ James K. Feathers __________________________________________________________________ Donald K. Grayson __________________________________________________________________ C. Garth Sampson Date: ___________________________

In presenting this dissertation in partial fulfillment of the requirements for the Doctoral degree at the University of Washington, I agree that the Library shall make its copies freely available for inspection. I further agree that extensive copying of the dissertation is allowable only for scholarly purposes, consistent with “fair use” as prescribed in the U. S. Copyright Law. Requests for copying or reproduction of this dissertation may be referred to Proquest Information and Learning, 300 North Zeeb Road, PO Box 1346, Ann Arbor, MI 48106-1346, to whom the author has granted “the right to reproduce and sell (a) copies of the manuscript in microform and/or (b) printed copies of the manuscript made from microform.”
Signature_________________________________
Date_____________________________________

University of Washington
Abstract
Middle Stone Age Lithic Study, South Africa: An Examination of Modern Human Origins
Thomas J. Minichillo
Chair of the Supervisory Committee:
Professor Angela E. Close Department of Anthropology
The Middle Stone Age began around 300,000 years ago and continued to around
35,000 years ago in Africa. During this period anatomically modern humans
emerged in Africa. Also during this period increasingly sophisticated
technological innovations and the earliest evidence for symbolic thought entered
into the archaeological record. All of these events are critical for our
understanding of modern human origins. This dissertation focuses on the Middle
Stone Age from the Cape coast of southern Africa and presents new data from the
region, helping to place this important period of our evolution in context.

Table of Contents List of Figures ........................................................................................................ iv List of Tables ....................................................................................................... viii Chapter 1: Modern Human Origins .........................................................................1
Modern Human Origins ...................................................................................... 2 Archaeology, Morphology, and Genetics ....................................................... 4 Location and Timing..................................................................................... 16 Behavioral Modernity ................................................................................... 22
Chapter 2: The Middle Stone Age .........................................................................28 MSA on the Cape Coast.................................................................................... 30
Coastal Caves................................................................................................ 30 Dune Field Sites............................................................................................ 31 Inland Rockshelters....................................................................................... 32 Buried Open Sites ......................................................................................... 33
Explanatory Frameworks for Interpreting the MSA......................................... 34 The Klasies Model ........................................................................................ 35 The Blombos Model ..................................................................................... 40
The Rapid Depositional Model for MSA Change ............................................ 45 Chapter 3: Faunal Resource Use and Behavioral Modernity.................................48
The Klein Argument ......................................................................................... 49 The Faunal Pattern ............................................................................................ 51 Buffalo and Eland Mortality ............................................................................. 51 Hunting Effectiveness....................................................................................... 52 General Critique................................................................................................ 54
Sample Size Critique..................................................................................... 55 Behavioral Ecological Modeling ...................................................................... 58
Diet Expansion Hypothesis........................................................................... 61 Resource Depletion Model ........................................................................... 63 Environmental Change.................................................................................. 65
Discussion and Conclusions ............................................................................. 66 Chapter 4: Lithic Foraging Strategies ....................................................................79
Behavioral Ecology and Lithic Resource Use .................................................. 79 The Howiesons Poort Sub-stage ....................................................................... 80 Exotic not Non-Local........................................................................................ 82 Resource and Technological Intensification..................................................... 86 Time versus Distance........................................................................................ 87 Summary and Conclusions ............................................................................... 91
Chapter 5: The Still Bay ........................................................................................99 The Context of the Still Bay ............................................................................. 99
A Rock by Any Other Name....................................................................... 101
i

Place and Time............................................................................................ 104 Still Bay Study Goals...................................................................................... 107 Site and Collection Descriptions..................................................................... 107
Blombos Cave............................................................................................. 107 Blombos Sands............................................................................................ 111 Blombos Schoolhouse................................................................................. 112 Cape Hangklip ............................................................................................ 112 Dale Rose Parlour ....................................................................................... 117 Hollow Rock Shelter................................................................................... 119 Kleinjongensfontein.................................................................................... 120 Skildergat (Peers Cave)............................................................................... 121
Composite Images........................................................................................... 124 Standard Measures of Still Bay Bifacial Points.............................................. 125
Evidence for Hafting................................................................................... 126 Evidence of Impact Fractures ..................................................................... 127
Bifacial Thinning Flakes................................................................................. 128 Discussion and Conclusion ............................................................................. 130
Chapter 6: Additional Investigations of the Howieson’s Poort Shelter Collections ...............................................................................................175
Purpose and Background of the Study............................................................ 175 An Alternative Interpretation.......................................................................... 178 A Singular Find............................................................................................... 180 Possible Wider Implications ........................................................................... 186 Summary and Conclusions ............................................................................. 187
Chapter 7: Lithic Artifacts from Pinnacle Point 13B...........................................194 MAP................................................................................................................ 194 Research Goals................................................................................................ 195 Statistical Summaries...................................................................................... 198 Edge Damage Study........................................................................................ 208
Methodology............................................................................................... 209 Generating Rose Diagrams ......................................................................... 211 Calculating Polar Statistics ......................................................................... 211 Discussion of Edge Damage ....................................................................... 211
Other Observations ......................................................................................... 213 Raw Material Surveys..................................................................................... 214
Cobble Beach Survey.................................................................................. 214 Random Cobble Survey .............................................................................. 214 Non-Random Survey .................................................................................. 215 Little Brak River Survey............................................................................. 216 Hartenbos River Survey.............................................................................. 216
Discussion and Conclusions ........................................................................... 217
ii

Chapter 8: Summary, Discussion, and Conclusions ............................................237 Bibliography ........................................................................................................249 Appendix A: Glossary of Terms and Site Names................................................272 Appendix B: Methodology of Lithic Analyses....................................................276
Methodology for Recording Bifacial points ................................................... 277 Methodology for Recording Lithics................................................................ 280
Pocket Material: 2 CDs of Pinnacle Point 13B database and artifact images
iii
List of Figures
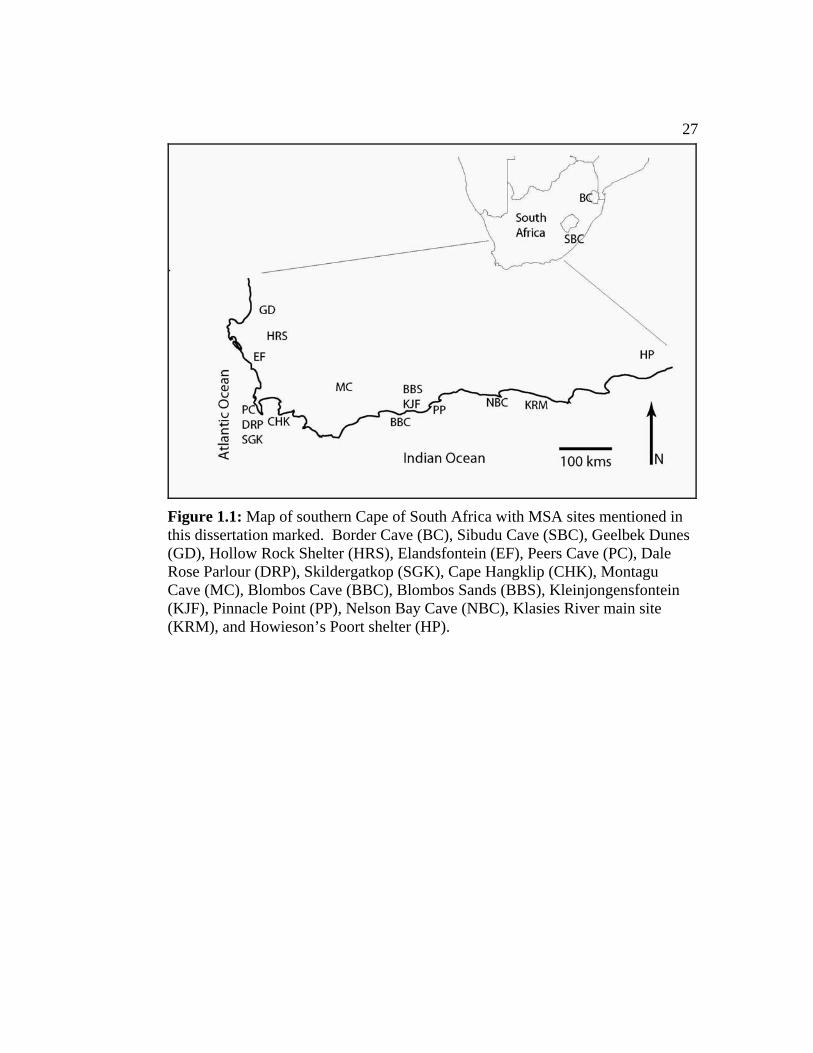
Figure 1.1: Map of southern Cape of South Africa with MSA sites
mentioned in this dissertation marked. ..........................................................27 Figure 3.1: Relative abundances and mortality profiles of cape
buffalo, bushpig, and eland from Cape MSA and LSA sites.........................71 Figure 3.2: Regression slope of number of taxa versus sample size
for all MSA layers and for the single LSA layer at Die Kelders. ..........................................................................................................72
Figure 3.3: Regression slopes of number of taxa versus sample size for MSA layers at Klasies and LSA layers at Nelson Bay Cave. ..............................................................................................................73
Figure 3.4: Regression slopes for number of taxa versus sample size as in Figure 2.4. The LSA layers have been subdivided into Pleistocene-aged and Holocene-aged LSA.............................................74
Figure 3.5: Ranking of Cape terrestrial prey species based on body size. ................................................................................................................75
Figure 3.6: Re-ranking of Cape terrestrial prey species with dangerous species moved to the bottom of the ranking (italics). ..........................................................................................................76
Figure 3.7: Change in relative abundance in bovid size classes through time at Die Kelders (data from Klein and Cruz-Uribe 1996). .............................................................................................................77
Figure 3.8: Change in size for limpets (Patella patella) through time at Paternoster Cave and Elands Bay (after Grine et al. 1991). .............................................................................................................78
Figure 4.1: Cobble beach typical of those along the Cape coast, Pinnacle Point, South Africa, P. Karkanas for scale......................................94
Figure 4.2: Silcrete artifacts from the Howiesons Poort levels at Klasies, all exhibiting water-worn pebble cortex. White bar is 1 cm................................................................................................................95
Figure 4.2: Silcrete artifacts from the Howiesons Poort levels at Klasies, all exhibiting water-worn pebble cortex. White bar is 1 cm................................................................................................................95
Figure 4.3: Conglomerate of the Klein Brak Formation eroding back into alluvial gravel, Klein Brak River, South Africa. Walking stick is approximately one meter.....................................................96
iv

Figure 4.4: Map of the southern Cape showing sites discussed in this chapter, Montagu Cave (MC), Blombos Cave (BBC), Pinnacle Point (PP), Nelson Bay Cave (NBC), Klasies River main site (KRM), and Howieson’s Poort shelter (HP); locations of primary silcrete (red); the coastal distribution of the Klein Brak Formation conglomerate-containing Bredasdorp Group (yellow); and major streams that dissect them (blue); adapted from Malan (1991) and Roberts (2003).......................97
Figure 4.5: Table Mountain Sandstone, the parent material of the Klasies River caves, with quartz cobbles as inclusions. White bar is 10 cm....................................................................................................98
Figure 5.1: Map of southern Cape with Still Bay sites discussed in this chapter and the distribution of Still Bay bifacial points marked. Hollow Rock Shelter (HRS), Peers Cave (PC), Dale Rose Parlour (DRP), Skildergatkop (SGK), Cape Hangklip (CHK), Blombos Cave (BBC), Blombos Sands (BBS), and Kleinjongensfontein (KJF)...........................................................................151
Figure 5.2: Illustration from Dale (1870) showing Still Bay bifacial points (1, 2) as part of the Cape Flats Culture. Bar is 1 cm..............................................................................................................152
Figure 5.3: The large Still Bay bifacial point collected by Heese at the Blombos Schoolhouse site known as the Blombos Bo. Bar is 1 cm. ..................................................................................................153
Figure 5.4: Bone point from the Heese collection of the Still Bay dune site of Blombos Sands. Bar is 1 cm....................................................154
Figure 5.5: Profile from Malan’s letter to Heese of the Still Bay site at Cape Hangklip. Heese papers at Iziko: South African Museum........................................................................................................155
Figure 5.6: Aerial photographs of Cape Hangklip (World War II era) from the papers of Gatehouse on file at Iziko: South African Museum, Cape Town. Note the open and active sand dunes over much of the area at that time. ....................................................156
Figure 5.7: Small surface exposure of ESA site at Cape Hangklip, R. Yates for scale. Note heavy brush in background. .................................157
Figure 5.8: Still Bay artifacts from Malan’s collection at Cape Hangklip. Artifact labeled “7” is only one missing. From the Heese papers at Iziko: South African Museum............................................158
Figure 5.9: Frans Malan’s plate of a worked ochre pencil from the Still Bay site at Cape Hangklip. Location of this artifact is currently unknown. From the Heese papers at Iziko: South African Museum. .........................................................................................159
v

Figure 5.10: Boxplots for the lengths or estimated lengths of all complete or nearly complete Still Bay points by site and raw material. BBS=Blombos Sands, CHK=Cape Hangklip, DRP=Dale Rose Parlour, HRS=Hollow Rock Shelter, KJF=Kleinjongensfontein, PC=Peers Cave, S=Silcrete, Qt=Quartzite, and Qz=Quartz......................................................................160
Figure 5.11: Unmodified quartz crystals from a single 1-meter square and 5-centimeter spit at Hollow Rock Shelter. Bar is 1 cm.................................................................................................................161
Figure 5.12: Base of chalcedony Still Bay point from Kleinjongensfontein.....................................................................................162
Figure 5.13: Composite images of quartzite Still Bay bifacial points from Dale Rose Parlour, 48 fragments, bar is 1 cm. .........................163
Figure 5.14: Composite images of silcrete Still Bay bifacial points from Dale Rose Parlour, 37 fragments, bar is 1 cm.....................................164
Figure 5.15: Composite images of quartzite Still Bay bifacial points from Hollow Rock Shelter ................................................................165
Figure 5.16: Composite images of silcrete Still Bay bifacial points from Hollow Rock Shelter ...........................................................................166
Figure 5.17: Composite images of quartz Still Bay bifacial points from Hollow Rock Shelter ...........................................................................167
Figure 5.18: Composite images of silcrete Still Bay bifacial points from Peers Cave...........................................................................................168
Figure 5.19: Composite images of silcrete Still Bay bifacial points from Kleinjongensfontein and Blombos Sands ...........................................169
Figure 5.20: Composite images of silcrete Still Bay bifacial points from Cape Hangklip.....................................................................................170
Figure 5.20: Composite images of silcrete Still Bay bifacial points from Cape Hangklip.....................................................................................170
Figure 5.21: Still Bay bifacial point from Cape Hangklip with evidence of hafting.......................................................................................171
Figure 5.22: Still Bay bifacial point from Hollow Rock Shelter with robust haft and clear evidence of resharpening in while hafted............................................................................................................172
Figure 5.23: Silcrete Still Bay bifacial point from Kleinjongensfontein with impact fracture on the tip ...................................173
Figure 5.24: Scatterplot with regression lines and confidence intervals for bifacial thinning flakes among all silcrete flakes for Still Bay and Howiesons Poort assemblages..........................................174
Figure 6.1: Dorsal, lateral, and ventral views of blade with adhesive residue, bar is 1 cm. ......................................................................189
vi
Figure 6.2: Residue under cross-polarized light microscopy showing starch grain structures at 500X magnification. Image courtesy of B. Williamson. ..........................................................................190
Figure 6.3: Utilized edge at 100X magnification under eSEM. Note hinged fractures with a rounded edge along dorsal face. ....................191
Figure 6.4: Blade in dental impression material. ................................................192 Figure 6.5: “Hafted Adze”, largish LSA scraper attached to a
wooden handle by a very large glob of “mastic”. From cave at mouth of Touws River, Western Cape, collected by R. E. Dumbleton, Accession number SAM-AA-5535..........................................193
Figure 7.1: Map of the Mossel Bay vicinity showing the location of Pinnacle Point. .........................................................................................225
Figure 7.2: Pinnacle Point Cave 13B at top of stairway.....................................226 Figure 7.3: Topographic map of the interior of Cave 13B. Block
on left is Western Area, block on right is Eastern Area, LC-MSA is Lightly Consolidated deposit. From Marean et al. 2004..............................................................................................................227
Figure 7.3: Topographic map of the interior of Cave 13B. Block on left is Western Area, block on right is Eastern Area, LC-MSA is Lightly Consolidated deposit. From Marean et al. 2004..............................................................................................................227
Figure 7.4: Boxplots of the size (length) of core rejuvenation flakes by large stratigraphic units ................................................................228
Figure 7.6: Volman (1981) core types for all complete cores by stratigraphic aggregates. ..............................................................................230
Figure 7.7: General types of products by stratigraphic aggregate ......................231Figure 7.8: Raw material types by stratigraphic aggregates...............................232 Figure 7.9: (1) Digital imaging of artifact on grid with centroid
marked; (2) Vector map of the same artifact in GIS, Type 1 edge damage is marked in black, Type 2 edge damage is marked in gray; (3) Composite of vector maps for all artifacts of same size and shape classes.....................................................................233
Figure 7.10: Angle measurements for individual polygons................................234 Figure 7.11: Rose diagrams of edge damage on convergent flakes....................235Figure 7.12: Apparent mammalian hair adhering to edge of lithic
artifact, bar is 1 cm.......................................................................................236 Figure B.1: Stylized bifacial point showing locations of major
measures of length and width. .....................................................................296 Figure B.2: Template of basal/hafting element types used to
classify all of the Still Bay bifacial points. ..................................................297
vii
List of Tables Table 1.1: Sub-stages of the MSA for the Cape Coast, adapted
from Wurz (2002) with my own additions marked*. ....................................26 Table 3.1: South African MSA sites, and the presence or absence
of relevant fauna. ...........................................................................................70 Table 5.1: Chronometric dating estimates and stratigraphic
placement of Still Bay assemblages.............................................................134 Table 5.2: Mean lengths or estimated lengths for all complete or
nearly complete Still Bay points, with standard deviations. BBS=Blombos Sands, CHK=Cape Hangklip, DRP=Dale Rose Parlour, HRS=Hollow Rock Shelter, KJF=Kleinjongensfontein, PC=Peers Cave, S=Silcrete, Qt=Quartzite, and Qz=Quartz......................................................................135
Table 5.3: Data table for Still Bay bifacial points, uniface, and a single bone point from Blombos Sands. ......................................................136
Table 5.4: Dale Rose Parlour bifacial points. .....................................................137 Table 5.5: Cape Hangklip bifacial points............................................................142 Table 5.6: Cape Hangklip unifacial points..........................................................144 Table 5.7: Bifacial and unifacial points from Hollow Rock Shelter...................145Table 5.8: Bifacial and unifacial points from Kleinjongensfontein....................148Table 5.9: Peers Cave bifacial and unifacial points. ...........................................149 Table 5.10: Miscellaneous Still Bay bifacial points. ..........................................150 Table 6.1: Metrics of blade with adhesive. Howieson’s Poort Site
1965 Deacon and Deacon excavation, 65/14, “Untrimmed Flakes” bag, Square B4, 1’3”-9”-1’ Depth, “Root Layer”, Layer 3, 1/9/65, Albany Museum, Grahamstown........................................188
Table 7.1: Geneste’s (1985) Middle Paleolithic typology, translated into English..................................................................................220
Table 7.2: Bifacial thinning flake frequency by stratigraphic aggregate. .....................................................................................................222
Table 7.3: Statistical tests of distribution of edge damage on quartzite convergent-flake blades. ...............................................................223
Table 7.4: Distances of identified raw material sources from PP 13B...............................................................................................................224
viii

Acknowledgements
Many people and organizations provided invaluable assistance to me in completing the research presented here and I want to thank them all. Wenner-Gren Foundation for Anthropological Research, Grant GR 6894 and supplemental grant. University of Washington Student Technology Fee Grant 2004-49 to myself and Ms. Phoebe Anderson. Department of Anthropology, University of Washington Pre-Dissertation Travel Grant. Mossel Bay Archaeology Project, Dr. Curtis W. Marean and Dr. Peter J. Nilssen, directors, National Science Foundation Grant BCS-0130713 to Marean Dr. Graham Avery and Mr. Royden Yates of Iziko: South African Museum Dr. Lita Webley and Dr. Johan Binneman of the Albany Museum. Dr. John Parkington and Dr. Judith Sealy of the University of Cape Town Dr. Marie Soressi of the Blombos Cave Project. Dr. Antonietta (Chopi) Jerardino of Heritage Western Cape The South African Heritage Resources Agency Dr. J. Jeffery Flenniken, lithic technologist extraordinaire Dr. Eric A. Smith and Dr. Kristen J. Gremillion, for many discussions on foraging theory. Dr. Hilary Deacon, Stellenbosch University, who was very giving of his time on my first visit to South Africa. There is a lesson here on treating students who know nothing, but have an interest in your research with respect that I hope to never forget.
ix

Dr. Sarah Wurz of Stellenbosch University, for being very free with her advice and comments. Dr. William S. Dancey, for taking me out of a muddy cornfield and back into the ivory tower. Blade residue project: Dr. Hector Neff, Dr. Zed Miller, Mr. John Dudgeon, and Dr. Carl Lipo, CSULB, Dr. Curt Beck, Vassar College, Dr. Richard Fullagar, University of Sydney, and Dr. Bonny Williamson, University of Witwatersrand. Many thanks are due to the IIRMES lab folks at CSLUB, IIRMES is funded through NSF equipment grants (Perkin Elmer 6100 DRC ICP-MS, NSF Grant # OCE-9977564 NewWave 213 Laser Ablation System, Grant from College Extension Services, CSULB and FEI Quanta ESEM, NSF Grant# 0216494). Dr. James Swanson, DDS provided the dental impression materials and gun. Ms. Cate (Scully) Bird, Arizona State University, worked many hard hours entering retouch and edge damage data into the GIS and making sense of polar statistics. It is not possible to live with a group of archaeologists for months and not have gained some insight into my own research, even if I can not remember who said what. A number of participants in the MAP who have all contributed directly or indirectly to my research; Dr. Brooks Ellwood, Dr. Paul Goldberg, Dr. Andrew Herries, Dr. Zenobia Jacobs, Dr. Panagetitis (Takis) Karkanas, Dr. Ana Pinto, Dr. Ian Watts, Ms. Yoshiko Abe, Ms. Jocelyn Bernachez, Mr. Kyle Brown, Ms. Diana Durand, Mr. Erich Fisher, Mr. Nic Fourie, Ms. Carol Frey, Ms. Emily Goebels, Ms. Erin Lassiter, Ms. Lydia Pyne, Mr. Julian Riel-Salvatore, Ms. Sara (Spazzy) Robinson, Mr. Deano Stynder, and Ms. Jessica (Aye-aye) Thompson, . My dissertation reading committee: Dr. James Feathers, Dr. Donald K. Grayson, and Dr. C. Garth Sampson (for actually reading this when it was pretty unreadable and for advice along the way that is too numerous to recount). My committee chair, Dr. Angela E. Close, for taking me to Africa (and bringing me back again) and limiting my mangling of the Queen’s English to a minor bending.
x

xi
And, of course, no one can work on something like this for so long without the support of their family, Mom and Dad, my two boys Dominic and Leo (who really didn’t mind living in Cape Town) and finally my loving wife Amy, who moved around the world and across the states and is ready to do it again, for things she really isn’t that interested in.
1Chapter 1: Modern Human Origins
As the great English historian G. M. Trevelyan has said, ‘Man’s
evolution is far more extraordinary than the first chapter of
Genesis used to lead people to suppose. It is a mystery unsolved,
yet it is a solid fact. It is divine, diabolic, in short, human.’ And, I
may add, it is mostly African. - J. Desmond Clark [1981]
Why does this matter? Why do we need to know how long we have been us and
where we come from? It might be better to ask why we do not know more than
we do about the origin of our own species. Darwin (1871) felt that the greatest
mystery of evolution generally was that origin. It is somewhat surprising that we
currently know more about the dead-end Middle Pleistocene hominids of Western
Europe than we do about our earliest conspecific. In this chapter I provide an
overview of what we do know about the first Homo sapiens. In this dissertation,
generally, I place early Homo sapiens along the Cape coast of southern Africa
(Figure 1.1) in archaeological context. As part of that contextualization I examine
some long-held assumptions regarding the behavior of those people and test some
of the aspects of one of the widely published explanatory models, the Late Upper
Pleistocene Model (Henshilwood and Marean 2003), of the emergence of modern
behaviors. A variant of the Late Upper Pleistocene Model, the Neural Advance
Model (Klein 1999, 2000) has been especially well-articulated and it is that
variant that I examine most closely. In addition to examining existing models and

2assumptions I provide new and relevant data and propose some alternative
explanatory models and frameworks.
My research began as a tightly conceived plan to examine Still Bay technology as
part of the Middle Stone Age (hereafter MSA). It soon became clear, however,
that the assemblages that I had available for study often lacked the kind of context
required for normal comparative studies. I then focused on applying innovative
methods to largely over-looked assemblages for much of my research. A new and
very well-excavated MSA assemblage became available to me as part of my on-
going participation in the Mossel Bay Archaeology Project and that is reported
here as well. As archaeologists it is impossible for us to predict what will come
out of the ground and, to this point, the period of time of my original research
focus has not yet been recovered. While taken together the set of studies
presented here seem only loosely related, they are all joined by the general theme
of placing our early evolution along the Cape coast in context.
Modern Human Origins
There were, until recently, two major opposing hypotheses for the origin of our
species; the “Out of Africa” hypothesis and the “Multi-regional” hypothesis. The
“Out of Africa” hypothesis, also referred to (more correctly) as the “Out of Africa
2” (Stringer and McKie 1996) hypothesis (accounting for the at least one earlier

3Homo exodus from Africa), the “African Eve” hypothesis, or the “Replacement”
hypothesis, holds that Homo sapiens evolved in Africa and nowhere else and then
migrated to all other parts of the globe with miniscule or no genetic contribution
from other hominid species and rapidly replaced them. There are several models
to explain the timing of this evolution in Africa and they will be described later in
this chapter.
The “Multi-regional” hypothesis holds that Homo sapiens evolved in Africa, but
through gene flow and hybridization modern peoples in regions of the world
outside of Africa retain genetic contributions from indigenous hominids, Homo
erectus in East Asia and Homo neanderthalensis in Europe. This hypothesis has a
strong form and a weak form. The strong form holds that indigenous hominids
made a substantial genetic contribution to regional modern populations;
essentially that Homo sapiens has been the only hominid species extant since at
least 1.8 million years ago and that the modern form evolved in several places at
once, through gene flow. The weak form holds that some genetic contribution of
some kind was made by local “archaic” populations to the earliest local
anatomically modern ones. All proponents of this model have shifted to
increasingly weaker forms as new evidence is accepted, that makes stronger forms
of this hypothesis increasingly unlikely (Pearson 2004). If it is agreed that the
vast majority (if not the entirety) of the genetic origin of Homo sapiens is African
and the debate has become one of statistically remote possibilities, then the debate

4is essentially over. For the remainder of this dissertation I will take the position
that the crucial understanding needed to move the research into our origins further
along is the one of that African past. In so doing I will then address and evaluate
the competing models for that African origin in light of current research.
Archaeology, Morphology, and Genetics
There are three forms of evidence that have been brought to bear on each of these
two major hypotheses; archaeological, morphological, and genetic. The evidence
from Africa, with an emphasis on southernmost Africa, is summarized here. The
archaeology is the most abundant and weakest evidence to support or reject either
hypothesis. This is true for a number of reasons:
1. It is almost always unclear which hominid created the archaeological
record at any one given site. This is not a problem when only one hominid
is on the landscape, but for questions of replacement and culture contact
this is inherently not the case.
2. Many of the “markers” of modern behavior in the material record,
adornment, art, composite tools, etc., are frequently made at least partially
of organic materials. For issues of modern human origins the sites of
interest are by definition quite old and preservation of organic artifacts is
unfortunately rare. As such stone tools dominate the assemblages of the
periods of time of interest to this problem and these are not ideal
repositories of information on human social systems.
53. Stone tool technologies have exhibited many similarities between hominid
species. Some of the same techniques that mark Neandertal tool-making,
such as the Levallois technique, are also utilized by modern humans in
Africa. As such single stone artifacts and even whole assemblages, taken
out of broader context, may provide little information on the cognitive
differences between hominid species.
4. At some level all explanations for modern human origins have at their root
some change in social organization, whether it be in exchange as a risk
reducing strategy (Deacon and Wurz 1997, Deacon and Deacon 1999,
Ambrose and Lorenz 1990), development of complex language and
improved cooperation (Klein 1999), demographic reordering (Caspari and
Lee 2004), or increasing use of symbols for inter- and intra-group
signaling (Watts 2000, Henshilwood et al. 2004, Henshilwood and Marean
2004). Presently, the temporal resolution of the MSA archaeological
record and the frequent lack of organic preservation are poorly suited to
explore models of social organization and change.
The archaeological evidence from the Cape Coast that figures prominently in any
discussion of modern human origins is, nonetheless, impressive. From most
recent to oldest some of the archaeological phenomena that often enter into this
discussion are described here. Technologically the Howiesons Poort sub-stage
(Table 1.1) includes backed pieces made on small blades and true bladelets that

6evidence increasingly shows were hafted as parts of composite tools (see Chapter
6). Both backing of lithics and the creation of composite tools are considered
advanced technological innovations. The Howiesons Poort dates to around
60,000 BP (Feathers 2002, Tribolo 2003) and has been the subject of much
speculation due to its early date and seeming technological precociousness. Watts
(2000) has noted the increase in mineral pigment use and color variability during
the Howiesons Poort and interprets this as increasingly symbolic behavior. A
detailed discussion and further expansion on the explanatory models of the
Howiesons Poort is presented in Chapter 4.
Predating the Howiesons Poort is the Still Bay sub-stage, dating to around 75,000
BP (Henshilwood et al. 2001a, 2002, 2004, Tribolo 2003, Feathers, personal
communication). The Still Bay is noted artifactually for the presence of bifacial
points with strong evidence that these were hafted. These points are frequently
finely made and were compared in the early literature to the Solutrean points of
Europe (Burkitt 1928). Also occurring in Still Bay assemblages are worked
pieces of ochre, most notably from Blombos Cave (Henshilwood and Sealy 1996,
Henshilwood et al. 2002), but also from Hollow Rock Shelter (Evans 1994) and
from Cape Hangklip (Malan n.d.). Also from the Still Bay layers at Blombos
Cave are drilled marine shells that are interpreted by their analysts as personal
adornment, perhaps once strung as a necklace (Henshilwood 2004, Henshilwood
et al. 2004, d’Errico et al. 2005). Hollow Rock Shelter also yielded what was

7apparently a cache of small quartz crystals. A detailed discussion of Still Bay
lithic technology and its archaeological context is presented in Chapter 5.
Deeper yet at Blombos Cave a series of finely worked bone points and awls has
been dated to at least 85,000 BP (d’Errico et al. 2001, Henshilwood et al. 2001b).
Other bone tools from the MSA have been reported from Klasies River (Singer
and Wymer 1982, Wurz 2000) and have been observed in MSA surface sites (see
an example from Blombos Sands in Chapter 5). Fine bone working has long been
espoused as a defining technological characteristic of behaviorally modern
peoples (Mellars 1989). Taken together the MSA of the Cape Coast has yielded
the earliest well-dated unambiguous examples of symbolic marking, personal
adornment, hafted bifacial points, finely worked bone tools, and composite tool
manufacture in the global archaeological record.
In the countervailing view the technology of the MSA is said to be static and
unchanging for long periods of time (Klein 1999). “Their artifact assemblages
varied remarkably little through time and space” (Klein and Edgar 2002:230). In
this view the precocious technologies of the Blombos Cave bone tool industry and
the Still Bay and Howiesons Poort lithic industries are anomalies that are not
representative of the MSA or are simply not addressed. An important aspect of
this view is that the typologies of the MSA are less complicated than those of the
Upper Paleolithic or the Later Stone Age (hereafter LSA). This fails to account

8for the fact that typologies are created by archaeologists for specific reasons and
are not inherent in the technologies themselves. In the case of the MSA the main
goal of the typologies was to differentiate MSA and LSA artifact assemblages;
something that required only simple systematics. Additionally, within the stone
tool technology of the southern African MSA is virtually everything that can and
has been done when knapping stone; something that is not mentioned by the
proponents of this view. I address in the following chapter in more detail why the
MSA record may appear to be static to some and why this appearance is likely
the result of the quality of data that were available until very recently.
The faunal assemblages from Cape MSA sites have also figured prominently in
discussions of modern human origins. Large MSA faunal assemblages from
Klasies River, Nelson Bay Cave, and Die Kelders have been analyzed and
published. Additional large faunal assemblages are currently under analyses for
Blombos Cave and Pinnacle Point 13B and have yet to be published. The
patterning of faunal exploitation from these MSA sites has been used by Klein
(1976, 1979, 1992, 1994, 1995, 1999) to argue forcefully that MSA peoples were
inefficient hunters in comparison to subsequent LSA peoples in the same region,
and thus were somehow less than fully modern in their behaviors. This argument
has two parts. First, that the number of species being exploited is smaller and,
second, that certain species, such as adult cape buffalo (Syncerus caffer) and
bushpig (Potamochoerus porcus) are being avoided. A careful analysis of the

9faunal data used to reach this conclusion is presented in Chapter 3. It is found in
that analysis that the faunal patterns are poor markers of behavioral modernity,
good markers of climatic change, and better explained through the application of
foraging theory models than through human cognitive changes.
The second line of evidence used to test the two hypotheses for modern human
origins is skeletal morphology. Supporters of the “Out of Africa” hypothesis note
continuities in the skeletal morphology of African populations that occur nowhere
else, that the earliest modern peoples in Europe were “more African” in their
morphology than later modern peoples (Holliday 1997), and that any similarities
in skeletal morphology to preceding archaic Homo populations outside of Africa
is the result of convergent evolution under similar environmental stresses or of
retained traits from an ancient common ancestor. Proponents of the “Multi-
regional” hypothesis counter that the earliest Homo sapiens material from Africa
is outside the metrical range of living populations, demonstrating it is as archaic
as the archaic Homo populations of other continents (Frayer et al. 1993, Wolpoff
and Caspari 1997). However, this idea that the early African Homo sapiens
material is metrically non-modern has been addressed and rejected on metrical
grounds (Bräuer and Singer 1996).
The earliest skeletal materials assigned to Homo sapiens are all African. The
oldest skeletal material in the world that has been attributed to Homo sapiens are
10the Omo materials from near Lake Turkana, Ethiopia which has recently been re-
dated to 196,000 years ago (McDougall et al. 2005). The second oldest Homo
sapiens material (which was the oldest for about a year) is from near Herto,
Ethiopia and has been dated to between 154,000 and 160,000 years ago (Clark et
al. 2003, White et al. 2003). Skeletal material from southern African MSA sites
that has been identified as Homo sapiens includes several fragmentary individuals
from Border Cave (Beaumont et al. 1978, Beaumont 1980, Morris 1992, Pearson
and Grine 1996, Pfeiffer and Zehr 1996, Sillen and Morris 1996) and Klasies
River (Singer and Wymer 1982, Rightmire and Deacon 1991, Grine et al. 1998),
teeth from Die Kelders (Grine 1998, 2000) and a handful of material from
Pinnacle Point 13B (Marean et al. 2004). The dating of this material has long
been recognized as problematic, but the application of multiple dating methods
has led to a consensus that at least some of the Klasies and Border Cave material
is older than 100,000 years and the balance of the Klasies material is older than
60,000 years.
General features such as cranial capacity, tooth size, and overall stature, when
they can be derived from this material, fall within the range of modern (Holocene
or living) African populations (Bräuer and Singer 1996). Marked differences
from Neandertal populations are often noted as well. These differences are noted
in the absence of traits considered common in Neandertal populations, such as a
retromolar space, or in the presence of traits considered modern, such as a
11prominent chin. The sample of Pleistocene skeletal material from southern Africa
is as small as it has been influential in developing evolutionary explanations. Due
to this small sample size population scale questions of variability and change
through time are difficult to assess. The same variability has been interpreted as
(a) exactly the kind of variation that would be expected from the founding modern
population (Smith 1992) and (b) having no discernible relationship with living
populations at all (Wolpoff and Caspari 1997). Additionally, Trinkaus (1993) has
noted that there is little reason to believe that a modern human population from
the Upper Pleistocene would be morphologically similar or identical to any recent
modern population.
Teeth are an especially resilient and useful part of the skeleton for assessing
population membership. Due to the hardness and durability of teeth they are the
most frequently preserved and identified human element in MSA deposits. As
markers of descent, teeth are useful because their morphology is complex and
resultant from multiple genetic loci (Turner 1985, 1987). Irish (1997) evaluated
the relatedness of living populations around the world and found that in dental
morphology sub-Saharan African populations exhibited the most diversity and in
cladistic analyses form the oldest lineage in modern dentition. This study closely
matches the results of the genetic studies discussed below.
12Genetics, the final line of evidence on the origins of modern humans problem, is
the most recently developed, the most difficult to apply, and has, in a relatively
brief period of time, greatly influenced the way we think about those origins. It
was first applied to modern human origins in a seminal paper (Cann et al. 1987)
in which the mitochondrial DNA (mtDNA) from living populations was assessed
for in-group and between-group similarity. As the mtDNA was assumed to not be
under selective pressures and is inherited without recombination, these differences
in variability would represent time-depth for each group’s lineage. Further, by
comparing all groups to the mtDNA in chimpanzees, and by accepting a set rate
of mutation through time, an estimated age of last common ancestor for all living
humans was arrived at. Cann et al. (1987) reported that the group with the
greatest time depth was African and that all people living today descended from a
related group of African females that lived between 200,000 and 100,000 years
ago.
Initially this study was attacked on methodological grounds, that the authors had
used African-American samples as a proxy for African ones and that the program
used to assemble likely descent was flawed, it gave different answers based on the
order that the data were entered (Hedges et al. 1992, Templeton 1993). This
study has been redone, with similar results to the original flawed study (Stoneking
and Cann 1988, Vigilant et al. 1991). Harpending et al. (1998) utilized both
mtDNA and microsatellites on the Y chromosome to determine that our ancestors
13underwent a rapid population expansion about 100,000 years ago. They
concluded that the population expansion was after some bottleneck event, that it
occurred in Africa, and that it is completely incompatible with any version of the
Multi-regional Hypothesis. A large number of genetic studies of this type, based
on living populations, has reached similar conclusions that there is a single origin
for our species, and that Africa is the site of that origin (Stringer and Andrews
1988, Cavalli-Sforza et al. 1994, Cavalli-Sforza 1997, Disotell 1999, Pääbo 2003,
Pearson 2004).
Another type of genetic study, based on the recovery of ancient DNA, has also
recently been successfully applied (Hofreiter et al. 2001). Krings et al. (1997,
1999, 2000) recovered mtDNA from the Neandertal type-specimen and other
samples. They report no affinity to any living population and estimate separation
from the Homo sapiens lineage of around 500,000 years, which predates the
initiation of the MSA in Africa by at least 100,000 years. Knight (2003) similarly
finds Neandertal genetic evidence to be conclusively on the side of population
replacement. Carmelli et al. (2003) continue in this vein, successfully extracting
mtDNA from two late Upper Pleistocene Homo sapiens skeletons from Europe.
They found that the mtDNA for these samples falls within the modern range and
bears no affinity to Neandertal mtDNA from four samples. They concluded that
there was no genetic continuity between Neandertal and modern European
populations. This type of study will be expanded in the future to necessarily

14include samples from the African MSA. To date no African ancient DNA has
been successfully recovered.
Adcock et al. (2001) extracted mtDNA from ancient Australian skeletal material
from ten individuals and found one sequence that does not currently appear to
exist in living populations anywhere (and four that do). They interpreted this to
mean that the population that colonized Australia diverged from the global
population prior to the modern mtDNA genome being “set”. While an interesting
study the final interpretation is ambiguous. We have very little knowledge of the
mtDNA sequences of early anatomically modern peoples and do not know what
other lineages have been lost through a variety of evolutionary processes. In this
case we do know that nine out of ten of the ancient Australians belonged to
mtDNA lineages that are extant today, not a result that requires much explanation.
Perhaps as importantly a more vigorous program to catalog the mtDNA
variability of ancient, living, and recently extirpated African populations will be
necessary to evaluate these results more thoroughly. The National Geographic
Society is currently undertaking a five year project to collect 100,000 genetic
samples from living peoples globally, including a large sample from sub-Saharan
Africa.
Templeton (2002) attempted to make sense of the patterning in all of the genetic
studies available at that time. He gave equal weight to studies on modern and

15ancient populations and to studies on nuclear DNA and mtDNA, and threw in
some assumptions based on skeletal distributions. His resultant model, “Out of
Africa Again and Again”, proposed that a weak version of the Multi-regional
Hypothesis best explained the pattern, with repeated expansions out of Africa
over the past one million years. His interpretation of the data is problematic,
however, in that he relied on the nuclear DNA data for all of the evidence for
earlier population expansion and for the contribution of regional “archaics” to the
modern genome. This type of data are not as well-suited for use as a molecular
clock as mtDNA, because of the possibility of recombination and unknown
mutation rates. We do not know what types of evolutionary processes led to the
nuclear DNA patterns observed in those studies. Furthermore, the evidence from
mtDNA and Y-chromosome DNA, even as presented by Templeton (2002),
strongly support a single African origin of our species between 100,000 and
200,000 years ago.
Eswaran et al. (2005) provide a model that shows how it is mathematically
possible for genes and phenotype to flow between populations without population
replacement per se. Their model assumes that interbreeding between various
species of Homo was not only possible but that it was the norm throughout
prehistory, that population densities were uniform and high across the Middle and
Upper Pleistocene Old World, and that some selective advantage that arose in
African Homo populations was somehow linked to the Homo sapiens phenotype,

16but only loosely tied to the overall Homo sapiens genotype. Not one of these
assumptions is demonstrable in the archaeological, fossil, or genetic record. In
any case their model purports that the important part of “being modern” flowed
from Africa.
In summary, the genetic evidence strongly supports a single African origin for all
peoples living today. If these studies are flawed, as multi-regionalists suggest, it
is curious that they are all flawed toward the same result and that result is fully
supported by the archaeological and skeletal evidence. It is interesting that the
regional ancient Homo population that we know the most about genetically,
Eurasian Neandertals, now seems the least likely to have made any contribution to
living populations. Taken together, the archaeological, morphological, and
genetic evidence fit only the “Out of Africa” hypothesis in explaining the origin
of our species. What remains to be determined are the where (in Africa), when
(during the MSA), why, and how of that event.
Location and Timing
Any reasonable hypothesis for modern human origins, both cultural and
anatomical, has at its minimum the overwhelming representation of Africa at its
roots. Even the long-lived alternative to the “Out of Africa” hypothesis, the
“Multi-regional” hypothesis chiefly supported by Wolpoff (Wolpoff and Caspari
1997), has moved to increasingly weaker forms, accepting the majority of genetic
17input from Africa in global Homo sapiens populations (Relethford 1999, Pearson
2004). We are an African species and have been behaving in modern ways in
Africa tens of thousands years longer, and potentially much longer than that, than
anywhere else. As stated recently by Mellars, “…it is now possible to show
beyond any reasonable doubt that many of the most distinctive archaeological
hallmarks of the classic Middle-Upper Paleolithic transition in Europe can be
documented at least 30,000 to 40,000 years earlier in certain parts of Africa than
in anywhere in Europe itself” (2005:16). Virtually all of the current debate on the
timing and coincidence of the events that define modernity involves African data.
As the main unifying theme of this dissertation I utilize a set of evidence from the
Southern Cape (that “certain part of Africa”) to examine the proposed models for
our African origin.
The debate over the location within Africa where we first evolved persists and is
summarized here. Although this debate is important, it will surely not be resolved
for a very long time. This is because gene flow between early Homo sapiens
populations, especially among those south of the Saharan desert, is likely to have
occurred before, during, and after the Upper Pleistocene. In addition, while one
population of thousands of individuals in a discrete area is likely to be the parent
population of all peoples living today (Harpending et al. 1997, c.f. Harris and Hey
1999) other anatomically modern contemporaries without living descendents, are
likely to have had advanced material cultures. They may also have had DNA

18lineages that have some representation today (through the founder population).
The strengths, weaknesses, and biases of each major region are summarized here.
1. East Africa currently has the oldest dates for unambiguously Homo
sapiens skeletal material (McDougall et al. 2005, Clark et al. 2003, White
et al. 2003). These specimens from Ethiopia have been dated to as old as
196,000 years ago. But this part of the continent has benefited from unique
geologic exposures, suitability for volcanic-dating (Tryon and McBrearty
2002), and relatively frequent fossilization along with a sustained presence
of dedicated researchers (for example the Leakeys) may overemphasize
this area’s primacy.
2. Abundant evidence for the earliest modern behaviors and a cluster of very
early Homo sapiens skeletal material are extant in southern Africa (Singer
and Wymer 1982, Henshilwood and Sealy 1997, Henshilwood et al.
2001a, 2001b, 2004, d’Errico et al. 2001, 2005, Watts 2000). As in East
Africa, southern Africa has benefited from sustained research from the
early twentieth century onwards (Dale 1870, Leith 1898, Stapleton and
Hewitt 1927, 1928, Goodwin 1927, 1928, Goodwin and Van Riet Lowe
1929) and, while lacking volcanism, complements East Africa with its
abundant caves. Recently, application of luminescence dating has placed
the archaeology of the Upper Pleistocene in better chronological contexts
(Feathers 2002, personal communication, Tribolo 2003, Jacobs 2004).

19
3. Tropical Central Africa has hardly been examined but there is no reason
that our ultimate origins could not be there. The southern part of that
region has yielded some of the earliest evidence for both MSA bone tool
manufacture and fishing (Brooks et al. 1995, Yellen et al. 1995, Yellen
1996). The lack of political stability, infrastructure, ground visibility,
organic preservation, and, surprisingly, academic interest has conspired
with the short-comings of current archaeological techniques to leave this
region virtually unknown for the relevant time-frame.
4. Usually excluded almost arbitrarily for not being in sub-Saharan Africa,
North Africa seems the least likely of the regions, but frequent lack of
organic preservation, lack of volcanic geology, and the presence of some
of the most spectacular of ancient civilizations have tended to divert
research away from modern human origins. The site of Jebel Irhoud in
Morocco has provided some early dates on Homo sapiens material (Grün
and Stringer 1991) that are potentially as early as the southern African
materials or as late as those from the Levant. If North Africa is the region
that gave rise to us, then some intriguing scenarios for sustained
interspecies culture contact with Middle Paleolithic Eurasia become
possible, but currently have no support in the archaeological record.
20Accepting that we are an African species a focus on the timing and order of the
events of our evolution becomes the key to modern human origins research.
Indeed, for Africanists working on this issue, this is the problem to be solved.
Two events (which may or may not have been separate); when we became
anatomically modern and when we became behaviorally modern in Africa, are
considered the key to understanding when we became us and why. For the timing
of modern human development four possibilities are plausible and have been
recently summarized by Henshilwood and Marean (2004) as the following
models.
1. Late Upper Pleistocene Model (Neural Advance Model), (Klein 1999,
Ambrose 2001): Modern behavior is a relatively late development.
Physical modernity (minus a gene or two) is accepted for the oldest
“archaic” Homo sapiens, but modern behaviors develop between 40 and
50 kya (ignoring the limitations of 14C and its effect on this “cluster” of
evidence). This possibility is increasingly at odds with the archaeological
evidence, makes little sense in the context of most genetic studies, and is
difficult to reconcile with evolutionary biology (but see Foley and Lahr
2003 for an explanation of how this may be). Coolidge and Wynn (2005)
have proposed a version of this model that is based on changes in the
executive functions of the brain and is manifest in some artifact types.
They have a broad time range for when this mutation could have occurred

21and their version of this model is not necessarily at odds with earlier
models.
2. Early Upper Pleistocene Model (Gradualist Model), (McBrearty and
Brooks 2000): Modern behavior is gradually accumulated over time after
physical modernity arises, but is evident tens of thousands of years before
the Late Model. This possibility, most thoroughly articulated by
McBrearty and Brooks (2000), matches all classes of evidence well. Its
main weakness is that it is inductively derived from the archaeological
record, and as such reifies the myriad biases in preservation, recovery, and
dating. It is such a tight fit with the existing evidence that it will need to
be constantly remade to match new information.
3. Earlier Upper Pleistocene Model (Early Model), (Deacon 1989,
Henshilwood and Marean 2004): Modern behavior and anatomy were
roughly coincident greater than 100 kya. This proposition has numerous
minor variants in timing and location. It has remained robust over time in
the context of new archaeological and genetic data, and has benefited
greatly from newer dating techniques extending into this period.
4. Middle Pleistocene Model (Earliest Model), (Foley 1987, Deacon 1988,
Foley and Lahr 1997): Modern behavior precedes modern anatomy by

22some time. The beginning of the MSA is taken to be the marker for
modern behavioral capacity. This has been pushed back as far as 280 kya
in East Africa (Tryon and McBrearty 2002), nearly 100 kya earlier than
earliest accepted Homo sapiens (McDougall et al. 2005). This proposition
makes sense in the context of evolutionary biology, where changes in
behavior frequently precede anatomical change. That is, speciation occurs
behaviorally before it does physically. The time-frame critical for
addressing these issues, 350 to 125 kya, is virtually unknown in many
parts of Africa. The coastal caves of the Cape, having frequently been
scoured by high sea-stands during OIS 5e, only rarely contain
archaeological materials from this period.
In the following chapters of this dissertation I will apply the archaeological
evidence from one of these regions, southern Africa (and specifically the Cape
Coast), to the problem of the timing of modern human origins. I accept that an
earlier origin may occur in another region (or regions) of Africa. But, I will
address this problem for the area from which most of these models have been
developed and previously applied.
Behavioral Modernity
Darwin warned us not to think of humanity as removed from natural selection,
and not to make special rules explaining how we came to be:
23Man with all his noble qualities, with sympathy which feels for the
most debased, with benevolence which extends not only to other
men but to the humblest living creature, with his god-like intellect
which has penetrated into the movements and constitution of the
solar system- with all these exalted powers- Man still bears in his
bodily frame the indelible stamp of his lowly origin. [1871]
But the temptation to do so seems to be impossible to resist and so the concept of
“behavioral modernity” was developed. That is, our advanced intellect and
complicated social behaviors make us a “special case” in evolution, a deus ex
machine explanation. Or, as the evolutionary biologist Roger Lewin has said,
“…the argument must be recognized as special pleading with no empirical basis”
(1998:113). This concept was originally developed as an explanatory tool for the
Middle Paleolithic to Upper Paleolithic transition in Europe and Marean and
Assefa (2004) trace its origins to a paper by Paul Mellars (1973). It has as its
basis the idea that biological evolution and behavioral evolution in Homo sapiens
might not be closely correlated in time. This idea has become so widespread in its
uncritical acceptance that more standard evolutionary biological views, that
behavioral changes are likely to precede or coincide with morphological changes,
have become minority positions in paleoanthropology. This concept of separate
behavioral and biological evolutionary time-frames is also useful in restoring
importance with regards to modern human origins to the Upper Paleolithic record
of Europe and it should be noted that it was developed just as early dates for
African Homo sapiens were becoming widely accepted. That is not to say that it

24is not possible that we evolved our physical form over 100,000 years earlier than
our modern intellectual capacity; only that as a case of special pleading the onus
is on proponents of this view to clearly demonstrate the evidence for this. In this
dissertation I argue that this has not been done, that the kinds of evidence most
often cited is poorly suited to address this issue, and that evidence well-suited to
address this issue is at direct odds with the late emergence of modern behavior.
"Behaviorally Modern" is a multivariate concept and one that is profoundly
vague. Behavior is made up of technology, customs, language, cuisine,
intellectual capacity, and many other parts. It may be more useful to identify
aspects of the archaeological record that are technologically modern or modern in
problem-solving, rather than the whole bundle at once. While this may sound just
like another list-making approach it is actually just the opposite. Traits here
represent capacity, rather than things that are necessary to attain. Our question
then becomes: “is there evidence that these people had a modern capacity for
doing things?” rather than “are these people doing things the same ways modern
peoples do?” How we ask these questions is more than just semantics, capacity
requires types of data other than single artifacts or single sites to address it. It
also requires that the totality of what we know about MSA people be viewed
together; that each class of evidence or each assemblage be used to provide
context for every other. I try to do this for the Still Bay specifically and for the
MSA generally in this dissertation. The data I present on a number of Still Bay

25assemblages provide context for the well-excavated and dated site at Blombos
Cave. The Blombos Cave site in turn provides context for the other Still Bay
assemblages. Taken together we can draw more inferences on the behaviors and
capacities of Still Bay peoples than we could if each set of data was viewed alone.

26
Table 1.1: Sub-stages of the MSA for the Cape Coast, adapted from Wurz (2002) with my own additions marked*.
Singer &
Wymer
Volman
Wurz
Sites/Layers
Age estimates
MSA III & IV
MSA 3/4
Post-Howiesons Poort
KRM (Upper), Rose Cottage Cave, Sibudu, Ysterfontein
55-35,000
HP HP Howiesons Poort
KRM (HP), Howiesons Poort shelter (S&H)
65-55,000
* Die Kelders Die Kelders, Howiesons Poort shelter (D&D)?
70-60,000
Still Bay Blombos Cave (M1), Dale Rose Parlour
79-69,000
* Blombos Blombos Cave (M2) ?
MSAII MSA 2b Mossel Bay KRM (SAS) 72-68,000 (too young??)
MSA I MSA 2a Klasies KRM (LBS) >120-105,000
* MSA 1 ? Border Cave, Peers Cave?
?
* ? Blombos Cave (M3) ?
27
Figure 1.1: Map of southern Cape of South Africa with MSA sites mentioned in this dissertation marked. Border Cave (BC), Sibudu Cave (SBC), Geelbek Dunes (GD), Hollow Rock Shelter (HRS), Elandsfontein (EF), Peers Cave (PC), Dale Rose Parlour (DRP), Skildergatkop (SGK), Cape Hangklip (CHK), Montagu Cave (MC), Blombos Cave (BBC), Blombos Sands (BBS), Kleinjongensfontein (KJF), Pinnacle Point (PP), Nelson Bay Cave (NBC), Klasies River main site (KRM), and Howieson’s Poort shelter (HP).
28Chapter 2: The Middle Stone Age
…the fascinating processes of our own becoming - Lewis R. Binford [1984:266]
The MSA is defined both technologically and chronologically as being
intermediate to the Earlier Stone Age (hereafter ESA) and LSA in Africa
(Goodwin 1928, Goodwin and Van Riet Lowe 1929, Sampson 1974, Deacon and
Deacon 1999). Based on the both the technology present and the morphology of
the associated hominids the MSA was initially judged to be equivalent to or
contemporaneous to the Upper Paleolithic of Europe (Klein, 1970:132). This
interpretation was reinforced by erroneous radiocarbon estimates (see Klein 1970:
Table 1 for an early compilation). Sampson (1974) reassessed the MSA as
equivalent to the European Mousterian on broad chronological grounds. And,
when it became clear that anatomically modern people had much greater time
depth in Africa than in Europe, the MSA was broadly accepted as essentially
equivalent to the European Middle Paleolithic (Klein 1999). Wurz (2000)
provides a clear and cogent critique of the Euro-centrism and backlash against
failed expectations at play in many of these reinterpretations. McBrearty and
Brooks (2000) also convey eloquently a countering view to that forcefully
proposed by Klein and others that even if the African hominid record is much
deeper, much of that depth has no relevance to the origin of modern humans.

29When the earliest taxonomic system was proposed for Africa it had only the
Earlier and Later Stone Ages (Goodwin 1926). The Earlier Stone Age (hereafter
ESA) was defined largely by the presence of large bifacially flaked tools, most
notably the Acheulean hand axe. It continues to be defined that way today. The
LSA was defined by the presence of microlithic technologies, including bladelet
production. As our understanding of LSA technology has increased it has
incorporated a wider range of tool manufacture spanning the past 40,000 years or
so. The Middle Stone Age was soon defined as being intermediate between the
ESA and LSA, both temporally and technologically (Goodwin 1928a, 1928b).
This original definition of the MSA was largely a negative one. That is, the MSA
was defined by what it was not, rather than by what it was. In this scheme the
MSA began when assemblages no longer contain handaxes and continued until
microlithic production was undertaken. It is only later that the unique aspects of
the MSA were recognized and incorporated into a positive definition of the MSA
as being blade-based, rather than flake-based, and that the preparation of cores in
Levallois-like ways becomes common (Goodwin 1946, Mason 1962, Sampson
1974, Inskeep 1978, Deacon and Deacon 1999, Mitchell 2002a). Some aspects of
the old definition are still retained today and this helps to further muddy the
questions of when and how the transitions between the ESA and MSA (Tryon and
McBrearty 2002) and the MSA and LSA occurred (Wadley and Jacobs 2004,
Villa et al. 2005).

30That these transitions are muddy, that they are patchy in time and space and not
abrupt like those between the Middle Paleolithic and Upper Paleolithic of Eurasia
(Bar-Yosef 2002), does offer some insight into their nature. It has been noted that
only in Africa does this long technological evolution seem to play out in a
continuous sequence, albeit one with fits and starts. It is argued that this supports
the African origins of our species (Foley and Lahr 1997, 2003, Marean and
Assefa 2004). In reference to the question of modern human origins the MSA to
LSA transition is of interest as this is Klein’s main marker of modern behavior.
This transition does not seem to have occurred either when the Neural Advance
model (Villa et al. 2005, Chapter 7 this volume) requires or in a uniform way
across Africa (Marean and Assefa 2004).
MSA on the Cape Coast
The archaeological record for the MSA of the Cape Coast of southern Africa is
summarized here. Sites in this region tend to be either in coastal caves, dune
fields, inland rockshelters, or, rarely, as buried open sites.
Coastal Caves
Coastal cave sites are located in caves cut by wave action into the quartzitic
sandstone bedrock of the region. As such they tend to be near modern sea-level
and to face the ocean. Some well-known examples of caves of this type are the
Klasies River mainsite, Blombos Cave, Nelson Bay Cave, and Die Kelders

31(Figure 1.1). High sea level stands in the past, such as OIS 5e 125,000 years ago,
often removed older archaeological deposits, as has been well-documented at
Klasies (Singer and Wymer 1982). This is not always the case and caves such as
Blombos Cave and Pinnacle Point 13B that sit higher than the OIS 5e sea stand
contain older deposits. The quartzitic sandstones that are the parent material of
these caves are acidic. Groundwater flowing through these caves and their
archaeological deposits, if unbuffered, destroys organic artifacts, and faunal
remains. Fortunately, in some locations the bedrock formations are capped by a
layer of calcrete, a calcium carbonate rich soil, which buffers the groundwater
resulting in better faunal preservation. The shelter at Ysterfontein 1 on the
Atlantic coast (Figure 1.1) is itself cut into a calcrete bank, providing excellent
bone preservation (Halkett et al. 2003, Klein et al. 2004)
Dune Field Sites
Large amounts of MSA material have been recovered from the dune fields that
are common along the Cape coast. The oldest collections from the region were
collected in the dune fields around Cape Town called the Cape Flats in the middle
and late nineteenth-century and were attributed to the grab-bag “Cape Flats
culture” (Dale 1870). Dune field MSA assemblages are known from the Still Bay
area and include Kleinjongensfontein and Blombos Sands. A large MSA
assemblage was recovered from the dunes at Cape Hangklip and MSA artifacts
are known from a number of other dune fields in the region, including
32Elandsfontein (Klein and Cruz-Uribe 1991) and Geelbek Dunes (Conard et al.
1999) (Figure 1.1). Dune sites are notoriously difficult to date accurately as
periods of exposure and reburial are likely. Dune sites also tend not to preserve
organic materials (although there are exceptions, see the fauna from Elandsfontein
or the bone point from Blombos Sands). Dune sites have the potential to contain
a different set of activities than those in the confined spaces of caves and some
effort to compare what appear to be contemporaneous cave and dune sites near
Still Bay is attempted here, but with poorly documented dune collections and no
access to the unpublished cave data. A coordinated effort to collect and record
dune materials in the area and directly compare artifacts, including raw material
sourcing and through refitting, seems to be required to work through this
relationship in a satisfactory way.
Inland Rockshelters
Caves and rockshelters that are not adjacent to the coast present a different set of
problems and benefits from coastal cave sites. Unlike coastal caves these sites are
not subject to the loss of deposits due to higher sea levels. Longer sequences of
occupation with much greater time-depth are possible. These shelters are also
formed in a wider variety of geologic formations, some of which are alkaline or
neutral and preservation of organic artifacts is possible. Even spectacular organic
preservation is present in some cases, like Diepkloof shelter (Parkington and
Poggenpoel 1987). Conversely, some of these caves and shelters are formed in

33acidic geologic formations and the buffering calcrete deposits common on the
coast are often lacking, resulting in no organic preservation at sites like Dale Rose
Parlour and the Howieson’s Poort shelter (Figure 1.1). As the areas immediately
adjacent to these sites were not being dramatically altered by sea level change (for
example, a foreshore area becoming coastal grassland) as the areas adjacent to
coastal caves were, it is likely that some periods of time that are poorly
represented in coastal caves will be the focus of human use of these inland sites.
It is possible that even when occupied at similar times or even by the same set of
people the artifact assemblages at inland and coastal caves could be quite different
due to the different sets of local food resources and tool materials present in each
local setting.
Buried Open Sites
Buried sites that were in the open at one time, with the exception of dune field
locations, are virtually unknown for the MSA in the Cape coast area. While it is
recognized that sites of this type have contributed greatly to our understanding of
prehistoric sequences around the world, and would probably also do so for the
Cape MSA, no program for identifying and excavating this class of site has been
undertaken. The recent maturation of Cultural Resource archaeology in
conjunction with rapid property development in the Cape provides the best
opportunity for identifying and systematically recording buried MSA sites in the
near future.

34
Explanatory Frameworks for Interpreting the MSA
Archaeologists (and scientists in general) view their research within explanatory
frameworks. Explanatory frameworks provide guiding structures for what is
important to look for and record. In some ways explanatory frameworks inform
us on what is possible. For example, prior to the widespread acceptance of Monte
Verde as a pre-Clovis New World site (Meltzer 1997, Meltzer et al. 1998) there
was little reason, under the prevailing explanatory framework (Clovis-first), for
investigating geological deposits for evidence of human occupation that were
older than 12,000 years. Consequently, in a self-fulfilling prophecy, no older sites
were found. That is not to say that explanatory frameworks do not have utility.
Under the current explanatory framework no sites containing pre-modern
hominids are expected in the New World and so virtually no efforts are made at
expensive investigations into Middle Pleistocene deposits (Calico Hills being the
exception that proves the rule), and rightly so. Science requires explanatory
frameworks to operate, we need the focus that they provide and the common goals
and methods that they engender provide unity in a discipline, such as archaeology.
Middle Stone Age studies in southern Africa have recently undergone a
framework shift comparable to that in the New World that resulted from the
acceptance of Monte Verde. Again, a single site was the motor of that shift (in
this case Blombos Cave), although in both cases (that of the MSA and that of the
35example of peopling of the New World) acceptance of the first instance has
allowed for reinterpretation of previously known sites and new research goals for
on-going investigations. Here I name the prevailing explanatory framework of
MSA studies from the late 1970s until very recently the “Klasies Model” and the
newer one, which has emerged in only the past eight years, the “Blombos Model”.
Obviously, practitioners operating in the older explanatory framework will come
off looking less good than practitioners operating in the newer one (as is always
the case), but that is not the point. As scientists we need to accept that
understanding builds on “failures” as much as on “successes” and that what we do
now will always inevitably look dated in the future, at least in part because our
explanatory frameworks will be long gone by then. My point here is to describe
why MSA data have been interpreted the way that they have and why, in light of
new findings, those same data need to be interpreted in new ways, new data need
to be gathered in different ways, and we need to be open to unexpected things.
The Klasies Model
The MSA cave sites at the Klasies River Mouth (KRM) on the Tsitsikamma coast
(now usually referred to as the mainsite) have proved to be both a boon and a
bane to modern human origins research. The boon is obvious. The KRM sites
provided what at the time were the oldest known Homo sapiens skeletal materials
(Singer and Wymer 1982). Additionally, the MSA deposits at Klasies were
massive and provided tens of thousands of lithic and faunal artifacts from gross-

36scale, but stratigraphically excavated, contexts. Klasies also had several lines of
evidence that suggested antiquity for the oldest deposits of at least 120,000 years
ago (Butzer 1982, Singer and Wymer 1982). Although Binford stated, “these
dates lead me to be very uneasy about the chronology” (1984:45), they did
support the only meaningful chronology for the MSA that was available until very
recently. Subsequently, finer-scale excavations at KRM have confirmed many of
the original observations of stratigraphy and artifact content (Deacon and
Geleijnse 1988, Deacon 1995, Wurz 2000, 2003, Wurz et al. 2003) and
luminescence dating has confirmed the general chronology of the site (Feathers
2002). The long sequence at Klasies seemed to offer a model for MSA artifact
change through time that was complete and, other than the Howiesons Poort
levels, exhibited little change for what appeared to be long periods of time. All
models of explanation of MSA behavior had to account for the patterns observed
at Klasies, whether in the faunal (Klein 1982, 1999, Binford 1984) or lithic
(Ambrose and Lorenz 1990, Deacon and Wurz 1997) artifacts.
One particular Klasies pattern in the lithic assemblage was what appears to be
long periods without much technological change or variability and an absence
(actually near-absence is more accurate) of some of the more “modern” artifacts,
such as fully bifacial points and bone tools, that had been recovered for decades in
other Cape MSA sites, although often in somewhat dubious contexts. Much has
been made of this apparent lack of technological change and this is linked directly

37by Klein (1999) to the idea that MSA peoples lacked some modern intellectual
capacities until 50 – 40 kya. Klasies provided us with the correct sequence, for
the materials that are present, but as we get additional well-excavated MSA
assemblages and look anew at museum collections it has become clear that the
Klasies sequence lacks artifacts from large periods of time. The traditional
chronology for Klasies is as follows:
• At the base of the deposit is the LBS Member. The LBS is considered to
be a rapid re-occupation of the caves after the high sea-stand of OIS 5e.
OIS 5e is dated to around 125,000 years ago. Isotopic levels in marine
shell in the LBS (Deacon et al. 1988), U-series dates (Vogel 1982), and
luminescence dates (Feathers 2002) are all in general agreement on this
scenario. This is the only point beyond radiocarbon age that nearly all of
the researchers are in agreement about (and hence Binford’s
“uneasiness”). The artifacts in the LBS are assigned to the MSA I by
Singer and Wymer (1982) and the MSA 2a by Volman. Wurz (2003) has
suggested the name Klasies sub-stage for this assemblage (Table 1.1).
Some Homo sapiens skeletal materials were recovered from the LBS and
stood for decades as the oldest dated modern humans known.
• Next, above an apparent discontinuity, comes the longest depositional unit
at Klasies, the SAS Member. The SAS is at some points exceeds ten
meters in depth. This unit has been much more difficult to place
chronologically. It has been thought of as being between the LBS OIS 5e
38date (120,000 BP) and the HP date of around 60,000 BP. Shackleton
(1982) used oxygen isotopes in marine shell to suggest several times
during that period that it could represent. Deacon et al. (1988) expanded
on the oxygen isotope study, with results that were only “tentative” and, in
places where luminescence dates have subsequently been obtained, seem
inaccurate. Generally, due to the imprecise dating of the SAS and its
massive bulk it has been thought of as a deposit that accumulated over
tens of thousands if not 60,000 years and hence the apparent static nature
of the artifact assemblage. Feathers (2002) dated two samples from the
SAS (UW-274 and UW 455) using luminescence dating and very
conservative dose rate estimation. Although the samples are from
different units in the SAS their stratigraphic relationship is not fully
resolved, due to the large gaps in the deposit from previous excavations at
the time of the sampling (Feathers, personal communication). He reported
age estimates of 70.9 ± 5.1 kya and 68.4 ± 6.5 kya. It is possible that these
estimates are slightly too young (when compared to U-series dates (Vogel
2001)) but they are still would be dating what is essentially a single event.
Additionally, shell density studies for this member (Thackeray 1988) and
microfauna (Avery 1986, 1987, 1990) suggest little climatic change during
the deposition of this massive member. In particular, even though many
more samples were taken for the shell density studies from the SAS than
other depositional units, there is less change there than for other short-
39lived deposits such as the HP (Thackeray 1988). This leads me to suggest
that the SAS Member is a rapid depositional event; that it is on the scale of
thousands (or perhaps of hundreds), not tens of thousands, of years in
duration. This has implications for interpreting the KRM and other MSA
assemblages and will be discussed in more depth later in this section.
• Above the SAS Member is the RF Member. This deposit contains large
amounts of roof-fall and little archaeology. Feathers (2002) reports an age
estimate of 80.6 ± 17.6 kya which has a large error term and is out of
sequence with the stratigraphy. Within the reported range, however, a
date of 65 – 60 kya would be in agreement with the stratigraphic order and
other lines of evidence.
• Above the RF Member is a deposit referred to as the Upper Member. The
Upper Member contains the Howiesons Poort deposits (referred to as the
HP by Singer and Wymer 1982) and above that the post-Howiesons Poort
deposits. Dating of the Howiesons Poort has been an elusive goal and one
which the deposits at KRM may never resolve (Feathers 2002). Age
estimates of 52.4 ± 4.0 and 46.7 ± 3.3 kya are on the young side compared
with other Howiesons Poort age estimates of ~60 kya (Tribolo 2004).
This represents either poor age estimation for the luminescence dates at
KRM or a lack of unity for the deposits called Howiesons Poort across
southern Africa. Either is possible but the large HP deposits at KRM are
40clearly technologically and typologically Howiesons Poort, so much so
that the site has become the type site for the sub-stage.
In summary, the Klasies Model is one in which the thick deposits of some MSA
cave sites (in particular those at Klasies) are viewed as representing long spans of
time (on the scale of tens of thousands of years) of continuous human utilization
of those sites. Taken directly from that explanatory framework, in particular the
application of it to the SAS Member at Klasies is the interpretation that the
southern African MSA between 120,000 and 60,000 years ago is relatively
technologically static. This interpretation came directly from the gross-scale
excavation methods guided by the goal of recovering hominid remains to assess
for anatomical modernity and a lack of applicable dating techniques. The
traditional view of Klasies as a massive sequence that represents everything we
know about the Cape MSA (the Klasies Model) is rapidly falling away and with it
must go the interpretations based on that explanatory framework.
The Blombos Model
The direct application of the Klasies technological sequence to other MSA
assemblages has proved difficult. Singer and Wymer’s (1982)
technological/typological sequence of MSA I, MSA II, HP, MSA III/IV failed to
describe the known sequence at Border Cave (engendering Volman’s (1981) own
technological/typological sequence of MSA 1, MSA 2a, MSA 2b, HP, MSA 3/4),
41did not describe the variability that was already known from older sites in the
Cape, such as Peers Cave, and did not match the materials that were recovered
using modern excavation techniques for the thick MSA sequence at Die Kelders
Cave (Thackeray 1992, 2000) or Ysterfontein 1 (Klein et al. 2004). Recent
quantitative work by Wurz (2002, Wurz et al. 2003) confirms that the typology at
Klasies is based on measurable traits, the fault lies in the sequence itself being
very incomplete. This has been dramatically confirmed by the recent excavations
at Blombos Cave (Henshilwood and Sealy 1996, Henshilwood et al. 2000, 2001a,
2004). Wurz (2002) has proposed a new scheme for organizing the techno-
temporal units of the Cape MSA (Table 1.1).
Blombos Cave was excavated using much finer-scaled recovery and stratigraphic
techniques than the Singer and Wymer excavations of Klasies. Additionally,
from the onset of MSA excavations use of single-grain optically stimulated
luminescence (OSL) for precise dating estimates was undertaken. Like Klasies,
Blombos Cave has well-preserved fauna. The number of MSA sites in the Cape
with preserved fauna that are published is surprisingly limited. Currently there
are two, Klasies and Die Kelders, and there will soon be published the fauna from
Blombos Cave and that from Pinnacle Point 13B (both currently the subject of
Jessica Thompson’s dissertation research) and also soon those of the French team
led by Jean-Philippe Rigaud excavating Diepkloof shelter (Figure 1.1). As each
new, well-excavated assemblage becomes known they are in discordance with the
42sequence developed for Klasies, in particular that the SAS is a long-lived and
stable technological stage. Of these Blombos Cave serves as the best example of
how the Klasies Model has been overturned.
The MSA sequence at Blombos Cave is quite different from that at the Klasies
River mainsite. The MSA here is below a dune intrusion that seals it from the
subsequent LSA occupation that was the original focus of archaeological research
there (Henshilwood and Sealy 1997, Henshilwood et al. 2001). The dune has
been securely dated by single-grain and single-aliquot OSL to 65-69 kya (Jacobs
et al. 2003). Below the dune is a sequence of deposits that have been labeled M1,
M2, and M3 by the excavators. The uppermost of these, M1, has yielded an
impressive number of bifacial points of the Still Bay type (Henshilwood et al.
2001, Soressi and Henshilwood 2004) and is sometimes referred to as the Still
Bay layers. These have been dated by single grain OSL on sediments and TL on
burned lithics to 74 ± 5 kya (Henshilwood et al. 2004). Abundant use of mineral
pigments is in evidence in the M1 deposits and engraved pieces of ochre from
these layers are touted as the earliest clear expression of human symbolic thought
(Henshilwood et al. 2002). Also from the M1 layers drilled marine shells that are
interpreted as having been strung as a necklace were recovered (Henshilwood et
al. 2004, d’Errico et al. 2005). This is viewed by many as the oldest known
personal adornment. These finds were excavated using modern methods and
there appears to be no chance of intrusion from later LSA occupations of the cave.

43
Below the M1 is deposit called the M2 which is best known for the large number
of bone tools and worked bone pieces recovered from it (d’Errico et al. 2001,
Henshilwood et al. 2001b). Importantly, due to the careful work of the excavators
(and to the fact that a transition was actually there), the abundant bifacial points in
the M1 layers were observed to grade into the abundant bone points in the M2
layers (Henshilwood et al. 2001a). That is, two types of artifacts co-vary
inversely. This is quite different from the nature of transitions between the
depositional members at Klasies where it appears that a hiatus of occupation
occurred between each major stratigraphic unit. The next set of layers at Blombos
Cave is grouped as the M3. The M3 artifacts have not been well-described, but
are reported to be quite different from the lower layers at Klasies which they
appear to pre-date (Soressi and Henshilwood 2004). The transition between the
M2 and M3 is abrupt, and in that way resembles the transitions at Klasies.
The lessons of Blombos Cave will take time to fully penetrate the research
programs of southern Africa, just as the lessons of Klasies took time to penetrate
the Eurocentric view of our origins. Of these lessons perhaps the most important
is to remove some of our preconceptions about what is possible in MSA deposits.
Rather than not expecting to find the types of things recovered from similar
Holocene-aged sites (a self-fulfilling expectation, no doubt) modern excavators
need to try to recover data in finer-scales and to be open to surprising finds. Not
44all of these will be as spectacular as those from Blombos Cave, but programs to
recover MSA-aged plant and animal residues (Lombard 2005) at Sibudu Cave in
KwaZulu-Natal and the recognition of hair adhering to MSA tools at Pinnacle
Point Cave 13B (Chapter 7 of this volume) or the preservation of hafting adhesive
residues on a Howiesons Poort artifact (Chapter 6 this volume) all owe
themselves in part to this recognition of possibilities. In short, the limitations of
the MSA record to address issues of behavior are increasingly being shown as our
(archaeologists’) limitations in recovering the appropriate data, rather than its
total absence.
In summary the two explanatory frameworks for MSA studies in play in southern
Africa and their major components are:
The Klasies Model
• Result of the recognition of the extreme antiquity of Homo sapiens in
southern Africa and their strong association with the MSA.
• The thick MSA deposits represent very long continuous occupations.
• “Modern” artifacts are usually excluded as anomalous or intrusive.
• Broad classificatory schemes for technology proposed.
The Blombos Model
• Finer-scaled excavation techniques with emphasis on context.
45• “Modern” artifacts are accepted as part of the MSA.
• Application of numerous dating methods to MSA.
• Recognition that extreme antiquity may not necessarily make study of
organic remains impossible.
• Lessening of the “expectations filter” during materials analysis.
The Rapid Depositional Model for MSA Change
If, and it seems likely as more and more modern MSA excavations are published,
the Klasies sequence represents a fragmentary reflection of the total MSA
technological sequence, then some things necessarily follow from that. When
thought of in the compressed time-frame suggested here the SAS Member
supports a different interpretation of MSA technological variability. The stability
within the SAS Member still represents stylistic unity (Wurz 2002, Wurz et al.
2003), only for a much briefer period than has been widely assumed.
Interestingly, a rapid depositional time-frame was suggested by Feathers and
Bush (2000) for the large MSA deposit at Die Kelders based on luminescence
dating. The thick MSA deposit at Die Kelders has periods of relatively little
cultural accumulation during which dune sands were deposited in the cave. Those
sands were dated by Feathers and Bush (2000) to between 60,000 and 70,000
years ago. This dating estimate corresponds nicely to the dune incursion that
truncated the MSA sequence at Blombos Cave (Henshilwood et al. 2004). J. F.
46Thackeray (2002) concurs that a rapid deposition here is probable, based on little
evidence for change in the microfauna. Die Kelders and Klasies have several
things in common that make rapid deposition of sediments likely. They are both
coastal cave sites. As such they are the focal point of human activities in the
setting and attract people repeatedly to the same location. They shelter the
archaeological deposits from the elements and these can persist in these locations
longer than if they were exposed in the open. Both of these sites have calcrete
(limestone) deposits above the caves. These calcretes have acted as buffers
against ground water acidity helping to preserve archaeological bone and shell,
aiding the rapid accumulation of thick deposits. Coastal caves are also natural
traps for dune sands, which also accumulate over relatively brief periods of time
adding to the thickness of the deposits.
If we take the view that the deep deposit at Klasies, and in particular the SAS
Member is on a time-scale of hundreds, or at the most single digit thousands, of
years in duration then the appearance of stasis in the technological sequence there
is removed. This appearance of stasis has not only been used to characterize the
technological change (or lack thereof) at Klasies, but also for the nature of faunal
resource exploitation there (and by extension for all of the MSA). In the next
chapter the idea that our long held assumptions on the meaning of MSA data may
be mistaken is used to quantitatively test the most widely accepted explanation of
many of these faunal patterns. The remainder of this dissertation continues in this

47vein, reassessing our interpretations of the MSA in light of what is rapidly
becoming the dominant explanatory framework in MSA research.
48Chapter 3: Faunal Resource Use and Behavioral Modernity
The faunal assemblages of the MSA have played a critical role in discussions of
the modernity of MSA peoples for some time. One of these discussions was
engendered by Binford’s interpretation of the faunal materials from Klasies
(Binford 1984). This interpretation focused on the relative abundance of parts of
animals and led Binford to propose that the MSA people at Klasies were primarily
scavengers and had poor organizational and planning skills. An entire literature
has developed in response to this model (Deacon 1985, Klein 1989, Turner 1989,
J. F. Thackeray 1990, Milo 1998, Bartram and Marean 1999, Outram 2001). This
interpretation has been addressed repeatedly and dismissed on the grounds that
the materials that Binford analyzed were absent long bone shaft fragments due to
excavation bias (Turner 1989), analytical bias (Bartram and Marean 1999),
because and direct evidence for MSA hunting of large bovids has been developed
(Milo 1998). However, other patterning in the faunal assemblages of the MSA
continues to be used to construct models of human behavior and it is those
patterns that I address in this chapter.
In developing explanations for why modern peoples successfully out-competed
other hominids, observations on the differences in the faunal assemblages of MSA
and LSA sites have often been cited. It is noted that the faunal assemblages have
different compositions in taxa present, richness, and size. These differences have
been attributed to differing hunting abilities and intellectual capacities for earlier

49and later anatomically modern peoples in southern Africa. Klein (1994, 1995,
1999, 2000, Klein and Edgar 2002, Klein et al. 2004) has repeatedly asserted that
MSA hominids were hunters, just less effective at it relative to their LSA
successors. This has been used as the most consistent, and most empirically-
based, support for the Neural Advance Model of modern human origins.
In this chapter I will argue that these differences, when viewed in the light of
sample size and in a framework of foraging theory, are better explained as dietary
expansion and the climatic shift at the Pleistocene – Holocene transition. No
reference to changes in hunting ability or intellect is necessary, and the use of
these comparisons as evidence for non-modern behavior in Middle Stone Age
peoples is dismissed. I will provide a hypothesis and some possible models that
have the potential to explain those traits without reference to a major change in
human intellect.
The Klein Argument
Richard Klein’s “Neural Advance Model” (a variant of the Later Upper
Pleistocene model) is perhaps the most explicit and detailed statement on the
modernity of MSA hominid behavior (Klein 1995, 1999). This model argues that
OIS 4 and earlier MSA hominids may have been anatomically modern, but lacked
modern intellectual capacity and behavior. He argues that MSA people lacked a
variety of key behavioral “markers” and thus were not behaviorally modern. The
50model suggests that around 40,000-50,000 BP a neural advance occurred as the
result of a genetic mutation, to date unrecognizable in skull anatomy, which
propelled hominids into a modern intellect. This change in intellectual ability is
often coupled theoretically with the attainment of modern linguistic ability.
Again, no physical evidence for a change in language exists in the archaeological
record for this period of time. The Neural Advance Model has gained widespread
acknowledgement largely on the basis of Klein’s Human Career (1999),
considered by most as the text on human origins and paleoanthropology and his
many repeated statements of this model in numerous publications (Klein 1972,
1974, 1975, 1976, 1979, 1980, 1992, 1994, 1995, 2000, Klein et al. 2004). This
model, often invoked as explanatory, is widely repeated in other archaeological
texts as well (see for example Dillehay 2000) or human evolution texts “…the
cultural Great Leap Forward that occurred about 50,000 years ago and during
which our modern natures first appeared…” (Ehrlich 2000:164).
The Neural Advance Model has stimulated debate, focusing on the empirical
record for the timing and presence of the purported traits of modernity. Recently,
McBrearty and Brooks (2000) have argued in a comprehensive review that, in
Africa, there is no evidence for a behavioral revolution at 40-50,000 years BP and
the expectations for such a revolution are at least partially in the Eurocentric roots
of early Upper Pleistocene archaeology. The approach I take in this chapter is
slightly different – I will not focus on the empirical record of dates and
51appearances of traits, but rather the interpretations offered for the meaning of that
record, with a focus on the archaeofaunal record of the southern Cape region of
South Africa.
The Faunal Pattern
Over the last 30 years Richard Klein has studied a wide range of faunal
assemblages from South Africa, both archaeological and paleontological. He has
constructed an imposing composite record of faunal patterning that samples both
MSA and LSA sites. Klein has identified several interesting patterns in the fauna,
and these figure prominently as support for his Neural Advance model.
Buffalo and Eland Mortality
Klein (1999) has argued that MSA sites tend to have greater numbers of eland
(Taurotragus oryx) relative to cape buffalo (Syncerus caffer) and bushpig
(Potamochcerus porcus), while LSA sites from similar environmental regimes
and topographic settings have greater numbers of buffalo and bushpig relative to
eland (Figure 3.1). Klein notes that eland tend to be rare in the wild, while
buffalo and bushpig are more common, and thus the MSA pattern differs from
what one would expect if people were hunting animals based solely on their rate
of encounter. Mortality patterns show that most of the buffalo at MSA sites are
juveniles while eland show an abundance of prime-age adults (Figure 3.1). The

52catastrophic mortality profile for eland has been explained by the ease with which
entire herds can be driven by people. Klein argues that eland are less dangerous
than buffalo and bushpig, concluding that MSA people were forced to focus on
the less dangerous but less abundant eland due to an inability to regularly kill the
fierce buffalo and bushpig. MSA people occasionally managed to kill buffalo, but
they tended to kill juveniles and very aged individuals (Figure 3.1).
Hunting Effectiveness
Klein has identified other faunal patterns that he has linked to the Neural Advance
Model. He has argued that LSA people were more effective hunters than MSA
people:
Comparing layers at Nelson Bay formed during the Holocene to
ones that appear to have formed during broadly similar portions of
the Last Interglacial at Klasies, the Nelson Bay deposits are
significantly richer in remains of pigs and poorer in remains of
eland...the writer has suggested that the higher frequency of wild
pig...reflects the enhanced ability of LSA people to deal with prey
that are likely to mount an effective counter-attack on the
hunter...the writer has further suggested that even when MSA
people hunted basically the same species as their LSA successors,
they were less effective, that is, they took a smaller proportion of
the available animals. [Klein 1980:262-3]
53 This concept of foraging effectiveness and its link to faunal patterning as a
defining trait of the modern LSA hunter has roots in Klein’s earliest writings on
the prehistory of southern Africa:
The fact that the MSA inhabitants of Klasies River Mouth utilized
marine resources less intensively and probably less effectively than
later Albany and Wilton peoples…raises the possibility that the
replacement of the Middle Stone Age was in fact comparable in
meaning and importance to the like-aged replacement of the
Mousterian in Europe. [Klein 1974:277-278]
This has been repeated in more recent articles as well:
The enlarged DK1 (Die Kelders) faunal sample augments evidence
from KRM that MSA people hunted and gathered less effectively
than their LSA successors...[Klein and Cruz-Uribe 1996:331]
And, most recently and clearly:
One important way that LSA people differed from their
predecessors was in their ability to hunt and gather more
effectively. This alone could explain how they (or their Upper
Paleolithic descendants) managed to spread so quickly and
widely…it was the evolution of modern behavior between 50,000
and 40,000 years ago that allowed anatomically modern people to
spread from Africa. [Klein and Edgar 2002:239-240]
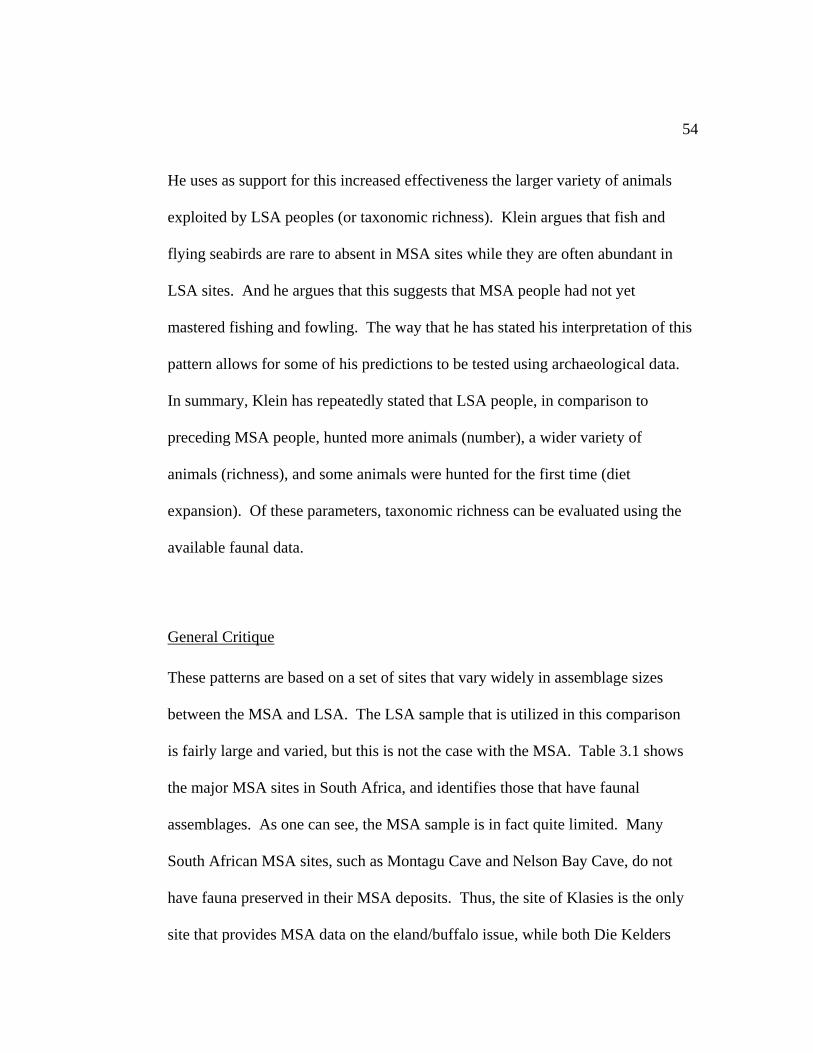
54
He uses as support for this increased effectiveness the larger variety of animals
exploited by LSA peoples (or taxonomic richness). Klein argues that fish and
flying seabirds are rare to absent in MSA sites while they are often abundant in
LSA sites. And he argues that this suggests that MSA people had not yet
mastered fishing and fowling. The way that he has stated his interpretation of this
pattern allows for some of his predictions to be tested using archaeological data.
In summary, Klein has repeatedly stated that LSA people, in comparison to
preceding MSA people, hunted more animals (number), a wider variety of
animals (richness), and some animals were hunted for the first time (diet
expansion). Of these parameters, taxonomic richness can be evaluated using the
available faunal data.
General Critique
These patterns are based on a set of sites that vary widely in assemblage sizes
between the MSA and LSA. The LSA sample that is utilized in this comparison
is fairly large and varied, but this is not the case with the MSA. Table 3.1 shows
the major MSA sites in South Africa, and identifies those that have faunal
assemblages. As one can see, the MSA sample is in fact quite limited. Many
South African MSA sites, such as Montagu Cave and Nelson Bay Cave, do not
have fauna preserved in their MSA deposits. Thus, the site of Klasies is the only
site that provides MSA data on the eland/buffalo issue, while both Die Kelders

55and Klasies are relevant to the issue of changes in numbers of species across the
MSA/LSA boundary.
In addition, considering the MSA and LSA as a dichotomy, rather than as a long
sequence, structures the data in ways that emphasize abrupt changes instead of
gradual change. This is especially true for the periods of time and region under
consideration here. For example, the MSA could be subdivided into three or four
periods that would roughly correspond to the duration of the entire LSA. Perhaps
even more of a concern is that a substantial gap, of perhaps 20,000 years or more,
exists between the MSA and LSA datasets used in formulating the patterns to be
explained. This would tend to emphasize further the differences between the two
periods, even if the transition had actually been quite gradual in nature. In
addressing the taxonomic richness of the faunal assemblages below each
excavation unit is considered separately, reducing the dichotomous nature of the
comparison.
Sample Size Critique
As noted earlier, Klein has argued that LSA assemblages (among other
differences) are taxonomically richer than MSA assemblages. As has been shown
by Grayson (1984, 1989) and others (Cannon 2001), in all faunal assemblages
there is a relationship between the size of that assemblage and the number of taxa
represented. A useful way to compare richness between assemblages of different

56size is to calculate a regression equation of sample size versus number of taxa for
each occupation within a given environmental regime. Changes in slope will
represent differing rates at which new taxa are added to the assemblage as sample
size increases. A steep slope represents a rapid rate and assemblages in that
regression grouping will be richer than those with a more gradual slope but of the
same size. Thus our expectation is that LSA assemblages will display a steeper
slope than MSA assemblages, if LSA assemblages are richer.
Using Klein’s (Klein & Cruz-Uribe 1996) published data on assemblage size for
each excavated level at Die Kelders I calculated the regression shown here
(Figure 3.2). The strong correlation (r2=.8831, p<.001) between sample size and
number of taxa for all of the MSA units suggests a close relationship between the
number of specimens and the number of taxa present in all of the assemblages..
While the single LSA level at DK1 does show a high degree of richness (the
actual number of taxa present), the sample size is also quite large. The regression
fit for the MSA passes through the LSA data point – if the LSA was richer, we
would expect it to be well above the range of the MSA regression. At Die
Kelders there is no statistical difference in faunal richness between the MSA and
LSA when sample size is accounted for.
Figure 3.3 shows a similar analysis using the MSA levels at Klasies (KRM) and
the LSA levels at Nelson Bay Cave (NBC), the two sites cited most frequently by

57Klein in elucidating the faunal patterning and the dichotomy he has selected in
describing it. As in the earlier analysis the relationship between the sample size
and richness is robust (r2=.5354, p<.0001 for the LSA and r2=.8678, p<.0001 for
the MSA). Surprisingly, the slope for the MSA is greater than that for the LSA,
suggesting that the MSA faunas are in fact richer than the LSA faunas, when
sample size is accounted for. This is exactly opposite of what is to be expected if
Klein’s argument of LSA peoples exploiting a wider variety of animals with ease
(hunting effectiveness) is correct.
The LSA data seem to cluster. Using the principles of exploratory data analysis,
as espoused by Tukey (1977), these clusters are then investigated to see if they
have a temporal component. If we subdivide the LSA sample into pre 10,000 BP
and post 10,000 BP, then it becomes apparent that Pleistocene LSA and MSA
both have greater slopes and the angles of these are more similar than that for the
Holocene LSA (Figure 3.4, r2=.5892, p<.0001 for the Holocene LSA, r2=.9420,
p<.0001 for the Pleistocene LSA, and r2=.8305, p<.0001 for the MSA). Thus, the
only observable change in assemblage richness occurs not at the MSA-LSA
transition, as the Neural Advance Model would suggest, but rather at the
Pleistocene-Holocene transition well into the LSA, at least 30,000 years later than
anybody would argue that behaviorally modern peoples first populated southern
Africa. This suggests that on the grossest scale the faunal data do not support a
reordered hunting ability at 40-50,000 BP. And it is reasonable to posit that the

58gross change in the nature of Holocene assemblages is the result of climate-
induced reordering of the local fauna, not a reordering of human intellect.
Whether there is a similar pattern-shift for the OIS 5/6 transition can not be
currently addressed due to lack of data. Interestingly, Klein himself (1974, 1976)
noted that the shift in prey species in the Nelson Bay Cave LSA assemblage was
climatically-induced and coincided with the onset of the Holocene.
Reinforcing this climate-based, rather than behavioral interpretation is the recent
work of Grayson and Delpech (1998) in southwestern France. Species richness in
archaeofaunal assemblages follows sample size along climatic regimes, rather
than as a behavioral difference between the accumulators, even between Homo
sapiens and Homo neanderthalensis. In fact, using species abundance measures,
one cannot distinguish between Cro Magnon and Neandertal accumulated faunal
assemblages. This does not bode well for this parameter’s usefulness in
distinguishing between the foraging abilities of two anatomically modern
populations.
Behavioral Ecological Modeling
Thus, with the limited MSA samples, there is no measurable quantitative
difference in species richness between MSA and LSA assemblages in South
Africa, or that the differences are opposite of what would be expected if later
people were more effective hunters. However, there is still the pattern of change
59at Klasies in the representation of eland relative to buffalo and bushpig. How
then to explain this pattern? Behavioral ecology provides a theoretical frame-
work and a set of models that can be applied to archaeological data that I believe
can account for many of the differences in assemblage character without invoking
changes in cognitive ability or hunting effectiveness.
Behavioral ecology has developed a series of models to explain and examine
animal behaviors (Stephens and Krebs 1986, Kaplan and Hill 1992). A subset of
these models examines the decision-making rules governing foraging. Foraging
theory models have been successfully applied to modern hunter-gatherers (Smith
1991, Winterhalder 1981, O'Connell and Hawkes 1981, O’Connell, et al. 1988,
1990, Bird and Bliege-Bird 1997, 2000) and to the faunal (Grayson and Cannon
1999, Grayson and Delpech 1998), botanical (Gremillion 1997, Gardner 1997,
Winterhalder and Goland 1997), and, less frequently, the lithic (Kuhn 1995)
portions of the archaeological record. These models are robust enough for
application to archaeological data because they make qualitative or directional
predictions that can be observed in the record. A commonly used model for
edible resources is the diet breadth model (or fine-grained prey choice model),
derived from the marginal value theorem (see Winterhalder and Goland 1997 for
a discussion of the assumptions of this model). This model uses a common
currency (often calories) to rank the values of the suite of foods available.
Ideally, plants and animals would be considered together. Unfortunately

60archaeological data do not always support this ideal and one or the other is often
considered alone, as is done here.
Faunal resources are often thought of as representing the protein/fat part of the
diet and size is taken as a proxy for value. This holds until resources get very
large and diminishing returns in handling costs reduce the mean return of that
resource (Smith 1991, Broughton 1994a, 1994b). All available prey are then
ranked based on the value of that prey in a given currency. The model assumes
that highly ranked prey are always taken on encounter. Prey species continue to
be added to the diet in descending rank-order until the addition of further prey
species begins to reduce the overall mean return rates for the diet. Thus, and
somewhat counter-intuitively, low-ranking prey will never be added to the diet
even if they are abundant on the landscape unless that ranking is somehow
changed or diet is expanded. Low ranking can be the result of potentially
dangerous prey being avoided, as I argue for buffalo and bushpig later. The diet
breadth is the set of taxa that will be taken in a given set of conditions, including
available technology and season.
Diet breadth, as a framework for conceptualizing the record, then actually
provides different expectations of how prey species are utilized. For example,
sheer abundance on the landscape is not important in ranking resources. Thus,
Klein’s note that cape buffalo and bushpig are more abundant on the landscape

61than eland, and so should be consumed more frequently is not an interpretation
that the diet breadth model inherently supports. This model also divides the
universe of prey along lines that are often, but not always, taxonomic. For
instance gravid females, adult males, and newborns of the same species could all
represent different classes of prey. Conversely, several species of similar size and
habit could be considered a single prey class. Actualistic studies often can
provide refinements to classifications, but many times we must begin with gross
generalizations and see what patterns are predicted, and how they relate to
available data, and species is often used as a proxy for prey class, as it is here (see
Grayson and Delpech 1998 for a more detailed discussion).
A set of inferences drawn from the diet breadth model, the resource depletion or
depression model, is designed to make predictions about changes in prey ranking
due to predation pressures on that prey (Broughton 1994a, 1994b, Nagaoka 2002,
2005). The resource depletion model applies in instances where a prey species is
harvested at a higher rate than can be sustained by reproductive rates or when
mobile prey flee the threat of human predation. Jack Broughton (1994a, 1994b)
has developed this concept in California for archaeofaunal assemblages and the
specific predictions for the changes in prey size, age, and mortality profiles used
here follow from that research.
Diet Expansion Hypothesis
The main alternative hypothesis presented here is that the patterning observed in

62the archaeofaunas of MSA and LSA southern Africa, when viewed in a diet
breadth framework, is entirely explainable as an expansion of diet (as proposed by
Deacon 1989, outside of the theoretical framework applied here). Figure 3.5
shows the main South African terrestrial prey ranked by body size. Any
expansion of diet breadth to lower return species is often referred to as
intensification, as the predator is now working harder for the same return. In
reality, and particularly in Africa, the relation between body size and post-
encounter return rate is somewhat more complicated due to the diversity of
predator avoidance tactics. There are species of similar size, such as eland and
buffalo that have very different predator avoidance tactics. In this case buffalo
fights, and eland flees. Thus with buffalo, and bushpig as well, the potential risk
(in both the senses, uncertainty and physical danger) adds a great deal of cost to
that prey item, lowering its overall ranking. Diet breadth models can account for
different classes of behavior by prey by considering each behavioral class
separately or by adjusting their relative rank. Since the type of risk is catastrophic
(severe injury or death) it may be reasonable to place them below all non-
dangerous prey types, as they are in this re-ranking (Figure 3.6).
The diet breadth model makes several important predictions that are relevant here.
Lower ranked prey should not be added to the diet unless the returns from higher
ranked prey begin to fall. Thus, the addition of fish, birds, buffalo, and bushpig in
the LSA could have occurred simply as a result of diminishing returns from

63higher-ranked prey, like eland. Diminishing returns generally result from
increasing search costs and/or lowered encounter rates. Thus, the diet breadth
interpretation of the patterns Klein has recognized is that the change from MSA to
LSA represents an expansion of diet breadth, an intensification of labor and
concomitant reduction in foraging efficiency.
Resource Depletion Model
A variation of the alternative hypothesis is that the changes reflected in the South
African faunal assemblages are the result of resource depletion caused by human
predation. This model argues that as a result of over-hunting, increased human
population densities, or a combination of both the numbers of large, highly-
ranked prey animals were greatly reduced resulting in an increased reliance on
lower-ranked prey and the addition of previously avoided prey species to the diet.
This model makes several predictions (from Broughton 1994a, 1994b):
1) highly-ranked resources will account for a higher proportion of the mammalian
faunal assemblage during the MSA than during the LSA;
2) the MSA-LSA transition should be gradual, with reductions of highly-ranked
resources beginning during the MSA;
3) as exploitation intensifies the size and ages of individuals within taxa will also
be reduced; and
4) as highly-ranked prey are depleted, difficult to capture prey with lower return
rates will enter the faunal record for the first time.

64
Each of these predictions is potentially observable in the archaeological record.
Figure 3.7 shows the Die Kelders bovids classified into size groups and arranged
by layer, for the largest assemblages. These are fragmentary remains that could
not be assigned to a taxon. Fortunately, the models being applied here use size as
a proxy for value and this information is quite useful. The data show a clear trend
for a reduction in proportional representation of large animals over time. The data
on shellfish and tortoise predation for the MSA and LSA from the Cape are also
consistent with this model.
Figure 3.8 compares limpet (Patella) shell size between the LSA layers at
Paternoster and Elands Bay, bars in gray, relative to several MSA sites, with bars
in black. The limpets from the LSA sites are significantly smaller. Modern
samples from the same region are larger than either the LSA or MSA samples. A
similar pattern was found at Klasies River Mouth, where it was found that MSA
Turbo samarticus and Perna perna were both larger in the MSA than in the LSA.
Bird and Bliege-Bird (1997, 2000) have shown in ethnographic contexts that
shellfish offer a near ideal demonstration of depletion in that they are frequently
considered low-ranked as a class, size and age can correlate closely, and size can
easily be selected during capture. Thus, limited reliance on shellfish will result in
large individuals in the diet whereas intensification of shellfish resources will
result in increasingly smaller individuals (and diminished returns) in the diet.

65 Environmental Change
An expansion of diet could also result from changes in the local environment,
with no necessary changes in human behavior, as was evident in the richness
analyses of the Pleistocene-Holocene transition. The prey populations in a
reordered biota would still only be expected to exhibit depressed mortality
profiles when under predation pressure, thus the size changes evident in prey
species during the South African Stone Age are not adequately explained by
environmental change alone.
Environmental change can, however, be invoked in explanation of the changes in
species representation in the faunal assemblages. Klein is explicit in stating that
the local settings are the same for the LSA and MSA, and this assumption is
required for direct comparisons of the type that he has made to be meaningful. As
I have demonstrated most of the patterning that he has observed is in fact a
comparison of Holocene and Upper Pleistocene fauna. In the settings of the sites
where the assemblages were accumulated, Klasies and Nelson Bay Cave, local
settings would be greatly influenced by changes in sea level and the concomitant
expansion and retraction of currently submerged coastal plains. During times of
lowered sea levels (nearly all of the period of MSA occupation) a coastal grassy
plain of up to 15 km width would have been situated adjacent to the sites. During
times of modern sea levels (nearly all of the period of LSA occupation) these
plains would have been submerged and the near shore environment dominated by
66brushy shrubs. Eland are more abundant in open settings and buffalo and bushpig
are more abundant in brushy settings. As discussed at the beginning of this
chapter Klein’s analysis is dependent on prey abundances remaining constant for
these two species through time. This makes Klein’s assumptions about
abundances doubly problematic.
Discussion and Conclusions
The hypothesis proposed here (diet expansion) requires that foraging returns were
gradually decreasing across the MSA and LSA boundaries, and that people
intensified their foraging strategies in response. As discussed above, the evidence
to date suggests that MSA people harvested small-bodied prey less intensively
than LSA people, and this is consistent with changes in prey ranking.
To summarize, no statistical evidence for a change in species richness across the
MSA-LSA boundary was found. A hypothesis was proposed (diet expansion),
and the diet breadth and resource depletion models applied, as an alternative to
the Neural Advance Model for changes in faunal patterning across the MSA-LSA
boundary. The behavioral ecological and demographic models proposed here are
compelling for several reasons.
First, they do not demand an appeal to a neural advance that, so far, is untestable
in the fossil record. Along these same lines, it is important to note that similar

67changes in faunal representation are seen elsewhere in the world during periods
when modern people are undoubtedly present, and neural advances are not
advocated for these changes (Broughton 1994a, 1994b, Stiner et al. 1999,
Nagaoka 2002, 2005).
Second, these models are more consistent with the slow and incremental addition
of fishing and fowling in the record. Had fowling and fishing been constrained
solely by a lack of technological ability, the removal of that constraint should
appear to be abrupt. The evidence for very sophisticated technology in the MSA
has increased greatly in the past few years (Brooks et al. 1995, Yellen et al. 1995,
Henshilwood and Sealy 1997, Henshilwood et al. 1999, d’Errico et al. 2001,
Soressi and Henshilwood 2004). Again, any appearance of abruptness in change
in archaeofauna of the Cape is likely greatly magnified, if not solely the product
of, the current 20,000 year gap in the archaeological data.
Third, these models are more consistent with the increasing use through time of
labor intensive tools made on bone, ground stone, and composite tools and
beginning well before the proposed 50,000 year old boundary. Manufacturing
these tools would increase handling costs across the board, something that would
only be expected during periods of intensification. Climatic change was
especially abrupt along the Cape Coast at about the same time as the Howiesons

68Poort sub-stage at the onset of OIS 4 (Table 1.1). This period of time is marked
by the earliest clearly composite tools in the archaeological record.
Fourth, the behavioral ecological models applied to the problem of MSA faunal
resource used here are grounded in ecological theory. As such they are not
uniquely human-oriented and are based on a vast body of direct observations.
Conversely, interpretations that rely on some uniquely modern thought process
development that was not, and cannot be, directly observed will always require
some leap of faith or special pleading. Obviously, at some point (or several
points) in human history cognitive developments gave our ancestors adaptive
advantages over other animals on the African landscape. Invoking a major
cognitive development makes little sense when the archaeological evidence
suggests gradual technological developments that are poorly matched to the
proposed time-frame and completely unmatched to the biological evidence. It is
increasingly clear that the MSA is much more technologically and behaviorally
diverse than previously thought. Only in the context of trying to match the
technology of the MSA to the Middle Paleolithic of Europe, is a global cognitive
development at 50,000 BP required.
And fifth, these models can be investigated and falsified by existing or
foreseeable archaeological data. It is possible that the predictions of the models
applied here may be investigated in the future, using more refined and

69sophisticated ecological data (for example, a climate and species specific study of
the shellfish data, taking into account changing beaches and offshore currents)
and found to represent something besides predatory pressure. In contrast, the
Neural Advance Model is increasingly at odds with new archaeological
discoveries and its predictions are not even met with the data used to develop it.
If behavioral ecological models explain the patterns of faunal exploitation in the
South African Stone Age, then the "markers" of modern human behavior selected
by Klein and others are actually the result of a continuation of existing (and
modern) behaviors and patterns in increasingly depleted or restricted
environments. Indeed, continuing to invoke faunal assemblages as the basis for
interpreting technological (and underlying cognitive) ability strains credulity
when archaeological assemblages that speak directly to these issues suggest much
deeper time-depth for sophisticated technological and symbolic behaviors. When
sample size and global climate are accounted for, there is no support, in the
relevant archaeofauna, for a reordering of human cognition in the time range
required by Klein’s Neural Advance/Hunting Effectiveness variant of the Later
Upper Pleistocene model.
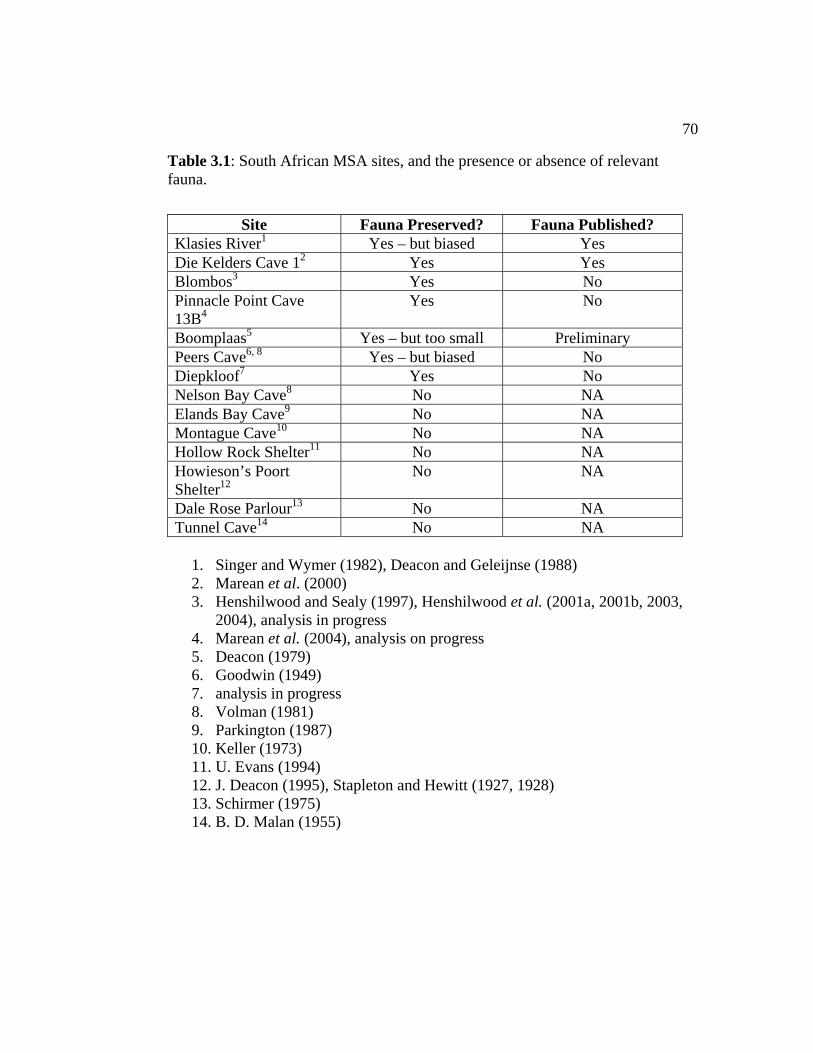
70
Table 3.1: South African MSA sites, and the presence or absence of relevant fauna.
Site Fauna Preserved? Fauna Published?
Klasies River1 Yes – but biased Yes Die Kelders Cave 12 Yes Yes Blombos3 Yes No Pinnacle Point Cave 13B4
Yes No
Boomplaas5 Yes – but too small Preliminary Peers Cave6, 8 Yes – but biased No Diepkloof7 Yes No Nelson Bay Cave8 No NA Elands Bay Cave9 No NA Montague Cave10 No NA Hollow Rock Shelter11 No NA Howieson’s Poort Shelter12
No NA
Dale Rose Parlour13 No NA Tunnel Cave14 No NA
1. Singer and Wymer (1982), Deacon and Geleijnse (1988) 2. Marean et al. (2000) 3. Henshilwood and Sealy (1997), Henshilwood et al. (2001a, 2001b, 2003,
2004), analysis in progress 4. Marean et al. (2004), analysis on progress 5. Deacon (1979) 6. Goodwin (1949) 7. analysis in progress 8. Volman (1981) 9. Parkington (1987) 10. Keller (1973) 11. U. Evans (1994) 12. J. Deacon (1995), Stapleton and Hewitt (1927, 1928) 13. Schirmer (1975) 14. B. D. Malan (1955)

71
80 3
38
29
6 39LSA-Nelson Bay Cave
MSA-Klasies River
10 20 30 40 50 60 70 80 90100% of Lifespan
05
101520253035
Num
ber o
f Ind
ivid
uals
10 20 30 40 50 60 70 80 90100% of Lifespan
0
5
10
15
20
Num
ber o
f Ind
ivid
uals
Eland Buffalo
% of Lifespan % of LifespanN
of I
ndiv
idua
ls
N o
f Ind
ivid
uals
0 50 100 0 50 100
20
1020
10
30
Figure 3.1: Relative abundances and mortality profiles of cape buffalo, bushpig, and eland from Cape MSA and LSA sites.
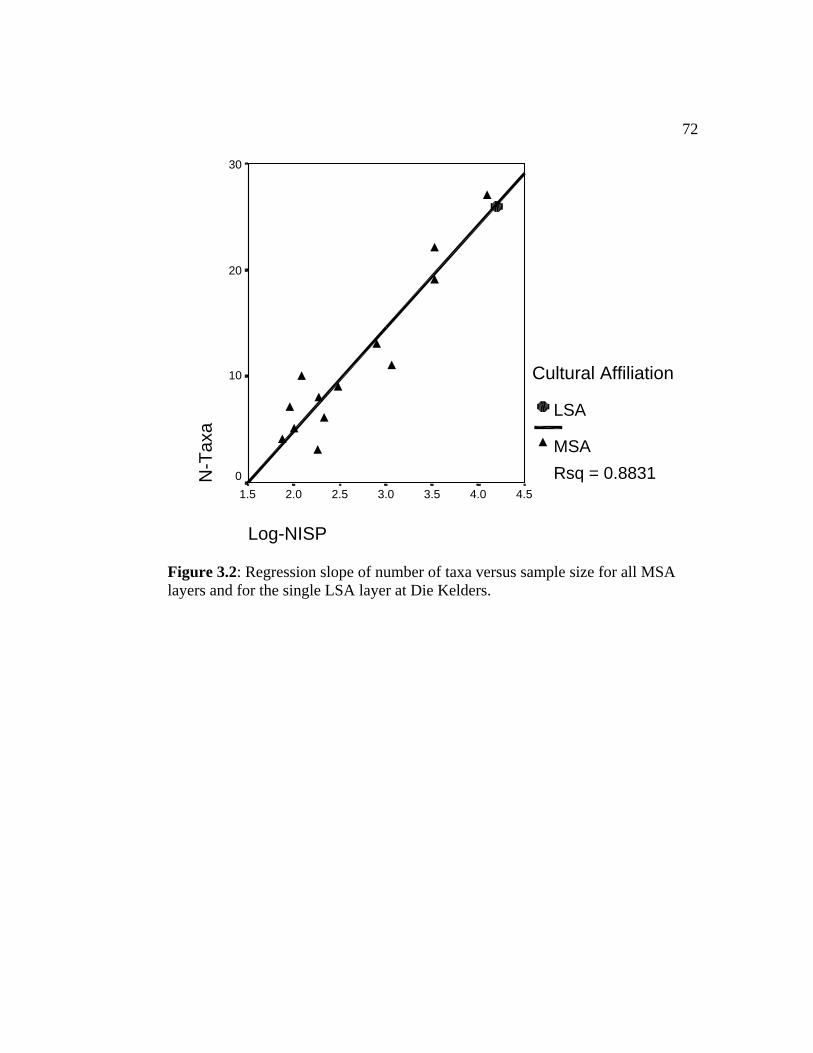
72
Log-NISP
4.54.03.53.02.52.01.5
N-T
axa
30
20
10
0
Cultural Affiliation
LSA
MSARsq = 0.8831
Figure 3.2: Regression slope of number of taxa versus sample size for all MSA layers and for the single LSA layer at Die Kelders.
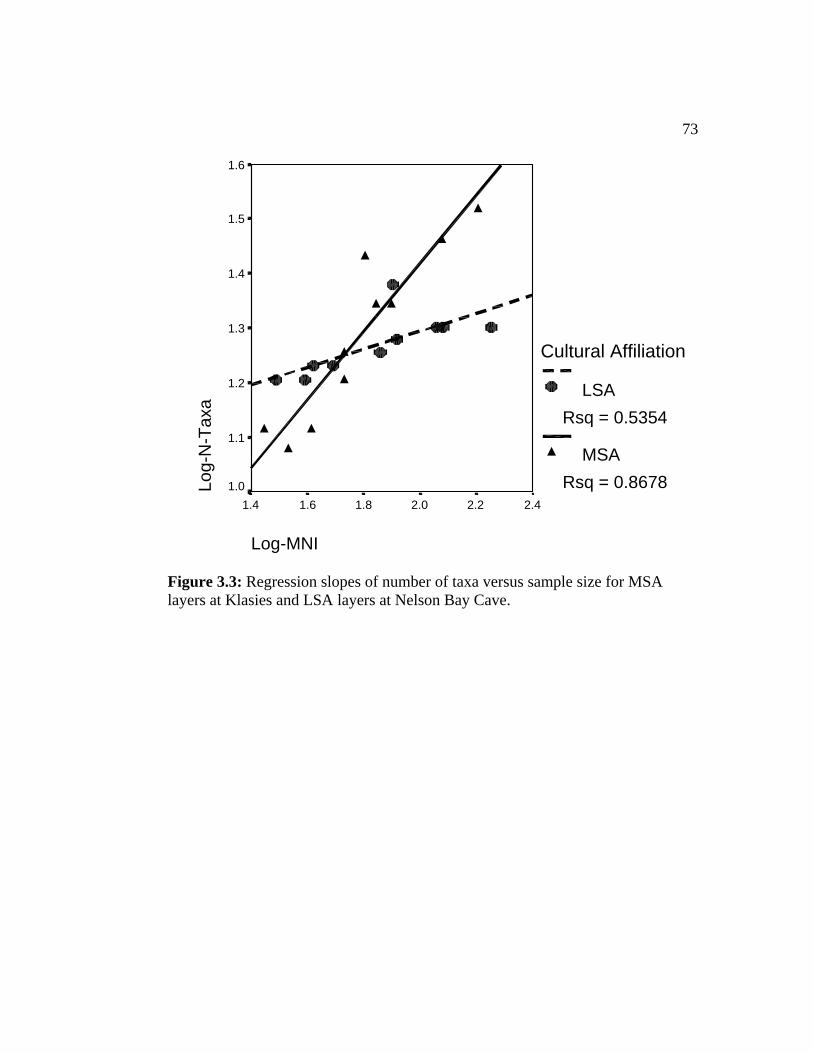
73
Log-MNI
2.42.22.01.81.61.4
Log-
N-T
axa
1.6
1.5
1.4
1.3
1.2
1.1
1.0
Cultural Affiliation
LSARsq = 0.5354
MSARsq = 0.8678
Figure 3.3: Regression slopes of number of taxa versus sample size for MSA layers at Klasies and LSA layers at Nelson Bay Cave.

74
Figure 3.4: Regression slopes for number of taxa versus sample size as in Figure 2.4. The LSA layers have been subdivided into Pleistocene-aged and Holocene-aged LSA.
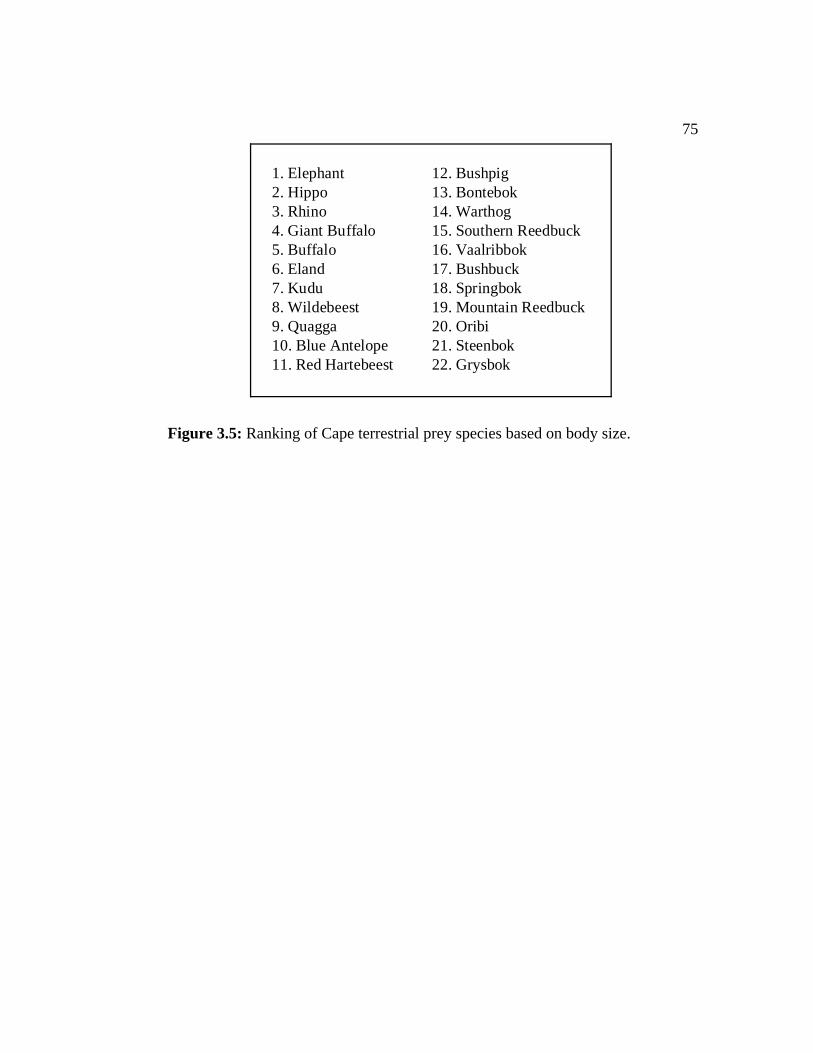
75
1. Elephant2. Hippo3. Rhino4. Giant Buffalo5. Buffalo 6. Eland7. Kudu8. Wildebeest9. Quagga10. Blue Antelope11. Red Hartebeest
12. Bushpig13. Bontebok14. Warthog15. Southern Reedbuck16. Vaalribbok17. Bushbuck18. Springbok19. Mountain Reedbuck20. Oribi21. Steenbok22. Grysbok
Figure 3.5: Ranking of Cape terrestrial prey species based on body size.

76
1. Eland2. Kudu3. Wildebeest
13. Mountain Reedbuck14. O
4. Quagga5. Blue Antelope6. Red Hartebeest7. Bontebok8. Warthog9. Southern Reedbuck10. Vaalribbok11. Bushbuck
12. Springbok
ribi15. Steenbok16. Grysbok17. Elephant18. Hippo19. Rhino20. Giant Buffalo21. Buffalo22. Bushpig
Figure 3.6: Re-ranking of Cape terrestrial prey species with dangerous species moved to the bottom of the ranking (italics).

77
Larg
e B
ovid
s
Med
ium
-Lar
ge B
ovid
s
Sm
all-M
ediu
m B
ovid
s
Sm
all B
ovid
s
15
10
4
1 (LSA)
0102030405060708090
Bovid Size Classes at Die Kelders
Figure 3.7: Change in relative abundance in bovid size classes through time at Die Kelders (data from Klein and Cruz-Uribe 1996).

78
Figure 3.8: Change in size for limpets (Patella patella) through time at Paternoster Cave and Elands Bay (after Grine et al. 1991).
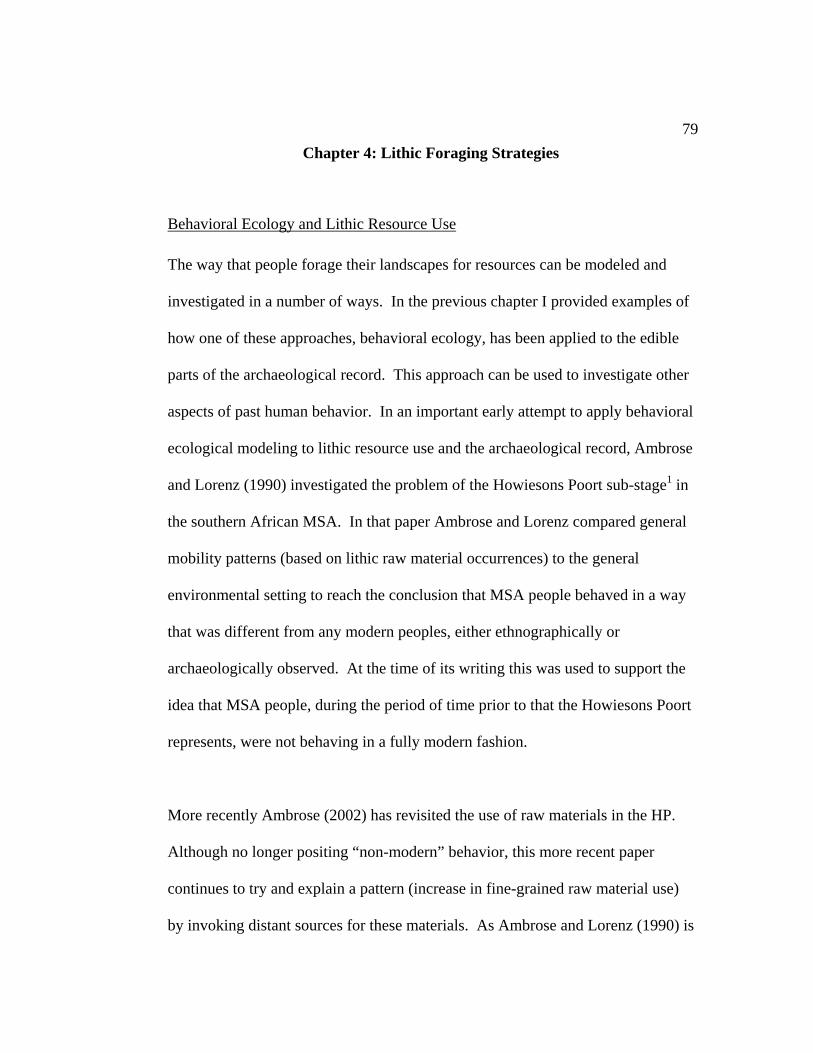
79Chapter 4: Lithic Foraging Strategies
Behavioral Ecology and Lithic Resource Use
The way that people forage their landscapes for resources can be modeled and
investigated in a number of ways. In the previous chapter I provided examples of
how one of these approaches, behavioral ecology, has been applied to the edible
parts of the archaeological record. This approach can be used to investigate other
aspects of past human behavior. In an important early attempt to apply behavioral
ecological modeling to lithic resource use and the archaeological record, Ambrose
and Lorenz (1990) investigated the problem of the Howiesons Poort sub-stage1 in
the southern African MSA. In that paper Ambrose and Lorenz compared general
mobility patterns (based on lithic raw material occurrences) to the general
environmental setting to reach the conclusion that MSA people behaved in a way
that was different from any modern peoples, either ethnographically or
archaeologically observed. At the time of its writing this was used to support the
idea that MSA people, during the period of time prior to that the Howiesons Poort
represents, were not behaving in a fully modern fashion.
More recently Ambrose (2002) has revisited the use of raw materials in the HP.
Although no longer positing “non-modern” behavior, this more recent paper
continues to try and explain a pattern (increase in fine-grained raw material use)
by invoking distant sources for these materials. As Ambrose and Lorenz (1990) is

80one of only two explicit published models (for the other see Deacon and Deacon
1999, Deacon and Wurz 1996, Wurz 1997, 1999, 2000) that attempts to explain
the Howiesons Poort pattern, one of its basic underlying premises is examined
further here.
The assertion that MSA peoples at the onset of the Howiesons Poort were not
behaving in ways analogous to modern peoples has special importance in the
debate over modern human origins. Several models have been proposed for the
timing and nature of this event (Henshilwood and Marean 2003, McBrearty and
Brooks 2000). In only one of these proposed models, the Later Upper Pleistocene
Model or the Neural Advance Model (Klein 1995, 2001), do modern behaviors
arise after the Howiesons Poort and Ambrose and Lorenz (1990) is one of the few
empirically based studies that supports that model.
The Howiesons Poort Sub-stage
As originally defined by Stapleton and Hewitt (1928, 1929) at the name site, the
Howieson’s Poort shelter near Grahamstown, South Africa, the Howiesons Poort
was a “lithic industry” of the MSA. J. Deacon (1995) provides a discussion of the
history of excavation at that site and numerous artifact illustrations. Thackeray
(1992) has provided an overview of Howiesons Poort occurrences and its
stratigraphic location within the MSA. She demonstrated that the Howiesons
Poort occurs within the MSA sequence and is not a transitional entity between the
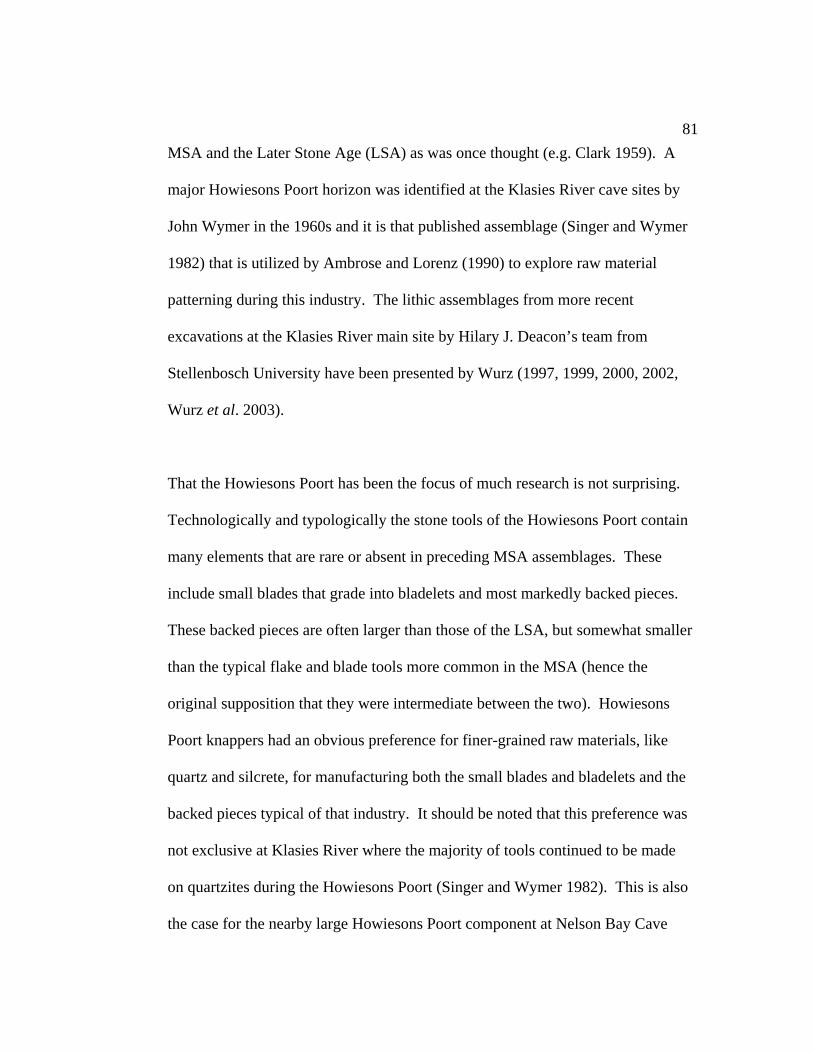
81MSA and the Later Stone Age (LSA) as was once thought (e.g. Clark 1959). A
major Howiesons Poort horizon was identified at the Klasies River cave sites by
John Wymer in the 1960s and it is that published assemblage (Singer and Wymer
1982) that is utilized by Ambrose and Lorenz (1990) to explore raw material
patterning during this industry. The lithic assemblages from more recent
excavations at the Klasies River main site by Hilary J. Deacon’s team from
Stellenbosch University have been presented by Wurz (1997, 1999, 2000, 2002,
Wurz et al. 2003).
That the Howiesons Poort has been the focus of much research is not surprising.
Technologically and typologically the stone tools of the Howiesons Poort contain
many elements that are rare or absent in preceding MSA assemblages. These
include small blades that grade into bladelets and most markedly backed pieces.
These backed pieces are often larger than those of the LSA, but somewhat smaller
than the typical flake and blade tools more common in the MSA (hence the
original supposition that they were intermediate between the two). Howiesons
Poort knappers had an obvious preference for finer-grained raw materials, like
quartz and silcrete, for manufacturing both the small blades and bladelets and the
backed pieces typical of that industry. It should be noted that this preference was
not exclusive at Klasies River where the majority of tools continued to be made
on quartzites during the Howiesons Poort (Singer and Wymer 1982). This is also
the case for the nearby large Howiesons Poort component at Nelson Bay Cave
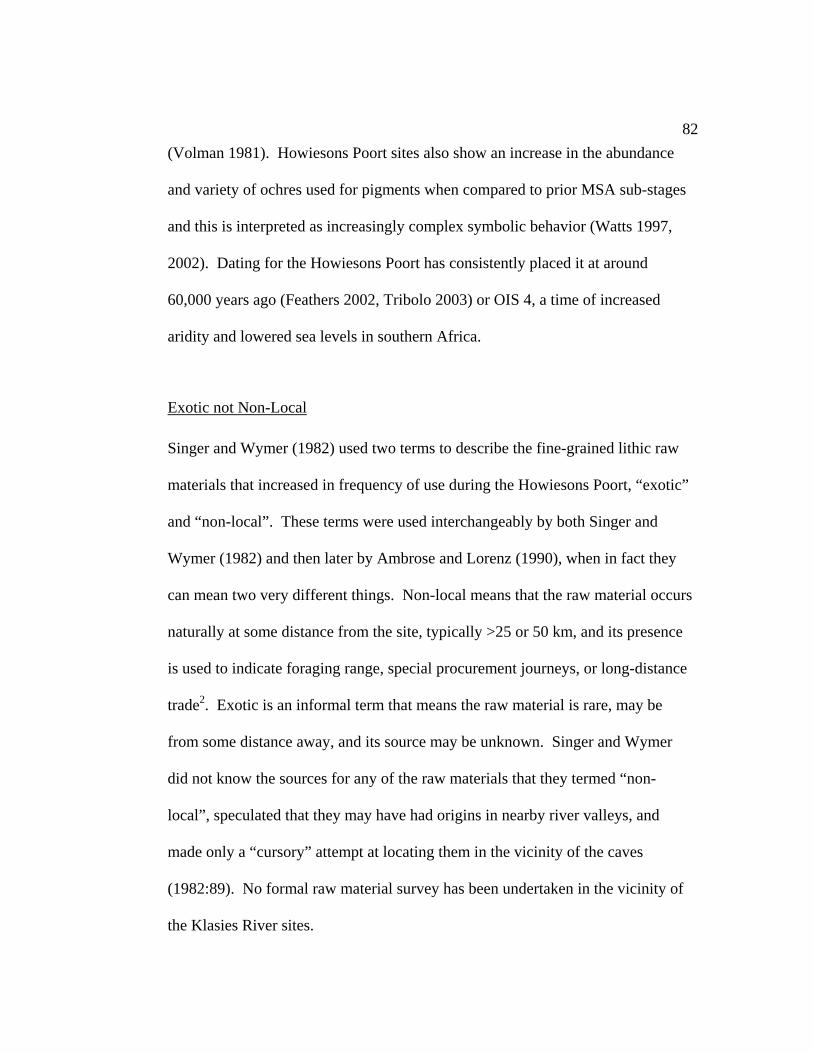
82(Volman 1981). Howiesons Poort sites also show an increase in the abundance
and variety of ochres used for pigments when compared to prior MSA sub-stages
and this is interpreted as increasingly complex symbolic behavior (Watts 1997,
2002). Dating for the Howiesons Poort has consistently placed it at around
60,000 years ago (Feathers 2002, Tribolo 2003) or OIS 4, a time of increased
aridity and lowered sea levels in southern Africa.
Exotic not Non-Local
Singer and Wymer (1982) used two terms to describe the fine-grained lithic raw
materials that increased in frequency of use during the Howiesons Poort, “exotic”
and “non-local”. These terms were used interchangeably by both Singer and
Wymer (1982) and then later by Ambrose and Lorenz (1990), when in fact they
can mean two very different things. Non-local means that the raw material occurs
naturally at some distance from the site, typically >25 or 50 km, and its presence
is used to indicate foraging range, special procurement journeys, or long-distance
trade2. Exotic is an informal term that means the raw material is rare, may be
from some distance away, and its source may be unknown. Singer and Wymer
did not know the sources for any of the raw materials that they termed “non-
local”, speculated that they may have had origins in nearby river valleys, and
made only a “cursory” attempt at locating them in the vicinity of the caves
(1982:89). No formal raw material survey has been undertaken in the vicinity of
the Klasies River sites.

83
Additionally, van Andel (1989) notes that the offshore bedrock geology in the
Klasies vicinity could contain many of the fine-grained materials used during the
MSA and these would have been exposed during lower sea stands, such as during
the Howiesons Poort, and also possibly weathered into beach cobbles (Figure
4.1). At a very similar geologic setting on the Cape coast, at Pinnacle Point near
Mossel Bay, an on-going archaeological program has begun to address these
issues (Brown n.d., Marean and Nilssen 2001, Marean et al. 2004). While still in
a very early stage a raw material survey in the vicinity of Pinnacle Point has
identified quartzite cobbles and bedrock, quartz seams and cobbles, silcrete in
primary geological context and as cobbles in streams and conglomerates, and
various cobbles of hornfels, chert, and chalcedony within a 15 km radius of the
MSA cave sites
Silcrete cores from the Howiesons Poort component at Klasies were frequently
clearly made on stream or beach cobbles (Wurz, personal communication;
personal observation of the author, Figure 4.2). Noting that the “non-local” rock
occurred in small cobble form Singer and Wymer go on to observe that “…the
knapping of the pebbles of the finer-grained rock appears to have been done
entirely on the living sites, as outer flakes of these rocks are commonly found”
(1982:90). Silcrete cores from Blombos Cave, from the Still Bay layers, another
silcrete-rich sub-stage of the MSA, are also frequently in the form of water-worn
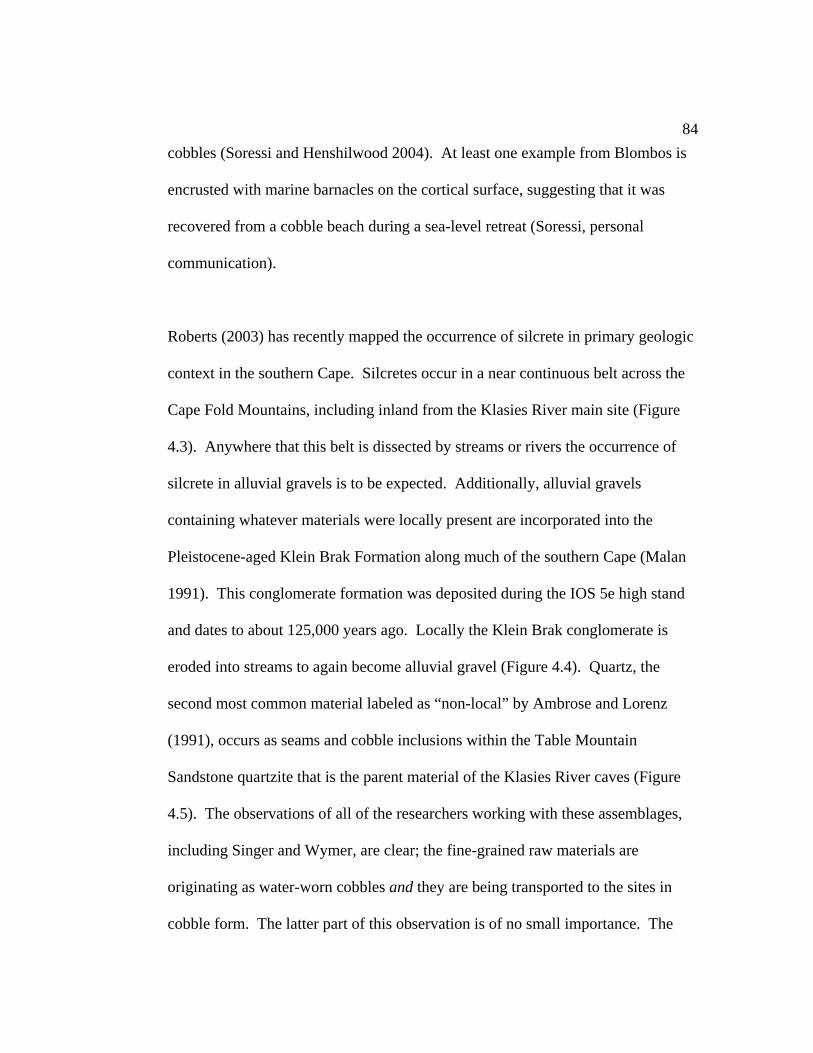
84cobbles (Soressi and Henshilwood 2004). At least one example from Blombos is
encrusted with marine barnacles on the cortical surface, suggesting that it was
recovered from a cobble beach during a sea-level retreat (Soressi, personal
communication).
Roberts (2003) has recently mapped the occurrence of silcrete in primary geologic
context in the southern Cape. Silcretes occur in a near continuous belt across the
Cape Fold Mountains, including inland from the Klasies River main site (Figure
4.3). Anywhere that this belt is dissected by streams or rivers the occurrence of
silcrete in alluvial gravels is to be expected. Additionally, alluvial gravels
containing whatever materials were locally present are incorporated into the
Pleistocene-aged Klein Brak Formation along much of the southern Cape (Malan
1991). This conglomerate formation was deposited during the IOS 5e high stand
and dates to about 125,000 years ago. Locally the Klein Brak conglomerate is
eroded into streams to again become alluvial gravel (Figure 4.4). Quartz, the
second most common material labeled as “non-local” by Ambrose and Lorenz
(1991), occurs as seams and cobble inclusions within the Table Mountain
Sandstone quartzite that is the parent material of the Klasies River caves (Figure
4.5). The observations of all of the researchers working with these assemblages,
including Singer and Wymer, are clear; the fine-grained raw materials are
originating as water-worn cobbles and they are being transported to the sites in
cobble form. The latter part of this observation is of no small importance. The

85presence of cobble cortex and primary reduction of cores suggest minimal
transport distances for these materials.
Further evidence to support the local nature of the fine-grained raw materials
comes from the variability between Howiesons Poort assemblages. As I have
noted the main local sources of fine-grained raw materials in the vicinity of
Klasies River and Nelson Bay Cave are in the form of secondary water-borne
deposits. At these sites the percentages of Howiesons Poort tools made on fine-
grained raw materials, while substantially higher than for other MSA sub-stages,
still never exceeds half. In contrast, the Howiesons Poort tools at Montagu Cave,
further west, are made almost exclusively on silcrete, which is locally abundant in
primary geological formations (Keller 1973, Volman 1981). Roberts (2003) has
mapped especially abundant and dense surface occurrences of silcrete around
Grahamstown, the location of the Howieson’s Poort shelter and the Howiesons
Poort tools from that site are similarly made almost exclusively on silcrete
(Stapleton and Hewitt 1928, 1929, J. Deacon 1995). While the early excavators
of the Howieson’s Poort shelter selected which artifacts to keep in a biased way it
is likely that any formally retouched tool was kept regardless of its raw material,
making the use of that data valid in this context.

86Resource and Technological Intensification
In order to extract more resources from the local environment, a process that
archaeologists often refer to as intensification, foragers can expend additional
energy in different ways to accomplish similar goals. It is important to note that
all forms of intensification are inherently inefficient. Extracting additional prey
from the local environment by expanding the regular diet to include increasingly
small packages is resource intensification. Another version of resource
intensification is the increasing inefficient extraction of calories from normal
prey, such as smashing and boiling the bones of an antelope, increasing handling
costs. Increasing the costs of tools in order to mitigate capture and or handling
costs I refer to as technological intensification (Minichillo 1999).
Technological intensification can involve increased costs in procuring raw
materials for tools or in their manufacture. The Howiesons Poort appears to be an
example of both, with increased cost for stone as well as for the construction of
the complex composite tools of which the small blades and backed pieces are the
preserved parts. In each case intensification can be measured in travel distance,
energy output, or time. I argue here that time is the best currency for modeling
technological intensification during the Howiesons Poort.
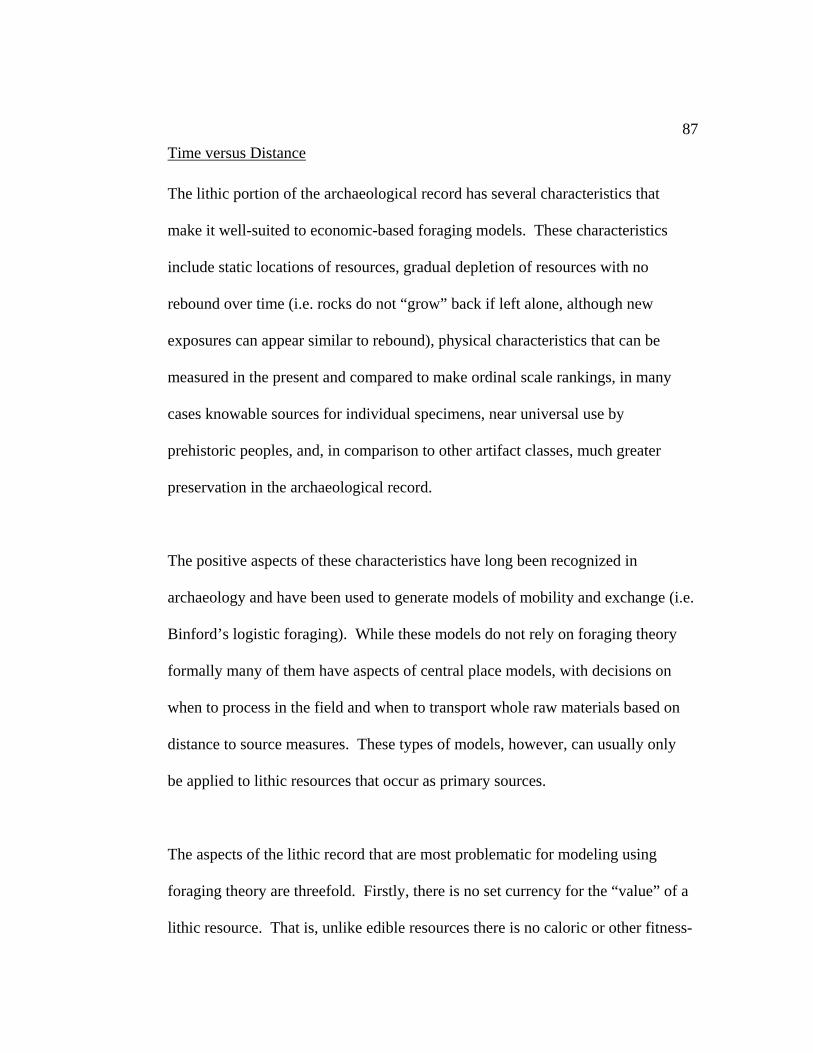
87Time versus Distance
The lithic portion of the archaeological record has several characteristics that
make it well-suited to economic-based foraging models. These characteristics
include static locations of resources, gradual depletion of resources with no
rebound over time (i.e. rocks do not “grow” back if left alone, although new
exposures can appear similar to rebound), physical characteristics that can be
measured in the present and compared to make ordinal scale rankings, in many
cases knowable sources for individual specimens, near universal use by
prehistoric peoples, and, in comparison to other artifact classes, much greater
preservation in the archaeological record.
The positive aspects of these characteristics have long been recognized in
archaeology and have been used to generate models of mobility and exchange (i.e.
Binford’s logistic foraging). While these models do not rely on foraging theory
formally many of them have aspects of central place models, with decisions on
when to process in the field and when to transport whole raw materials based on
distance to source measures. These types of models, however, can usually only
be applied to lithic resources that occur as primary sources.
The aspects of the lithic record that are most problematic for modeling using
foraging theory are threefold. Firstly, there is no set currency for the “value” of a
lithic resource. That is, unlike edible resources there is no caloric or other fitness-
88enhancing measure that can be easily approximated in most cases. For example,
the use of body size as a proxy for prey rank in faunal resources has wide
application and a sound theoretical basis. No formal proxy measure of value has
been theoretically developed for lithic resources. Secondly, and closely related to
the first point, there is little theoretical basis linking changes in lithic resource use
to changes in subsistence and ultimately fitness. An exception to this in foraging
theory is found in diet choice models, which must take into account how changes
in technology (including lithic technology) affect capture and processing rates,
but this is done largely by attempting to hold technology constant (Winterhalder
and Goland 1997). And, thirdly, the aspect of the lithic record that I will address
most directly in this paper, is the fact that the majority of the lithic record, in
many settings, is produced from locally available or secondarily deposited raw
materials. These types of materials are usually not subject to the sourcing
methods applicable to primary source materials. For example, a specific type of
chert in glacial till, while it can be accurately petrographically or chemically
characterized, may occur over several thousand square miles. What part of its
range it was collected from remains unknown. In addition, transport costs are
likely not to be significant in resource choice for locally available materials, so
central place models tell us little about what costs are involved for different
materials.
89As I have noted earlier primary lithic resources are often modeled as being travel-
time dependent (distance as currency) and have been used frequently to make
arguments for foraging range (Binford 1980), group mobility (Tankersley 1991,
Ambrose and Lorenz 1990, Kelly 1988), and long distance trade. Another type of
lithic resource distribution has a different set of characteristics that require a
different type of modeling. This type of resource often occurs as a secondary
deposit covering a wide area on a local or regional scale and is internally
heterogeneous. Secondary resources are common in many settings such as stream
and river cobbles, beach cobbles, and aggregate in glacial outwash and till. As
these deposits are secondary, sourcing methods fail to pin-point the location at
which they were collected. They can be in the form of small percentage of chert
or flint cobbles in a field of quartzite, or as cobbles of the same general material
class having a finer grain or other desirable characteristic than the rest of that
class (for example some finer-grained quartzite cobbles in a field of quartzite
cobbles). As the occurrence of some of the classes of materials in this type of
deposit may be very low it would not be unusual for them to be labeled as
“exotics” or even as “non-local” when analyzed in the lab by archaeologists.
When the source of these materials is correctly identified as being from local
deposits of this type a common practice is to treat them as very low cost, due to a
nearest distance-traveled determination. I argue in this paper that the nature of
this type of resource makes them dependent on search-time (time as currency)
90rather than on distance-traveled measures (distance as currency) and therefore a
different type of model from a central place one is required.
The diet breadth (or resource choice) model has many elements that make it
attractive for use with local and secondary lithic resources. Rather than review all
of the assumptions of this model, which have been well-described elsewhere (see
Winterhalder and Goland 1997:128-134), I want to focus on those aspects of this
model that apply especially to lithic resources. 1) The resource choice model
holds that there is a fine grained random distribution of resources in the local
environment (Winterhalder and Goland 1997). This is true perhaps more so for
piles of beach or stream cobble or rocks in glacial till than for any edible resource.
2) Encounter rates are held to be a product of resource density with search time
being separate from processing and handling costs. For many lithic resources
occurring as cobbles handling and processing costs can be considered nearly
equal, leaving search time as the main cost of capture.
Applying a diet breadth model to the lithic raw materials at Klasies River and
other Howiesons Poort occurrences shows a reordering in the ranking applied to
them, with the fine-grained materials, primarily silcrete, becoming very highly
ranked and for the first time exceeding their local representation in the lithic
assemblages. Rather than a by-product of increased foraging ranges this can be
explained fully in the local geological context as increased foraging times. Why
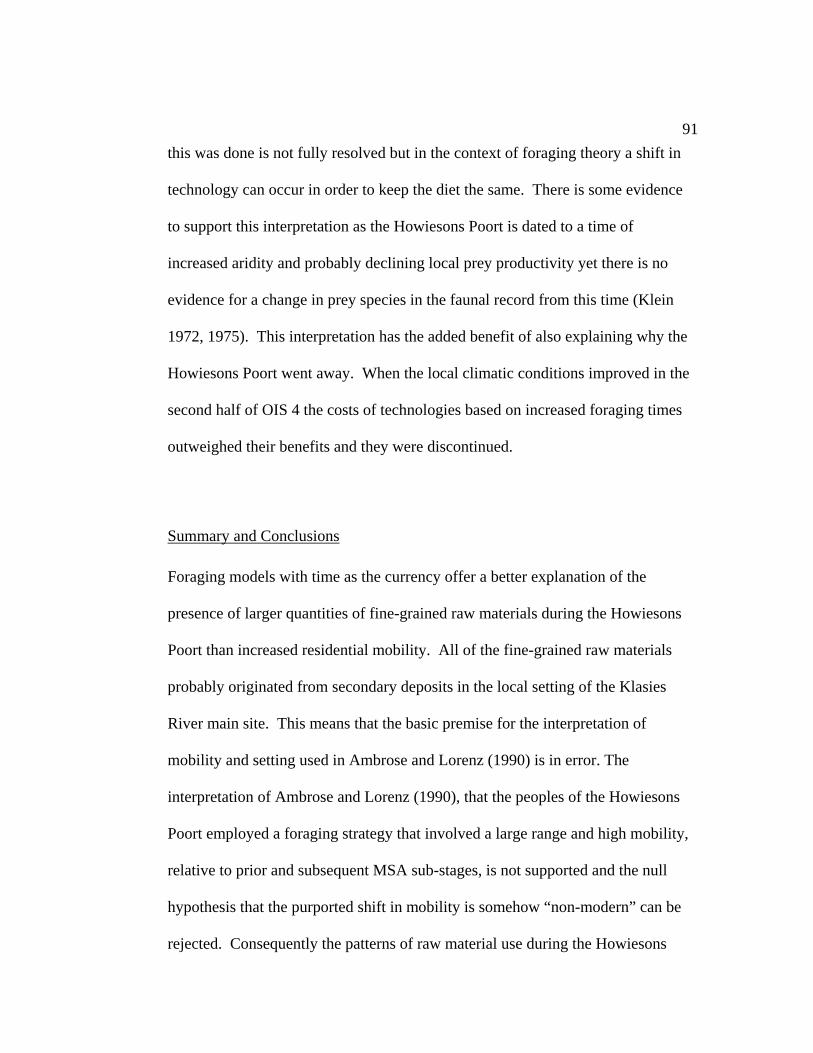
91this was done is not fully resolved but in the context of foraging theory a shift in
technology can occur in order to keep the diet the same. There is some evidence
to support this interpretation as the Howiesons Poort is dated to a time of
increased aridity and probably declining local prey productivity yet there is no
evidence for a change in prey species in the faunal record from this time (Klein
1972, 1975). This interpretation has the added benefit of also explaining why the
Howiesons Poort went away. When the local climatic conditions improved in the
second half of OIS 4 the costs of technologies based on increased foraging times
outweighed their benefits and they were discontinued.
Summary and Conclusions
Foraging models with time as the currency offer a better explanation of the
presence of larger quantities of fine-grained raw materials during the Howiesons
Poort than increased residential mobility. All of the fine-grained raw materials
probably originated from secondary deposits in the local setting of the Klasies
River main site. This means that the basic premise for the interpretation of
mobility and setting used in Ambrose and Lorenz (1990) is in error. The
interpretation of Ambrose and Lorenz (1990), that the peoples of the Howiesons
Poort employed a foraging strategy that involved a large range and high mobility,
relative to prior and subsequent MSA sub-stages, is not supported and the null
hypothesis that the purported shift in mobility is somehow “non-modern” can be
rejected. Consequently the patterns of raw material use during the Howiesons

92Poort sub-stage can no longer be used to support the Later Upper Pleistocene
Model for modern human origins.
However, change to a time as currency model from a distance as currency model
has little or no effect on Deacon and Wurz’s model of reciprocal exchange as a
risk-reducing strategy. Increasing the value of artifacts by long-distance transport
or by extended foraging times are both compatible with this model. As secondary
deposits are, by definition, removed from easily knowable primary sources the
movement of finished Howiesons Poort pieces between groups in the Cape of
southern Africa may be impossible to detect in the archaeological record by raw
material alone and additional technological or stylistic analyses may be required.
This does not mean that the movement of raw materials over long distances is
unknown is the African MSA. The movement of well-sourced obsidians over
>100 km in East Africa is well-documented (McBrearty 1981, 1986, 1988,
Mehlman 1977, 1979, 1989, 1991, Ambrose 2001, 2002). This mosaic of
approaches, of long distance travel and exchange and of local intensification, is
the general pattern of at least the second half of the MSA. It is this pattern, not
any one resource procurement strategy, which is fully modern.
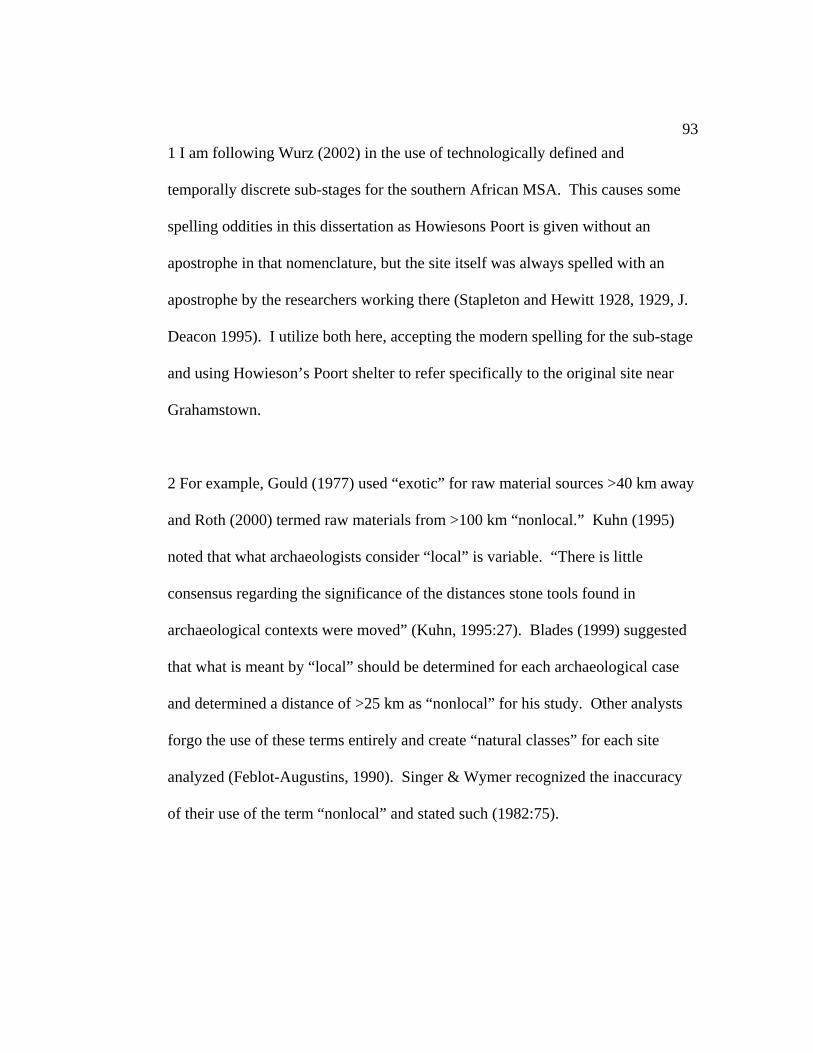
931 I am following Wurz (2002) in the use of technologically defined and
temporally discrete sub-stages for the southern African MSA. This causes some
spelling oddities in this dissertation as Howiesons Poort is given without an
apostrophe in that nomenclature, but the site itself was always spelled with an
apostrophe by the researchers working there (Stapleton and Hewitt 1928, 1929, J.
Deacon 1995). I utilize both here, accepting the modern spelling for the sub-stage
and using Howieson’s Poort shelter to refer specifically to the original site near
Grahamstown.
2 For example, Gould (1977) used “exotic” for raw material sources >40 km away
and Roth (2000) termed raw materials from >100 km “nonlocal.” Kuhn (1995)
noted that what archaeologists consider “local” is variable. “There is little
consensus regarding the significance of the distances stone tools found in
archaeological contexts were moved” (Kuhn, 1995:27). Blades (1999) suggested
that what is meant by “local” should be determined for each archaeological case
and determined a distance of >25 km as “nonlocal” for his study. Other analysts
forgo the use of these terms entirely and create “natural classes” for each site
analyzed (Feblot-Augustins, 1990). Singer & Wymer recognized the inaccuracy
of their use of the term “nonlocal” and stated such (1982:75).
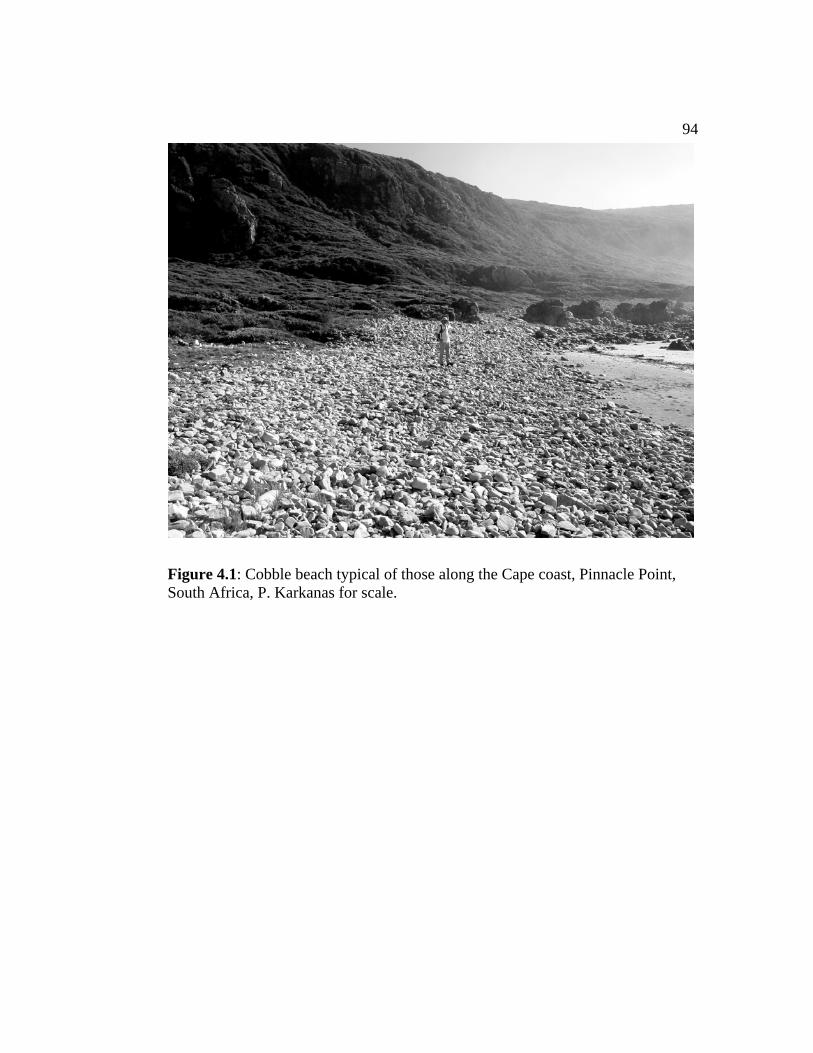
94
Figure 4.1: Cobble beach typical of those along the Cape coast, Pinnacle Point, South Africa, P. Karkanas for scale.
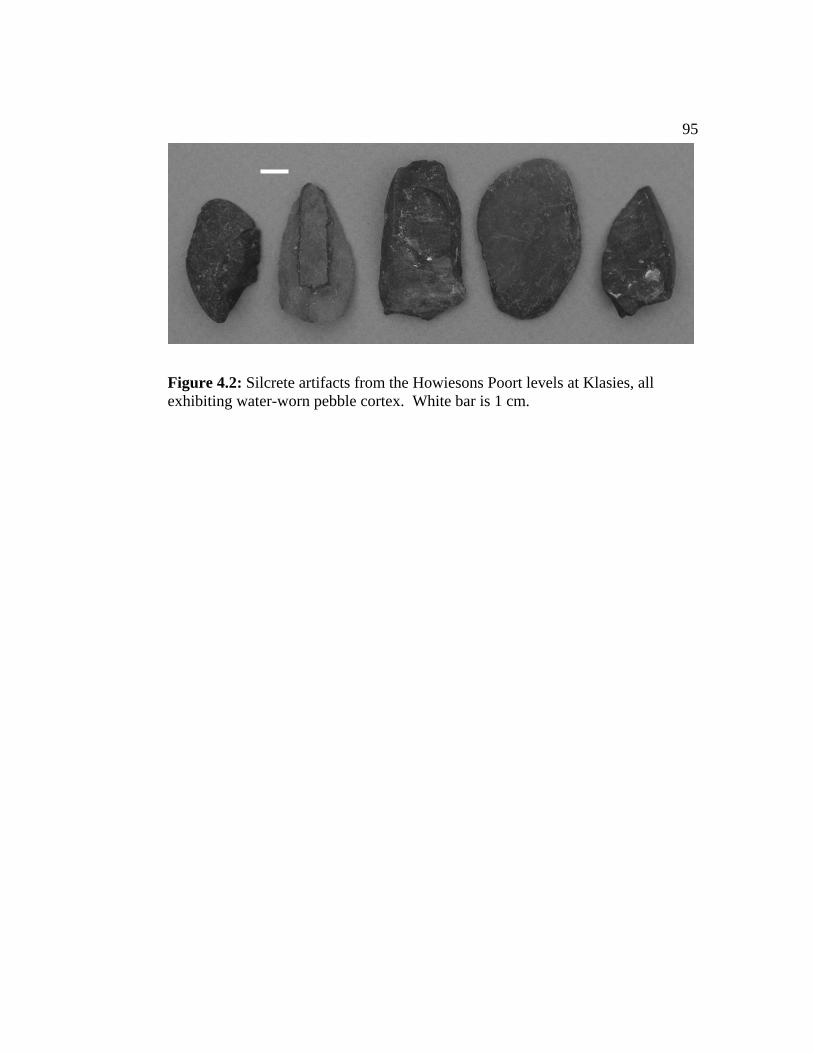
95
Figure 4.2: Silcrete artifacts from the Howiesons Poort levels at Klasies, all exhibiting water-worn pebble cortex. White bar is 1 cm.
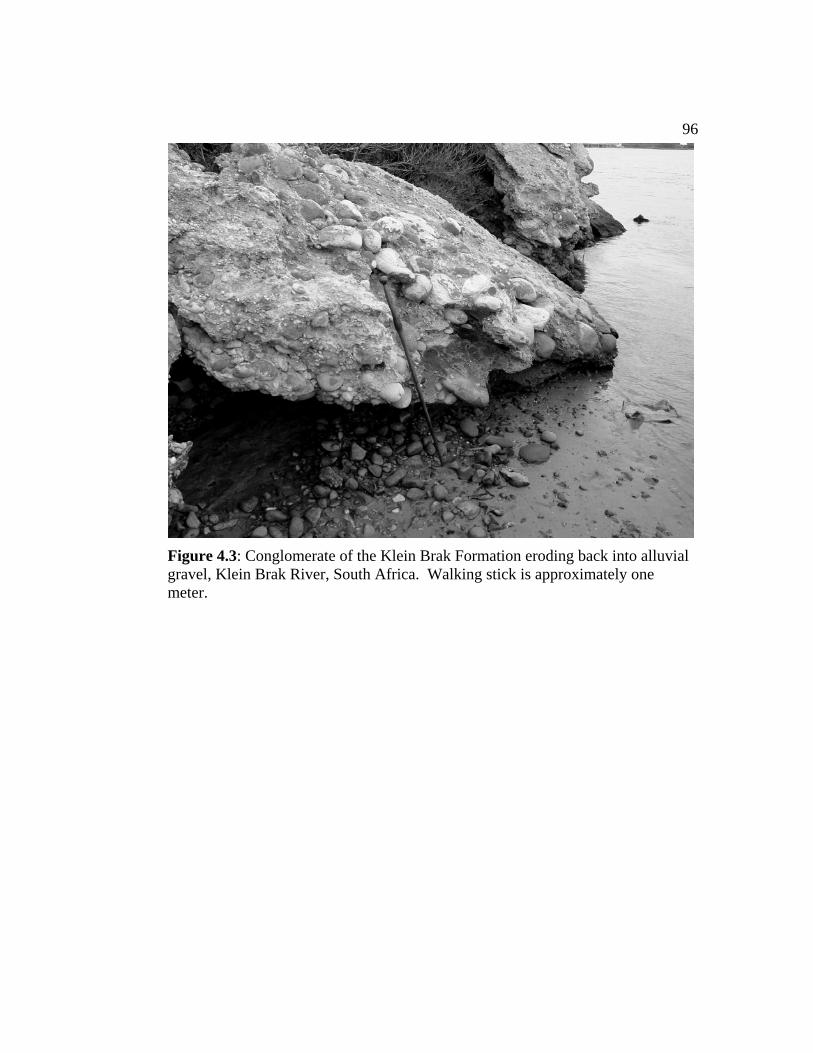
96
Figure 4.3: Conglomerate of the Klein Brak Formation eroding back into alluvial gravel, Klein Brak River, South Africa. Walking stick is approximately one meter.
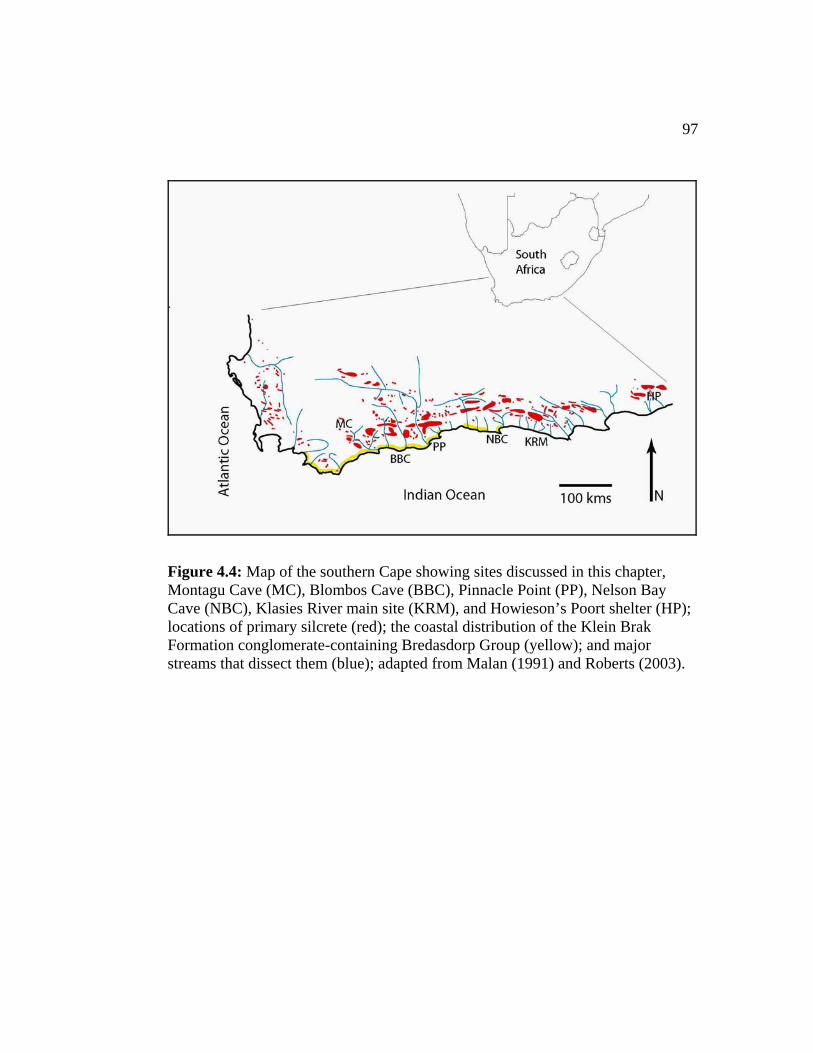
97
Figure 4.4: Map of the southern Cape showing sites discussed in this chapter, Montagu Cave (MC), Blombos Cave (BBC), Pinnacle Point (PP), Nelson Bay Cave (NBC), Klasies River main site (KRM), and Howieson’s Poort shelter (HP); locations of primary silcrete (red); the coastal distribution of the Klein Brak Formation conglomerate-containing Bredasdorp Group (yellow); and major streams that dissect them (blue); adapted from Malan (1991) and Roberts (2003).

98
Figure 4.5: Table Mountain Sandstone, the parent material of the Klasies River caves, with quartz cobbles as inclusions. White bar is 10 cm.

99Chapter 5: The Still Bay
The Context of the Still Bay
In the scheme proposed by Wurz (2002) for the MSA of the Cape the Howiesons
Poort sub-stage is preceded immediately by the Still Bay sub-stage (Table 1.1).
This is possible or, as seems more likely to me, there maybe some intervening
period of time of unknown duration during which different technological choices
were being made. While Still Bay archaeology has been known for some time (as
will become clear in my discussion below), its current prominent role in the
debate over the nature of MSA technological choices and behavioral modernity
comes from two recently discovered and excavated sites, Hollow Rock Shelter
and, especially, Blombos Cave. By chance, both sites became known to
archaeology in the same year, 1992. These two sites with abundant bifacial lithic
technology are located in different parts of the known geographical range of the
Still Bay and were initially identified by different archaeologists (Figure 5.1).
The settings and artifact preservation at these sites is quite different and the latter
is especially favorable at Blombos Cave. This dune-sealed cave with good
organic preservation (described in some detail in Chapter 1) is also the first place
that the Still Bay was reliably dated, to about 74,000 BP (Henshilwood et al.
2004). Hollow Rock Shelter now supports the dating of the Still Bay layers at
Blombos (Feathers, personal communication). Hollow Rock Shelter also plays
the critical role of making the Still Bay less anomalous. Just as is the case for the
100Howiesons Poort, the Still Bay predates the period of time 40-50,000 years ago
when, under the Late Upper Pleistocene Model, fully modern behaviors arose.
While accepting the Howiesons Poort as fully modern behavior requires only a
few thousand years shift in the timing of the supposed Neural Advance of that
model, the Still Bay extends that boundary at least 25,000 years older than the
model allows, effectively nullifying it.
The Still Bay Industry (or now sub-stage) of the Middle Stone Age has a long
history in the archaeological literature of South Africa. Artifacts from what we
now call the Still Bay were described in print by Sir Langham Dale in 1870 in two
articles in Cape Monthly Magazine, in which Dale assigned them to the “Cape
Flats culture” a grab-bag of stone implements exposed in the dune fields near
Cape Town (Dale 1870). More importantly, Dale illustrated the artifacts as seen
here, which are some of the earliest Paleolithic artifacts illustrated from the
subcontinent (Figure 5.2). Probably due to the obviously artifactual nature of Still
Bay bifacial points they were frequently the focus of collectors and antiquarians
living in the Cape Colony in the late nineteenth and early twentieth centuries.
Burkitt (1928) reports them among the first artifacts sent back to England in the
nineteenth century. Colonel Hardy, Mr. Mossop, and Mr. Jagger collected the
Fish Hoek valley on the Cape Peninsula, Mr. Victor Peers and his son Bertie
Peers excavated Skildergat (now usually referred to as Peers Cave), and Mr. Frans
Malan excavated a large deposit eroding from the dune field at Cape Hangklip.
101Another of these early antiquarians, the physician C. H. Heese, collected a
number of surface sites near Still Bay including Blombos Sands, near the modern
cave excavation, Kleinjongensfontein, and the site of Blombos Schoolhouse that
yielded the singular artifact known as the Blombos Bo (Figure 5.3). Importantly,
these collectors corresponded with one another, sending copies of photographs of
artifacts, confirming that they were all talking about the same phenomena.
A Rock by Any Other Name
The naming of this sub-stage has been the source of a variety of spellings and
some confusion, a short history of that terminology (and confusion) is provided
here. As stated earlier the first Stone Age artifacts recorded from South Africa
were of this type (Dale 1870). Sir Langham Dale published an illustration of two
Still Bay bifacial points under the pseudonym ∆ (Greek letter Delta) in an article
in Cape Monthly Magazine in 1870 as artifacts of the “Cape Flats” type. The
“Cape Flats” designation was based upon several surface sites and consisted of
artifacts which would now be recognized as representing a broad swath of
southern African prehistory. The term “lance-heads of the Solutrean type” is
applied to these same artifacts in 1911 (Peringuey 1911). Partly to remedy this
confusion and partly to honor another early antiquarian (C. H. Heese), the giant of
early South African archaeology, A. J. H. Goodwin (1926a) proposed that the
term “Stilbaai type” be used to designate sites in the western Cape that contain
fully bifacial points. Heese had discovered a large number of finely flaked

102bifacial points at the Kleinjongensfontein dune field south of Riversdale, near
Stilbaai (J. Deacon 1979).
After a meeting of the South African Association for the Advancement of Science
“several of the keenest students of stone implements in South Africa
conferred…and agreed to adopt the following terminology in the description of
their finds” (Goodwin 1926b:784). The term “Stil Baai Industry” and, in the
same article the correct Afrikaans spelling of “Stilbaai”, as part of the Later Stone
Age (there was no Middle Stone Age in their scheme), occurring before Wilton,
was agreed on. This odd combination of Afrikaans spelling and English structure
was, however, short-lived. Two years later Goodwin used the term “Still Bay” in
an article placing it in the newly created Middle Stone Age (1928a) and again in
an article describing Dale’s original collection (1928b). Also in that year M. C.
Burkitt published a general text, “South Africa’s Past in Paint & Stone”, in which
the term “Still Bay culture” was used (Burkitt 1928). Consistency in terminology
seems to have finally arrived as the next year Goodwin and C. Van Riet Lowe
(1929) continued to use “Still Bay”.
In 1935 Goodwin also used “Still Bay” in his history of the investigations of
South African prehistory (Goodwin 1935). This consistency faltered soon
thereafter and Goodwin used the term “Stillbay” in his general text on South
African prehistory, “The Loom of Prehistory” (Goodwin 1946). This time

103Goodwin has used the odd combination of English spelling and Afrikaans
structure, having now exhausted all four possible combinations of these two
languages in this term. In the 1950s J. A. Mabbutt (1951) and R. P. Gatehouse
(1955) used the term “Still Bay” in describing the collection of F. Malan at Cape
Hangklip. At the same time B. D. Malan used “Stillbay” in his descriptions of
Tunnel Cave and Skildergat Kop (Malan 1955). G. Summers compiled a guide to
nomenclature for the South African Museum to ensure consistency in coding
materials in 1970 (G. Avery, personal communication) and used “Still Bay” based
on Goodwin. R. Mason (1962) and C. G. Sampson (1974) continued with
“Stillbay”, although both were working primarily in areas that are outside of the
Still Bay distribution. The following year the first analyses of a bifacial MSA
assemblage in some time, G. Schirmer’s monograph on Dale Rose Parlour, used
the term “Still Bay” (Schirmer 1975). The next published analysis of a Still Bay
site, U. Evans’ honors thesis on Hollow Rock Shelter, used the term “Stillbay”
(Evans 1994). Nearly simultaneously C. Henshilwood and J. Sealy publish the
first description of Blombos Cave, using the term “Still Bay” (Henshilwood and
Sealy 1997). The Blombos team has continued to consistently use “Still Bay” in
their reports. H. J. Deacon and J. Deacon in “Human Beginnings in South Africa”
reverted back to “Stillbay”, referring to it as “the modern spelling” (Deacon and
Deacon 1999:100). Of what they felt “Stillbay” was the modern spelling is
unclear, as “Stilbaai” appears to be the modern spelling of the body of water and
“Still Bay (and Still Bay West)” appears to be the modern spelling of the town on
104most governmental maps. Goodwin coined the term and used “Still Bay” most
consistently of all of the variants. Researchers actually working with the material
have used “Still Bay” more frequently than other variants, and “Still Bay” and
“Stilbaai” are the only two variants that are linguistically and geographically
correct. Interestingly in Heese’s own unpublished notes on his substantial Still
Bay collections he used Stilbaai and Still Bay interchangeably, but never Stil Baai
or Stillbay (Heese n.d.). The weight of precedent goes heavily to the use of “Still
Bay” when referring to this unique archaeological phenomenon and this spelling
is used most recently by Wurz (2002) in her proposed MSA scheme.
Place and Time
The distribution of the Still Bay was noted from the early twentieth-century to be
confined to a discrete area between the Atlantic and Indian Ocean coasts and the
Cape Fold Mountains and more than seven decades of archaeological research
continues to support this (Figure 5.1). Other MSA hafted bifacial point traditions
can be found in South Africa, including the hollow-based points from
Umhlatuzana (Kaplan 1990) in KwaZulu-Natal Province and the typically tear-
drop shaped points of the Pietersburg Complex (Mason 1962, Sampson 1974) in
the Free State Province. These all appear to be typologically and geographically
distinct. The Pietersburg points from Border cave have been dated to around
82,000 BP, of similar age as the Still Bay (Grün and Beaumont 2001). It is

105unclear at this time what the relationships and durations of each of these hafted
bifacial point traditions are.
Goodwin invited his mentor at Cambridge, Miles Burkitt, for a grand tour of
South African prehistory in 1927. Burkitt published the first general text on the
subject the following year, in which he described the Still Bay as marking “the
arrival of Neoanthropic Man” in South Africa (1928:88). In his conception these
modern peoples obviously came from Europe and migrated south at only 12,000
years ago, but his observations on the technological modernity of the Still Bay
remain. Other writers used the term “Solutrean-like” for the bifacial points and
noted other Upper Paleolithic analogues and similarities in the toolkits. The early
century interest in the Still Bay Industry lapsed in absence of new finds and some
researchers began to doubt the validity of the term by the 1970s (e.g. Sampson
1974).
Recently, the excavations at Blombos Cave by a team led by C. Henshilwood
have returned the Still Bay to prominence. Blombos Cave is only the second site
with a large Still Bay component subject to modern excavation (Hollow Rock
Shelter being the other) and is the only one with organic preservation. Blombos
Cave provides us with dates and strong associations with worked bone and ochre.
Zenobia Jacobs and Chantal Tribilo, utilizing OSL on sediments and TL on
burned lithics, respectively, have provided us with good and concurring dating

106estimates for the Still Bay of 74,000 ± 5,000 BP, placing it at the OIS 5a/4
transition (Table 5.1). These dates correspond to the only description (from Peers
Cave) of a Still Bay deposit followed by a Howieson’s Poort one. This
relationship has been misinterpreted in the past, because of confusion about
terminology, although Keith (1931) described it correctly. This confusion has
been recently cleared-up by Royden Yates, utilizing the Peers’ original notes.
The confusion comes from the use of the terms “developed Still Bay” and “coarse
Still Bay”, which were read by many to mean two different phases of the Still
Bay, but which actually meant, for the developed Still Bay, the presence of
bifacial points, and, for the coarse Still Bay, what would be called MSA 3 or 4 or
post-Howiesons Poort today (Royden Yates, personal communication).
Additionally, the single Still Bay point from Klasies had fallen from the face of
the deposit (Singer and Wymer 1982:105). Singer and Wymer reconstructed its
original position using adhering sediments and placed it at the very top of their
MSA II, just below the HP. This reconstruction fits very well with the temporal
information from Blombos Cave. The application of OSL methods to the Still
Bay site of Hollow Rock Shelter is in agreement with the dating estimates for
Blombos Cave (Feathers, personal communication). The ongoing University of
Cape Town excavation at Diepkloof has revealed a deposit up to 30 cm thick
bearing neither the bifacial points of the Still Bay or the backed pieces of the
Howiesons Poort, but containing MSA artifacts, between the two (Parkington,
personal communication).
107
Still Bay Study Goals
With this background I began my investigation into the Still Bay using existing
collections of artifacts. I had several reasons and goals for this study. First, no
comprehensive study of the Still Bay had ever been done and, in light of the finds
at Blombos Cave and their importance for understanding our prehistory generally
one was needed. Second, I wanted to compare the Still Bay to the subsequent
Howiesons Poort technologically, not just typologically. As part of this I wanted
to see if there was evidence for transition or overlap between these two important
technologically defined sub-stages. Third, I wanted to begin to investigate tool
function beyond calling them lance-heads and assuming that is what they were
used for. Fourth, I wanted to investigate stylistic unity for bifacial points
described as Still Bay. That is, are all of these bifacial point similar in style or are
there assemblages that are clearly different. And, perhaps the most challenging, I
had to utilize poorly excavated or poorly recorded museum and university
collections to a great degree in accomplishing these goals.
Site and Collection Descriptions
Blombos Cave
Blombos Cave is not included in the analyses described in this chapter. It is the
only known Still Bay assemblage of any size that is not included here, but the
108finds at Blombos Cave are critical in understanding this sub-stage and are the
main reason why this sub-stage is of renewed interest in modern human origins
research. The lithic materials from Blombos Cave are under analysis by Marie
Soressi who has generously discussed her materials with me at length. Due to this
broader importance and the importance of this site to the Still Bay a brief
description of Blombos Cave and its materials is provided here summarized from
Henshilwood and Sealy (1997), Henshilwood et al. (2001a, 2002, 2004),
Henshilwood (2004), and Soressi and Henshilwood (2004).
Blombos Cave is located on the Indian Ocean coast west of the modern town of
Still Bay. This cave is very near the Still Bay dune site of Blombos Sands (see
below) and care must be given not to confuse the two. Blombos Cave sits high
above current sea-level in a wave-cut cavern in Table Mountain quartzitic
sandstone bedrock. A dune containing calcrete sits above the site and this has
acted as a buffer to the groundwater resulting in excellent artifact preservation,
including organic materials. The cave was nearly sealed by a dune on the bluff
face containing the cave and was discovered due to some LSA archaeological
materials on the slope in front of the cave. The upper layers of the cave contain
LSA deposits, including fauna, and those were the initial target of the excavation
at the cave, which was intended as an examination of pastoralism in the Cape.
This LSA deposit sits on a sterile dune layer (BBC Hiatus) marking a hiatus in
human use of the cave and sealing the deeper MSA deposits. This dune has been

109dated by OSL to 69,000 ± 5,000 years ago (Henshilwood et al. 2002). Analysis
of single grains of sand in the dune suggest minimal disturbance of the dune since
that time (Jacobs, personal communication). The dune sits immediately on top of
Still Bay deposits (BBC M1) which have been dated to 74,000 ± 5,000 years ago
by both OSL sediments and TL on burned lithics (Henshilwood 2004). The BBC
M1 deposits have a large number of bifacial points in various stages of
manufacture and have been interpreted by their analysts as being a bifacial point
workshop (Soressi and Henshilwood 2004). Ochre that has been engraved with
repeating geometrical patterns were recovered from these layers (Henshilwood et
al. 2002). Also from the BBC M1 layers a set of perforated shell beads has been
recovered (Henshilwood 2004).
The presence of clear symbols and personal ornamentation in the Still Bay layers
at Blombos Cave marks the earliest well-dated occurrence of both phenomena in
the known archaeological record. These require accounting for in any explanation
of modern human evolution. That they occur in deposits that bear lithic materials
that have long been remarked upon for their sophistication only reinforces the
importance of this site. Clues to the co-occurrence of Still Bay bifacial points
with other precocious artifacts have been around for quite some time and these
will be discussed for each of the sites that follow here. What is critical to
understanding the Still Bay is that at Blombos Cave, the lone Still Bay site to date
that has organic preservation, was the subject to modern excavation techniques,
110and has been well-dated, yielded abundant evidence for the behavioral
sophistication, modernity if you must, of MSA peoples. That the Still Bay must
now be considered the upper limit, the absolutely most recent date, at which this
sophistication manifests in the archaeological record, is pressed home even
further by the deeper deposits at Blombos Cave itself.
In the lower layers of the BBC M1 deposit a transition to flaked stone bifacial
points from bone point technology is clearly underway. The finely worked bone
points that are found mostly in the deeper BBC M2 deposit push the antiquity of
that sophisticated tool-making technique to new depths. Bone points are known
from other MSA deposits on the Cape Coast (notably at Klasies River, Singer and
Wymer 1982), but not in the numbers recovered from the BBC M2 deposits. The
large amount of worked bone in the BBC M2 deposits makes it much more
difficult for them to be dismissed as “anomalous” or “intrusive LSA” as has been
frequently done for the single worked bone artifacts typical of other MSA
deposits in the Cape. More importantly than their numbers the bone tools have
been assessed for protein preservation, in comparison to LSA bone from the cave,
and found to conform to the MSA chemical profile (Henshilwood and Sealy 1997,
Henshilwood et al. 2001b). The transition between the bone point industry and
the subsequent Still Bay industry in Blombos Cave appears to be gradual and
continuous with no abrupt hiatus or reoccupation that seems typical in cave
deposits of this antiquity. This is quite different from, for example, the transition
111between the SAS member and the subsequent HP member at Klasies. For the first
time in the MSA of the Cape convincing evidence of stylistic transitions between
culturally defined traditions appears to be clearly represented. The duration of
these periods also appears to be on the scale of thousands of years and is of a
similar order of the duration of much more recent periods of similar type, also for
the first time. Demonstrating that this pattern is typical, rather than anomalous,
for the MSA will be a major goal of archaeological research in the region for the
foreseeable future.
Blombos Sands
Blombos Sands (also Blombosch Sands) is a dune site west of the town of Still
Bay and near the Blombos Cave site. The assemblage analyzed here comes from
the Heese collection and a wide variety of fine-grained raw materials are
represented in the Still Bay materials. The dune field is itself quite extensive,
covering several hectares, and materials were collected over a period of decades
by Heese as they became exposed (Heese n.d.). As would be expected for an
open site that is at least 70,000 years old organic preservation is poor. The
exception being a single bone point included in the materials from this site that is
consistent with the bone MSA points from Blombos Cave (Figure 5.4). The
metrics for that point are included as the last case on the bifacial point table for
Blombos Sands. Less wind polish is noted on the lithic artifacts here than at Cape
Hangklip, suggesting a brief period of surface exposure. The materials recovered

112from this site may have a direct affinity with the Blombos Cave site, but this has
yet to be investigated in any way. It is likely that if there is a relationship between
the two that the cave represents a specialized manufacturing locus, whether
ritualistic or not, and the dune field artifacts represent open living/hunting sites. It
should be noted that impact fractures are absent on the Still Bay bifacial points at
Blombos Cave (Soressi and Henshilwood 2004), but are present in small numbers
at this site and at the similar Kleinjongensfontein.
Blombos Schoolhouse
A single artifact is represented from the site of a schoolhouse west of the town of
Still Bay. Discovered during a nature walk from the newly constructed
schoolhouse in 1928 this artifact was named the “Blombos Bo” (or Blombosch
Bo). Recovered from black sands that were reported to contain other MSA
artifacts this is the largest Still Bay bifacial point known (Figure 5.3). Except for
its remarkable size this bifacial point conforms nicely in form to the type. Heese
(n.d.) does not report any other bifacial points from the same locality, although he
surely looked extensively. No modern investigations of the schoolhouse site have
been undertaken.
Cape Hangklip
Cape Hangklip is the first cape east of the Cape of Good Hope. It is the
westernmost cape that is entirely on the Indian Ocean. The Earlier Stone Age

113(ESA) site at Cape Hangklip is quite famous and has been the subject of many
investigations by numerous luminaries of archaeology including, but not limited
too, Goodwin, Kenneth Oakley, the Abbé Breuil on an extended visit from Nazi-
occupied France, Glynn Isaac (as an undergraduate in the 1950s), and Garth
Sampson (1962). Less well-known is a MSA component that is apparently from a
much smaller and discrete area slightly upslope (inland) from the ESA site (Malan
n.d.). This site was collected by Frans Malan in 1934 (Gatehouse 1955), a local
farmer with an interest in antiquities, and accessioned to the South African
Museum as 6229, in 1962. A letter from Malan to Heese in the Heese papers at
the South African Museum is the only document that records the setting and
circumstances behind this assemblage (Malan n.d.). In that letter Malan illustrates
the stratigraphic relationship between the MSA component and the better known
ESA occurrence (Figure 5.5).
Unfortunately, Malan gives no plan view figure and it is unclear where along the
inland side of the large ESA site the MSA site is or was located. Gatehouse
(1955) and Mabbutt (1951) both make mention of the MSA site is their articles on
the ESA site, but also fail to locate it on any map. While working on the ESA site
Sampson saw no evidence of the MSA occupation (personal communication).
The area was both vegetated and active sand dunes during the time of Malan’s
collection and the dune field is clear in Gatehouse’s aerial photographs (Figure
5.6). Today nearly all of the area that potentially is the location of the MSA site

114is overgrown with the invasive shrub Rooikrans (Acacia cyclops). I made two
trips to Cape Hangklip with R. Yates of the South African Museum in 2003 and
then again in 2004. The first trip was especially disappointing in that we could
not even locate the ESA site due to the heavy ground cover. We visited the site
with Dr. Peter Joubert of Lipkin Road, Betty’s Bay, and Mr. Bo Atwell of Betty’s
Bay. Mr. Atwell was especially informative as he had been on the site with
Gatehouse in the 1950s. During the second trip a portion of the ESA surface
scatter was located (Figure 5.7) although again the vegetation prevented
relocation of the MSA site. The removal of Rooikrans is required by South
African law and in the near future better surface exposure and the ability to
actually walk in the vicinity of the MSA site may be possible, the contact for the
local removal program is Monique van Dyke (0282714010).
Malan (n.d.) reported recovering the MSA artifacts from an exposure in a
vegetated dune. My attempts at locating descriptions of the site or of the
collection of artifacts in the collected papers at the South African Museum and the
University of Cape Town have been unsuccessful. Attempts at contacting
descendents of Frans Malan in hope of locating additional notes have also proved
unsuccessful, Malan being a common surname in the Cape. That F. Malan had a
set of detailed notes on the site is evidenced in this quote from Gatehouse, “I am
indebted to Mr. Malan for giving me access to his catalogues and the Abbé
Breuil’s notes” (1955:344). As it is it is quite fortunate that we have the letter that

115Malan wrote to Heese, discussing his finds at Cape Hangklip. Included with that
letter are a set of high quality black and white artifact photographs (Figure 5.8).
All of the photographed artifacts from Malan’s collection are still in the South
African Museum collection except for two. One of these artifacts is a large white
quartz bifacial point that could easily have been loaned to another museum as a
type example.
The other missing artifact is perhaps more interesting. It is (or was) a large ochre
pencil that was worked on the visible face, as is clearly apparent on the high
quality photograph of Malan’s (Figure 5.9). The working of this ochre piece is
probably by repeated stabbing with a stone tool, although it may be impossible to
know without examining the actual artifact (I. Watts, personal communication).
The Cape Hangklip materials collected by Malan were accessioned into the
collections of the South African Museum and have remained as a single box. The
missing worked ochre is not in that box and no other materials from the MSA site
at Cape Hangklip have been located at the museum. It is possible that the ochre
was never donated to the museum. It is also possible that the ochre sits in a box
in the museum stores and will eventually be relocated. What is clear is that Malan
recognized the importance of the worked ochre enough to take a photograph of it.
It is worth noting that this makes at least three Still Bay sites (Blombos Cave,
Hollow Rock Shelter, and Cape Hangklip) with worked ochre, a pattern that can
not be described as anomalous.
116
Artifact preservation at Cape Hangklip is, like other open dune field sites, poor.
All of the known preserved artifacts are of flaked stone, with the exception of the
mineral ochre artifact. Malan (n.d.) makes no mention of bone in his letter
regarding the site. Wind erosion is apparent to varying degrees on nearly all of
the artifacts. It is unclear whether this is the result of long-term surface exposure
prior to burial in the dunes or as result of more recent exposure of the materials,
or of a combination of both. The depositional conditions of this assemblage are
impossible to assess without the rediscovery of whatever portions of this site
remain in situ. Other than the foliate Still Bay bifacial points, which were the
focus of my analysis, this assemblage is remarkable in many ways.
First, the bifacial points themselves are exceptional in their size, representing the
largest bifacial points from the Still Bay sub-stage, other than the Blombos Bo,
known (Table 5.2, Figure 5.10). These bifacial points were displayed as
representative of the Still Bay type in the main hall of the South African Museum
until 2004 when the archaeology displays were completely renovated. It is worth
noting that the artifacts displayed as the Still Bay type specimens in a prominent
museum for at least forty years failed to elicit any professional interest in the
assemblage. The Cape Hangklip assemblage is also exceptional in that the vast
majority of all classes of MSA artifacts are made on a fine homogeneous silcrete
(almost to the exclusion of every other class of raw material). This includes

117things like blades and convergent flake-blades that would typically be made on
quartzite in other Cape MSA assemblages. Related to the unusual raw material
representation in this assemblage is an unusually high degree of retouch present in
the non-bifacial portion of the assemblage. The high representation of silcrete
makes identifying retouch easier (or even possible) suggesting that the general
observation that retouch is rare or absent in MSA assemblages is simply the result
of difficulties in assessing retouch and edge damage in coarse-grained raw
materials. An attempt at dealing with this problem is made in Chapter 7 in the
Pinnacle Point 13B assemblage.
Dale Rose Parlour
Also known as Trappieskop or Eales Cave (and the boxes for this assemblage at
the University of Cape Town have been erroneously labeled “Eagles Cave”),
Dale Rose Parlour is a small shelter on the side of a hill named Trappieskop
facing the Fish Hoek valley. Skildergat (Peers Cave) is visible on the opposite
side of the valley from the entrance of this shelter and Hangklip is visible from
Trappieskop across False Bay. That three of the largest Still Bay assemblages
known come from sites that are visually connected is somewhat remarkable. The
relationship between these sites has not been explored in any meaningful way.
This site was “excavated” over a Christmas break by three high-school boys in
1936 and the assemblage has spent the past 50 years in the teaching collections of
118the University of Cape Town where they have been accessed by an untold number
of students. It is clear that some of the finer complete silcrete bifacial points are
no longer in the collection. Schirmer (1975) has produced the only description of
the materials and the circumstances of the excavation and this summary is taken
largely from her work. Artifact preservation at Dale Rose Parlour is poor, with
only lithic material represented. The setting of the shelter is unusual in that it sits
high above the valley floor and is accessible only by climbing to the top of the hill
then coming down a crevasse onto a small ledge. It is difficult to see from below
and was not found by the Peers’ during their survey of shelters and caves on
Trappieskop in the 1920s. This site has a bifacial assemblage that most resembles
that at Blombos Cave, dominated by large numbers of bifacial points in all stages
of manufacture. The difficulty in reaching this site would not have been
conducive to everyday living or as a hunting station, but may have been important
in its choice as a bifacial point manufacturing shop. Blombos Cave is similarly
(though not quite as) difficult to reach; why these workshops are found in settings
that are somewhat odd is open to speculation. Schirmer (1975) interviewed all
three of the boys (then grown men) who had excavated the site and attempted to
reconstruct the stratigraphy and reorganize the collection. The statements of the
three men were often at odds with one another and it is unlikely that the
reconstruction can ever be trusted fully. A portion of the deposit remains in the
site today and a new excavation utilizing modern techniques seems warranted in
light of the finds at Blombos Cave and the similarities of this assemblage to that
119one. Minimally, dating of the sub-stage could be improved by adding data from
here.
Hollow Rock Shelter
Located during a survey in the Cederberg Mountains, near the town of
Clanwilliam, South Africa, by the Spatial Archaeology Research Unit of the
University of Cape Town in 1992 this site was given the field designation Sevilla
48 (for the name of the farm that it was located on) and is currently referred to in
the literature as Hollow Rock Shelter. The name derives from the fact that the site
is in fact almost entirely confined to the interior of a hollow beneath a single large
rock. A systematic excavation was undertaken in 1993 by R. Yates and U. Evans.
This excavation was analyzed and reported by Evans in an exemplary honors
thesis and subsequently as an article (Evans 1994). This article serves as the
source for much of the background information on the site summarized here.
Artifact preservation at Hollow Rock Shelter is very poor. No organic artifacts or
faunal materials were recovered and some of the lithic artifacts, notably the
coarse-grained silcrete, were in such poor state that they had to be impregnated
with glue in the field to prevent their disintegration. Only lithic and mineral
materials were recovered during the excavation.

120The lithics from Hollow Rock Shelter exhibit a wide range of technological
approaches, with continued use of Levallois techniques to make flakes, points,
and blades and the regular manufacture of hafted bifacial points. The single
backed piece observed at the site was located in a small erosional gully leading
out of the shelter (R. Yates, personal communication). Quartzite, coarse silcrete,
fine silcrete, hornfels, and quartz are all used to make tools. The bifacial points
are made on the more durable raw materials with hornfels being excluded.
A concentration of unmodified quartz crystals was recovered from Hollow Rock
Shelter (Evans 1994). Of the total of 39 recovered 34 were from a single 5 cm
spit and 1 m square (Figure 5.11). All the remaining crystals were from within
one unit or one 5 cm spit of this spit. The crystals do not have usewear apparent
on them and are of uniform size. It is suggested here that they represent symbolic
behavior, although a purely functional explanation may eventually found. The
ochre from Hollow Rock Shelter contains pieces with notched edges that echo the
ochre modification from the Still Bay layers at Blombos Cave. Again, symbolic
behavior seems to be the most reasonable explanation for these artifacts at this
time.
Kleinjongensfontein
The site of Kleinjongensfontein was collected over a number of visits spanning
many years by the antiquarian Heese. This dune field site is near the modern

121town of Still Bay and was one of the collections that led to the naming of the Still
Bay Industry (now sub-stage). Materials from Kleinjongensfontein are made
from a wide variety of fine materials, including the largest chalcedony artifact I
have seen in the Cape MSA (Figure 5.12). For dune-deposited materials there is
little evidence for wind etching on the lithics and that likely indicates minimal
exposure on the surface for most of these materials. The spatial relationships
between artifacts from this site and how large of a total area they were recovered
from are not known.
Skildergat (Peers Cave)
Skildergat, also known as Peers Cave and Fish Hoek Cave, is a large cave with a
panoramic view of the Fish Hoek Valley. The Fish Hoek Valley cuts across the
Cape Peninsula, with the Atlantic Ocean at the western mouth and the Indian
Ocean at the eastern mouth. The cave is wave-cut and during the higher sea
levels of the Middle Pleistocene the valley would have been an ocean channel
between two islands. During its occupation the cave would have had a
dominating position for hunters over herd animals moving through the valley.
During sea level regressions large coastal grassland plains would have been
exposed on both sides of the peninsula, increasing the importance of the valley as
a migratory pathway.
122The deposits in the cave were at one time extensive with LSA, MSA, and ESA
artifact-bearing layers having been removed in multiple excavations. The name
of the cave, Skildergat, is Afrikaans for “painted cave” and Holocene-aged rock
art is still visible there today. The most famous and largest in scale of these
excavations was carried out over a series of years in the 1920s by the father-son
team of Victor and Bertie Peers who labeled the cave A/101 in their survey of the
valley. The Peers’ utilized mining techniques to remove massive amounts of
deposit, much to the dismay of later researchers. In places explosives were used
to remove roof-fall boulders. The Peers’ recovered nine LSA skeletons in various
stages of completeness. One of these, a robust individual usually referred to as
“Fish Hoek Man”, was recovered from nine feet below the top of the
archaeological deposits and was touted by the famed anatomist Sir Arthur Keith
as the largest-brained ancient African (Keith 1931). It is now known through
radiocarbon assay directly on Fish Hoek Man (P4) that he was a Holocene-aged
(~4,800 BP) LSA individual and not from the MSA (Singer, personal
communication). No full description of all of the skeletal materials has been
published, although one is in preparation by Ronald Singer.
Similarly, no full description of the Peers’ excavations at Skildergat has been
published, although Goodwin (1949) published a summary of their notes. One of
the important parts of that summary was a basic stratigraphic relationship of
(beginning at the top) LSA, MSA (“Coarse Stillbay”), Howiesons Poort, Still Bay

123(“Finer Stillbay”), MSA (“Proto-Still Bay”), and ESA. This basic stratigraphy
has held up well over time and is also the source of some confusion. This
confusion is the result of the use of variants of the term “Still Bay” by the Peers’
to describe all of the MSA material. Royden Yates has recently examined this
issue using the Peers’ original notes and plotting artifact depths for the bifacial
points. He found that it is likely that the Howiesons Poort deposit overlies and is
not interdigitated with the Still Bay deposit as has been reported by Volman
(1981) and others (Yates, personal communication). Most of the Still Bay bifacial
points that I examined from Skildergat were from the Peers’ collection, although
from the description of their finds the collection at the South African Museum is a
pale shadow of the original collection, some of which appears to be housed in
British museums (Mitchell 2002b).
A subsequent excavation of the cave by Jolly in the 1940s (Jolly 1947, 1948)
produced a similar, and similarly vague, stratigraphic sequence. There are some
contradictions with the Peers’ description of the relationship between the LSA,
Howiesons Poort, and Still Bay layers and these may never be resolved as
between the two almost all (if not all) of the upper deposits have been removed
(Volman 1981). Subsequent excavations by Anthony (1972) have recovered ESA
or early MSA (Volman 1981) materials from the cave. Like the Peers’ collection
the Jolly collection seems to be missing a large number of diagnostic artifacts.
Since it is a later excavation one possibility is that the materials were recovered

124from below the Peers’ Still Bay layers and represent some temporal stylistic
difference in MSA bifacial point manufacture. In any case, the current conditions
of the site and the generally poor state of the excavation reporting from the site
preclude a definitive conclusion.
Composite Images
Every bifacial point and bifacial point fragment and unifacial point or uniface
fragment had its shape recorded as follows. I oriented each fragment tip end (or
where I thought the tip had been) up and, estimating the original center of the
point, traced its outline and then scanned all of the outlines into Adobe Illustrator.
Setting the opacity based on the number of pieces (for example if N=10, then I set
the opacity at 10%) I created the composites illustrated here (Figures 5.13-5.20).
Figures 5.13 and 5.14 illustrate quartzite and silcrete bifacial points from Dale
Rose Parlour (Trappieskop). The similarity in size(s) and form, even between the
different raw materials, is notable. Figures 5.15, 5.16, and 5.17 present composite
images of the same raw material classes with the addition of quartz for the bifacial
points from Hollow Rock Shelter. Similar patterns to those at Dale Rose Parlour
in size and form emerge when all the fragments are compiled. The quartz
artifacts are smaller than the other classes of raw materials (Table 5.2) and this
probably reflects the smaller package size for that raw material. Silcrete bifacial
points from Peers Cave (Skildergat) (Figure 5.18) and Kleinjongensfontein and
Blombos Sands (Figure 5.19) also follow this patterning. An interesting
observation of the Peers Cave materials is that three of the bifacial points from the

125Peers’ collection differ in size and form from those typical of the Still Bay. These
are much small and have a tear-drop shape, similar to the bifacial points of the
Pietersburg complex. These can be seen in the center of the composite image for
Skildergat (Figure 5.18). As the Peers’ excavation was quite extensive these
could represent a different period of time from the Still Bay sub-stage, or a variant
of the Still Bay that is not seen in any other assemblage. Figure 5.20 presents a
composite of the silcrete bifacial points from Cape Hangklip, which deviate in
size by being larger, but otherwise follow the patterning of form at the other Still
Bay sites (Table 5.2).
The use of composite images here provides a large amount of useful visual
information on the bifacial point assemblages. Composite images show
variability in size and shape well. In addition the composite images can show
what portions of the bifacial points are over- or under-represented in each
assemblage and what breakage patterns are common. The use of composite
images provides assemblage scale visual summaries that allow for easier
comprehension of complex metrical data.
Standard Measures of Still Bay Bifacial Points
Standard measures of all bifacial points, unifaces, and bifacial point fragments
from Still Bay assemblages are presented in Tables 5.2 – 5.10. The methods used
to get these measures, and all other lithic measures in this dissertation, are
126provided in Appendix B. In making any calculations the measures where all
rounded to the nearest millimeter. However, the raw data as they were recorded
from the calipers is presented here.
The vast majority of the bifacial points examined from all assemblages were in
fragmentary form. The exception being in the “Miscellaneous Still Bay” table in
which individual points collected and accessioned into the South African Museum
collections were nearly all complete bifacial points. Of the 216 clearly Still Bay
bifacial point specimens examined 41 were complete or nearly complete and 175
were fragments.
Evidence for Hafting
Several complete Still Bay bifacial points examined show evidence for having
been hafted. This is inferred from clear lines where resharpening and edge
maintenance of the bifacial point consistently stop at the same place between the
mid-point and the base (Figures 5.21, 5.22). Rather than a notching inward to
provide an attachment, this resharpening leaves the base wider than the rest of the
point. The hafting line is quite high up the point, always somewhere between
one-third and halfway from the base to the tip. The basal sections are also robust
(thick in cross-section) rather than thinned, as is common for projectile armatures.
A robust hafting element, large proportion of the point inside the haft, and
consistent evidence for resharpening all support the primary interpretation of Still
127Bay points as bifacial knives. Of the complete points examined from all Still Bay
assemblages (n=41) 34% exhibit good evidence for hafting (n=14). Possible
adhesive residue in the form of dark staining was observed on a basal fragment of
a single bifacial point from Peers Cave. No other residues were apparent on any
of the bifacial points or fragments and no special analyses have been applied to
the possible adhesive.
Evidence of Impact Fractures
Fractures at the tip of a point were recorded as an impact fracture (Figure 5.23).
These all show an obvious Hertzian initiation and in some cases the force of the
impact appears to have been quite large. Impact fracturing is evidence for the tool
having struck something hard forcefully during use. This could have been as a
thrusted knife, thrusted spear, or thrown spear. Shea et al. (2001) provides
experimental evidence that other contemporaneous lithic points in the Levant
served as spear armatures at least some of the time. Five impact fractures were
noted out of all of the assemblages examined (41 complete or nearly complete
points and 175 fragments). All of the impact fractures were observed from open
site (non-cave) assemblages, two from Cape Hangklip and three from
Kleinjongensfontein. That no impact fractures were observed from cave
assemblages, even though assemblage sizes from the cave sites is much larger,
suggests differing activity foci for these different types of sites. Thirty-five cave
site points that could be evaluated for impact fractures had none, whereas twenty-
128one open site points yielded five impact fractures for a x2 of 37.786 at .000
significance. In particular this reinforces the bifacial point workshop
interpretation for Dale Rose Parlour and Hollow Rock Shelter. It was noted that
no impact fractures were observed on the Blombos Cave bifacial points and an
interpretation as a workshop was given for that cave site as well (Soressi and
Henshilwood 2004). This then implies that the open dune Still Bay sites represent
more vigorous use of the bifacial points, probably as hunting and butchering tools.
Bifacial Thinning Flakes
The presence of bifacial thinning flakes in the debitage from the well-excavated
site of Hollow Rock Shelter and the poorly collected site of Dale Rose Parlour
were quantified. To do this I focused on the silcrete portion of the debitage as it
has a finer grain and is easier to characterize, especially as small flakes. Flakes
were identified as being bifacial thinning flakes on the basis of the presence of
acute platform angles, diffuse bulbs, and, often, faceted platforms. I counted and
weighed all of the silcrete flakes from each excavation. For the Dale Rose
Parlour assemblage this included the small flakes categorized as “chips” and for
the Hollow Rock Shelter this included the “small flaking debris.” Ursula Evans
kindly provided her original notes on the small flaking debris which were not
published in her analysis of that assemblage.

129In this way a percentage of “bifacialness” or a regression analysis could be
arrived at for Still Bay assemblages and compared to other MSA assemblages.
The use of a single raw material class, silcrete, in addition to making the
identification of small flake characteristics easier (or even possible) removes
comparative problems that may be resultant from engineering characteristics of
differing greatly between raw material classes.
I also quantified the debitage from the Deacon and Deacon excavation of the
Howieson’s Poort shelter in a similar way. Figure 5.24 shows the comparison of
the silcrete debitage between the two MSA sub-stages as a scatterplot. The
debitage from the Still Bay is clearly more bifacial and consistently so, with an r2
of .79 and a p<.05. The regression for the Howiesons Poort is less robust with an
r2 of .32 and p<.05. This can be at least partly explained by the temporal trend in
bifacial reduction apparent in the Howiesons Poort debitage. The two points on
or above the Still Bay regression line are both from the deepest level excavated by
the Deacons in 1965. The point representing the largest sample with no bifacial
thinning flakes is from the uppermost level of that excavation. This comparison
supports the idea that the Still Bay is both technologically and temporally prior to
the Howiesons Poort, although I will suggest in my discussion of the Howieson’s
Poort shelter collection (Chapter 6) that this assemblage is actually intermediate
between the two. A robust r2 for the Still Bay bifacial thinning presence in the
debitage supports a consistent 5% presence of those diagnostic flakes; other MSA

130assemblages that I have quantified in this way, with some exceptions (see Chapter
7), generally approach 0% presence of bifacial thinning flakes in their debitage.
Discussion and Conclusion
Observations made on the comprehensive (minus Blombos Cave) survey of Still
Bay bifacial points include obvious evidence for hafting (Figure 5.21) and for
resharpening in the haft (Figure 5.22) and, much less frequently, impact fractures
(Figure 5.23). A relative lack of impact fractures is partially explainable by the
context of these assemblages. The larger Still Bay assemblages, especially Dale
Rose Parlour and Hollow Rock Shelter, seem to match the interpretation of
Blombos Cave as special bifacial point workshops (Soressi and Henshilwood
2004). At these sites breakage types and patterns can almost all be attributed to
manufacturing errors. Whether a dichotomy exists between the points from open
dune field sites and these workshops, with the open sites representing more actual
day-to-day uses can not presently be resolved. Currently there are no modern
unbiased collections from any open Still Bay sites for a comparative analysis. As
discussed above, several attempts at relocating the “lost” site at Cape Hangklip by
Royden Yates and myself failed to locate any substantial MSA deposits.
The presence of size classes and the robust hafts and resharpening suggest that
many Still Bay points functioned primarily as knives, while others, with impact
fractures, functioned as spear armatures, as has been long assumed. John Shea
has analyzed the data presented here, as part of a larger examination of whether

131MSA points in general were projectile armatures (thrown spears). He found that
while some later MSA assemblages do conform to the aerodynamic
characteristics of projectile armatures Still Bay points do not (Shea, personal
communication). Still others, with extraordinary size and finish, seem to have
served as symbols in the social realm (as suggested by Marean and Assefa 2004).
These extraordinary bifacial points are the exception, rather than the rule and
functional explanations, rather than symbolic or ritualistic ones, seem more
appropriate at this time to explain the presence of the technology generally. This
over-representation of aesthetically pleasing bifacial points in discussions of the
Still Bay is not unusual in archaeology, but may lead to unnecessarily strained
explanations for their presence in the record.
Still Bay bifacial foliates are consistently associated with other artifacts including,
backed pieces, unifaces, bone points, worked ochre, and other possibly symbolic
goods such as cached quartz crystals. In summary, completed Still Bay points
often exhibit hafting and resharpening. Still Bay points very rarely exhibit impact
fractures and this is only apparent at open sites. Raw material choices are specific
for fine-grained/durable stone. Bifacial thinning flakes are consistently present
and show a significant difference from other recognized MSA lithic industries.
Reduction sequences from flake-blades are readily apparent and some reduction
from bifacial cores can be inferred by the large crude bifacial points present in

132some assemblages and the package size limitations (small water-borne cobbles) of
some of the preferred raw materials.
Howiesons Poort-like material, such as backed pieces, are weakly (but
persistently) associated with assemblages containing Still Bay bifacial points.
This may be due to the use of similar parts of the landscape by Howiesons Poort
and Still Bay peoples, by the deposits of each having been laid down close in
time, or by backed pieces originating earlier in the MSA than the Howiesons
Poort sub-stage. It should be noted that in the well-excavated sites of Blombos
Cave and Hollow Rock Shelter no backed pieces (excepting the previously
mentioned single eroded one at Hollow Rock) were recovered. Bone points are
securely associated with Still Bay bifacial points at Blombos Cave and that is the
only excavated Still Bay site with bone preservation. A single bone point
associated with Still Bay materials on the dune surface was collected by Heese at
Blombos Sands.
The stylistically distinct Still Bay bifacial points are regionally restricted to the
Cape Coast seaward of the Cape Fold Mountains. The Still Bay bifacial points
appear in assemblages that have a discrete temporal range of between ~70,000
and ~75,000 BP. Still Bay bifacial points were hafted and served as multi-
functional tools. The primary function of these bifacial points appears to have
been as knives with a secondary function as spear armatures. Some Still Bay

133bifacial points apparently functioned as symbols and symbolic behavior is
abundantly represented in other classes of artifacts associated with Still Bay
points.
Knowing what we now know about the timing and the use of symbols during the
Still Bay, largely from the remarkable finds and modern excavation of Blombos
Cave, the observations of the earliest professional archaeologists in southern
Africa have a new resonance. They believed that the Still Bay unquestionably
marked the arrival of modern peoples in the subcontinent (Burkitt 1928).
Although off by an order of magnitude on the timing of this technological period
and biased toward a European origin, their basic conclusion is valid: That the
makers of these artifacts exhibited the highest level of flintknapping skill, that the
techniques used in their manufacture was undoubtedly “modern”, and the people
that made and used these tools were “us”.
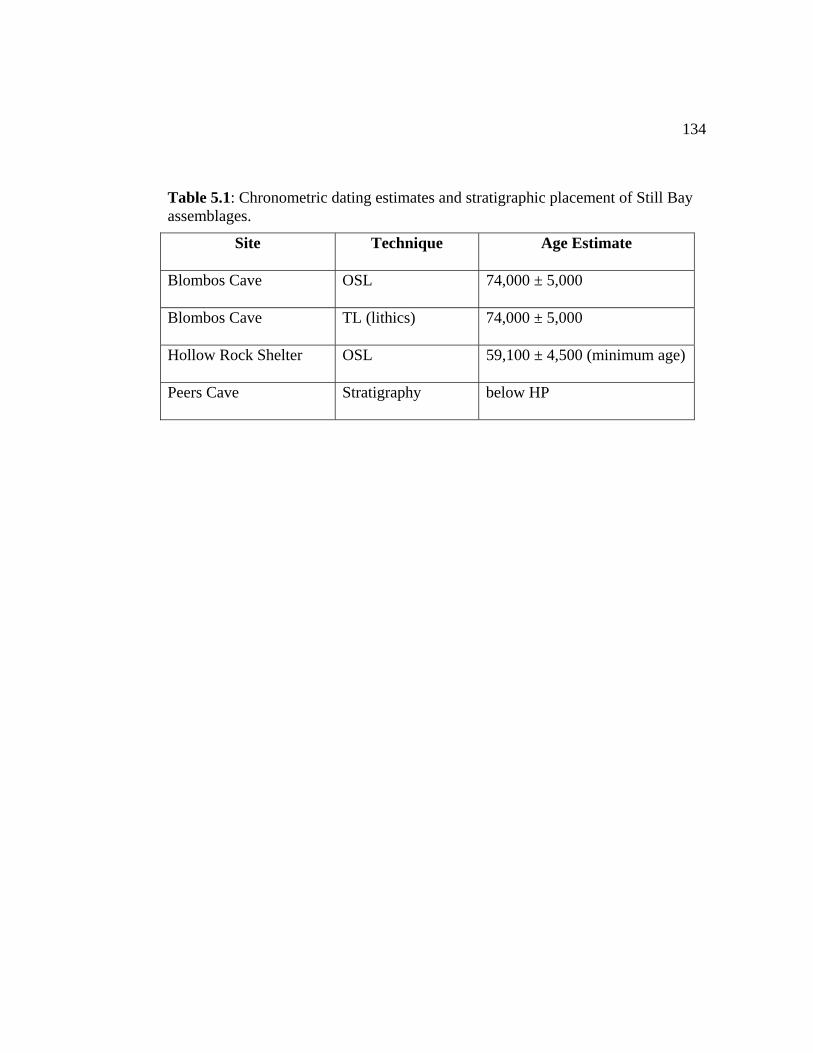
134
Table 5.1: Chronometric dating estimates and stratigraphic placement of Still Bay assemblages.
Site Technique Age Estimate
Blombos Cave OSL 74,000 ± 5,000
Blombos Cave TL (lithics) 74,000 ± 5,000
Hollow Rock Shelter OSL 59,100 ± 4,500 (minimum age)
Peers Cave Stratigraphy below HP
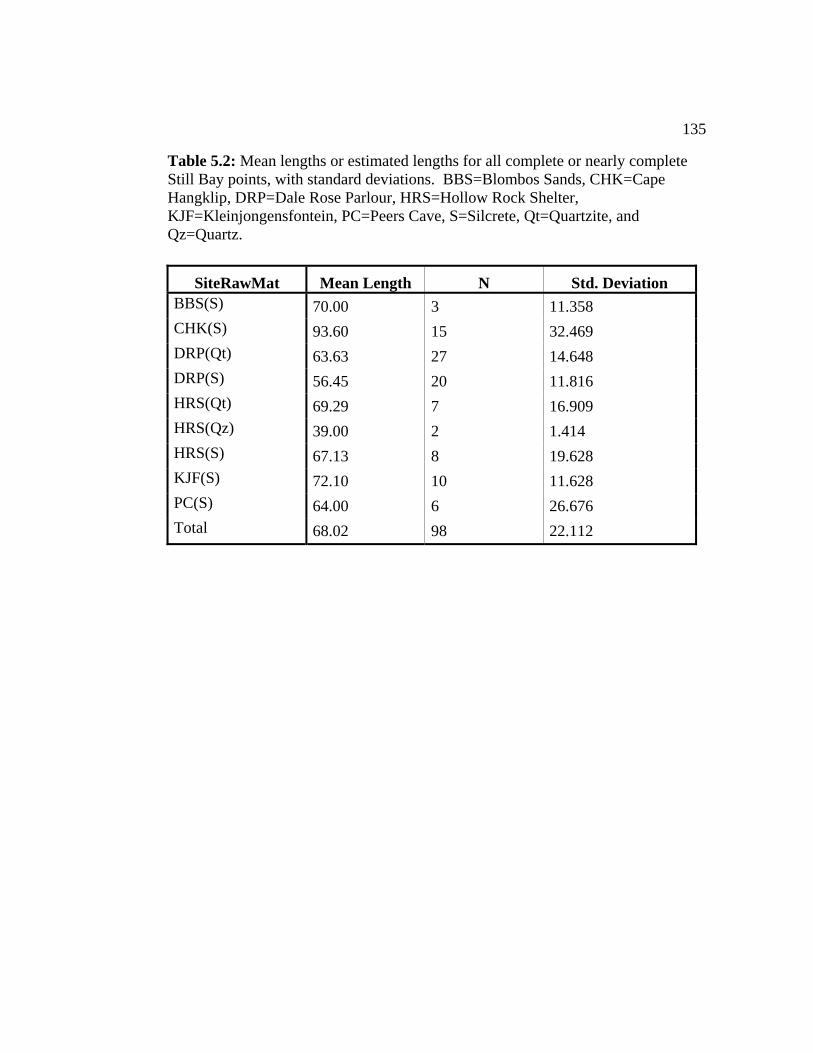
135
Table 5.2: Mean lengths or estimated lengths for all complete or nearly complete Still Bay points, with standard deviations. BBS=Blombos Sands, CHK=Cape Hangklip, DRP=Dale Rose Parlour, HRS=Hollow Rock Shelter, KJF=Kleinjongensfontein, PC=Peers Cave, S=Silcrete, Qt=Quartzite, and Qz=Quartz.
SiteRawMat Mean Length N Std. Deviation BBS(S) 70.00 3 11.358 CHK(S) 93.60 15 32.469 DRP(Qt) 63.63 27 14.648 DRP(S) 56.45 20 11.816 HRS(Qt) 69.29 7 16.909 HRS(Qz) 39.00 2 1.414 HRS(S) 67.13 8 19.628 KJF(S) 72.10 10 11.628 PC(S) 64.00 6 26.676 Total 68.02 98 22.112
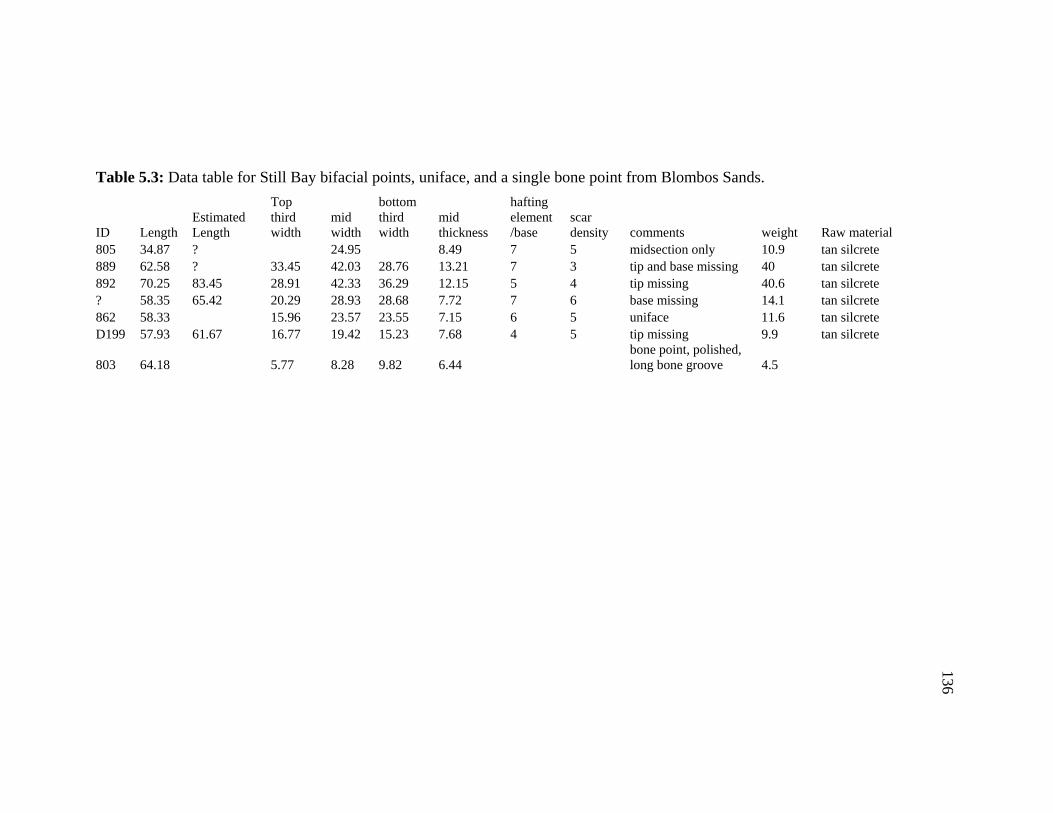
Table 5.3: Data table for Still Bay bifacial points, uniface, and a single bone point from Blombos Sands.
136
ID Length Estimated Length
Top third width
mid width
bottom third width
mid thickness
hafting element/base
scar density
comments weight Raw material805 34.87 ? 24.95 8.49 7 5 midsection only 10.9 tan silcrete889 62.58 ? 33.45 42.03 28.76 13.21 7 3 tip and base missing
40 tan silcrete
892 70.25 83.45 28.91 42.33 36.29 12.15 5 4 tip missing 40.6 tan silcrete? 58.35 65.42
20.29 28.93 28.68 7.72 7 6 base missing
14.1 tan silcrete
862 58.33 15.96 23.57 23.55 7.15 6 5 uniface 11.6 tan silcreteD199 57.93 61.67 16.77 19.42 15.23 7.68 4 5 tip missing 9.9 tan silcrete
803 64.18 5.77 8.28 9.82 6.44bone point, polished, long bone groove 4.5

Table 5.4: Dale Rose Parlour bifacial points.
137
Length Estimated Length
Top third width
mid width
bottom third width
mid thickness
hafting element/ base
scar density comments weight
Raw material
57.61 12.55
20.46 17.53
8.63 5 7resharpened to near mid-length 9.3 silcrete
26.87 ? 39.71 7.05 7 4 mid-fragment only 12.3 silcrete74.31 99.81
25.09 39.26 31.16
13.73 7 4 tip and base missing
46.6 quartzite
49.42 ?
19.35 30.27 12.83
7 3 base missing
15.3 quartzite 62.06 20.25 31.34
25.14 9.15 4 6 16.7 silcrete
51.43 57.93
17.88 27 25.96
13.67 7 2 unfinished 17.7 quartzite 43.74 ? 20.65
26.5 10.21 7 4 base missing
11.8 silcrete
55.22 18.5 23.66 21.2
6.26 5 4 10.7 silcrete44.15 ?
23.84 38.63 9.29 7 3 base missing
14.2 silcrete
55.69 23.71 28.09 25.89 9.91 6 4 16 quartzite 49.51 65.51
19.04 21.55
19.57
8.67
2 3 tip missing
10.2 silcrete33.77 14.78
7 6 tip only 3.5 silcrete
53.99 61.84
18.7 21.7
6.88
7 5 base missing
10.4 silcrete25.13 ? 15.98 7 5 tip only 2.2 silcrete44.31 60.7
17.45 21.31
20.28
9.11
4 3 tip missing
9.4 quartzite 33.22 ? 15.91 7 5 tip only 3.6 silcrete
29.81 ? 23.51
7 6 tip or base only 6.1 silcrete 20.97 ? 23.64 5.55 7 4 mid-fragment only 3.6 silcrete52.09 63.05
14.48 17.99 16.06 6.71 7 4 tip and base missing
6.5 silcrete
56.33 16.12 27.79 28.4
10.27
6 4 17.7 silcrete41.14 ? 15.99
21.29
9.27
7 4 base missing
7.7 silcrete49.94 ? 35.94 5 5 base only 14.8 silcrete
48.68 52.76
14.28 16.87
17.17
6.52
5 5tip missing, resharpening bevel
6.2 silcrete
36.22 ? 16.29 7 6 tip only 4.9 silcrete

138
Table 5.4 (continued)
39.05 ? 21.5 7 4 tip only 7.9 quartzite 30.42 ? 18.88
7 4 tip only 4.5 silcrete
47.4 ? 33.9 29.88
12.9 3 4 tip missing 20.3 quartzite59.48 72.31
18.19
27.21 26.5
10.26 7 5 base missing 15.9 quartzite 42.47 ? 25.99
10.86
7 4 mid-fragment only
15.9 silcrete22.23 ? 16.05
7 8 tip only 1.9 silcrete
21.56 ? 24.41 7.7 7 5 mid-fragment only 5.1 silcrete32.63 ? 23.88 9.07 7 5 mid-fragment only
9.3 silcrete
42.18 17.54
29.71 22.39
8.38 5 4 irregular biface 9.2 silcrete16.27 ? 20.86 6.89 7 5 mid-fragment only 2.9 silcrete40.56 ? 23.22 10.72
7 4 tip or base only
9.5 quartzite
51.27
65.01 14.11 20.86 22.46 8.21 7 5 base missing 11.2 quartzite41 43.83
12.79 19.73
20.55
9.95
6 5 tip missing
8.5 silcrete22.91 ? 14.62
7 7 tip only 1.9 silcrete
37.45 ? 23.52 19.17
8.24 3 5 tip missing 8.4 quartzite 20.84 ? 19.43 6.54 7 5 mid-fragment only 2.8 silcrete
31.64 ? 28.51 8.86 7 6 mid-fragment only
10.4 silcrete32.06 ?
21.75 20 8.06 4 5 tip missing 6.7 silcrete
30.33 12
16.02 16.01
5.53 5 6 irregular biface 2.8 silcrete37.05 ? 18.81 9.16 7 3 mid-fragment only 7.5 quartzite
37.79 ? 32.24 11.75 7 5 mid-fragment only
16.3 silcrete36.53 ? 19.17 15.99
5.88 4 6 tip missing 5.3 quartzite
30.41 ? 11.64
19.13
7.23
7 4 base missing
4 quartzite 16.71 ? 4 5 base only 1.5 silcrete
47.84 56.09
16.33
21.34 19.75 8.83 7 6 base missing
10.7 quartzite 34.35 ?
18.54 16.74 6.45 3 4 tip missing
4.3 silcrete
34.88 17.65
20.86
21.18
9.91
6 4 7.7 silcrete16.26 ? 22.1
7.9
7 5 mid-fragment only
3.3 silcrete21.12 ? 19.84
5 7 base only 2.7 silcrete
30.64 ? 19.97 7.32
7 5 mid-fragment only 5.7 silcrete34.56 ? 26.51 9.5 7 3 mid-fragment only 10.6 silcrete

139
Table 5.4 (continued)
31.12 ? 28.5
6.21
7 5 mid-fragment only
6.7 silcrete25.97 ? 19.05 4 5 base only 3.4 quartzite
27.28 ? 18.53 4 6 base only 3.3 silcrete
49.1 ?
26.44
26.19
6.98
7 5uniface, tip and base missing 14.6 silcrete
10.89 4 6 base only
0.7 silcrete54.78 18.8 23.54 21.9 6.24 6 3 10.7 silcrete48.58 53.7 14.31 17.31 17.01 6.37 5 4 tip missing 6.2 silcrete45.52 59.96
16.08 16.52 12.35 5.58 4 4 tip missing
5.5 silcrete
79.46 20.62 25.28 21.37 11.55 4 4 21.6 quartzite
60.07 12.86 19.66 16.27 11.05 3 5thick triangular cross-section 10.8 quartzite
80.94 22.04 27.96 23.59 7.18 3 6repaired break near distal end 16.9 silcrete
74.81 20.44 24.78 22.54 9.99 4 5
repaired at and resharpened to near mid-length 16.5 silcrete
83.73 86.37 21.95 29.52 21.69 8.13 7 6resharpened to near mid-length 20.4 quartzite
68.28 17.65 24.32 20.03 6.77 4 5resharpened to near mid-length 13 quartzite
69.67 23.98 25.84 23.54 8.38 3 6pot-lid?, resharpened to near mid-point 15.8 quartzite
72.29 84.08 27.07 34.38 32.99 13.05 7 5 uniface, base missing 31 silcrete
53.22 15.69 19.01 15.52 7.91 3 5resharpened to near mid-length
7.3 silcrete47.08 19.51 22.92 19.33 8.21 3 5 9 quartzite48.02 51.61 14.59 22.1 22.28 11.34 7 4 base missing
10.7 quartzite
69.71 72.26 20.29
22.14 19.1 14.63 4 4 tip missing 19.6 quartzite65.15 67.92 22.4 24.86 23.25 10.04 5 4 tip missing 16.5 quartzite47.35 51.7
14.24 17.52 14.73 5.95
7 5 tip and base missing
5.2 quartzite
57.21 13.04 20.32 17.56 7 4 3 8.2 quartzite
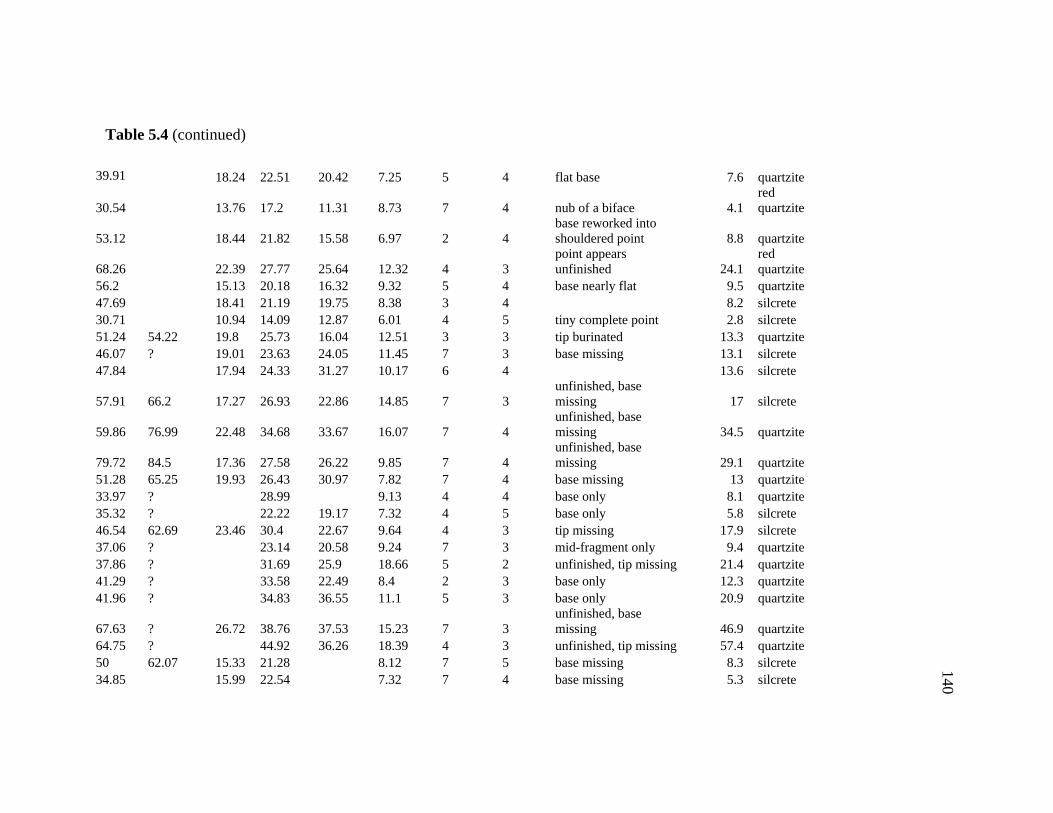
140
Table 5.4 (continued)
39.91 18.24 22.51 20.42 7.25 5 4 flat base 7.6 quartzite
30.54 13.76 17.2 11.31 8.73 7 4 nub of a biface 4.1 red quartzite
53.12 18.44 21.82 15.58 6.97 2 4base reworked into shouldered point 8.8 quartzite
68.26 22.39 27.77 25.64 12.32 4 3point appears unfinished 24.1
red quartzite
56.2 15.13 20.18 16.32 9.32 5 4 base nearly flat
9.5 quartzite 47.69 18.41 21.19 19.75 8.38 3 4 8.2 silcrete
30.71 10.94
14.09 12.87 6.01 4 5 tiny complete point
2.8 silcrete 51.24 54.22
19.8 25.73 16.04 12.51 3 3 tip burinated 13.3 quartzite
46.07 ?
19.01 23.63 24.05 11.45 7 3 base missing
13.1 silcrete47.84 17.94 24.33 31.27 10.17 6 4 13.6 silcrete
57.91 66.2 17.27 26.93 22.86 14.85 7 3unfinished, base missing 17 silcrete
59.86 76.99 22.48 34.68 33.67 16.07 7 4unfinished, base missing 34.5 quartzite
79.72 84.5 17.36 27.58 26.22 9.85 7 4unfinished, base missing 29.1 quartzite
51.28 65.25
19.93
26.43 30.97
7.82 7 4 base missing
13 quartzite33.97 ? 28.99 9.13 4 4 base only 8.1 quartzite
35.32 ? 22.22
19.17 7.32 4 5 base only 5.8 silcrete46.54 62.69
23.46
30.4 22.67 9.64 4 3 tip missing 17.9 silcrete37.06 ? 23.14 20.58 9.24 7 3 mid-fragment only 9.4 quartzite37.86 ? 31.69 25.9 18.66
5 2 unfinished, tip missing
21.4 quartzite
41.29 ? 33.58 22.49 8.4 2 3 base only 12.3 quartzite41.96 ? 34.83 36.55 11.1 5 3 base only 20.9 quartzite
67.63 ? 26.72
38.76 37.53 15.23 7 3unfinished, base missing 46.9 quartzite
64.75
? 44.92 36.26
18.39 4 3 unfinished, tip missing
57.4 quartzite50 62.07
15.33 21.28 8.12 7 5 base missing 8.3 silcrete
34.85 15.99 22.54 7.32 7 4 base missing 5.3 silcrete
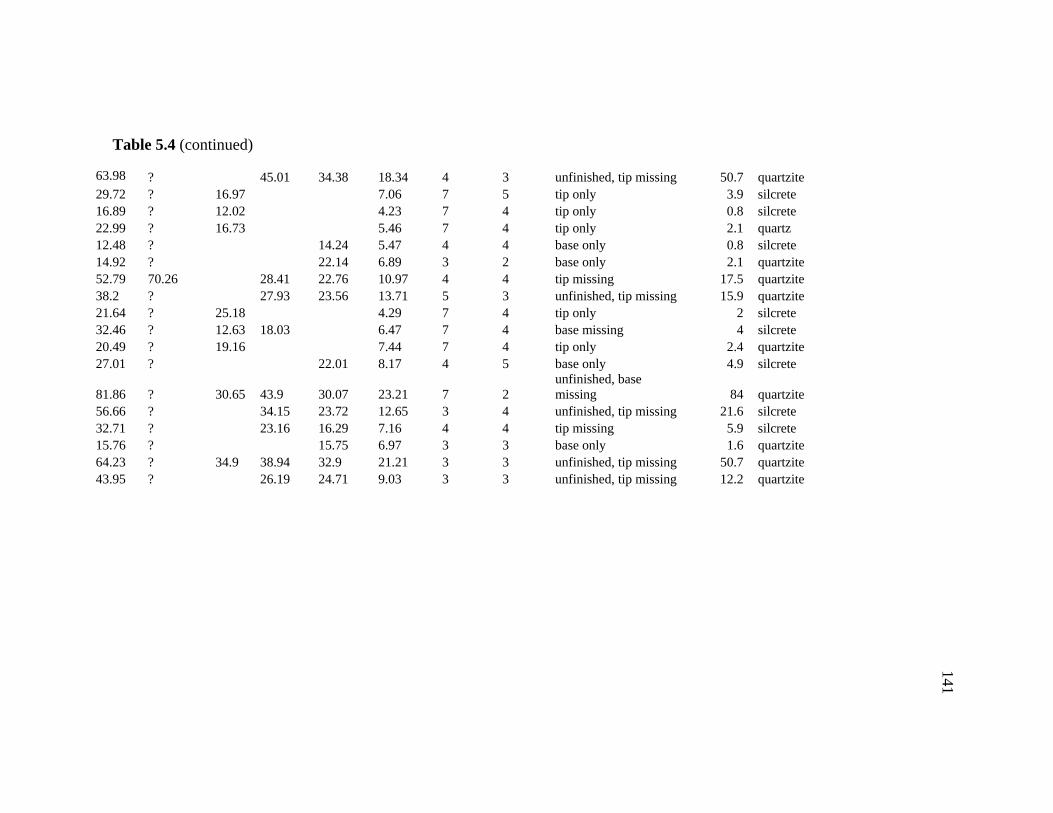
141
Table 5.4 (continued)
63.98 ? 45.01
34.38
18.34 4 3 unfinished, tip missing
50.7 quartzite 29.72 ? 16.97 7.06 7 5 tip only 3.9 silcrete
16.89 ? 12.02 4.23 7 4 tip only 0.8 silcrete 22.99 ? 16.73
5.46 7 4 tip only 2.1 quartz
12.48 ? 14.24 5.47 4 4 base only 0.8 silcrete14.92 ? 22.14 6.89 3 2 base only 2.1 quartzite52.79 70.26
28.41 22.76 10.97 4 4 tip missing 17.5 quartzite
38.2 ? 27.93
23.56
13.71 5 3 unfinished, tip missing
15.9 quartzite 21.64 ? 25.18 4.29 7 4 tip only 2 silcrete
32.4620.49
??
12.63 18.03
6.47 7 4 base missing
4 silcrete19.16
7.44 7 4 tip only 2.4 quartzite 27.01 ? 22.01 8.17 4 5 base only 4.9 silcrete
81.86 ? 30.65
43.9 30.07 23.21 7 2unfinished, base missing 84 quartzite
56.66 ? 34.15 23.72 12.65 3 4 unfinished, tip missing
21.6 silcrete32.71 ? 23.16
16.29 7.16 4 4 tip missing
5.9 silcrete
15.76 ? 15.75 6.97 3 3 base only 1.6 quartzite64.23 ? 34.9
38.94 32.9 21.21 3 3 unfinished, tip missing 50.7 quartzite
43.95 ? 26.19 24.71 9.03 3 3 unfinished, tip missing 12.2 quartzite

Table 5.5: Cape Hangklip bifacial points.
142
Length Estimated Length
Top third width
mid width
bottom third width
mid thickness
hafting element/base
scar density comments weight
Raw material
137.27 27.57 33.14 28.05 14.08 2 5
hafted area from 64mm up from base, very nice point, resharpened with no bevel, wind polished, labeled "Cape Hangklip" and "16", from museum display 65.7
fine gray silcrete
126.02 149.77 31.9 42.09 40.43 16.33 7 4from museum case, base missing, wind polished 95.7
fine gray silcrete
137.2 180 38.34 50.35 38.05 15.56 7 3tip and base missing, heavy sand abrasion 166.7
gray silcrete
78.54 ? 34.59 52.4 16.01 7 4broken fragment reworked into scraper? 50.9
gray silcrete
100.45 104.8 32.18 42.59 33.8 16.45 4 4impact fracture on tip, heavy wind abrasion 63.7
fine gray silcrete
105.26 26.55 35.73 28.11 14.06 3 3 wind abraded 49.2light gray silcrete
119.32 132.53 33.33 41.59 33.05 14.94 7 4 base missing, heavy wind abrasion 77.5 light gray silcrete
78.4 90.51 25.44 29.75 26.25 9.69 7 6resharpening bevel, haft at midpoint, base and tip missing 27.3
fine gray silcrete
61.59 ? 21.62 26.89 9 7 5 impact fracture on tip, base missing
17.6 fine gray silcrete
57.83 18.56 26.07 22.12 10.35 4 5 15.4 quartz
73.87 79.66 17.42 26.68 22.1 10.5 7 52 pieces refit, manufacturing break at midpoint 23.2 quartz
87.31 94.1 28.71 39.09 28.36 13.01 7 5 base missing, heavy wind abrasion 46.2 gray silcrete
79.26 90.41 24.8 33.67 30.29 10.6 7 4 base missing 30.6gray silcrete
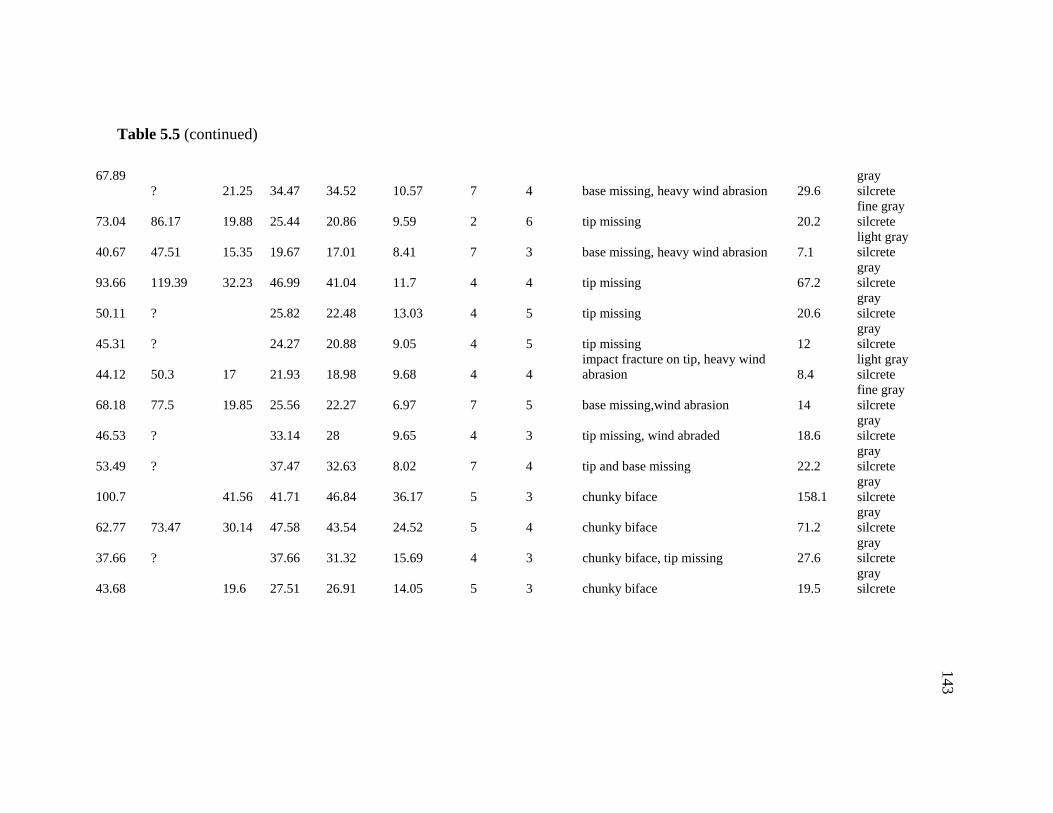
143
Table 5.5 (continued)
67.89 ? 21.25 34.47 34.52 10.57 7 4 base missing, heavy wind abrasion 29.6
gray silcrete
73.04 86.17 19.88 25.44 20.86 9.59 2 6 tip missing 20.2fine gray silcrete
40.67 47.51 15.35 19.67 17.01 8.41 7 3 base missing, heavy wind abrasion 7.1 light gray silcrete
93.66 119.39 32.23 46.99 41.04 11.7 4 4 tip missing 67.2gray silcrete
50.11 ? 25.82 22.48 13.03 4 5 tip missing 20.6gray silcrete
45.31 ? 24.27 20.88 9.05 4 5 tip missing 12gray silcrete
44.12 50.3 17 21.93 18.98 9.68 4 4impact fracture on tip, heavy wind abrasion 8.4
light gray silcrete
68.18 77.5 19.85 25.56 22.27 6.97 7 5 base missing,wind abrasion 14 fine gray silcrete
46.53 ? 33.14 28 9.65 4 3 tip missing, wind abraded 18.6 gray silcrete
53.49 ? 37.47 32.63 8.02 7 4 tip and base missing 22.2 gray silcrete
100.7 41.56 41.71 46.84 36.17 5 3 chunky biface 158.1gray silcrete
62.77 73.47 30.14 47.58 43.54 24.52 5 4 chunky biface 71.2gray silcrete gray
37.66 ? 37.66 31.32 15.69 4 3 chunky biface, tip missing 27.6 silcrete
43.68 19.6 27.51 26.91 14.05 5 3 chunky biface 19.5gray silcrete

Table 5.6: Cape Hangklip unifacial points.
144
Length Estimated Length
Top third width
mid width
bottom third width
mid thickness
hafting element/base
scar density comments weight Raw material
Bulbar thinning?
Bifacial tip?
69.3 72.35 17.44 23.43 16.42 8.25 7 5base missing, wind abraded 14.6 tan silcrete yes yes
68.1 25.76 36.56 34.05 8.68 6 5 25.3fine gray silcrete yes no
63.36 ? 47.14 27.67 10.57 6 6tip missing, wind abraded 37.8
fine gray silcrete no n/a
49.38 19.76
30.7
29.52
11.46
6 5 wind abraded
16.6
fine gray silcrete no no
32.91 ? 22.5 9.64 7 5 tip 9.2 tan silcrete n/a yes
59 64.42 20.24 30.61 23.47 9.45 4 5impact fracture, wind abraded 19.5
fine gray silcrete yes n/a
49.09 ? 19.39 27.18 9.86 7 3base missing, wind abraded 15.6
fine gray silcrete n/a yes
34.11 ? 20.19 4.48 7 5
base missing, reworked into scraper 4.2
fine gray silcrete n/a yes
49.39 56.73 20.19 24 21.64 7.15 6 5 impact fracture 10.5fine gray silcrete yes n/a
61.4 ? 29.39 43.32 35.18 17.03 6 2tip missing, wind abraded 53 gray silcrete yes n/a
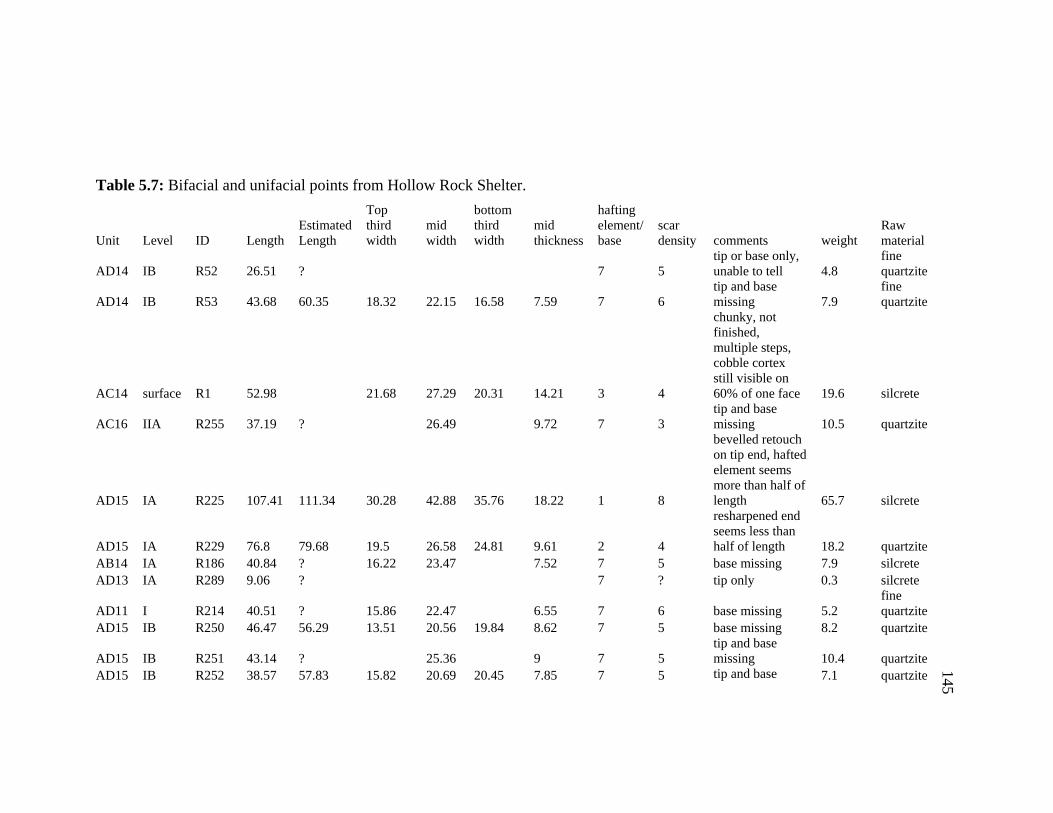
Table 5.7: Bifacial and unifacial points from Hollow Rock Shelter.
145
Unit Level ID Length Estimated Length
Top third width
mid width
bottom third width
mid thickness
hafting element/ base
scar density comments weight
Raw material
AD14 IB R52 26.51 ? 7 5tip or base only, unable to tell 4.8
fine quartzite
AD14 IB R53 43.68 60.35 18.32 22.15 16.58 7.59 7 6tip and base missing 7.9
fine quartzite
AC14 surface R1 52.98 21.68 27.29 20.31 14.21 3 4
chunky, not finished, multiple steps, cobble cortex still visible on 60% of one face 19.6 silcrete
AC16 IIA R255 37.19 ? 26.49 9.72 7 3tip and base missing 10.5 quartzite
AD15 IA R225 107.41 111.34 30.28 42.88 35.76 18.22 1 8
bevelled retouch on tip end, hafted element seems more than half of length 65.7 silcrete
AD15 IA R229 76.8 79.68
19.5 26.58 24.81
9.61 2 4
resharpened end seems less than half of length
18.2
quartzite
AB14 IA R186 40.84
? 16.22
23.47
7.52
7 5 base missing
7.9 silcreteAD13 IA R289 9.06 ? 7 ? tip only 0.3 silcrete
AD11 I R214 40.51 ? 15.86 22.47 6.55 7 6 base missing 5.2fine quartzite
AD15 IB R250 46.47 56.29 13.51 20.56 19.84 8.62 7 5 base missing 8.2 quartzite
AD15 IB R251 43.14 ? 25.36 9 7 5tip and base missing 10.4 quartzite
AD15 IB R252 38.57 57.83 15.82 20.69 20.45 7.85 7 5 tip and base 7.1 quartzite

146
Table 5.7 (continued)
missing
AD13 IA R287 39.32 ? 19.8 29.01 8.14 7 5tip and base missing 11.5 quartzite
AD13 IA R288 56.74 61
21.3 28.62 13.42
7 5 base missing 19.1
quartzite AD13 IA R285 28.59 ? 14.12 24.38 6.81 7 6 base missing 4.6 silcrete
AD13 IA R284 31.91 ? 12.69 20.47 5.88 7 7 base missing 3.7fine quartzite
AD13 IA R286 29.73 ? 18.6 5.93 7 6tip or base only, unable to tell 3.2 silcrete
AD13 IA R290 34.07 ? 26.47 9.34 7 5tip or base only, unable to tell 8.3 quartzite
AD13 IA R279 28.29 ? 7 6tip or base only, unable to tell 3.4 silcrete
AD16 IIA
R303 50.26 58.05 12.72
17.01 16.35 6.32 7 7 base missing
6.1 silcreteAC14 IB R207 87.25 102.61 30.1 41.24 36.54 15.53 4 5 tip missing 53.2 quartzite
AC14 IB R209 66.73 16.13 21.12 16.25 7.71 4 5tip has been reattached 10.3 quartzite
AC14 IB R215 59.29 71.05 16.1 19.03 15.54 7.45 7 4tip and base missing 9.9 silcrete
AD13 IB R297 24.48 ? 7 5tip or base only, unable to tell 3.3 quartzite
AD13 IB R292 22.35 ? 7 4tip or base only, unable to tell 3.1 quartzite
AD13 IB R291 20.08 ? 21.13 7.38 7 4tip and base missing 4 quartzite
AD16 I R302 63.98 70.28
16.75 21.77 18.36
7.49 3 8tip and base missing 11.8
silcrete
AD16 I R301 43.85 ? 13.65 19.47 6.85 7 5 base missing 6.3 silcrete
AD14 IA R3 42.95 ? 24.16 8.47 7 5
multiple steps, tip and base missing 8.5 quartzite
AD14 IA R4 32.08 ? 23.45 7.93 7 4tip and base missing 6.3 silcrete
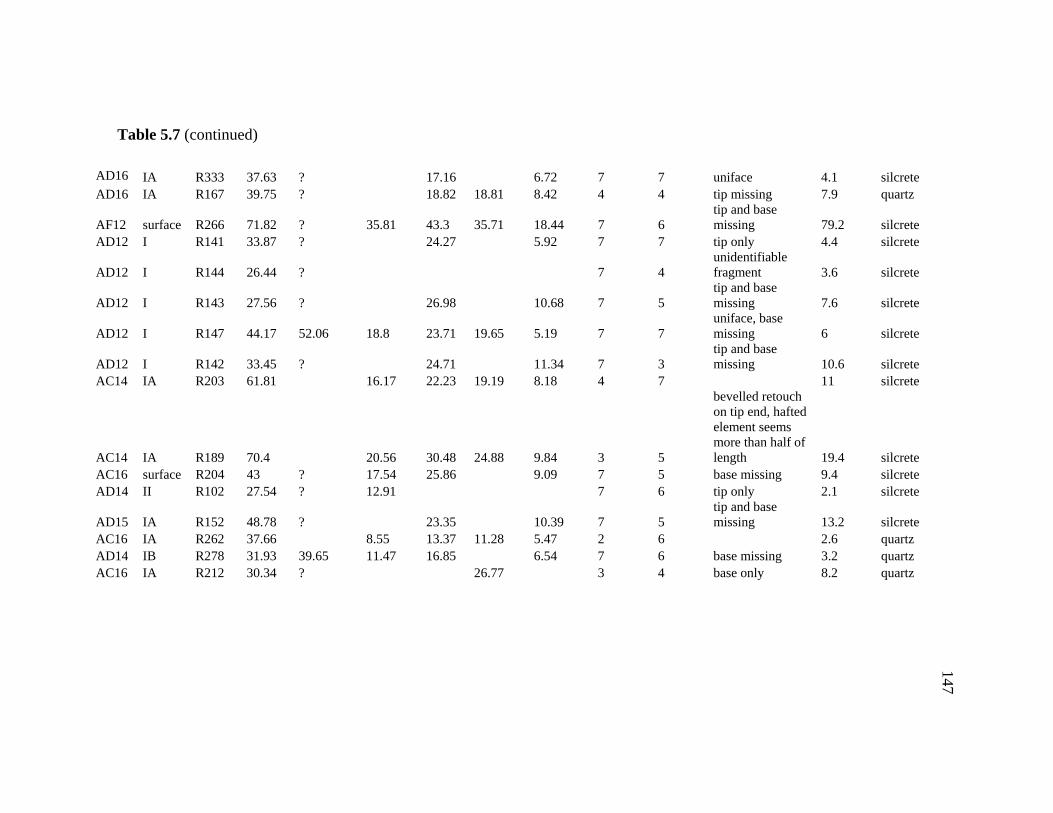
147
Table 5.7 (continued)
AD16 IA R333 37.63 ? 17.16 6.72 7 7 uniface 4.1 silcrete AD16 IA R167 39.75 ? 18.82 18.81 8.42 4 4 tip missing 7.9 quartz
AF12 surface
R266 71.82 ? 35.81
43.3 35.71
18.44
7 6tip and base missing
79.2
silcrete
AD12 I R141 33.87 ? 24.27 5.92 7 7 tip only 4.4 silcrete
AD12 I R144 26.44 ? 7 4unidentifiable fragment 3.6 silcrete
AD12 I R143 27.56 ? 26.98 10.68 7 5tip and base missing 7.6 silcrete
AD12 I R147 44.17 52.06 18.8 23.71 19.65 5.19 7 7uniface, base missing 6 silcrete
AD12 I R142 33.45 ?
24.71 11.34
7 3tip and base missing
10.6
silcreteAC14 IA R203 61.81 16.17 22.23 19.19 8.18 4 7 11 silcrete
AC14 IA R189 70.4
20.56 30.48 24.88
9.84 3 5
bevelled retouch on tip end, hafted element seems more than half of length 19.4 silcrete
AC16 surface
R204 43 ? 17.54 25.86
9.09
7 5 base missing
9.4 silcreteAD14 II R102 27.54 ? 12.91 7 6 tip only 2.1 silcrete
AD15 IA R152 48.78 ?
23.35 10.39
7 5tip and base missing
13.2
silcrete AC16 IA R262 37.66 8.55 13.37 11.28
5.47 2 6 2.6 quartz
AD14 IB R278 31.93 39.65
11.47
16.85
6.54
7 6 base missing
3.2 quartzAC16 IA R212 30.34 ? 26.77 3 4 base only 8.2 quartz

Table 5.8: Bifacial and unifacial points from Kleinjongensfontein.
148
ID Length Estimated Length
Top third width
mid width
bottom third width
mid thickness
hafting element/base
scar density comments weight
Raw material
D197 61.97 65.2 23.23 31.43 26.58 12.56 4 7 impact fracture on tip
27 brown chert D297? 59.58 67.81 19.08 25.59 28.11 10 7 5 base missing 18.6 tan silcrete
4590 54.11 62.86 22.75 26.95 24.89 8.04 7 6 base missing 12.8red-grey silcrete
? 65.96 70.86 25.82 30.67 23.75 6.91 3 6 impact fracture on tip
16.8 ironstone 4697
69.11 20.62
31.54 20.71 9.78 4 6 beveled retouch
20.8 tan silcrete? 53.06 ? 27.2 20.78 8.04 4 6 tip missing 14.9 tan silcrete
? 58.16 69.1 19.39
22.79
20.51 9.45 4 5 impact fracture on tip
15.3 red-tan silcrete
4467 37.52 ? 32.58 6.08 3 6 base only 8.8 chalcedony
D198
58.09 69.31
15.76 23.08 21.45 7.94 7 5 base missing 13.7 red-tan silcrete
? 56.76 ? 29.26 30.04 23.71 10.11 7 4 uniface, tip and base missing 22.1 tan silcrete
??08
49.39 ? 22.58 31.28 28.94 9.97 7 5 tip and base missing 18.1red-tan silcrete
? 65.11 ? 19.64
24.29 20.32
8.31 7 6 tip and base missing 20.2 grey silcrete 4695 28.15 ? 24.59 7.33 7 4 tip and base missing 7.9 tan silcrete
4699 63.22 ? 26.08 32.42
22.92 12.62 7 4 tip and base missing
29.7 quartzite4694 34.37 ? 16.87 7.35 7 5 tip only 5.3 tan silcrete
4664
39.17 ? 21.99 9.51 7 5 tip only 9.1 quartzite466? 42.37 ? 15.24 19.76 19.71 7.57 7 4 uniface, tip and base missing
8.2 tan silcrete
? 63.04 70.25 21.8 30.06 28.84 8.79 5 4 uniface, tip missing
19.5 tan silcrete? 62.93 ?
21.16 25.07 23.03 8.02 3 5 13.2 red silcrete
? 83.35 19.36 24.25 22.69 8.48 7 5 base missing 17.5 grey silcrete? 63.19 21.46 24.1 20.4 8.46 4 6 haft only 1/4 of length 13.2 tan silcrete ? 84.15 101.38 22.55 29.17 25.27 10.16 7 5 base and tip missing 31.5 tan silcrete
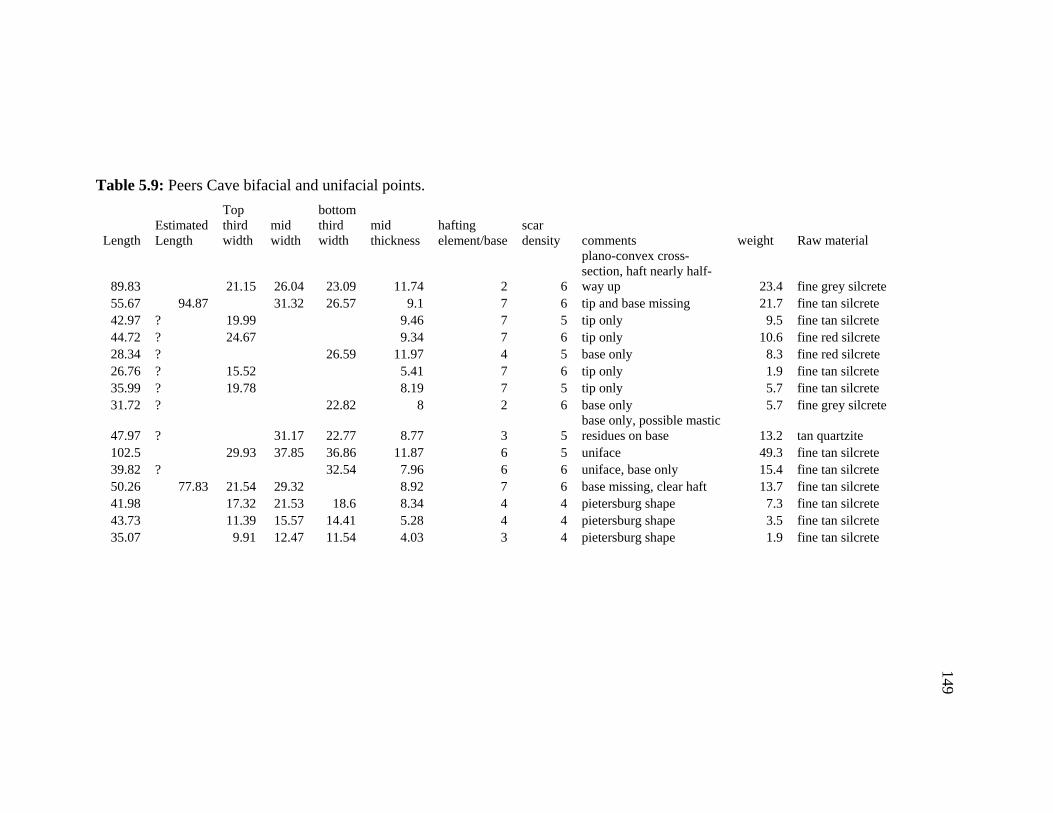
Table 5.9: Peers Cave bifacial and unifacial points.
149
Length Estimated Length
Top third width
mid width
bottom third width
mid thickness
hafting element/base
scar density comments weight Raw material
89.83 21.15 26.04 23.09 11.74 2 6
plano-convex cross-section, haft nearly half-way up 23.4 fine grey silcrete
55.67 94.87 31.32
26.57
9.1 7 6 tip and base missing
21.7 fine tan silcrete 42.97 ? 19.99 9.46 7 5 tip only 9.5 fine tan silcrete44.72 ? 24.67
9.34 7 6 tip only 10.6 fine red silcrete
28.34 ? 26.59 11.97 4 5 base only
8.3 fine red silcrete26.76 ? 15.52 5.41 7 6 tip only 1.9 fine tan silcrete35.99 ? 19.78
8.19 7 5 tip only 5.7 fine tan silcrete
31.72 ? 22.82 8 2 6 base only 5.7 fine grey silcrete
47.97 ?
31.17 22.77 8.77 3 5base only, possible mastic residues on base
13.2 tan quartzite
102.5 29.93
37.85
36.86 11.87 6 5 uniface 49.3 fine tan silcrete39.82 ? 32.54 7.96 6 6 uniface, base only 15.4 fine tan silcrete 50.26 77.83 21.54 29.32 8.92 7 6 base missing, clear haft
13.7 fine tan silcrete
41.98 17.32 21.53 18.6 8.34 4 4 pietersburg shape 7.3 fine tan silcrete43.73 11.39 15.57 14.41 5.28 4 4 pietersburg shape 3.5 fine tan silcrete35.07 9.91 12.47 11.54 4.03 3 4 pietersburg shape 1.9 fine tan silcrete

150
Site
ID Length
Estimated Length
Top third width
mid width
bottom third width
mid thickness
hafting element/base
scar density comments
weight Raw material
Blombos Bo D 207 167 200 37.23 48.79 46.91 8.47 7 5
collected by Heese, donated to SAM by HJ Deacon 22/11/01, extreme tip and base missing
87
very fine mottled gray silcrete
unknown Cape Ф 106.65 108.33 28.45 41.13 39.81
11.55 3 4
collected by JM Bain, extreme tip missing
48.9 very fine tan silcrete
Elandsfontein 8510 121.61 24.9 32.58 28.5213.12 6 5
collected 16/9/73 by R.G. Klein, tip broken in bag, base may not be platform, may be broken and reused.
53.5
mottled coarse silcrete
North of Clanwilliam 8846 65.79 ? 24.62 27.44 26.27 8.34 7 5
22.5 fine tansilcrete
Hangklip West
HKW 7429 69.78 90 26.76 30.06 27.86
10.26 7 5
surface collected, resharpened to middle of point, bevelling retouch apparent
30
mottled gray-orange silcrete
Peers Shelter B/102 66.5 87.36 21.15 26.09 12.83 7 3
contact with implement layer, unfinished point
24 grey quartzite
Elandsfontein EFT 88.59 23.05 32.61 21.84 13.6 1 3 collected by Jolly36.5 tan-red
quartzite
Table 5.10: Miscellaneous Still Bay bifacial points.

151
Figure 5.1: Map of southern Cape with Still Bay sites discussed in this chapter and the distribution of Still Bay bifacial points marked. Hollow Rock Shelter (HRS), Peers Cave (PC), Dale Rose Parlour (DRP), Skildergatkop (SGK), Cape Hangklip (CHK), Blombos Cave (BBC), Blombos Sands (BBS), and Kleinjongensfontein (KJF).
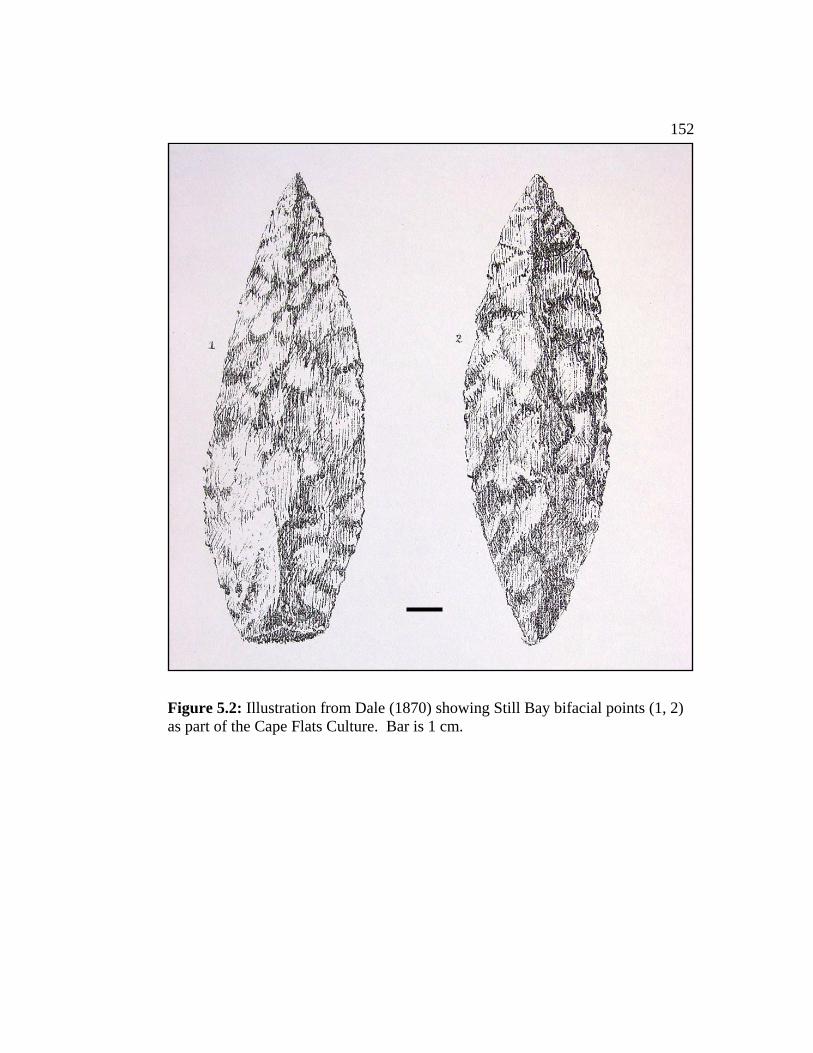
152
Figure 5.2: Illustration from Dale (1870) showing Still Bay bifacial points (1, 2) as part of the Cape Flats Culture. Bar is 1 cm.
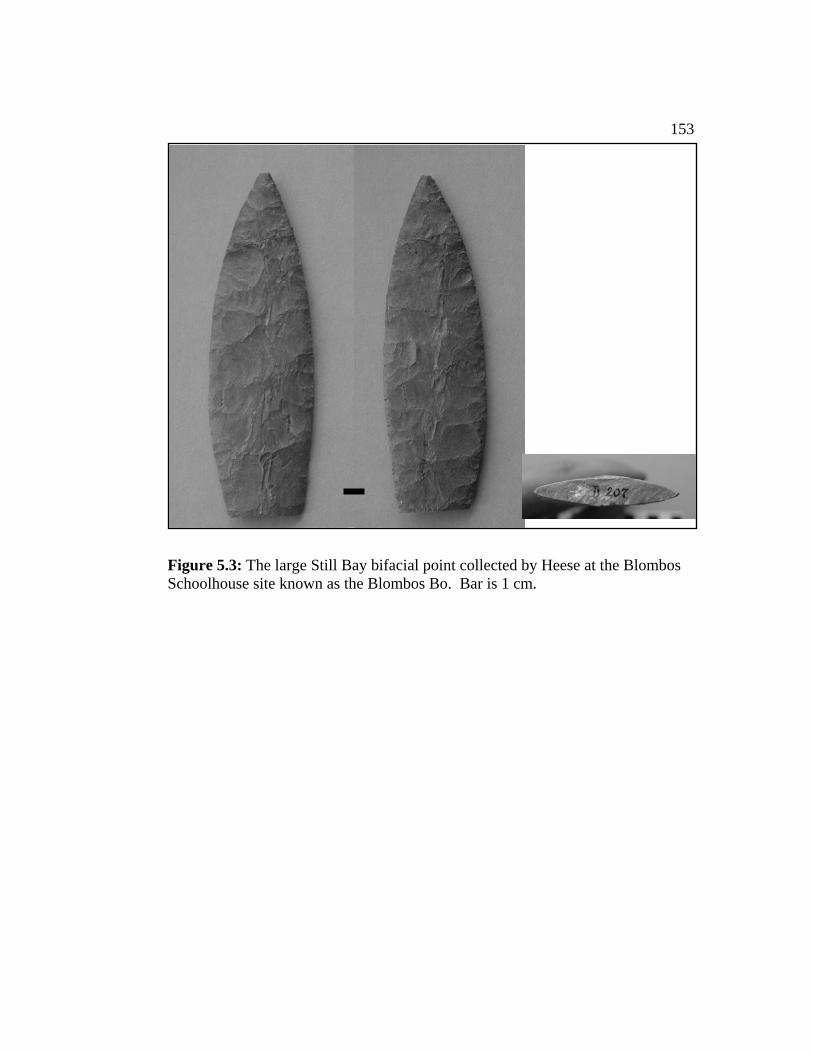
153
Figure 5.3: The large Still Bay bifacial point collected by Heese at the Blombos Schoolhouse site known as the Blombos Bo. Bar is 1 cm.

154
Figure 5.4: Bone point from the Heese collection of the Still Bay dune site of Blombos Sands. Bar is 1 cm.

155
Figure 5.5: Profile from Malan’s letter to Heese of the Still Bay site at Cape Hangklip. Heese papers at Iziko: South African Museum.

156
Figure 5.6: Aerial photographs of Cape Hangklip (World War II era) from the papers of Gatehouse on file at Iziko: South African Museum, Cape Town. Note the open and active sand dunes over much of the area at that time.

157
Figure 5.7: Small surface exposure of ESA site at Cape Hangklip, R. Yates for scale. Note heavy brush in background.

158
Figure 5.8: Still Bay artifacts from Malan’s collection at Cape Hangklip. Artifact labeled “7” is only one missing. From the Heese papers at Iziko: South African Museum.

159
Figure 5.9: Frans Malan’s plate of a worked ochre pencil from the Still Bay site at Cape Hangklip. Location of this artifact is currently unknown. From the Heese papers at Iziko: South African Museum.
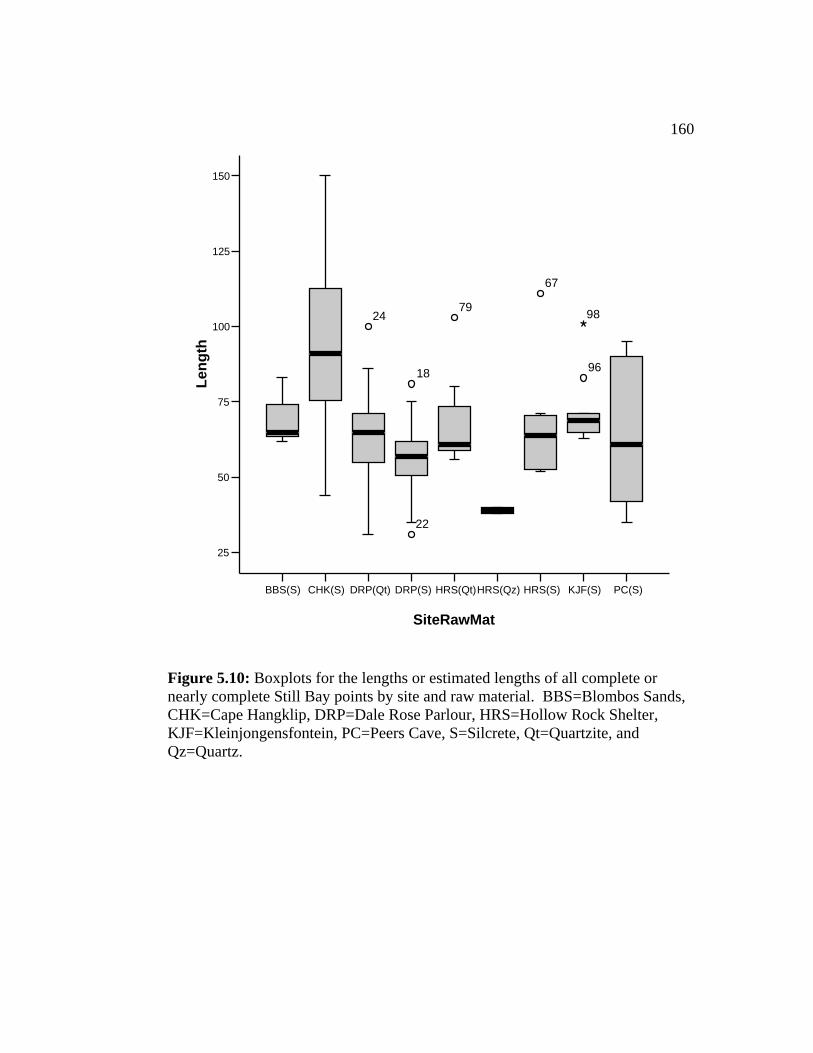
160
BBS(S) CHK(S) DRP(Qt) DRP(S) HRS(Qt)HRS(Qz) HRS(S) KJF(S) PC(S)
SiteRawMat
25
50
75
100
125
150
Leng
th
79
22
18
24
67
96
98
Figure 5.10: Boxplots for the lengths or estimated lengths of all complete or nearly complete Still Bay points by site and raw material. BBS=Blombos Sands, CHK=Cape Hangklip, DRP=Dale Rose Parlour, HRS=Hollow Rock Shelter, KJF=Kleinjongensfontein, PC=Peers Cave, S=Silcrete, Qt=Quartzite, and Qz=Quartz.

161
Figure 5.11: Unmodified quartz crystals from a single 1-meter square and 5-centimeter spit at Hollow Rock Shelter. Bar is 1 cm.
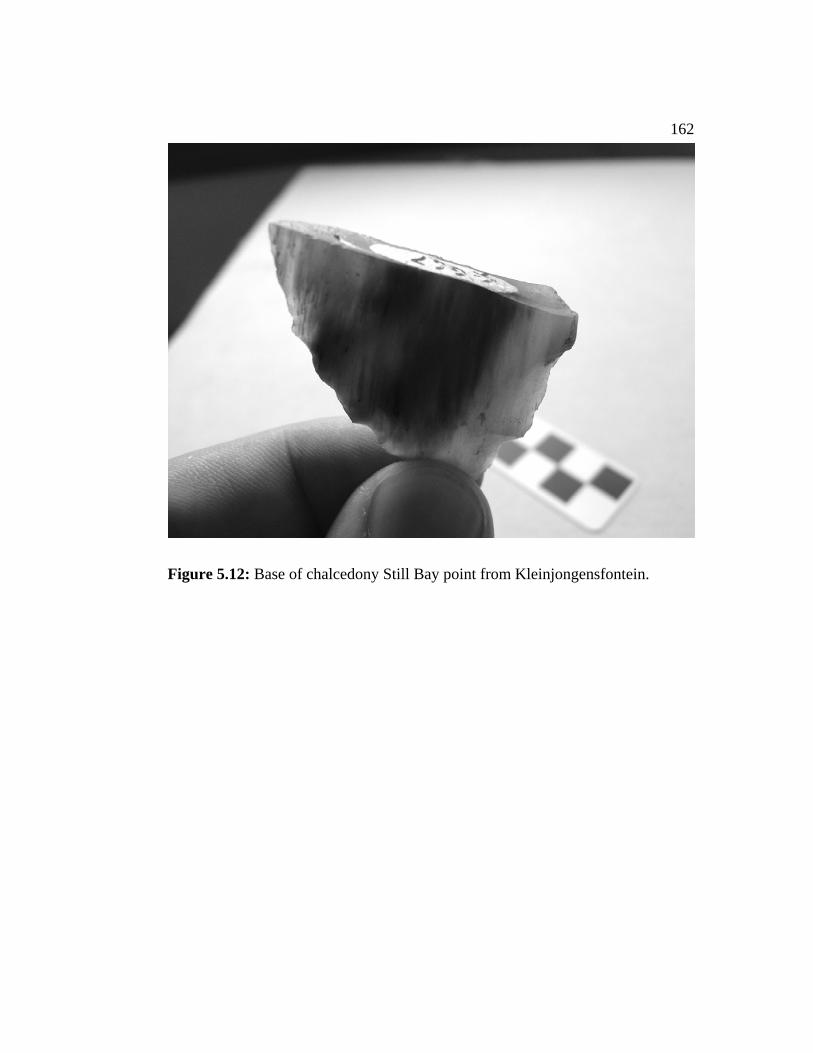
162
Figure 5.12: Base of chalcedony Still Bay point from Kleinjongensfontein.
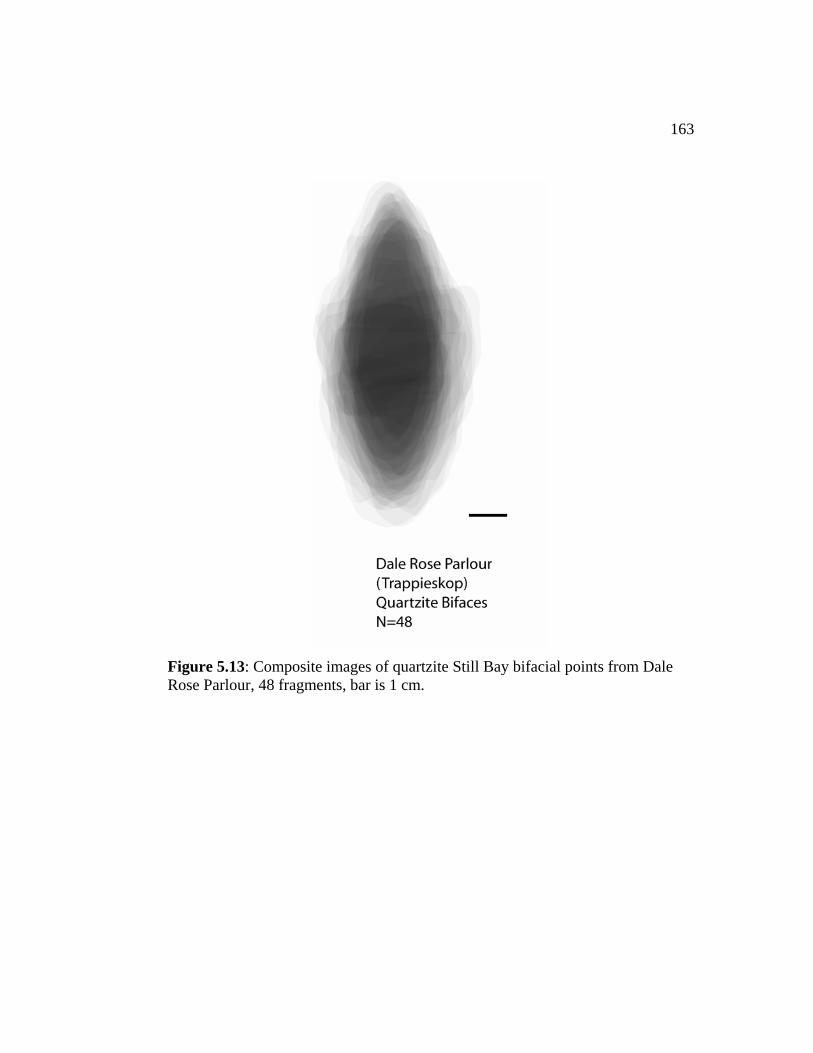
163
Figure 5.13: Composite images of quartzite Still Bay bifacial points from Dale Rose Parlour, 48 fragments, bar is 1 cm.
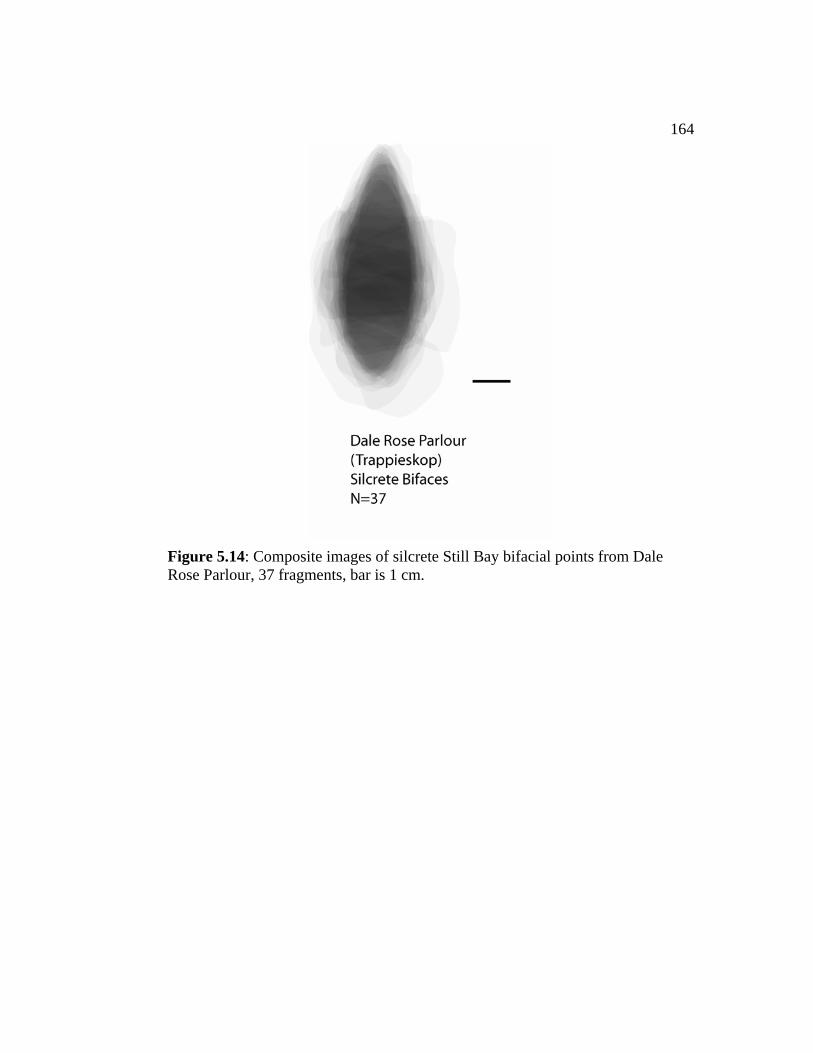
164
Figure 5.14: Composite images of silcrete Still Bay bifacial points from Dale Rose Parlour, 37 fragments, bar is 1 cm.
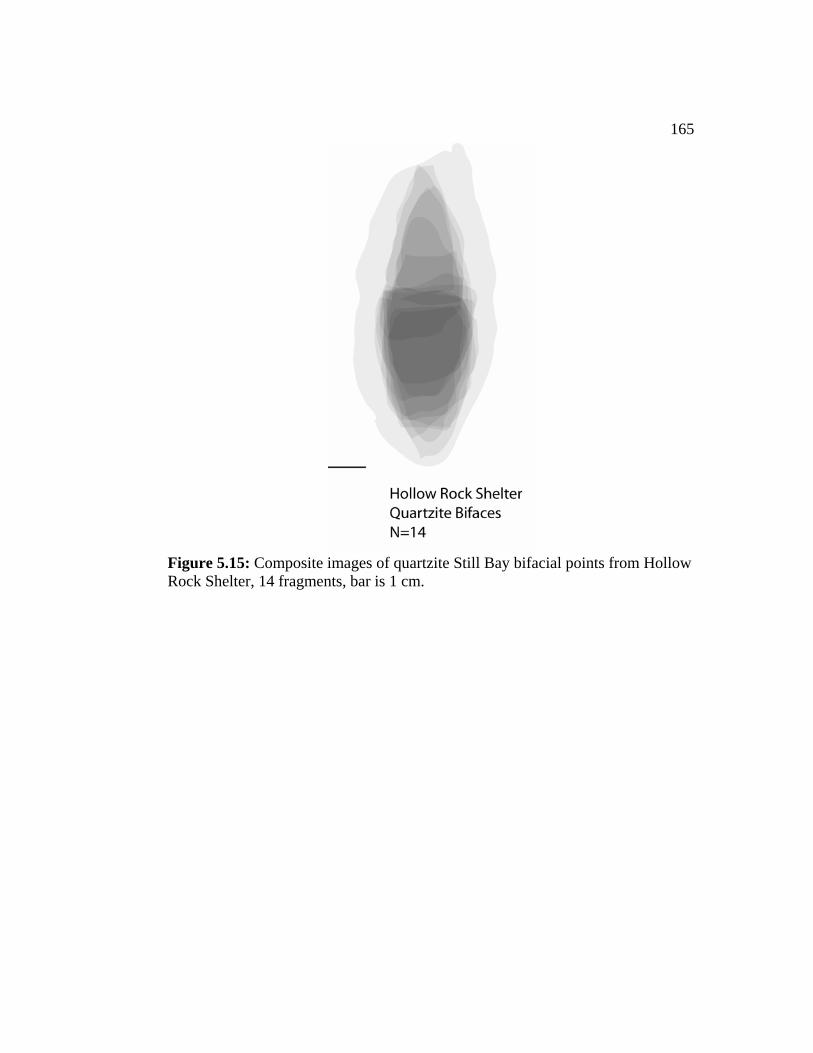
165
Figure 5.15: Composite images of quartzite Still Bay bifacial points from Hollow Rock Shelter, 14 fragments, bar is 1 cm.

166
Figure 5.16: Composite images of silcrete Still Bay bifacial points from Hollow Rock Shelter, 14 fragments, bar is 1 cm.

167
Figure 5.17: Composite images of quartz Still Bay bifacial points from Hollow Rock Shelter, 4 fragments, bar is 1 cm.
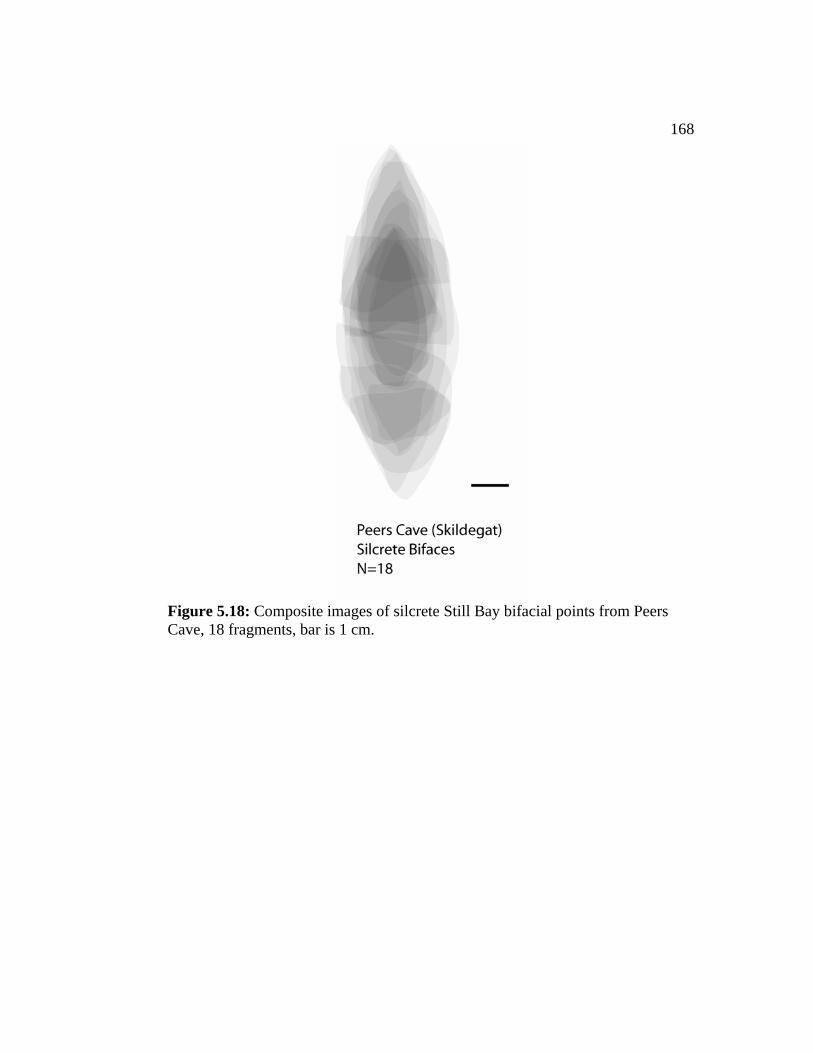
168
Figure 5.18: Composite images of silcrete Still Bay bifacial points from Peers Cave, 18 fragments, bar is 1 cm.
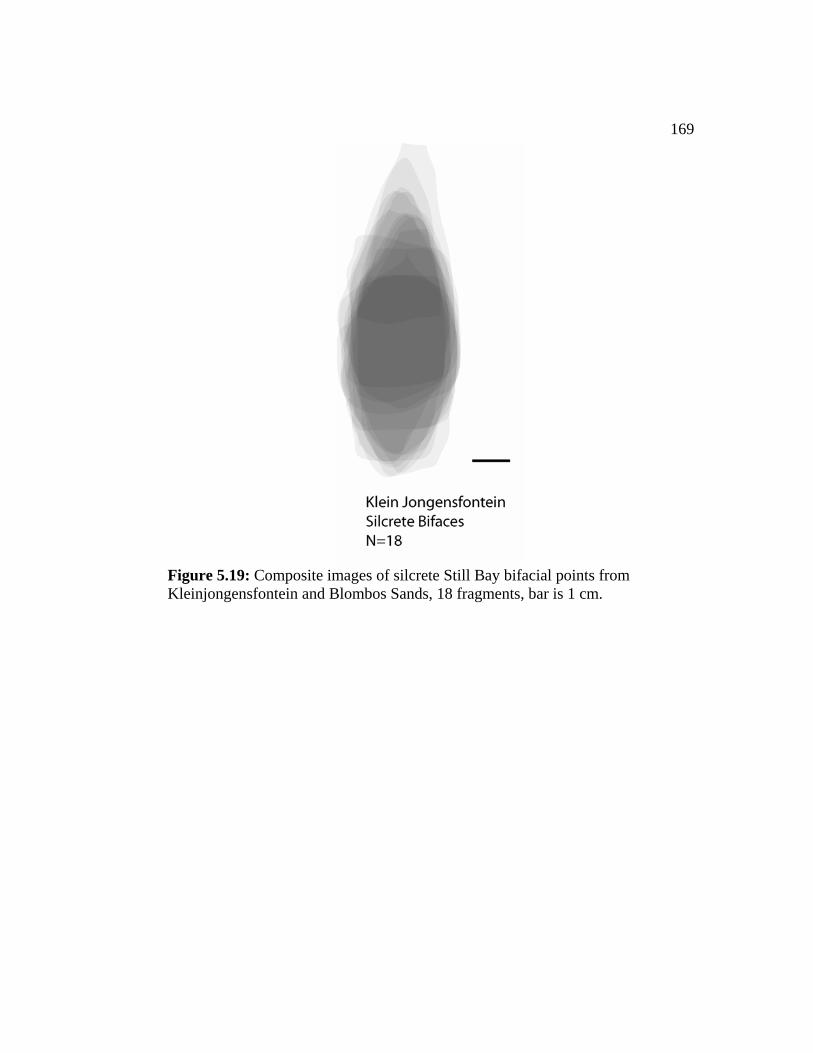
169
Figure 5.19: Composite images of silcrete Still Bay bifacial points from Kleinjongensfontein and Blombos Sands, 18 fragments, bar is 1 cm.

170
Figure 5.20: Composite images of silcrete Still Bay bifacial points from Cape Hangklip, 23 fragments, bar is 1 cm.
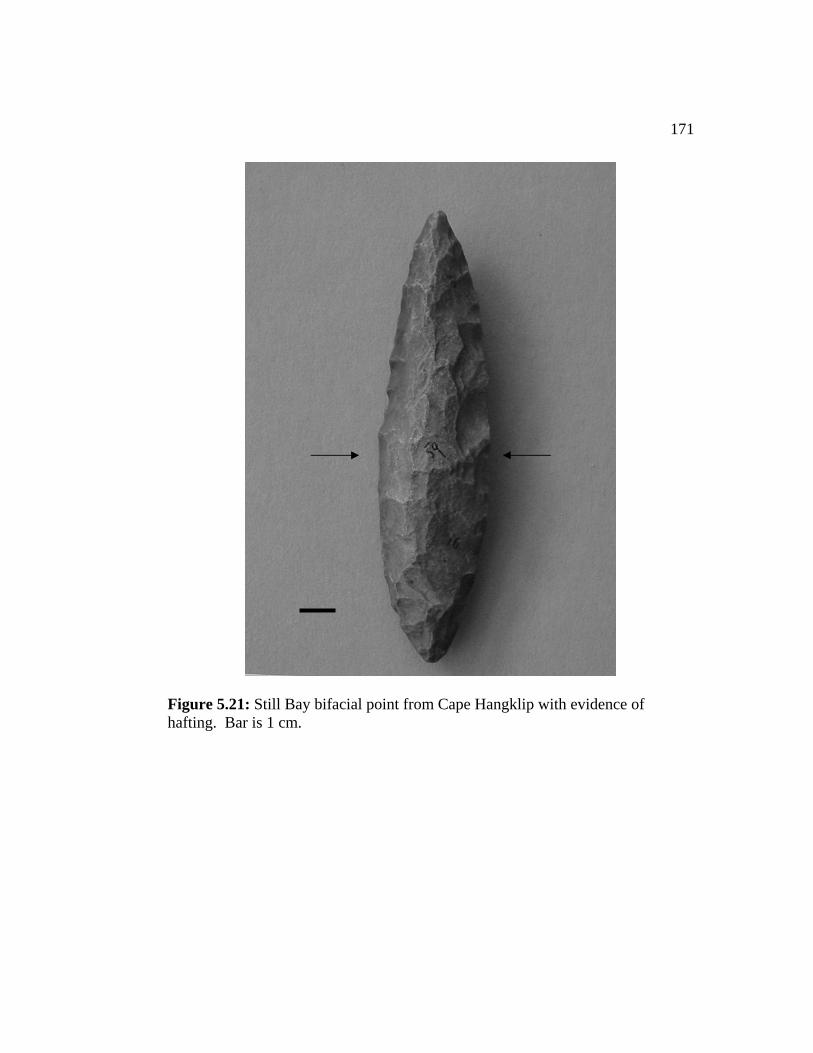
171
Figure 5.21: Still Bay bifacial point from Cape Hangklip with evidence of hafting. Bar is 1 cm.
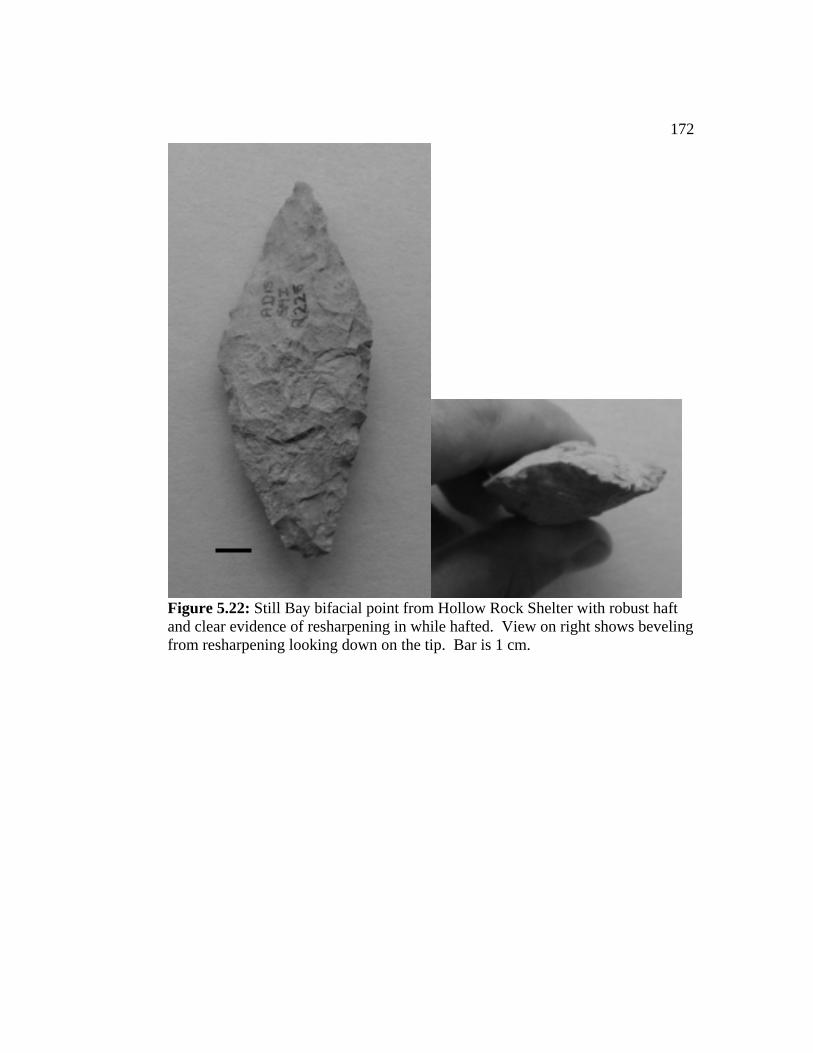
172
Figure 5.22: Still Bay bifacial point from Hollow Rock Shelter with robust haft and clear evidence of resharpening in while hafted. View on right shows beveling from resharpening looking down on the tip. Bar is 1 cm.

173
Figure 5.23: Silcrete Still Bay bifacial point from Kleinjongensfontein with impact fracture on the tip.
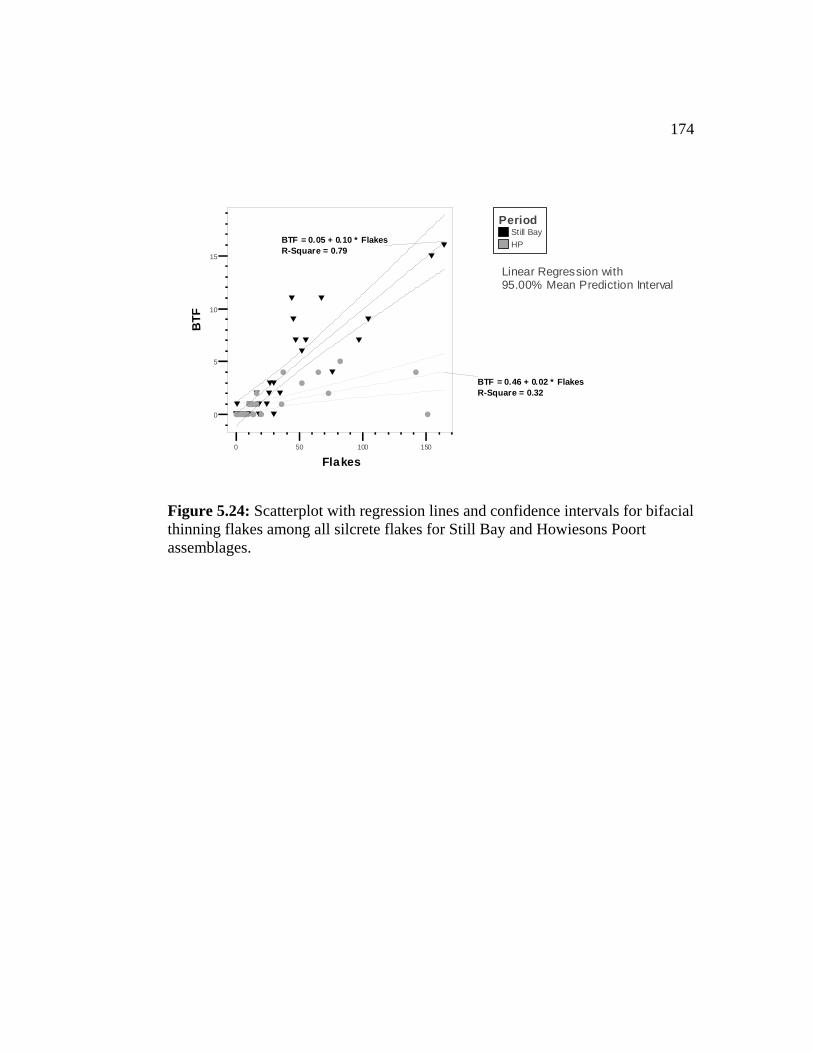
174
Still BayHP
Period
Linear Regression with95.00% Mean Prediction Interval
0 50 100 150
Flakes
0
5
10
15
BTF
YYYYYY
Y
YYYY
Y
Y
Y
Y
Y
Y
YY
Y
YY
YY
YY
Y
Y
YY
W
W WWW
WW
W
W
WW
W
W
W
W
W
WW
W WWWW
WWWWW WW
BTF = 0.05 + 0.10 * FlakesR-Square = 0.79
BTF = 0.46 + 0.02 * FlakesR-Square = 0.32
Figure 5.24: Scatterplot with regression lines and confidence intervals for bifacial thinning flakes among all silcrete flakes for Still Bay and Howiesons Poort assemblages.

175Chapter 6: Additional Investigations of the Howieson’s Poort Shelter
Collections
This brief chapter presents the findings of some additional work on the collections
from the Howieson’s Poort shelter, the name-bearing site for the sub-stage and
lithic industry of the MSA, housed at the Albany Museum in Grahamstown. The
main focus of this chapter is the description of a single artifact, what that artifact
means for MSA studies, and some suggestions to help solve the “unsolved
mystery” of the nature of that site (J. Deacon 1995:110).
Purpose and Background of the Study
I began studying the Howieson’s Poort shelter collections because I wanted a
debitage sample for comparison to those from Still Bay assemblages. The
Howieson’s Poort collection was well-suited in that the relationship between the
Howiesons Poort and Still Bay sub-stages are not fully resolved, the majority of
the Howieson’s Poort collections (those excavated by the Deacons) were
excavated using fine stratigraphic control and screens, and a high percentage of
the debitage is silcrete. It is also a site of historic importance in MSA
archaeology and I wanted first-hand experience with the artifacts from it.
The Howieson’s Poort shelter, located near Grahamstown in what is now the
Eastern Cape Province of South Africa, was originally excavated by Stapleton and
Hewitt in the 1920s (Figure 1.1). Their reports on that excavation (Stapleton and

176Hewitt 1928, 1929) led to the recognition of other similar artifact occurrences in
southern Africa and the application of the Howiesons Poort name as a type
(Goodwin and Van Riet Lowe 1929, Clark 1959) and now a sub-stage of the
MSA (Wurz 2002). The reports of their excavation lack much of the description
of methodology and context that would be considered minimal today and their
excavation notes at the Albany Museum today consist of a single page. Of the
thousands of artifacts that they excavated only two small boxes remain in the
collection of the museum. The whereabouts of the rest remains unknown. The
site is not mentioned in British Museum listings (Mitchell 2002b), which suggests
they may not have been dispersed to European museums – a fate that befell many
other early collections from Africa. The surviving boxes contain almost
exclusively retouched tools and other unusual artifacts, including some that were
not excavated by Stapleton and Hewitt. It is the contents of these boxes that were
the subject of numerous artifact illustrations in Janette Deacon’s (1995) summary
of the work at that site.
As J. Deacon (1995) described, there are a number of unanswered questions at the
Howieson’s Poort shelter that remain today. Hilary and Janette Deacon undertook
a new excavation in 1965 in the hopes of addressing some of those questions,
importantly the placement of the Howiesons Poort sub-stage in the MSA and
dating (radiocarbon was still the only viable method at that time) of the site’s
deposits. Deacon and Deacon re-excavated the site in four five-foot squares
177through several layers of archaeological deposits. The general descriptions of
those layers roughly corresponded to those of Stapleton and Hewitt but the
artifacts recovered from them did not (J. Deacon 1995). In general, the backed
pieces that made the site notable were all but absent from the Deacons’
excavation. It is recorded that a single backed artifact came from the controlled
excavations inside the shelter (J. Deacon 1995). The scree slope at the mouth of
the shelter was also collected, providing the bulk of the artifacts in the collection
today, but the relationship of these artifacts to the deposits in the shelter remains
unclear. It was not known if these were the products of natural erosion, discards
from Stapleton and Hewitt’s work, or a combination of both. Either way, the
materials from the scree slope do conform generally to the Howiesons Poort type.
For the purposes of my study I chose to look at all of the materials from a single
five-foot square column. This would give me a sample with the thing that I
needed most, stratigraphic control. I chose the column that was thought to be
closest to Stapleton and Hewitt’s original excavation and provided the most layers
for analysis, square B4. I went through every bag containing artifacts from B4,
regardless of the label on the bag. In a similar way to the Still Bay debitage I
counted and weighed all of the silcrete flakes and small flaking debris and
characterized the bifacial thinning flakes within that debitage. The pattern in the
silcrete debitage (as discussed in the previous chapter) was clear. The debitage
nearest the bottom of the excavated column was the most bifacial, nearly the same

178as for Still Bay assemblages, and that from near the top of the column lacked
bifacial thinning flakes entirely.
An Alternative Interpretation
The nature of the assemblage excavated by Deacon and Deacon and its apparent
differences from the Stapleton and Hewitt assemblage was the main “unsolved
mystery” of the site (J. Deacon 1995:110). How could an assemblage from the
name-bearing site not resemble the type-assemblage at all? I suggest that
Stapleton and Hewitt excavated far more of the Howiesons Poort-bearing deposits
than their scanty surviving documents show. Guided by available documents, the
Deacons began excavations in the very reasonable belief that they were
investigating deposits equivalent to those in the original Hewitt and Stapleton
trench. An attempt at linking the two excavations directly with another trench
was, however, unsuccessful (J. Deacon 1995:112). However, if Stapleton and
Hewitt had dug away most, perhaps all of HP deposits in the shelter, that would
explain the apparent evenness of the surviving deposit first observed by the
Deacons. In this scenario, their meticulous and perfectly recorded excavations
would have penetrated beneath the excavations of Stapleton and Hewitt. This
would go some way to explain the difficulties they had in correlating their own
very precise and clear layer descriptions with those described by the earlier
excavators. This scenario would also go a long way to explaining the near total
absence of artifacts of the Howiesons Poort type in the Deacons’ assemblage, if it
179came from below the HP levels. The temporal trend in technological changes
apparent in the silcrete debitage, mentioned above, add strong support to this. It
is possible that the materials that the Deacons excavated were from an MSA sub-
stage intermediate between the Howiesons Poort sub-stage and the Still Bay sub-
stage. At the on-going University of Cape Town excavations at Diepkloof, a 30
cm deposit of MSA artifacts containing neither bifacial points or backed pieces
intervenes between the uppermost bifacial point and lowermost backed piece
(Parkington, personal communication). It is possible that the Deacons were
excavating in the equivalent cultural-stratigraphic horizon in Howieson’s Poort
Shelter, as suggested in Table 1.1, where it is tentatively assigned to the Die
Kelders sub-stage of the MSA, for want of a better alternative. Further testing of
this proposition will become possible when a direct comparison can be made with
the Diepkloof material.
The other aspect of the “mystery”, why the radiocarbon dates (all between 19,000
and 4,000 BP) are anomalously young for the MSA, requires further research not
yet undertaken. A planned radiocarbon assay directly from a diagnostic
Howiesons Poort artifact (see below) was not attempted due to the unsuitability of
the sample. All of the dates published from the shelter (J. Deacon 1995) were on
charcoal. There was very little organic preservation in the shelter and the
charcoal’s ages are so far off any for the MSA that they point to an LSA
component or natural fire. An obvious solution is to date remaining deposits in

180the shelter using single-grain OSL. This would still be problematic as the
remaining deposits could all have originally underlain the Howiesons Poort
deposits. If my supposition is correct, then age estimates in the 70 - 65,000 BP
range are to be expected. OSL would also be useful in assessing the state of the
remaining deposits (for example, whether they have been recently churned by
excavation activities). The presence of a micromorphologist at the time of the
OSL sampling would be prudent.
A Singular Find
While going through all of the artifacts from square B4 I encountered a singular
find. A small (38 mm long) silcrete blade (Figure 6.1, Table 6.1) stood out as
being unusual. To begin with it was a blade, with heavy platform preparation
typical of the Howiesons Poort sub-stage (Wurz 2000, personal communication)
and not an untrimmed flake, as its bag label indicated. Secondly, the blade
appeared to be “dirty”, with an adhering substance that was absent on all of the
other artifacts that I examined from that site. The artifact was excavated from
Square B4, layer 3 and labeled “65/14” (denoting the year of excavation and the
square and layer, no unique artifact number was given) and placed in a bag
labeled “Untrimmed Flakes”. A closer look under hand lens and low-power light
microscopy seemed to suggest that the adhering material was an adhesive that had
been used to haft the blade in antiquity. The residue is concentrated on the steep
lateral and obscures the underlying backing that is evident in examination of the
181ventral face (small scalloping). The opposing lateral, the working edge, exhibited
the most obvious usewear I have observed on a Howiesons Poort artifact. As is
typical of archaeology I “found” this blade the day before I was to return the
collections to the Albany Museum. I made arrangements to temporarily curate
the blade at the South African Museum and then I did the next obvious thing, I
asked for more money.
My request for additional funding from the Wenner-Gren Foundation was
coordinated with the Albany Museum staff, Dr. Lita Webley, director, and Dr.
Johann Binneman, head of archaeology. Dr. Bonnie Williamson, of the
University of the Witwatersrand and a residue specialist had observed the residue
under polarized light microscopy (Figure 6.2). She observed structures that were
consistent with starch grains (Williamson, personal communication). This led to
the development of a research program that had many parts and partners to
address the potential of this artifact.
Compositional analysis was undertaken using laser ablated inductively coupled
plasma mass spectroscopy (LC-ICP-MS) at the IIRMES laboratory at California
State University, Long Beach by Mr. John Dudgeon. Additional samples were
taken and sent to Dr. Curt Beck at the Amber Research Laboratory at Vassar
College. These were subjected to chemical dissolution tests and x-ray
fluorescence (XRF). The chemical dissolution tests indicated that the residue was
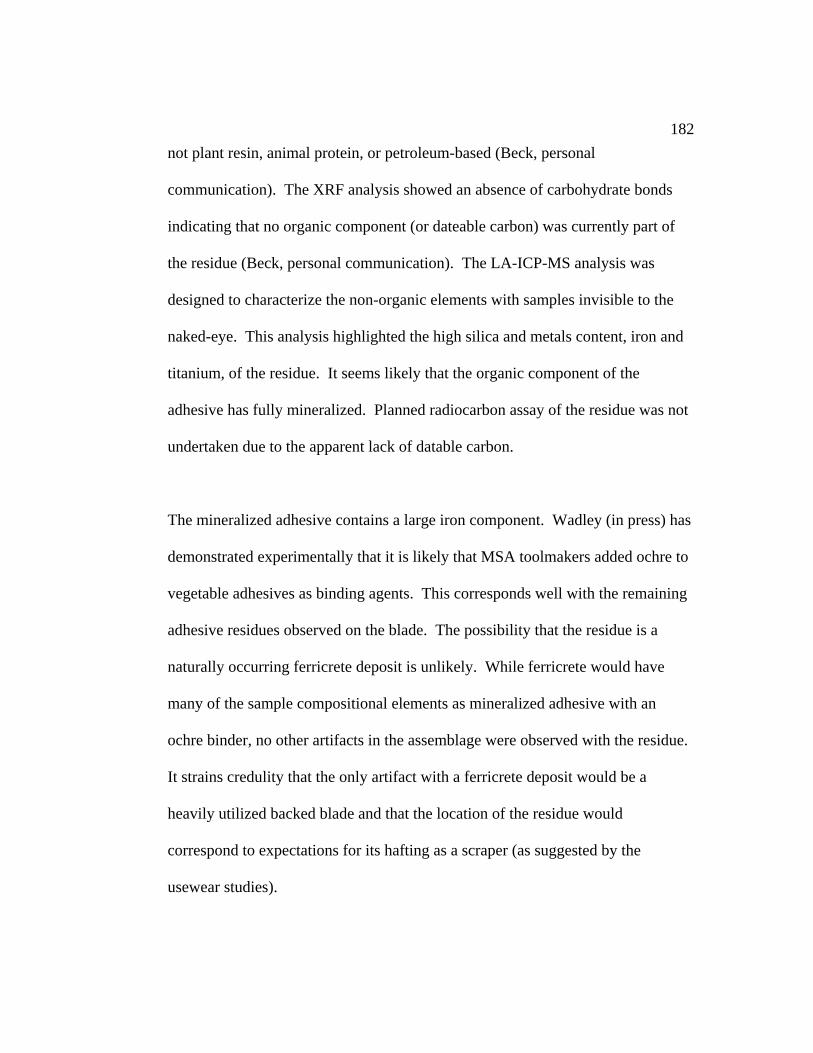
182not plant resin, animal protein, or petroleum-based (Beck, personal
communication). The XRF analysis showed an absence of carbohydrate bonds
indicating that no organic component (or dateable carbon) was currently part of
the residue (Beck, personal communication). The LA-ICP-MS analysis was
designed to characterize the non-organic elements with samples invisible to the
naked-eye. This analysis highlighted the high silica and metals content, iron and
titanium, of the residue. It seems likely that the organic component of the
adhesive has fully mineralized. Planned radiocarbon assay of the residue was not
undertaken due to the apparent lack of datable carbon.
The mineralized adhesive contains a large iron component. Wadley (in press) has
demonstrated experimentally that it is likely that MSA toolmakers added ochre to
vegetable adhesives as binding agents. This corresponds well with the remaining
adhesive residues observed on the blade. The possibility that the residue is a
naturally occurring ferricrete deposit is unlikely. While ferricrete would have
many of the sample compositional elements as mineralized adhesive with an
ochre binder, no other artifacts in the assemblage were observed with the residue.
It strains credulity that the only artifact with a ferricrete deposit would be a
heavily utilized backed blade and that the location of the residue would
correspond to expectations for its hafting as a scraper (as suggested by the
usewear studies).
183Usewear analysis was undertaken by Dr. Richard Fullagar, University of Sydney,
a specialist in usewear on silcrete artifacts. This was accomplished in two ways.
First, I utilized the environmental scanning electron microscope (eSEM) at the
IIRMES laboratory at California State University, Long Beach to obtain digital
images at between 50 and 1,500X magnification (Figure 6.3). The advantages of
eSEM for archaeological samples are that no coating (usually a gold-palladium
alloy) need be applied to the artifact for imaging and the sample is not introduced
to a vacuum. This means the analysis is non-destructive and the artifact does not
need to be cleaned prior to imaging. Secondly, the utilized edge was cast in
dental impression compound (Colténe Whaledent, Affinis™ light body
polyvinylsiloxane) (Figure 6.4). One impression and a complete set of eSEM
digital images were sent to Dr. Fullagar for analysis. A second impression was
kept in Seattle as a back-up. The usewear is consistent with the blade having been
hafted transversely and used as a scraper on wood (Fullagar, personal
communication). An example of a similar tool from the LSA is in the collections
of the South African Museum (Figure 6.5).
Fullagar’s complete description of the usewear follows:
I have cut the peel, following the edge itself, as closely as possible.
I examined the surface of the ventral side of the peel, and noted
dark specks of unidentified residues along the slightly rounded
edge. So it is relatively easy to microscopically follow the actual

184edge in several places. There are no clear striations that I could see,
but there are alignments (of smoothing or polish) that are oriented
transverse to the edge (on the proximal side of centre). There is
also more smoothing on the ventral surfaces relative to the dorsal
surfaces, several millimetres back from the edge. It is difficult to
assess function specifically just on the basis of the peel, in part
because very thin, greasy films on the artefact (perhaps from
handling) can simulate smoothing or polish at high magnification.
I think this is not the case here (in at least some places) because
details of depressions have a fine grainy appearance at high
magnification unlike the smoothed surfaces in immediately
adjacent areas. However, the degree of rounding and smoothing or
polish back from the edge, and the degree of scarring on the dorsal
surface indicate a relatively hard material and pressure downward
on the ventral (contact) surface. The dorsal scars appear from the
photo appear to have bending initiations (with no Hertzian impact
points). It is difficult to discern a clear net-like or reticular pattern,
but this does appear in some places more dominant than even
smoothing of the surfaces. The discontinuous rounding and
smoothing, the (rare) transverse alignments are all consistent with
wood scraping, at least as the dominant function. Sawing can
probably be eliminated because I would then expect clear
185longitudinal striations and alignments and more symmetrical wear
patterns (which are common on experimental tools that I have used
to saw grooves in wood and bone). Scraping hard wood often
causes step scars on the contact surface, but I could not see any on
the peel. [Fullagar, personal communication, 2005]
Previous explanations and descriptions of the Howiesons Poort backed blades and
segments have focused on their probable use as armatures for spears (Sampson
1974, Deacon and Deacon 1999). No Howiesons Poort lithic artifact has ever
been found in a hafted or composite tool context. It is further assumed that the
hafting was accomplished by using a resinous glue or “mastic” to attach the lithic
artifact to a wooden or bone handle (Deacon and Deacon 1999). Again, no
evidence for adhesive use has ever been found associated with Howiesons Poort
artifacts and evidence on MSA or Middle Paleolithic artifacts in general is either
very late (Boëda et al. 1996, Holdaway 1996) or weak. The analyses undertaken
and the context of the artifact suggest several things.
Firstly, the backed pieces of the Howiesons Poort can now be said to have been
hafted as part of composite tools based on some evidence. Secondly, the most
often assumed function of these composite tools has been as hunting weapons.
For the artifact discussed here, the only Howiesons Poort tool that shows evidence
of hafting and has been subjected to usewear analysis, a function as a wood

186scraper is most likely. This does not mean that other functions for Howiesons
Poort backed pieces will not be eventually demonstrated. The analyses of this one
artifact highlight how little evidence has been gathered on Howiesons Poort or
MSA tool function to date.
Possible Wider Implications
The recognition of a Howiesons Poort composite tool functioning as a scraper has
some implications for interpreting social dynamics. As long-speculated spear
armatures Howiesons Poort backed pieces were parts of “male” tools. This is
incorporated into both Deacon and Wurz’s (1996) model of reciprocal exchange
and Ambrose and Lorenz’s (1990) model of increased mobility. Scrapers are
extractive tools and as such “female”. This alone requires a reassessment of the
models of Howiesons Poort social dynamics. Taken a step further, it may have
been women who invented the “precocious” lithic technology of the Howiesons
Poort, not men. Deacon and Deacon (1999) proposed one possible scenario of
Howiesons Poort subsistence that included increased use of vegetable foods such
as corms and tubers. The composite scraper described here may have functioned
as a processing tool for just such food items, supporting the idea of the increased
importance of these. Together with the local nature of the raw materials used to
make them and the time intensive search for those materials (Chapter 4), the
speculated upon role of women and plant foods would radically alter our
interpretations of the Howiesons Poort.

187
Summary and Conclusions
A reexamination of a 40-year old lithic assemblage from the Howieson’s Poort
shelter was undertaken to provide some comparative data on bifacial thinning in
the MSA. This was easily enough accomplished and the comparison is
informative on differing reduction strategies during the Still Bay and Howiesons
Poort sub-stages that goes beyond formal tool typology. Additionally, a possible
solution to the “unsolved mystery” of why the 1965 excavation of the site yielded
an assemblage that bore no resemblance to the 1927 excavation assemblage is
proposed. The 1927 excavators (Stapleton and Hewitt) removed far more of the
MSA deposits than the 1965 excavators (Deacon and Deacon) supposed, meaning
the latter were excavating beneath the former.
In the course of examining the artifacts from the site an unusual backed blade was
identified in a bag labeled “Untrimmed Flakes”. A series of analyses of the
residues and usewear on the blade suggest it was hafted using a now fossilized
adhesive as part of a composite scraper used on soft wood. This demonstrates
both the first good evidence of the hafting of the backed pieces of the Howiesons
Poort and that they did not all function as spear armatures, as has long been
supposed. I make the speculative suggestion that this also has implications for the
gender of the tool makers and users at odds with existing models of Howiesons
Poort social dynamics.

188Table 6.1: Metrics of blade with adhesive. Howieson’s Poort Site 1965 Deacon and Deacon excavation, 65/14, “Untrimmed Flakes” bag, Square B4, 1’3”-9”-1’ Depth, “Root Layer”, Layer 3, 1/9/65, Albany Museum, Grahamstown.
Max
imum
di
men
sion
Len
gth
Wid
th
Thi
ckne
ss
Plat
form
W
idth
Pl
atfo
rm
Thi
ckne
ss
Plat
form
T
ype
Ter
min
atio
n
Wei
ght
Raw
M
ater
ial
38 38 13 4 7 4 Faceted, lipped
Feathered
2.0 Deep red fine-grained silcrete
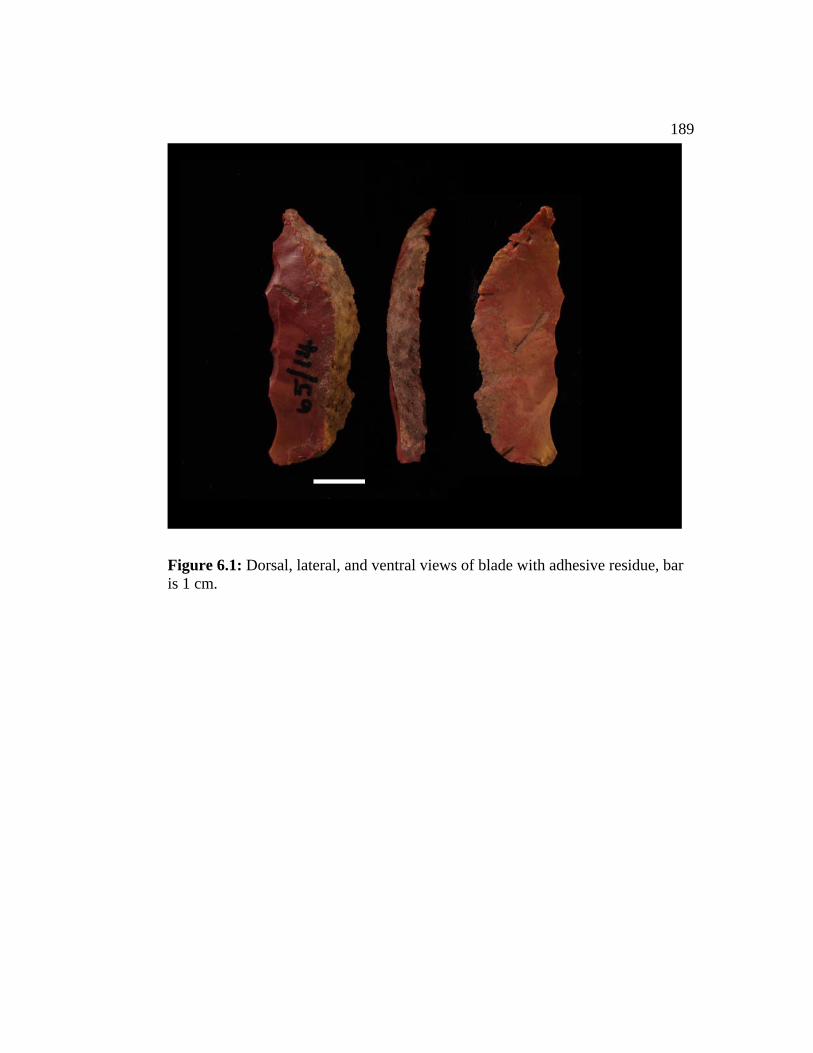
189
Figure 6.1: Dorsal, lateral, and ventral views of blade with adhesive residue, bar is 1 cm.
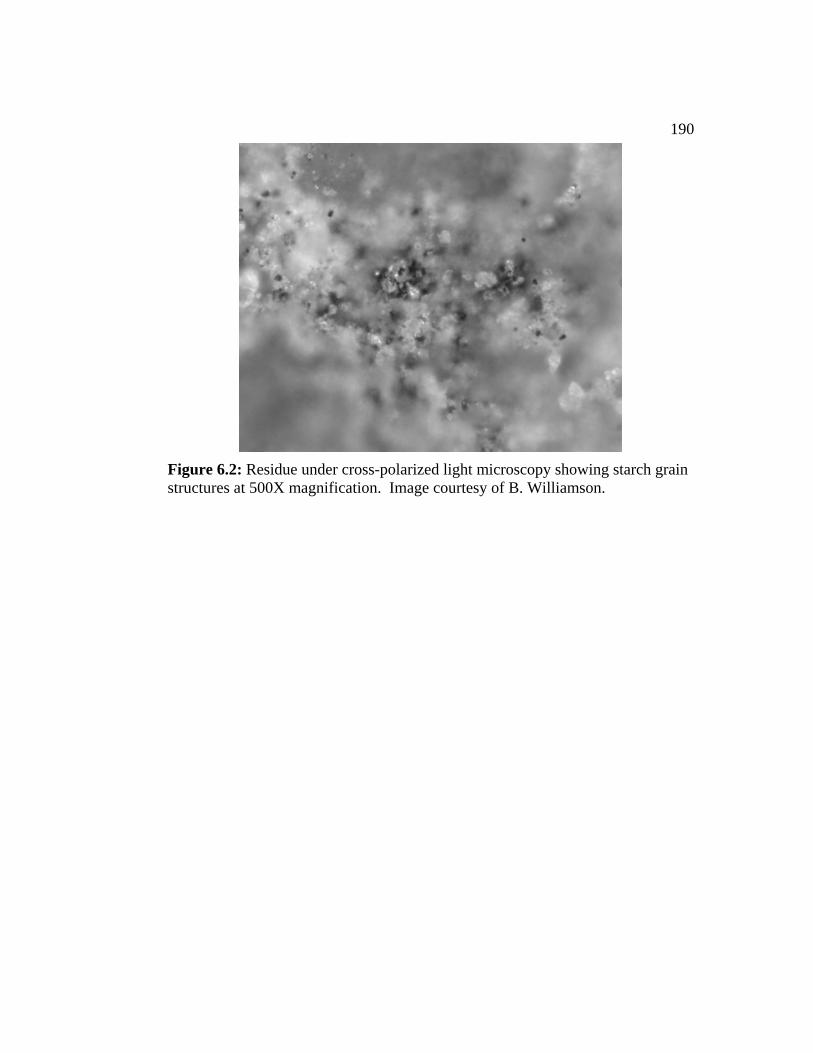
190
Figure 6.2: Residue under cross-polarized light microscopy showing starch grain structures at 500X magnification. Image courtesy of B. Williamson.
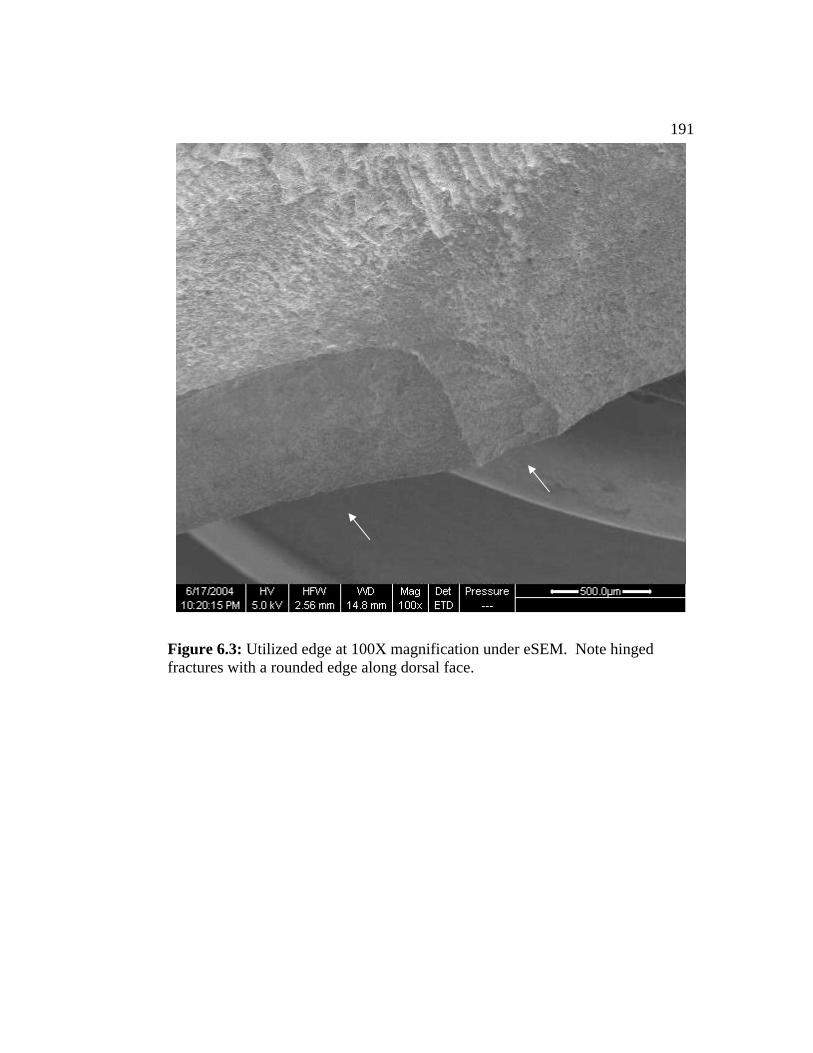
191
Figure 6.3: Utilized edge at 100X magnification under eSEM. Note hinged fractures with a rounded edge along dorsal face.
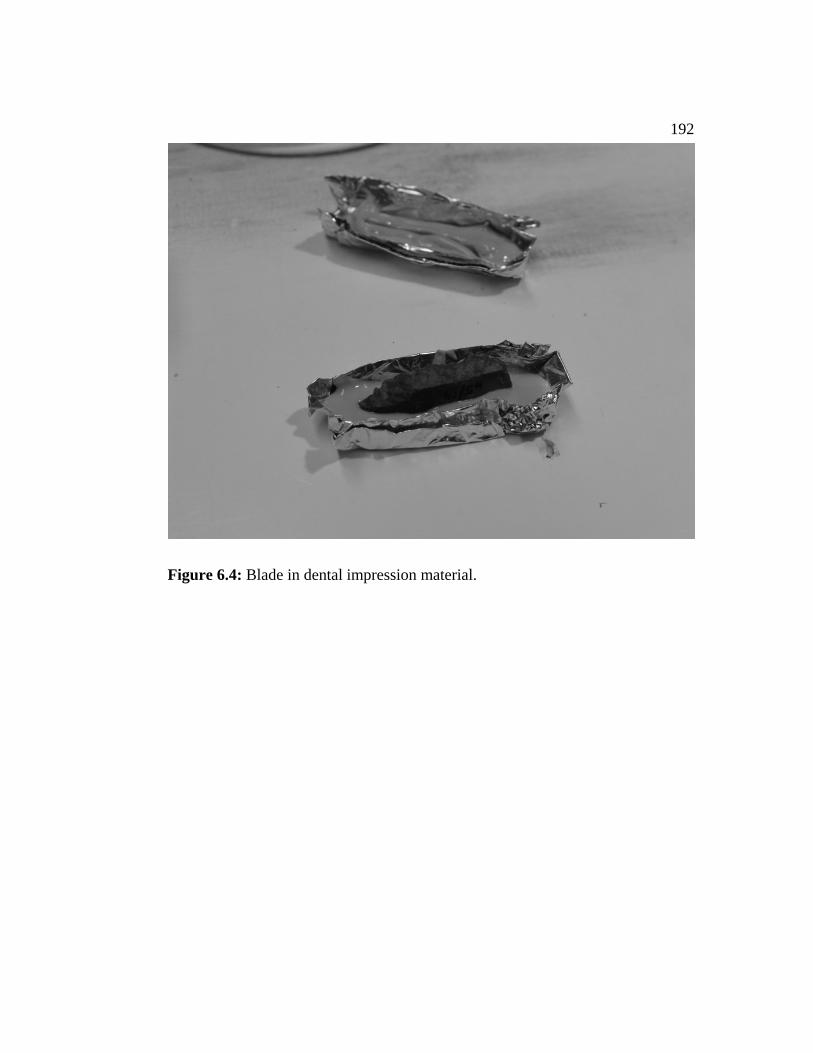
192
Figure 6.4: Blade in dental impression material.
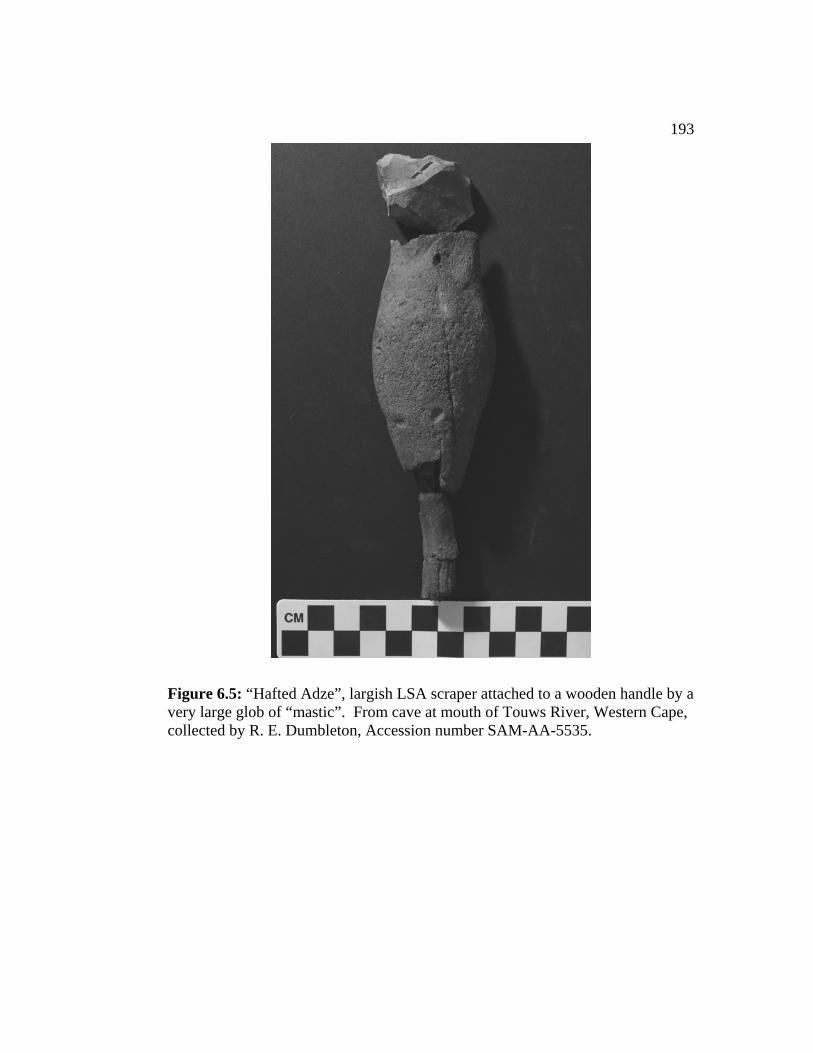
193
Figure 6.5: “Hafted Adze”, largish LSA scraper attached to a wooden handle by a very large glob of “mastic”. From cave at mouth of Touws River, Western Cape, collected by R. E. Dumbleton, Accession number SAM-AA-5535.

194Chapter 7: Lithic Artifacts from Pinnacle Point 13B
MAP
The Mossel Bay Archaeology Project (MAP) is an on-going program of research
under the direction of Curtis W. Marean, Arizona State University, and Peter J.
Nilssen, South African Museum. The goals of MAP are broad but are currently
focused on the survey and excavation of several archaeologically significant caves
on the Indian Ocean coast at Pinnacle Point, west of the town of Mossel Bay,
South Africa (Figures 1.1, 7.1). Some of the caves have evidence for Holocene
human use, but the current focus is on those caves with intact MSA deposits. One
of these caves, 13B, has been the site most intensively investigated and the
findings of those investigations to date are presented here.
The caves and other archaeological sites in the Pinnacle Point area were recorded
during a survey prior to the development of a casino and golf resort (Kaplan
1997). Archaeology in the Mossel Bay vicinity has an early history beginning
with George Leith’s excavation of Cape St. Blaize Cave in 1888 (Leith 1898).
Goodwin excavated there in the 1930s (Goodwin 1930, Goodwin and Malan
1935) and the artifacts from Cape St. Blaize Cave were used to define the Mossel
Bay Industry or variant of the MSA. Archaeological investigations in the Mossel
Bay vicinity were in abeyance until Kaplan and Nilssen’s 1997 survey (Marean et
al. 2004). In 2000 MAP began by testing three of the caves for archaeological
deposits, including Cave 13B (Marean et al. 2004). Cave 13B was attractive for
195further investigations for a number of reasons. First, it is a large cave that is 21 m
above mean sea level, meaning that preservation of deposits older than the OIS 5e
high sea stand are possible (Figure 7.2). Second, MSA-associated hominid
skeletal material was present on the surface and in test excavations (Marean et al.
2004). Third, no large LSA deposits were apparent making access to the MSA
deposits easier and interpretations of the artifacts less problematic. Finally,
calcrete deposits overlie the cave and the resultant buffered groundwater provides
excellent bone preservation. Two full field seasons, each of eight weeks duration,
were undertaken to further excavate Cave 13B in 2003 and 2004. The lithic
artifacts from those seasons were analyzed and coded into a database by myself in
the laboratory during the field seasons. Dating of the artifact-bearing deposits is
not complete at this time. The best dated deposits are between 40-60,000 BP,
with older deposits evident on the basis of stratigraphy (Marean, personal
communication). A set of deposits has been identified that dates to late OIS 6 will
be the subject of excavation and analysis this (2005) field season. This chapter
summarizes the assemblage of more recent origin and places it in a larger context.
Research Goals
The characterization of MSA lithic artifacts in the southern Cape has a long
history. Describing the types of artifacts present and making early technological
comparisons was the goal for much of that history (Goodwin 1928, Goodwin and

196Van Riet Lowe 1929) and some of this early work occurred in the environs of
Mossel Bay (Goodwin 1930, Goodwin and Malan 1935). The thick MSA
deposits at Klasies River led their analysts to propose long techno-temporal
schemes in which those deposits were the halotype (Volman 1981, Singer and
Wymer 1982). As such the Klasies sequence has served as the yardstick by which
every MSA lithic artifact in the region has been measured for a quarter of a
century. As I have discussed elsewhere (Chapter 1) there are many stratigraphic
and chronometric reasons to believe that this sequence has large gaps in it. In a
sense our yardstick is broken or, more accurately, long sections of it are missing.
Wurz (2002) has recently proposed a new scheme for the MSA lithic sequence
(Table 1.1), one that has more flexibility for revision and includes more techno-
temporal sub-stages than either of the numbered systems. As finer-scaled
excavations are described (Soressi and Henshilwood 2004, Marean et al. 2004,
Villa et al. 2005) and the Klasies sequence is reexamined (Wurz 2000, 2002,
Wurz et al. 2003) it is clear that descriptions of types of artifacts and metrical
comparisons from a large number of MSA sites over the entire span of the period
are still required. Providing a new reference to the framework of the evolving
techno-temporal sequence is the main goal of the current lithic research program
at Pinnacle Point. A major secondary goal is to place the raw material choices of
the makers of the artifacts in better local geologic context. This context will
allow better evaluation of models of foraging behavior and social organization
197based on lithic resources (Ambrose and Lorenz 1990, this volume Chapter 4).
Additionally, new methods for recording and comparing lithic artifacts that
recognize some of the analytical difficulties of the dominant coarse-grained raw
materials have been initiated and will be fully developed (Bird 2005, Bird and
Minichillo 2005).
These goals of the larger MAP program, and the needs of MSA studies generally,
fit well with my own research goals. Specifically, it is one of my goals to
demonstrate that the stone tool technology of the MSA is not well characterized
as “static”. Presentations of new well-excavated lithic assemblages are a basic
requirement of such a demonstration and I present one of these here.
Additionally, I have developed an approach to raw material characterization that
requires examination of secondary raw material sources (Chapter 4). The
characterization of the raw material availability in the vicinity of the Pinnacle
Point caves has been on-going for three years and will be continued for many
more. What I have learned of local and regional raw material availability and
variability has already expanded the knowledge of MSA foraging strategies in the
southern Cape. And, perhaps most importantly, the approach that I advocate for
determining the timing of the emergence of behavioral modernity in the MSA
requires regional context and fine-grained local datasets. The ongoing research
program at Pinnacle Point will provide one of these datasets. Resolving fully the
issue of modern human origins will require numerous programs of this type and
198scale, which fortunately we do have in South Africa at this time. One question
that the lithic assemblages can address now is a test of the predictions of the
Neural Advance Model. One of those predictions is that technology should take a
leap forward at 40 - 50,000 BP, a period that is represented in the 13B
assemblage.
Statistical Summaries
The following section summarizes the Strat Aggregate groupings of artifacts
statistically. The information from the Access database was imported into the
SPSS (version 12.0 for Windows) statistical package for these purposes. All
statistical comparisons, unless otherwise noted, are between complete artifacts.
The Strat Aggregates used here are briefly described and are necessarily of a
coarser-scale than that used to define the StratUnits that compose them
(StratUnits are small stratigraphic units and Strat Aggregates are composites of
these, based on geomorphology, this is further discussed in Appendix B).
Surface Sediments – Throughout the cave (in both excavation areas) the
sediments near the modern surface have been churned, mostly by human traffic.
The original context of the artifacts in these sediments is unsure and they are
excluded from the statistical comparisons made here, although all of the artifacts
were recorded in the exact same way as artifacts from undisturbed sediments and
are part of the Access lithic database.

199
Western Re-deposited Sediments – These are sediments that overlie the intact
deposits in the Eastern Area. These are thought to be materials and sediments
from the rear of the cave that have been redeposited in the front of the cave. They
are not considered in this analysis, although all of the artifacts from these deposits
were coded in the same manner as those that are being summarized here and are
included in the lithics database.
Roof Spall – This is a sequence of StratUnits that occurs only in the Eastern Area
(Figure 7.3). This is essentially the in situ archaeological deposit in the mouth of
the cave that is not cemented to the walls or floor. In my analysis I sometimes
refer to these as the Eastern deposits. These deposits date to between 40-60,000
BP, based on U-series assays of flowstone and a single 14C estimate (Marean,
personal communication).
Lightly Consolidated Facies – These are the obviously artifact-rich deposits which
are brecciaed to the walls and possibly the floor of the cave, at least in the Eastern
Area (Figure 7.3). Sample sizes from these layers are quite small and no analysis
for some categories (for example, cores) is possible. When analyses are possible
these are treated as a separate analytical unit from the other intact deposits in the
Eastern Area. These deposits date to late OIS 6 at around 180,000 BP, on the
basis of OSL assays (Marean, personal communication). This area will be the

200focus of the 2005 field season and after that time meaningful numbers of artifacts
will be available.
Light Brown Sand Facies (LB Sand) – These layers are the uppermost below the
Surface Sediments in the Western Area (Figure 7.3). When gross scale
comparisons are required due to low sample sizes (as with the core analyses) I
lump all of these together as Western Upper. The age of these deposits is
unknown, but is older than 60,000 and younger than 180,000 BP, based on a
tentative stratigraphic relationship with other, dated, deposits in the cave (Marean,
personal communication).
Dark Brown Sand Facies (DB Sand) – These are sediments below LB Sand layers
in the Western Area (Figure 7.3). They are interdigitated with Light Brown Grey
Sand Facies (LBG Sand) layers. For the purposes of my analyses these are
lumped together as Western Lower. The age of these deposits is unknown, but is
older than 60,000 and younger than 180,000 BP, based on a tentative stratigraphic
relationship with other, dated, deposits in the cave (Marean, personal
communication).
.
Perhaps the oldest sediments in the cave are below the Western Lower layers.
Light Brown Silt, Laminated Facies, Boulder Facies, and Boulder Beach are
201stratigraphic aggregates that have very low artifact sample sizes and are not
included in these analyses unless otherwise specified. These deposits have been
dated to older than 300,000 BP by OSL assay (Marean, personal communication).
In summary, my large stratigraphic units for analyses are Roof Spall, which
overlies, and is thus younger than, the Lightly Consolidated Facies in the Eastern
Area, and Western Upper and Western Lower, in the Western Area.
Unfortunately the relationships between the deposits in the Eastern and Western
Areas are unclear at this time. It is thought that the Western Area represents an
occupation that is older than that in the Roof Spall and this seems to be supported
by the lithic artifacts generally.
Core Rejuvenation Flakes – These are sometimes referred to as “core tablets” and
are flakes that have been struck across the platform of a core in order to
reestablish a good platform angle on the working face of the core. All of the core
rejuvenation flakes in this assemblage are quite similar in morphology, looking
like they were removed from a single-platform core, and are very similar in form
to the core rejuvenation flakes from Klasies (Volman 1981, Singer and Wymer
1982). One striking difference between the core rejuvenation flakes from the
different stratigraphic aggregates at PP 13B is in size. This is shown in the
boxplots of length for all core rejuvenation flakes not from disturbed contexts
(Figure 7.4). There is a size trend from the Eastern Area (Roof Spall) to the

202Western Upper and then Western Lower, smallest to largest. What is not shown
in the boxplots, however, is that the size distribution for the Eastern Area is
bimodal and those for the two Western Areas are unimodal. This is clear when
the distribution of very small (“tiny” in the comments field of the database) is
examined. These tiny core rejuvenation flakes all have a mass of less than 3 g.
When disturbed layers are removed from the analysis all of the tiny core
rejuvenation flakes are from the Eastern (Roof Spall) layers. Of the nine core
rejuvenation flakes from this area five are of the “tiny” size class, compared with
no “tiny” core rejuvenation flakes, out of eleven total for the Western Area
(Upper and Lower combined). A statistical analysis shows that this pattern is
significant, x2=4.91, p<.05. The addition of small blade or bladelet cores to this
MSA assemblage suggests a Howiesons Poort or Post-Howiesons Poort sub-stage
affinity for the Roof Spall layers.
Cores – Cores are considered by many analysts to the most informative artifact
for determining the organization of technology for an assemblage (Conard et al.
2004). Not counting hammerstones, core fragments, core rejuvenation flakes, and
cores from disturbed contexts 69 cores were included in the analysis. The
typology of the cores was recorded in both Geneste’s (1985) and Volman’s (1981)
systems. Geneste’s typological categories are shown as a bar graph clustered by
area and grouped by type (Figure 7.5). The typological profiles for the Eastern
and the Western Lower are most similar to one another and this is borne out in the

203Volman typology as well. The Volman typology is shown as a bar graph
clustered by area and grouped by type (Figure 7.6).
The Eastern area is dominated by discoidal/radial cores, whose products would be
Flakes, Dejeté flakes, or Convergent Flake-Blades. A statistical analysis of the
core distributions shows, that even though the percentages are quite different, the
higher representation of radial cores in the Eastern layers is not significant;
x2=1.70, p<.05. Other common core types in the Eastern (Roof Spall) layers are
Levallois and Cores on a Flake. The only bifacial core (artifact 30471) and only
bladelet core (artifact 30513) from undisturbed contexts are also from the Roof
Spall layers. This bladelet core is suggestive of a Howiesons Poort or Post-
Howiesons Poort affinity for the technology in at least some of the Roof Spall
layers and is well-matched to the “tiny” core rejuvenation flakes from these
layers. Other than this bladelet core, cores for the manufacture of blades are
absent in the Roof Spall layers, this pattern, of small blade or bladelet and radial
cores, is similar to the Post-Howiesons Poort layers at Sibudu cave (Villa et al.
2005).
The Western Upper layers have the smallest presence of discoidal/radial cores,
and the largest presence of cylinder and single platform cores. None of these
difference are, however, statistically significant. The Levallois technique is

204present, although at the lowest frequency for any the of the MSA analytical units
in the assemblage.
The Western Lower layers are similar to the Eastern layers in a large
representation of discoidal/radial and Levallois cores; the primary difference
between the two areas being a complete absence of bladelet production in the
Western Lower layers. Cylinder cores are also present suggesting blades are a
desired product of a least some of the tool-making in the Western Lower
assemblage.
The cores from all of the analytical units show a generally varied MSA approach
to producing lithic artifacts, with radial, single platform, and Levallois approaches
present in all areas in various amounts (Figures 7.5, 7.6). The only significant
change in core reduction strategy occurs in the Eastern layers with the addition of
small blade or bladelet production to the other generalized MSA toolkit.
Flaked Stone – This is the category for all of the non-core artifacts larger than 1
cm or that were plotted as single finds in the field. 4,033 cases were in the
original database, after the roof fall that were plotted in the field as artifacts were
discarded 3,230 cases remained. Of these, 1,545 cases are complete artifacts, for
some of my description and analysis only these are used. After the artifacts that
came from Section Cleanings and disturbed or surface contexts are removed

205complete 957 cases remain. These are divided into the same gross stratigraphic
aggregates as the cores with the addition of LB Silt being added to Western
Lower and Fault Zone Fill being added to Western Upper. The Lightly
Consolidated Facies is too poorly represented for comparison here and all of the
sample for that Stratigraphic Aggregate in the 2003 and 2004 seasons where the
result of cutting micromorphology columns and lack stratigraphic controls, but I
will comment on my impressions of those materials.
The types of artifacts present in each gross stratigraphic aggregate do not appear
to be very different at first glance (Figure 7.7). Some differences are obscured by
the crude typology, however. The Eastern Area (Roof Spall) does not have more
“blades” but it has more bladelets. When these are accounted for the apparent
differences of this area in comparison to the others is removed. In essence two
goals of the lithic production of the Eastern Area are bladelet production and
discoidal core reduction producing flakes. The Eastern Area also has fewer
Convergent Flake-Blades which are replaced in the assemblage by Dejeté Flakes.
This is result of the increased use of radial flaking techniques and reduced use of
Levallois techniques, although consistent with the changes in core use neither one
of these observations is statistically significant at the .05 level, utilizing a x2 test.
This is consistent with the assignment of a Post-Howiesons Poort sub-stage to the
Eastern layers.
206The differences in the Geneste types in the three areas analyzed here is almost
entirely in the “Levalloisness” of the assemblages. Both Western Areas (Upper
and Lower) have more Levallois products than the Eastern Area (Roof Spall).
This difference, x2=1.83, is not significant at the p<.05 level; it is, however,
significant at the p<.20 level. This is consistent with assignment of the Eastern
Area to the Post-Howiesons Poort sub-stage and the two Western Areas to some,
undetermined pre-Howiesons Poort MSA sub-stage(s). An additional difference
between the Eastern Area and Western Area (Upper and Lower) is a higher
incidence of bifacial thinning flakes in the Eastern layers (Table 7.2). The 3%
figure for the Eastern Area is less than for Still Bay assemblages (Chapter 5) and
is likely the result of heavy use of radial core reduction strategies, rather than
bifacial point manufacture. The 1% figures for both of the Western Areas are
negligible and comparable to almost any non-Still Bay MSA assemblage.
One category where the two Western Areas do differ is in raw material choices.
While all of the layers at PP 13B are dominated by locally abundant quartzites
and quartzes the Western Upper has a slight increase in the use of silcrete as a raw
material (Figure 7.6). Increased use of silcrete is associated with both Still Bay
and Howiesons Poort sub-stages, but none of the technological characteristics of
those distinctive lithic industries are present in the Western Upper layers. It is
more likely one of the fluctuations in raw material choices, like at Die Kelders,

207which are poorly understood and may be the result of changing raw material
availability through sea level changes.
The final area where differences are noted between the three areas is in size
(Figure 7.7). This follows the general temporal trend noted within many MSA
sequences of older artifacts being larger and smaller artifacts being younger.
Assignment of the Western Area to part of the established sub-stage scheme for
the MSA is difficult although there is some suggestion of a Die Kelders-like
affinity for the upper layers in that area and possibly a Mossel Bay sub-stage
(MSA II or MSA 2b) affinity for the lower layers. Both of these affinities are
weak and only very tentatively given and in many ways these layers do not well
match the scheme as it is classically described.
The artifacts that I have observed in the Lightly Consolidated Facies and the few
that have been recovered from there are larger, exhibit more use of the Levallois
technique, and appear to have more formal tools than any of the layers in the
Western Area. This suggests greater antiquity for the LC Facies than for other
artifact-bearing layers that have been excavated to date. The artifacts seem to
conform to the Klasies sub-stage (MSA I or MSA 2a) descriptions better than the
Western Areas to any description, although many more artifacts will be needed
from firm contexts to conclusively make a technological assessment.

208Edge Damage Study
While analyzing and recording the lithics from the 2003 field season I noticed
almost immediately that many of the quartzite tools had what appeared to be edge
damage or usewear. I recorded the presence of this damage in the comments
section of the database as PED (for possible edge damage, terrible name I know, I
meant possible human-induced edge damage). Observing edge damage on
coarse-grained raw materials is challenging and due to this is likely seldom
attempted on quartzite or quartz, the raw material classes that dominate the
Pinnacle Point assemblage. I tried to get around this challenge by using a very
bright focused light (in this case a microscope illuminator). I worked closely with
Cate Bird in developing the methodology and in recording the edge damage. We
presented a poster on our results (Bird and Minichillo 2005) and Cate wrote her
honors thesis at Arizona State University (Bird 2005) on our study. The
following summary is taken from those two sources.
It is difficult to record and analyze patterns of edge damage and retouch on stone
tools without oversimplifying the data. Graphical summaries of retouch and edge
damage are useful for comparing tools and assemblages, and provide a basis for
examining questions of function and taphonomy. In this section I present a
method for recording, presenting, and analyzing these complex data, and work
through an example utilizing the 2003 and 2004 lithic assemblage. The

209combination of GIS, rose diagrams, and polar statistics provides a statistically
robust approach that can be used to advance our understanding of MSA tool use.
Methodology
For each edge-damaged or retouched artifact, we marked the centroid, oriented
them with platform down on a grid, and then took digital photographs of both
faces (Figure 7.9). Next we imported the digital photos into ArcView™ where
they were rectified to an accurate scale. Using rectified images is important for
taking accurate measurements of distance, angle, and area, and for creating vector
maps of each face. We then digitized each flake scar on-screen as an individual
polygon on vector maps of each face (Figure 7.9). Each vector map is coded with
the specimen number, face, raw material, and general shape class. It is then
possible to overlay artifact outlines to create a visual summary of edge damage
locations for an assemblage (Figure 7.9), similar to the visual composites that I
made for the Still Bay bifacial points (Chapter 5).
Three general shape classes (flakes, blades, and convergent flakes) that were
recorded in my original analyses were used to organize the artifacts (Dejeté and
Side-struck were too small of samples to be used). Artifacts were also divided by
raw material class to prevent different mechanical characteristics or differences in
observability from biasing the results. The example that has been worked through
is for convergent flakes made on quartzite (Bird 2005). Previous researchers have

210noted that edge damage caused by taphonomic processes is distributed randomly
around the perimeter of lithic artifacts. Specifically, for both water transport and
trampling the damage “was distributed randomly around the perimeter of the
flake” (Tringham et al. 1974:192). Conversely, retouch and use wear can be
expected to have non-random distributions around the perimeters of lithic tools.
Like most other MSA lithic assemblages from the southern Cape, the 13B
assemblage is primarily composed of quartzite. Assessing edge damage on this
coarse-grained raw material is difficult and potentially imprecise using traditional
analysis techniques. Data were collected in such a way that we could look at the
distributions of edge damage on an assemblage level macroscopically, as opposed
to at the artifact level and microscopically. Edge damage was divided into two
types for coding: Type 1 exhibits many of the features, such as regularity, several
contiguous removals, and size, usually associated with retouch, and these were
recorded as retouch in my initial analysis, and Type 2 exhibits irregularity in
shape and size of damage and the causal agent could not be determined (either
usewear or natural processes). This led us to ask a couple of simple questions.
1. Is Type 2 edge damage on convergent flakes distributed randomly or non-
randomly?
2. What can these distributions tell us about the use and maintenance of these
tools in the past?

211Generating Rose Diagrams
The starting and ending angle of each flake scar was measured in one-degree
increments on a 360 degree plane (Figure 7.10). These numerical values were
entered into RockWorks™ to create rose diagrams (Figure 7.11) for both dorsal
and ventral faces. These are useful displays that help to visualize patterns in the
data. In each of the diagrams displayed the length of the petals are the total
number of degrees of edge damage in that five degree arc. However, other steps
are required to determine whether the observed patterns are statistically
significant.
Calculating Polar Statistics
For the final step, the numerical values for edge damage length and location were
imported into Oriana™ statistical software. For each rose diagram shown (Figure
7.11), Kuiper’s test of randomness and Rayleigh’s uniformity test of direction
were calculated. These tests are appropriate for the analysis of circular or polar
data. Table 7.4 presents the results of the statistical tests for distributions
represented by the four rose diagrams. As the p-values show, the null hypotheses
that the distributions are random or without direction can be rejected in each case.
Discussion of Edge Damage
In the cases examined here, the rose diagrams show that Type 2 edge damage on
convergent flake-blades has a non-random distribution. This suggests that the
212Type 2 edge damage is the result of human behaviors rather than taphonomic
processes. The majority of the damage appears along the lateral edges, rather
than at the tip of the ventral and dorsal faces. Polar statistics verify the
significance of this pattern. The strong patterning of damage along the lateral
edges of the dorsal and ventral faces suggests use perhaps for cutting, scraping, or
sawing for many of the convergent flakes. The patterning also appears biased to
one side. If a flake is held in the “natural” position of thumb on the dorsal surface
and left edge (for a right-handed user) pressed down, that edge seems
preferentially used in this assemblage. Again, this seems non-random and biased
toward a population of users that more frequently use or initiate use with the right
hand. Taken together with observations of impact fractures in the same
assemblage this data may also be indicative of tools that were employed in
multiple ways, with shape class alone being a poor indicator of function.
Collecting experimental data on use-wear patterns that result from different
activities on similarly coarse-grained materials would permit testing for specific
uses. Currently, the same set of artifacts that have had detailed recording of their
usewear and retouch patterning are being investigated by Marlize Lombard for
residues (Lombard 2005). Combining the spatial patterning of the residues with
the usewear in the GIS database will provide new insight into MSA tool use in the
very near term.
213This method for recording the locations of retouch and edge damage allows for a
high level of precision in their quantification. In turn, data gathered in this way
can be subjected to statistically robust tests. This can be useful in many lithic
assemblages for documenting macroscopic edge damage, especially, as in the
Cave 13B assemblage, for artifacts whose coarse-grained material make them
difficult to analyze microscopically. Usefully, this method was developed for use
in the field laboratory setting using software packages, such as ArcView™, that
are now commonly present on most field projects. Other ways to get the same
results are possible. For example a flatbed scanner could be used in place of the
digital camera in image capture. The scanner would have the advantage of the
images needing no further rectification and the disadvantage of placing dirty
rocks on the glass.
Other Observations
While examining the lithic materials from Cave 13B at least some benefit was
gained by not washing the artifacts. In three cases what appeared to be
mammalian hair has observed adhering to lithic artifacts (Figure 7.12). The
comparative collection needed to properly characterize the hairs does not
presently exist, although this type of inquiry could be very fruitful in the future.
One possibility is that hair roots are preserved on some specimens and that these
may provide viable DNA for analysis. These artifacts have been set aside and
214further analyses will be undertaken when there is a reasonable chance for
successfully gaining useful information from them.
Raw Material Surveys
In order to augment the raw material surveys conducted by Brown (Brown n.d.,
Marean et al. 2004) in the Pinnacle Point area further surveys of raw material
variability in the Mossel Bay area were undertaken (Table 7.5). Much of the
focus of these surveys was to locate finer-grained raw materials that may be
locally available in secondary deposits.
Cobble Beach Survey
On 27 March, 2003, Panagiotis (Takis) Karkanas traversed shoreline from Cave
13B eastward Cave 5 to a large cobble beach in a crescent-shaped embayment.
We performed two quick raw material surveys and made other raw material
observations on both legs of the walk.
Random Cobble Survey
This survey consisted of walking to middle of the large cobble beach and placing
a 2-meter tape parallel to the shoreline (9:30-10:15 am, low tide that day was at
6:41 am). All cobbles that lay in contact with the tape were then surveyed using
the following method. Each cobble was weighed on portable scale, due to the
wind all weights were rounded to the nearest gram. Each cobble was flaked using

215a geologic hammer and a flake preserving both cortex and clean interior was
labeled with permanent marker for later assessment. 50 cobbles were surveyed in
this way. In general, a narrow range of quartzites were found with some
variability in grain size and hardness noted (96%). Coloration ranged from very
light grey to pinkish grey. Takis believed that these were older than the quartzites
of the cliff face. A small number of the cobbles were quartz (4%). These had
been more completely metamorphosed than the vein quartz in the cliff face. They
may have been abraded from the conglomerates (probably Enon) observed on the
hike from the site to the beach.
Non-Random Survey
After completing the random survey Takis and I split up and roamed the beach for
15 minutes looking for the “five prettiest rocks” we each could find. Of these ten
rocks a much higher percentage were quartz (60%), including some nearly
crystallized “smoky” quartz, than was recovered during the random survey. One
sample was a calcite bedded in calcrete that was very fine-grained. While fine-
grained calcite would make excellent cutting tools and has desirable flaking
characteristics it may be under-represented in archaeological assemblages due to
post-depositional dissolution in groundwater.

216Little Brak River Survey
This pedestrian survey was along the west bank of the Klein Brak River,
beginning at the train trestle and moving up river during low tide (3 April, 2003).
Along the way a number of conglomerate deposits were observed both in situ in
the bank and sliding down to the river. These contain pebbles and cobbles in a
sandy matrix. Along the river itself this conglomerate has eroded into the pebbles
and cobbles forming a rocky bank. This contrasts with the east bank of the river,
which is uniformly sandy. Just south of the N2 bridge is a large exposure (10+
meters) of the conglomerate. It is dominated by quartzites (mostly greys),
includes a fair number of fine quartzes (mostly milky whites), but also contains
some fine grey silcrete, all in cobble form. This is the Klein Brak Formation, a
Pleistocene-aged conglomerate (Malan 1991). Contents of this formation are
variable, but include fine-grained raw materials that would have excellent
knapping and functional characteristics.
Hartenbos River Survey
I visited the Transand gravelling operation just north of the town of Hartenbos in
the Hartenbos River valley with Peter Nilssen (24 February 2004). This was the
reported source of the silcrete-rich gravels that were used for road improvements
near the sewage treatment plant at Pinnacle Point. The manager of the Transand
plant stated that they were mining the Enon Conglomerate, although there is some
question as to whether the Enon contains silcretes and other fine-grained silicates,
217and it is likely that at least some of the gravelling is being done in the Klein Brak
Conglomerate. We spent a couple of hours walking up and down washes looking
for raw materials. Small nodules of very fine-grained silcretes and cherts were
located, though not in abundance and usually only a couple of centimeters in
diameter. A variety of ochres of high-quality were also located as well as some
fully petrified wood of knappable quality. The deposit of gravels here is massive
covering several hectares and at places tens of meters thick. Gravels of this type
are obviously exposed and moved around in the small river valleys of the area
with some frequency.
Discussion and Conclusions
The examination of the lithic assemblage from PP 13B has provided some
interesting results so far, and work here is far from complete. One of the major
research goals, to compare the lithics here to the Klasies halotypic sequence, has
had mixed results. Part of the assemblage fits into that scheme well and part of
the assemblage does not. The Roof Spall layers in the Eastern Area of the cave
match well with Singer and Wymer’s (1982) MSA III & IV or Wurz’s (2002)
Post Howiesons Poort sub-stage. Although it must be said that the technological
analyses and descriptions in Villa et al. (2005) for Sibudu Cave made that
conclusion possible, especially their description of the cores. If the Post-
Howiesons Poort sub-stage is to get a unique name then the Sibudu sub-stage
218seems appropriate as it is there that it was first technologically described and
well-dated.
Techno-temporal affiliations for the layers in the Western Area are more difficult
to make. They are clearly pre-Howiesons Poort MSA and show temporal trends
in size and technology internally, none of which can presently be demonstrated to
be statistically significant, but do not conform well to the established MSA
sequence based on the Klasies halotype. As such the lithic sequence at PP 13B
can be added to increasing evidence that the Klasies yardstick is incomplete.
Further excavation is required to get a good handle on the place of the Lightly
Consolidated Facies in this sequence and this will be accomplished during the
2005 field season.
The raw material survey in the Pinnacle Point vicinity is on-going but much has
been learned already. Within a 15 km radius of the MSA cave sites the survey
has identified quartzites in primary geologic and beach and stream cobble form,
quartzes in primary geologic and beach and stream cobble form, and silcretes in
primary geologic and beach and stream cobble form, especially in the large
conglomerate deposits of the Klein Brak Formation. All of the classes of raw
materials in the MSA lithic assemblage at PP 13B were available to foragers in
the local setting.
219As to the question, “does the technology change dramatically at 40-50,000 BP?”
the answer is somewhat ambiguous. At PP 13B a change is noted in the lithic
technology in the appropriate time-frame. In the Eastern Area, dated to 40-60,000
BP, reduction strategies are reorganized to include smaller blade cores and a
dominance of simple radial cores, all on locally available raw materials. So, yes,
a change has occurred at the appropriate time. Taken in the context of the larger
MSA described elsewhere in this dissertation, however, this change seems less
than that predicted for the cognitive leap forward predicted by the Neural
Advance Model. Other technological changes in the southern Cape and their
timing; initial MSA >200 kya, bone tool industry 85 kya, hafted bifaces 75 kya,
backed pieces 60 kya, and microlithic industries 20 kya, are all of a greater
technological “advance” and occur throughout the MSA (or in the case of the last
example, much later), rather than near its termination. In context, the
assemblages that have been analyzed to date from PP 13B are more in line with a
gradualist model for change than with a “great leap forward.”
The complete database for the lithic artifacts, a set of digital images, and
photologs are included as pocket material on two CDs. If you are reading this in
microfilm a copy can be obtained by e-mail: [email protected]
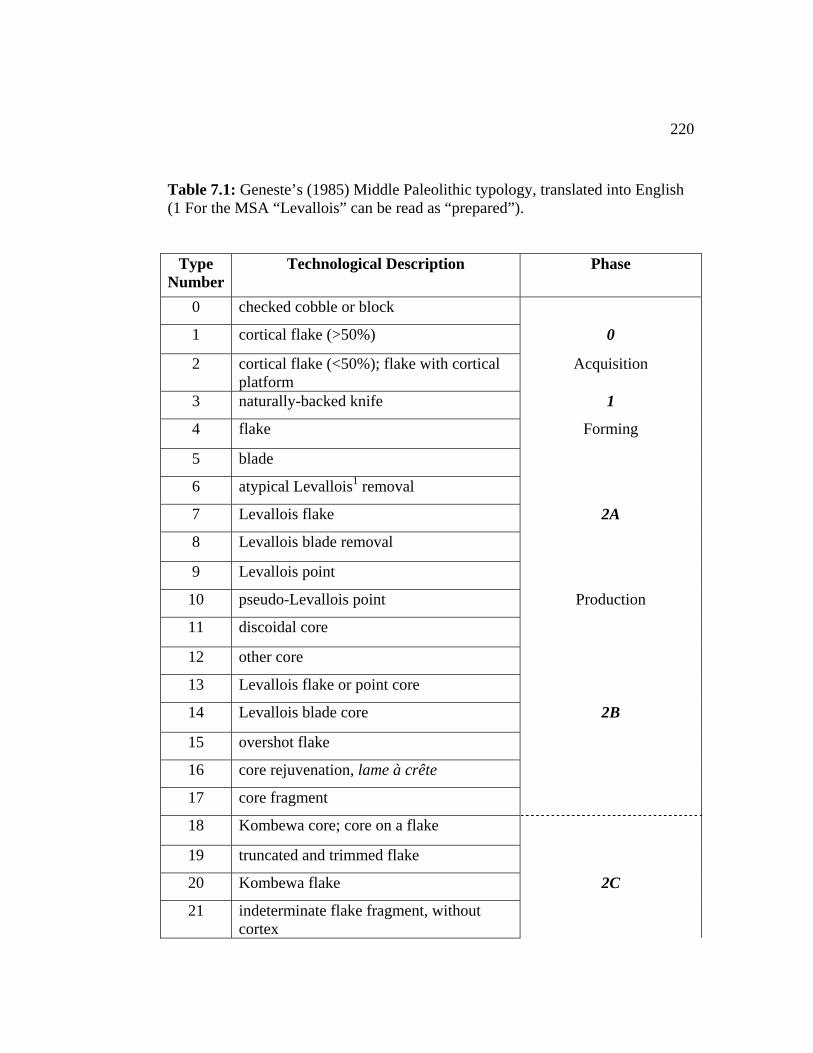
220
Table 7.1: Geneste’s (1985) Middle Paleolithic typology, translated into English (1 For the MSA “Levallois” can be read as “prepared”).
Type Number
Technological Description Phase
0 checked cobble or block
1 cortical flake (>50%) 0
2 cortical flake (<50%); flake with cortical platform
Acquisition
3 naturally-backed knife 1
4 flake Forming
5 blade
6 atypical Levallois1 removal
7 Levallois flake 2A
8 Levallois blade removal
9 Levallois point
10 pseudo-Levallois point Production
11 discoidal core
12 other core
13 Levallois flake or point core
14 Levallois blade core 2B
15 overshot flake
16 core rejuvenation, lame à crête
17 core fragment
18 Kombewa core; core on a flake
19 truncated and trimmed flake
20 Kombewa flake 2C
21 indeterminate flake fragment, without cortex

22122 bifacial thinning flake 3
23 debris from retouching and resharpening Retouching, maintenance and
24 debris larger than 29mm, without cortex other residue
25 debris smaller than 30mm, without cortex
26 small fragmentary debris

222
Table 7.2: Bifacial thinning flake frequency by stratigraphic aggregate.
Stratigraphic Aggregate Bifacial Thinning Flakes
Eastern 3% Western Upper 1% Western Lower 1%
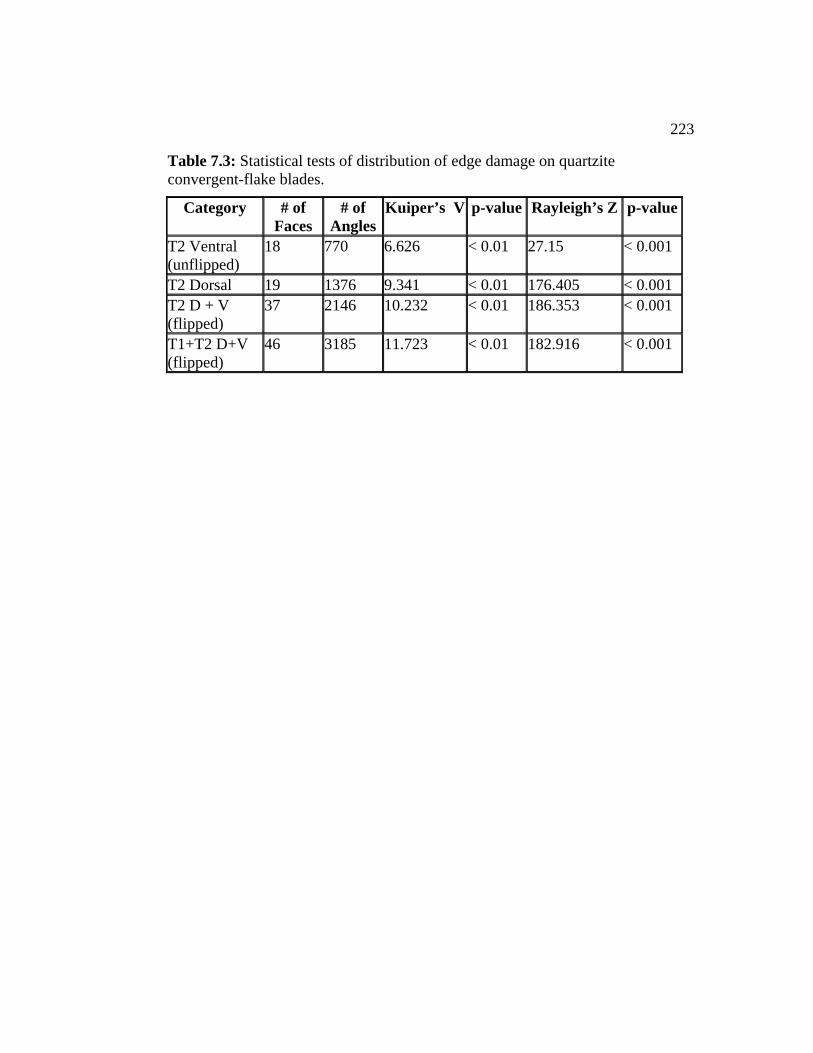
223
Table 7.3: Statistical tests of distribution of edge damage on quartzite convergent-flake blades.
Category # of Faces
# of Angles
Kuiper’s V p-value Rayleigh’s Z p-value
T2 Ventral (unflipped)
18 770 6.626 < 0.01 27.15 < 0.001
T2 Dorsal 19 1376 9.341 < 0.01 176.405 < 0.001 T2 D + V (flipped)
37 2146 10.232 < 0.01 186.353 < 0.001
T1+T2 D+V (flipped)
46 3185 11.723 < 0.01 182.916 < 0.001
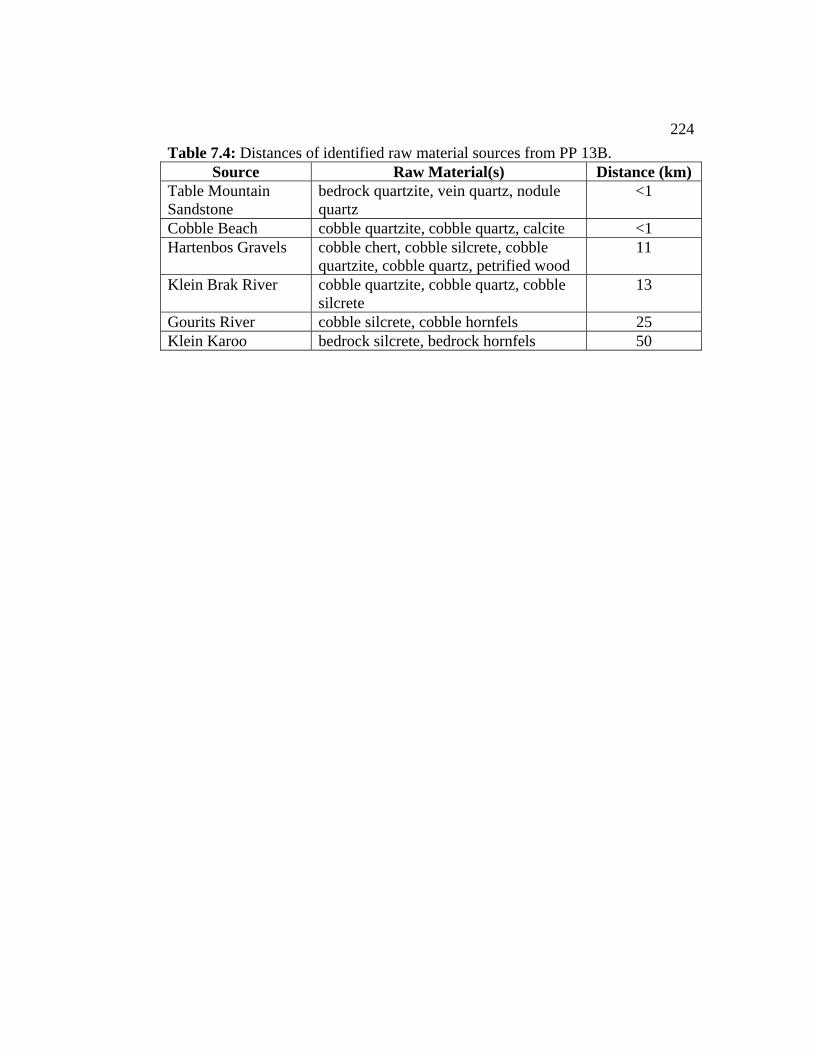
224Table 7.4: Distances of identified raw material sources from PP 13B.
Source Raw Material(s) Distance (km) Table Mountain Sandstone
bedrock quartzite, vein quartz, nodule quartz
<1
Cobble Beach cobble quartzite, cobble quartz, calcite <1 Hartenbos Gravels cobble chert, cobble silcrete, cobble
quartzite, cobble quartz, petrified wood 11
Klein Brak River cobble quartzite, cobble quartz, cobble silcrete
13
Gourits River cobble silcrete, cobble hornfels 25 Klein Karoo bedrock silcrete, bedrock hornfels 50
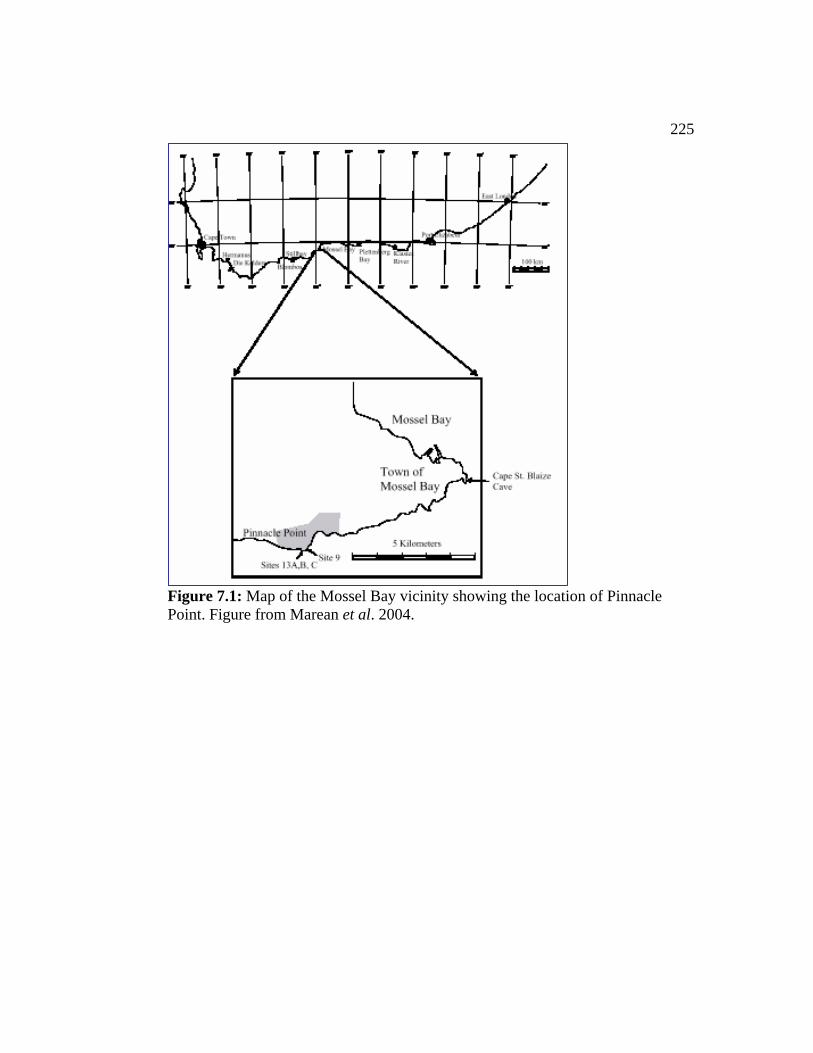
225
Figure 7.1: Map of the Mossel Bay vicinity showing the location of Pinnacle Point. Figure from Marean et al. 2004.
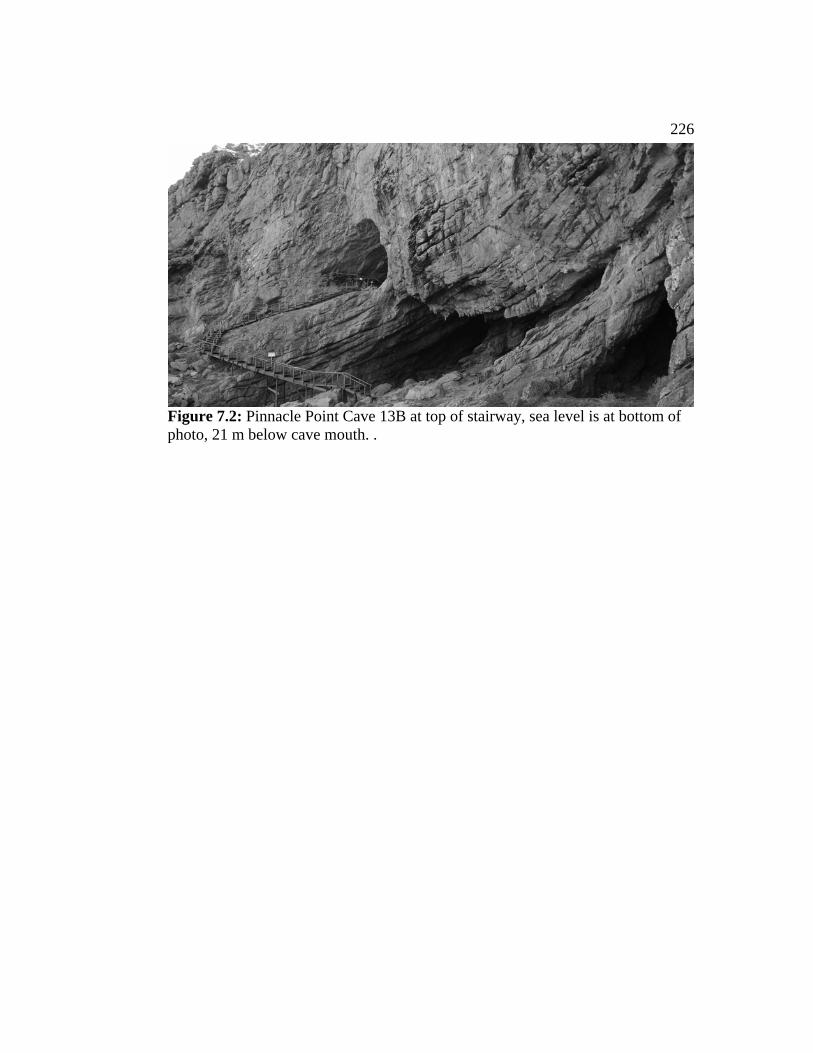
226
Figure 7.2: Pinnacle Point Cave 13B at top of stairway, sea level is at bottom of photo, 21 m below cave mouth. .

227
Figure 7.3: Topographic map of the interior of Cave 13B. Block on left is Western Area, block on right is Eastern Area, LC-MSA is Lightly Consolidated deposit. From Marean et al. 2004.
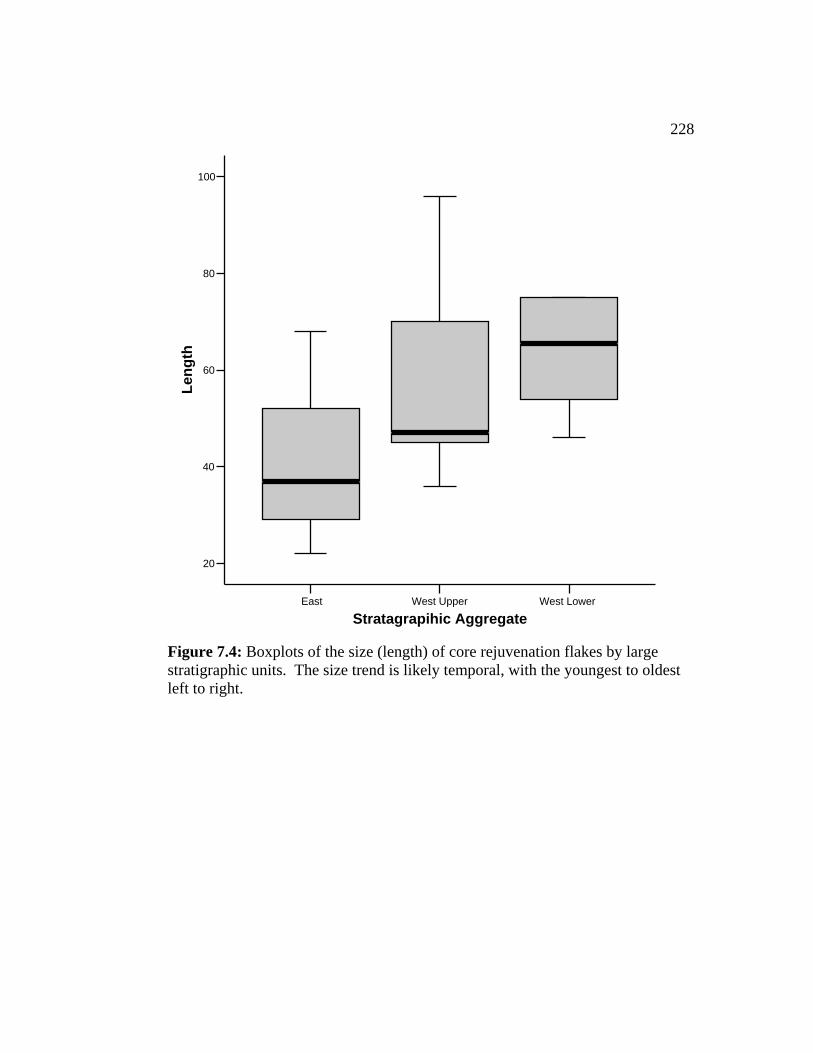
228
East West Upper West Lower
Stratagrapihic Aggregate
20
40
60
80
100Le
ngth
Figure 7.4: Boxplots of the size (length) of core rejuvenation flakes by large stratigraphic units. The size trend is likely temporal, with the youngest to oldest left to right.
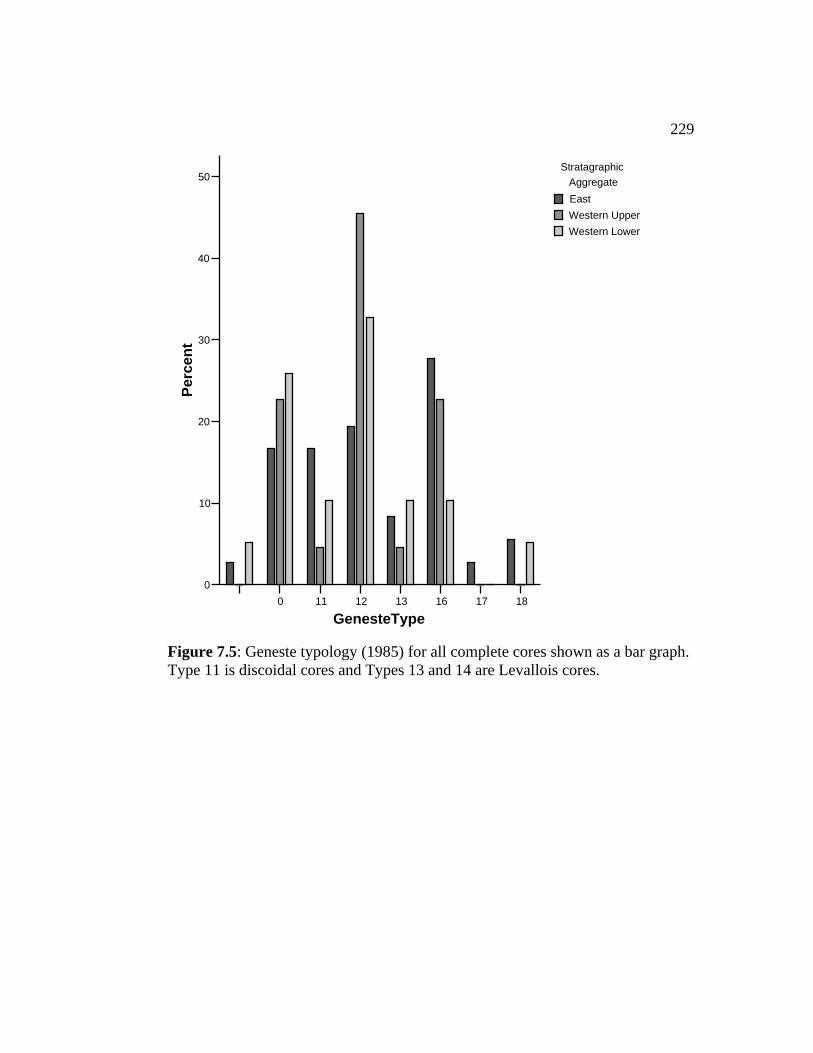
229
0 11 12 13 16 17 18
GenesteType
0
10
20
30
40
50Pe
rcen
tStratagraphic
AggregateEastWestern UpperWestern Lower
Figure 7.5: Geneste typology (1985) for all complete cores shown as a bar graph. Type 11 is discoidal cores and Types 13 and 14 are Levallois cores.
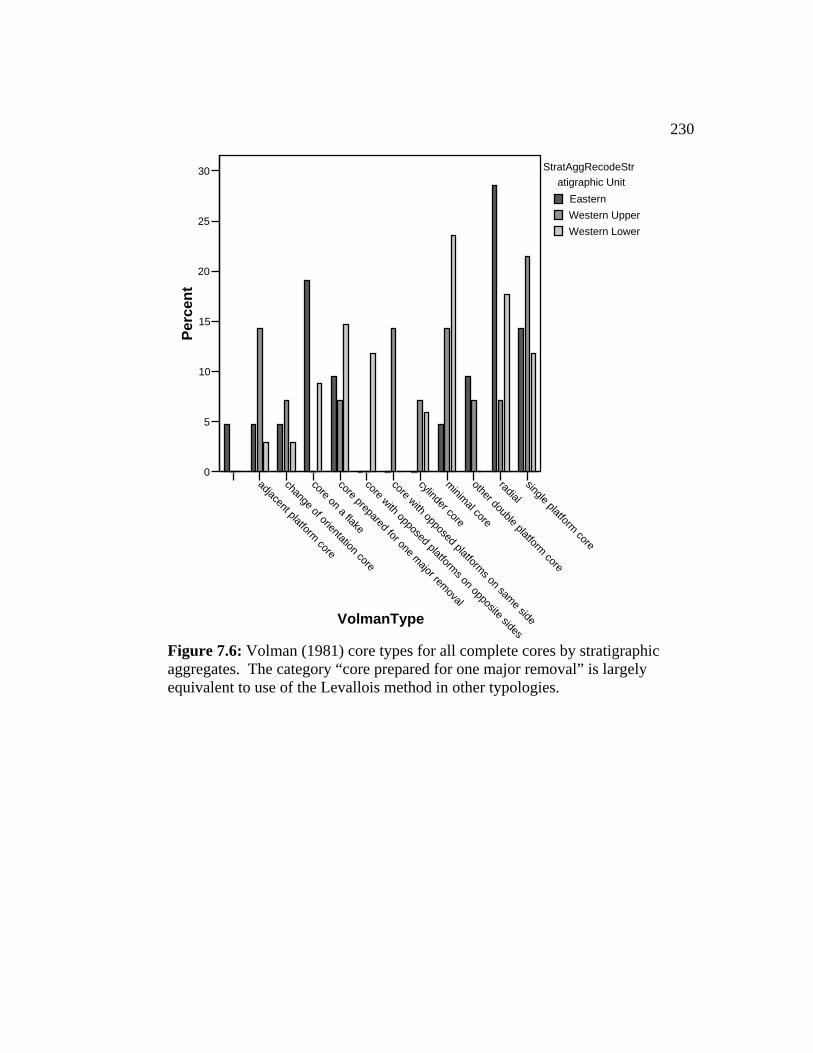
230
adjacent platform core
change of orientation core
core on a flake
core prepared for one major removal
core with opposed platforms on opposite sides
core with opposed platforms on same side
cylinder core
minimal core
other double platform core
radialsingle platform core
VolmanType
0
5
10
15
20
25
30Pe
rcen
tStratAggRecodeStr
atigraphic UnitEasternWestern UpperWestern Lower
Figure 7.6: Volman (1981) core types for all complete cores by stratigraphic aggregates. The category “core prepared for one major removal” is largely equivalent to use of the Levallois method in other typologies.
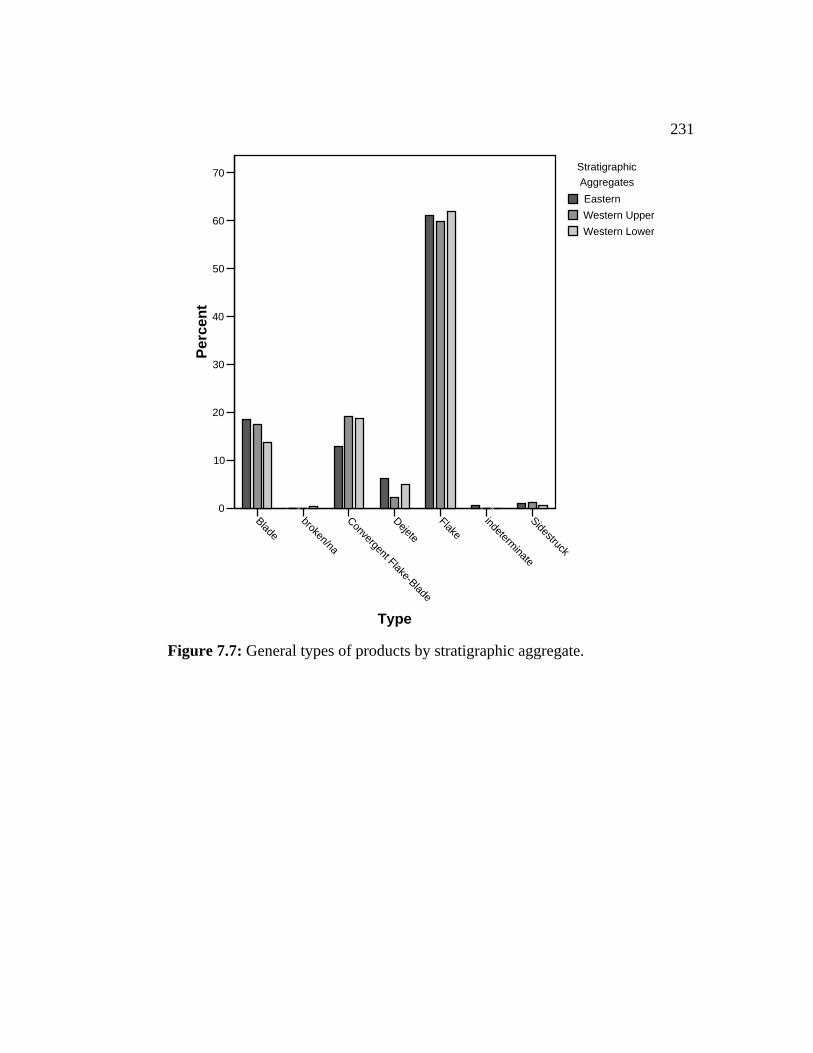
231
Bladebroken/na
Convergent Flake-Blade
DejeteFlake
indeterminate
Sidestruck
Type
0
10
20
30
40
50
60
70
Perc
ent
Stratigraphic AggregatesEasternWestern UpperWestern Lower
Figure 7.7: General types of products by stratigraphic aggregate.
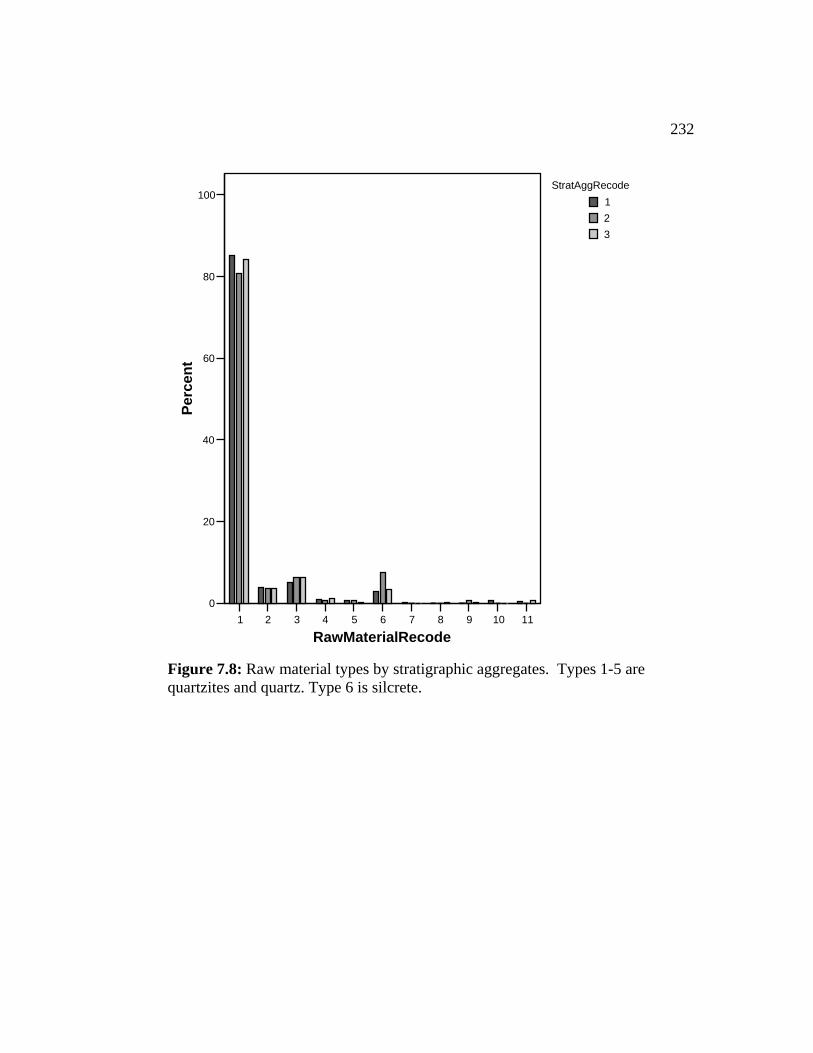
232
1 2 3 4 5 6 7 8 9 10 11
RawMaterialRecode
0
20
40
60
80
100Pe
rcen
tStratAggRecode
123
Figure 7.8: Raw material types by stratigraphic aggregates. Types 1-5 are quartzites and quartz. Type 6 is silcrete.

233
Figure 7.9: (1) Digital imaginVector map of the same artifacType 2 edge damage is markedartifacts of same size and shap
1
g of artifact on grid wt in GIS, Type 1 edg in gray; (3) Compo
e classes. Figure fro
2
ith cene damasite of vm Bird
3
#
troid marked; (2) ge is marked in black, ector maps for all and Minichillo 2005.
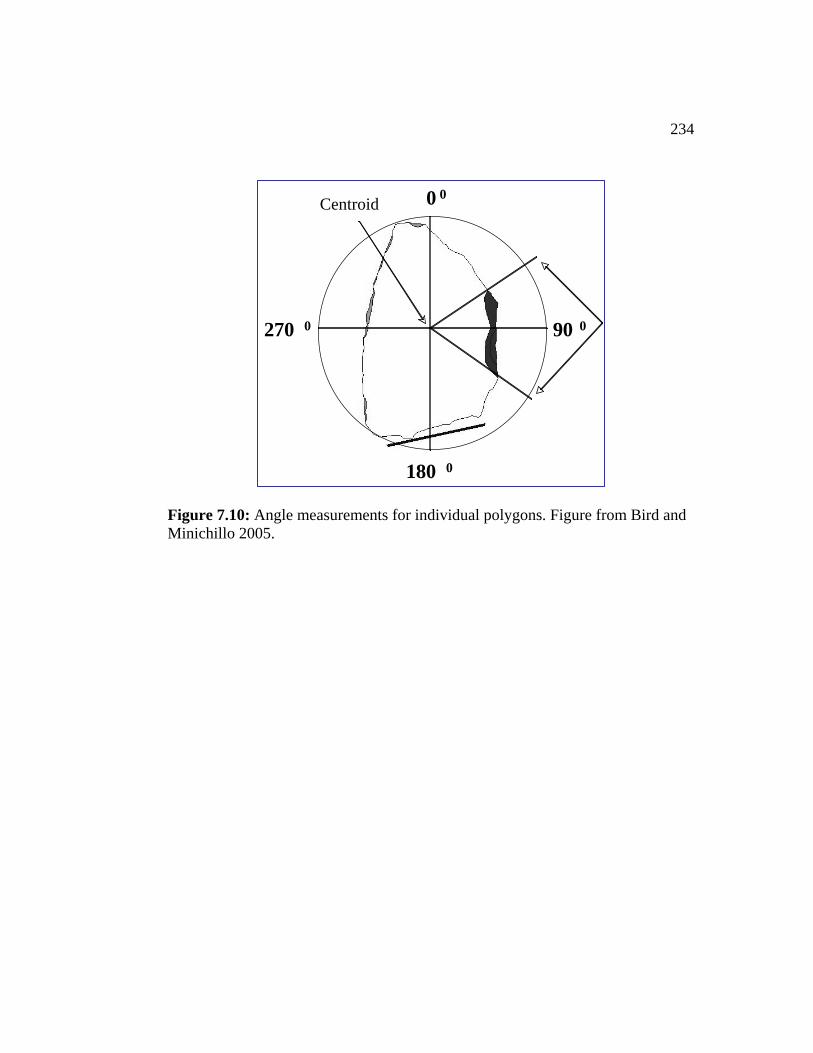
234
0 0
90 0
180 0
270 0
Centroid
Figure 7.10: Angle measurements for individual polygons. Figure from Bird and Minichillo 2005.

235
Figure 7.11: Rose diagrams of edge damage on convergent flakes. In each of the diagrams displayed the length of the petals are the total number of degrees of edge damage in that five degree arc. From top left to bottom right, Type 2 damage on dorsal faces, Type 2 damage on ventral faces, Type 2 damage on dorsal and ventral (flipped) combined, Types 1 and 2 damage combined. Figure from Bird and Minichillo 2005.

236
Figure 7.12: Apparent mammalian hair adhering to edge of lithic artifact, bar is 1 cm.
237
Chapter 8: Summary, Discussion, and Conclusions
This cape is a most stately thing, and the fairest cape we saw in the
whole circumference of the earth - Sir Francis Drake (Petty 1577).
The Cape coast of southern Africa is a remarkable place (see above quote from
Drake, a man who knew his capes). Not only remarkable for its natural beauty, it
is a place that has figured large in understanding the evolutionary history of our
species, and is increasingly so today.
During the MSA our species (Homo sapiens) emerged in Africa. The MSA began
at least 300,000 years ago and persisted until about 35,000 years ago, possibly
later in isolated patches. Anatomically modern skeletal material shows up in the
archaeological record at around 195 – 160,000 years ago. There remains little
debate that these skeletons represent populations that are the direct ancestors of
everyone on Earth today, and this is supported by genetic evidence as well. What
remains the subject of debate is when, and how, anatomically modern peoples
began to behave like us. One hypothesis, the Neural Advance model, holds that
modern behavior is a relatively late occurrence in the archaeological record, as
late as 40,000 years ago. Other models allow for modern behavior somewhat or
substantially earlier.
238Archaeology began in South Africa nearly as early as it did in Europe and North
America. While never approaching the density of archaeological research of
those areas a large number of MSA archaeological sites have been collected and
accessioned in South African museums. Access to those collections is good and
modern infrastructure makes long-term study less challenging. Additionally, this
modern infrastructure makes modern excavation and research much easier and
less costly than it would be in the less developed parts of Africa. These factors
may figure into the prominence of South Africa in African archaeology and
modern human origins research, but they do not negate its contributions. Just
because evidence is more likely to be found under these conditions does not take
away from the veracity of that evidence. And, if the evidence supports models
that are not merely descriptions of that evidence, then those models should be the
prevailing wisdom for archaeology and paleoanthropology. Currently this is not
the case. The prevailing wisdom is based on a model that is incompatible with the
archaeological evidence, as I have demonstrated in this dissertation.
This dissertation addressed the problem of the timing of the emergence of
behavioral modernity. I did this by first examining some of the long-held
assertions regarding MSA archaeological assemblages and the behaviors that have
been extrapolated from them. Second, I examined museum collections and
archived notes and correspondence, mostly from the first half of the Twentieth

239Century. And, third, I analyzed the lithic material from an on-going excavation at
an MSA cave site near Mossel Bay, South Africa.
Perhaps the most difficult issue regarding modern behavior is what exactly do we
mean when we say “modern”? Matching a list of traits or artifact attributes,
particularly one that was developed to differentiate between Homo
neanderthalensis and Homo sapiens in Western Europe, seems most unhelpful.
This becomes particularly evident when comparing the Holocene archaeological
record from all over the world with this supposed checklist for modernity. Things
like standardized bone tool manufacture, long distance trade, and spectacular rock
art are simply absent from much of the archaeological record for people that we
know were “modern”. For my purposes I defined modernity based on the concept
of phenotypic plasticity. That is, the overwhelming advantage to be a
technological animal is the rapidity with which we can adjust our phenotype in
response to new environmental and cultural settings. Rather than waiting to
evolve a specialized set of teeth or claws we make them. As tool use is
widespread among primates, it is not the use of tools, but rather, the rapidity with
which new technological strategies are developed that makes us special. From
this perspective no single technology would then be the marker of modernity,
rather modernity can only be observed in context.
240At what point in the African archaeological record is there a marked increase in
toolkit variability across space and time, where technological choices are drawn
from a suite of available and culturally constrained solutions? Answering that
question goes a long way in answering when “they” became “us”. To help in
addressing this question I placed what we know about the African MSA, the
archaeology, morphology, and genetics, in research context. I developed two
explanatory frameworks, the Klasies explanatory framework and the Blombos
explanatory framework, for that research context. I also proposed a model, the
rapid depositional model, to explain the apparent static nature of the technologies
in thick MSA cave deposits on the Cape coast.
Assertions of non-modernity of MSA peoples based on Eurocentric thought are
easy enough to dismiss (even though a view can be Eurocentric and still
essentially correct). What is more difficult to dismiss is the conclusion of Richard
G. Klein that MSA peoples were less effective in their use of the animal resources
available to them than LSA peoples in similar settings. In Klein’s view this alone
is enough to disqualify MSA people from being modern. Klein has had a
distinguished career as an archaeologist and analyst of African fauna and is the
author of the text on human evolution and paleoanthropology, The Human
Career. His voice of authority could not be louder and through his books and
many seminal articles this assertion of non-modernity for MSA peoples prior to

24150 – 40,000 years ago has gained wide currency among non-Africanist
archaeologists and the public.
Klein is a scholar of the highest caliber. He makes explicit statements that can
easily be tested using archaeological data and, more importantly, he publishes all
of the data that he used to reach his conclusions. The latter unfortunately remains
the exception, rather than the rule, in African prehistory. To examine the idea that
MSA peoples were less effective hunters I used Klein’s published data. I set as
my null hypothesis the idea that diversity, or taxonomic richness, should be higher
in LSA than it was in MSA assemblages. The sample sizes needed to be
accounted for as the assemblages vary in size by orders of magnitude. I chose to
use regression analysis, with richness on one axis and assemblage size on the
other, to compare the LSA and MSA data. In this type of analysis it is the slope
of the regression that matters and, if Klein is correct, the slope for the LSA data
should be significantly greater than that for the MSA data. I found just the
opposite to be the case. Additionally, some of the LSA data points lay very close
to the MSA regression line and I wanted to see if there was a temporal component
to that patterning. When I subdivided the LSA data into Pleistocene LSA and
Holocene LSA it became clear that there was. The Pleistocene LSA regression
line was nearly identical to the MSA regression line, while the Holocene LSA
regression line remained flat. This simple statistical exercise demonstrated two
things; my null hypothesis that Klein was correct could be rejected, and, there was

242a climatic component to the gross scale differences observed between MSA and
LSA faunal assemblages.
In order to offer an alternative explanation of the remaining pattern I used
behavioral ecological theory to show why and under what conditions different
prey would enter into the diet of Stone Age peoples. This type of explanation
requires neither an invisible shift in intellectual capacity (as Klein’s model does)
nor the collection of new types of data to be tested. Two parameters, the size of
the prey species and whether the species presents a physical threat, can be used to
model entirely the patterning in the faunal record. This model also shows that
while Pleistocene peoples were increasingly expanding their diets, Holocene
peoples were even more so. These dietary expansions might have been in
response to increasing population size or density or in reduced resource
availability.
A second characterization with a strong empirical basis of MSA peoples as
behaving in non-modern ways was presented by Stanley H. Ambrose and Karl G.
Lorenz in their seminal paper on lithic raw material use during the Howiesons
Poort sub-stage of the MSA at Klasies River. Utilizing published data, Ambrose
and Lorenz posed the interesting questions “What does the pattern of raw material
use tell us about mobility?” and, “What kind of mobility pattern would be
expected for modern hunter-gatherers in similar environmental settings?” That
243this examination should occur for the Howiesons Poort is not surprising. The
Howiesons Poort is one of the most remarkable technological occurrences during
the MSA. It is marked by an abundance of backed pieces, presumably (and now
demonstrably) as parts of composite tools and dates to around 60,000 years ago.
As a cultural phenomenon that is technologically sophisticated and earlier than
the 50,000 years cited in the Neural Advance model for behavioral modernity the
Howiesons Poort is certainly something that needs explaining.
Ambrose and Lorenz began their explanation by characterizing the nature of the
raw materials utilized by MSA people at Klasies River. Quartzite is locally
abundant (the caves are themselves made of quartzite), quartz is less abundant,
and silcrete, a fine-grained material whose bedrock sources are minimally scores
of kilometers distant from the caves, is even less so. During the Howiesons Poort
the occurrence of silcrete increased dramatically from its representation in earlier
and subsequent MSA layers. Fine-grained raw materials seem to have been
preferred for the manufacture of the distinctive composite tool components of the
Howiesons Poort. In the reporting of this site the original excavators lumped all
of the quartzites together as “local” and all of the quartzes, silcretes, and other
fine-grained materials as “exotic” or “nonlocal” for analytical purposes. Ambrose
and Lorenz made the error of interpreting “nonlocal” as literally meaning they
were from some distance away and it is this that led them to conclude that the

244Howiesons Poort peoples have much higher mobility than earlier and later MSA
peoples at Klasies.
While the bedrock sources for silcrete are quite distant the people at Klasies were
utilizing silcrete (and other “exotics) in the form of river transported or beach
cobbles. An examination of silcrete cores from Klasies clearly shows this. This
use of secondarily deposited silcrete cobbles is a recurrent theme at MSA sites
along the Cape coast and can be demonstrated for my assemblage from Pinnacle
Point 13B near Mossel Bay and at Blombos Cave. Additionally, quartz occurs in
both seams and cobbles coincident to the quartzite bedrock (hardly nonlocal). I
offered an alternative explanation that used a time-dependent model rather than a
distance dependent one. When this assumption is corrected Ambrose and
Lorenz’s analysis, and their conclusion of non-modernity, must be dismissed.
In addition to the Howiesons Poort an earlier MSA lithic phenomenon, the Still
Bay, has recently gathered attention as it is present at Blombos Cave in layers that
have yielded fine bone tools, geometric carvings on ochre, and shell beads. All of
these prominent items on the modernity “checklist”. Dating to around 75,000
years ago the Still Bay is marked by the presence of large fully bifacial points.
For my study I examined Still Bay points (and fragments) and debitage from all of
the known Still Bay assemblages with the exception of Blombos Cave (Blombos
Cave is the subject to on-going analysis by Marie Soressi). In analyzing the

245bifacial point fragments I developed a method for displaying composites of
points. These composites clearly show size and shape trends as well as what parts
of the points tend to be missing. I analyzed the debitage for bifacial thinning
flakes and was able to make comparisons to other MSA assemblages, including a
column from the Howieson’s Poort shelter. My results show that Still Bay points
were clearly hafted; and that they functioned as knives, spear points, and as
symbols. Still Bay points have a specific form that appears to have been
culturally determined. They are restricted in time and space and are thus a very
early unambiguous expression of style. This expression of style, coupled with the
personal adornment that appears at this time, suggests that group and linguistic
identity were constructed in fully modern ways by at least this time.
While examining the debitage from the Howieson’s Poort shelter I encountered a
most unusual artifact, a small silcrete backed blade that had a residue adhering to
one lateral. This residue appeared to be the remains of the adhesive that had
glued this tool into a handle. This is the first direct evidence of Howiesons Poort
tools actually being hafted as part of composite tools, confirming their long-
speculated-on function. I applied for and received permits from the South African
Heritage Resource Agency, and organized a team of specialists from South
Africa, Australia, and the United States to analyze the blade. While not as
comprehensive as I had initially hoped the results of this study do demonstrate the
hafting of the backed pieces of the Howiesons Poort and that, at least in one case,

246they were parts of composite scrapers, not armatures of spears as has been widely
conjectured.
I served for two field seasons (2003, 2004) as the laboratory director and lithic
analyst for the Mossel Bay Archaeology Project (MAP). MAP is a large,
internationally-staffed, and on-going research program examining the MSA from
traditional and innovative perspectives. Currently we are focused on a large MSA
deposit-bearing cave, Pinnacle Point 13B. The lithic artifacts that I have analyzed
from that cave as part of this project both provide a comparison to my museum
collection studies and stand alone as a new contribution to the understanding of
MSA technology. My results remain tentative while the issues of dating are
resolved and further excavation is undertaken. What can be said is that a post-
Howiesons Poort component is present in the cave and that some earlier
components are as well. By looking at these artifacts with the new eye required
by the Blombos explanatory framework some interesting results in usewear
patterning and the presence of hairs was noted.
Taken as a whole, the accumulating field evidence already amounts to a clear
rebuttal to the idea that modern behavior is a development of the past 50,000
years. It suggests that full intellectual capacity and social and linguistic
constructions are in place by at least 75,000 years ago in southern Africa and this
can be considered an upper limit, the latest, not earliest, that modernity arose in
247our evolutionary past. I examined the only two explanations of the MSA record
that support a recent date for modernity and are empirically-based, those of Klein
and Ambrose and Lorenz, and found that they can each be dismissed on empirical
grounds. Beyond simply dismissing the existing explanations I have proposed
new explanations that can be tested using archaeological data.
The lack of research, in the areas and of the intensity required by the largest
question for world archaeology and human evolution is being slowly remedied. A
growing handful of dedicated archaeologists is addressing this deficiency and I
count myself among them. This dissertation is only a first step in my contribution
to solving these problems. Very few people working in Africa are in it halfway.
As Klein recently said (although in making an entirely different argument),
“…interesting ideas are easier to come by than well-dated sites…and in the end
the separation of pattern from noise will depend mainly on the accumulation of
additional high-quality data” (2000:33). So we wait while Blombos and
Diepkloof, Sibudu and Pinnacle Point fill in the partial sketch provided by
Klasies. As that sketch is filled in some details are becoming clear; that
anatomically modern humans were behaving in fully modern ways by at least
75,000 years ago in southern Africa. And the time depth for this is likely much
earlier as we have pretty good evidence for sophisticated behaviors back to OIS
5e (125 kya). That MSA technologies are diverse, have a rapid cycle of change,
248and exhibit "style". And that the much asserted “sub-optimal” patterns in MSA
behavior are not fully supported by the data.
As modern excavations and new analytical methods fill in the gaps in the Klasies
sequence and provide additional variability in human behaviors it is clear that
these people were us; us living in Upper Pleistocene Africa, but still recognizably
you and me. As modern humanity (or so the genes suggest) began to diverge by
at least 100 kya the people of the Still Bay sub-stage may be the oldest population
that we currently know of that we can reasonably assume has issue. The Cape
coast of southern Africa may not be where we all ultimately come from but, if
not, it was somewhere in the neighborhood and those neighbors were behaving in
very similar ways.

249Bibliography
Adcock, G. J., E. S. Dennis, S. Easteal, G. A. Huttley, L.S. Jermiin, W. J. Peacock and A. Thorne 2001 “Mitochondrial DNA Sequences in Ancient Australians: Implications for Modern Human Origins.” Proceedings of the National Academy of Science 98:537-542. Ambrose, S. H. 1998 “Chronology of the Later Stone Age and Food Production in East Africa.” Journal of Archaeological Science 25:377-392. 2001 “Paleolithic Technology and Human Evolution.” Science 291:1748-1753. 2002 “Early Microlithic Industries in Sub-Saharan Africa.” In, Thinking Small: Global Perspectives on Microlithization, pp. 9-29, edited by R. G. Elston and S. L. Kuhn. Archeological Papers of the American Anthropological Association, Number 12. Arlington, Virginia. Ambrose, S. H. and K. G. Lorenz 1990 “Social and Ecological Models for the Middle Stone Age in Southern Africa.” In, The Emergence of Modern Humans, pp. 3-33, edited by P. A. Mellars. Edinburgh University Press, Edinburgh. Anthony, B. W. 1972 “The Stillbay Question.” In, Actes du VIe Congrès panafricain de préhistorie, Dakar, 1967, pp. 80-82, edited by H. J. Hugot. Les Imprimeries Réunies de Chambéry, Chambéry. Avery, D. M. 1986 “Preliminary Interpretation of Micromammalian Remains from the 1984 Excavations at Klasies River Mouth 1A, Cape Province, South Africa.” Palaeoecology of Africa and the Surrounding Islands 17:39-47. 1987 “Late Pleistocene Coastal Environment of the Southern Cape Province of South Africa: Micromammals from Klasies River Mouth.” Journal of Archaeological Science 14:405-421. 1990 “Late Quaternary Environmental Change in Southern Africa based on Micromammalian Evidence: A Synopsis.” Palaeoecology of Africa and the Surrounding Islands 21:131-142.
250Bar-Yosef, O. 2002 “The Upper Paleolithic Revolution.” Annual Review of Anthropology 31:363-393. Bartram, L. E. and C. W. Marean 1999 “Explaining the ‘Klasies Pattern’: Kua Ethnoarchaeology, the Die Kelders Middle Stone Age Archaeofauna, Long Bone Fragmentation and Carnivore Ravaging.” Journal of Archaeological Science 26:9-29. Beaumont, P. B. 1980 “On the Age of the Border Cave Hominids 1- 5.” Palaeontologia Africana 23:21-33. Beaumont, P. B., K. de Villiers, and J. C. Vogel 1978 “Modern man in sub-Saharan Africa prior to 49,000 years B.P.: a review and reevaluation with particular reference to Border Cave.” South African Journal of Science 74:409-419. Binford, L. R. 1980 “Willow Smoke and Dogs’ Tails: Hunter-Gatherer Settlement Systems and Archaeological Site Formation.” American Antiquity 45(1):4-20. 1981 Bones: Ancient Men and Modern Myths. Academic Press, New York. 1984 Faunal Remains from Klasies River Mouth. Academic Press, New York. Bird, C. 2005 Edge Damage Distribution on Convergent Flakes: A Case Study from the MSA of Southern Africa. Unpublished honors thesis, Arizona State University. Bird, C. and T. Minichillo 2005 Utilizing GIS in the Analysis of Retouch and Usewear in the Middle Stone Age of Southern Africa. Poster presented at the 70th Annual Meeting of the Society for American Archaeology, Salt Lake City. Bird, D. W. and R. L. Bliege-Bird 1997 “Contemporary Shellfish Strategies among the Meriam of the Torres Straits Islands, Australia: Testing Predictions of a Central Place Foraging Model.” Journal of Archaeological Science 24:39-63. 2000 “The Ethnoarchaeology of Juvenile Foragers: Shellfishing Strategies among Meriam Children.” Journal of Anthropological Archaeology 19:461-476.

251Blades, B. S. 1999 “Aurignacian Lithic Economy and Early Modern Human Mobility: New Perspectives from Classic Sites in the Vézère valley of France.” Journal of Human Evolution 37:91-120. Bräuer, G. and R. Singer 1996 “The Klasies Zygomatic Bone: Archaic or Modern?” Journal of Human Evolution 30:161-165. Brooks, A. S., D. H. Helgren, J. S. Cramer, A. Franklin, W. Hornyak, J. M. Keating, R. G. Klein, W. J. Rink, H. Schwartcz, J. N. Leith Smith, K. Stewart, N. E. Todd, J. Verniers, and J. E. Yellen 1995 “Dating and Context of Three Middle Stone Age Sites with Bone Points in the Upper Semliki Valley, Zaire.” Science 268:548-553. Broughton, J. M. 1994a “Late Holocene Resource Intensification in the Sacramento Valley, California: The Vertebrate Evidence.” Journal of Archaeological Science 21:501-514. 1994b “Declines in Mammalian Foraging Efficiency during the Late Holocene, San Francisco Bay, California.” Journal of Anthropological Archaeology 13:371-401. Brown, K. S. n.d. “Middle Stone Age Lithics from the 2000 Excavations at the Pinnacle Point Cave Complex, South Africa.” Unpublished manuscript on file with the Mossel Bay Archaeology Project, Institute of Human Origins, Tempe. Burkitt, M. C. 1928 South Africa’s Past in Stone & Paint. Cambridge University Press, London. Bush, D. A., J. K. Feathers, G. Avery, H. Deacon, and R. Klein 1998 “Luminescence Dating of South African Middle Stone Age Sediments.” Paper presented at the 62nd Meeting of the Society for American Archaeology, Seattle, WA. Butzer, K. W. 1982 “Geomorphology and Sediment Stratigraphy.” In, The Middle Stone Age at Klasies River Mouth in South Africa, edited by R. Singer and J. Wymer. University of Chicago Press, Chicago.
252Cann, R. L. 1988 “DNA and Human Origins.” Annual Review of Anthropology 17:127-143. Cann, R. L., M. Stoneking, and A. C. Wilson 1987 “Mitochondrial DNA and Human Evolution.” Nature 325:31-36. Cannon, M. D. 2001 “Archaeofaunal Relative Abundance, Sample Size, and Statistical Methods.” Journal of Archaeological Science 28:185-195. Carmelli, D., C. Lalueza-Fox, C. Vernesi, M. Lari, A. Casoll, F. Mallegni, B. Chiarelli, I. Dupanloup, J. Bertranpetit, G. Barbujani, and G. Bertorelle 2003 “Evidence for a Discontinuity between Neandertals and 24,000-Year-Old Modern Europeans.” Proceedings of the National Academy of Sciences of the United States of America 100:6593-6597. Caspari, R. and S.-H. Lee 2004 “Older Age Becomes Common Late in Human Evolution.” Proceedings of the National Academy of Sciences of the United States of America 101:10895-10900. Cavalli-Sforza, L. L. 1997 “Genes, Peoples, and Language.” Proceedings of the National Academy of Sciences of the United States of America 94:7719-7724. Cavalli-Sforza, L.L., P. Menozzi, and A. Piazza 1994 The History and Geography of Human Genes. Princeton University Press, Princeton. Clark, J. D. 1959 The Prehistory of Southern Africa. Pelican, London. 1981 Tools and Ourselves: An African Legacy. Witwatersrand University Press, for the Institute for the Study of Man in Africa, Johannesburg. Clark, J. D., Y. Beyene, G. WoldeGabriel, W. K. Hart, P. R. Renne, H. Gilbert, A. Defleur, G. Suwa, S. Katoh, K. R. Ludwig, J.-R. Boisserie, B. Asfaw, and T. White. 2003 “Stratigraphic, Chronological, and Behavioral Contexts of Pleistocene Homo sapiens from Middle Awash, Ethiopia.” Nature 423:747-752.
253Cole, S. C. 2002 Lithic Raw Material Exploitation between 30,000 BP and 40,000 BP in the Perigord, France. Unpublished doctoral dissertation, University of Washington, Seattle. Conard, N. J., T. J. Prindiville, and A. W. Kandel 1999 “The 1998 Fieldwork on the Stone Age Archaeology and Paleoecology of the Geelbek Dunes, West Coast National Park, South Africa.” Southern African Field Archaeology 8:35-45. Conard, N. J., M. Soressi, J. E. Parkington, S. Wurz, and R. Yates 2004 “A Unified Lithic Taxonomy Based on Patterns of Core reduction.” South African Archaeological Bulletin 59:12-16. Coolidge, F. L. and T. Wynn 2005 “Working Memory, its Executive Functions, and the Emergence of Modern Thinking.” Cambridge Archaeological Journal 15:5-26. Darwin, C. 1871 The Descent of Man and Selection in Relation to Sex. D. Appleton and Co., New York. Deacon, H. J. 1989 “Late Pleistocene Paleoecology and Archaeology of the Southern Cape.” In, The Human Revolution: Behavioral and Biological Perspectives on the Origins of Modern Humans, edited by P. Mellars and C. B. Stringer. Edinburgh University Press, Edinburgh. 1995 “Two Late Pleistocene-Holocene Archaeological Depositories from the Southern Cape, South Africa.” South African Archaeological Bulletin 50:121-131. Deacon, H. J. and J. Deacon 1999 Human Beginnings in South Africa. David Philip, Cape Town. Deacon, H. J. and V. Geleijnse 1988 “The Stratigraphy and Sedimentology of the Main Site Sequence, Klasies River, South Africa. South African Archaeological Bulletin 43:5-14. Deacon, H. J., A. S. Talma, and J. C. Vogel 1988 “Biological and Cultural Development of Pleistocene People in an Old World Southern Continent.” Early Man in the Southern Hemisphere, Supplement to Archaeometry: Australasian Studies 1988, edited by J. R. Prescott, pp. S23-S31. University of Adelaide, Adelaide.

254 Deacon, H. J. and S. Wurz 1996 “Klasies River Main Site, Cave 2: A Howiesons Poort Occurrence.” In, Aspects of African Archaeology, pp. 213-218, edited by G. Pwiti and R. Soper. University of Zimbabwe Publications, Harare. Deacon, J. 1979 Guide to the Archaeological Sites in the Southern Cape. University of Stellenbosch, Stellenbosch. 1995 “The Unsolved Mystery at the Howieson’s Poort Name Site.” South African Archaeological Bulletin 162:110-120. d’Errico, F. C. S. Henshilwood, and P. Nilssen 2001 “An Engraved Bone Fragment from ca. 75 kya Middle Stone Age Levels at Blombos Cave, South Africa: Implications for the Origin of Symbolism and Language.” Antiquity 75:309-318. d’Errico, F., C. Henshilwood, M. Vanhaeren, and K. van Niekerk 2005 “Narrsarius kraussianus Shell Beads from Blombos Cave: Evidence for Symbolic Behavior in the Middle Stone Age.” Journal of Human Evolution 48:3-24. Dillehay, T. D. 2000 The Settlement of the Americas: A New Prehistory. Basic Books, New York. Disotell. T. R. 1999 “Human Evolution: Origins of Modern Humans Still Look Recent.” Current Biology 9:R647-R650. Ehrlich, P. R. 2000 Human Natures: Genes, Cultures, and the Human Prospect. Penguin, New York. Eswaran, V., H. Harpending, and A. R. Rogers 2005 “Genomics Refutes an Exclusively African Origin of Humans.” Journal of Human Evolution 49:1-18. Evans, U. 1994 “Hollow Rock Shelter, A Middle Stone Age Site in the Cederberg.” South African Field Archaeology 3:63-73.

255Feathers, J. K. 1996 “Luminescence Dating and Modern Human Origins.” Evolutionary Anthropology 5:25-36. 2002 “Luminescence Dating in Less than Ideal Conditions: Case Studies from Klasies River Main Site and Duinefontein, South Africa.” Journal of Archaeological Science 29:177-194. Feathers, J. K. and D. A. Bush 2000 “Luminescence Dating of Middle Stone Age Deposits at Die Kelders.” Journal of Human Evolution 38:91-120. Feblot-Augustins, J. 1990 “Exploitation des Matières Premières dan l’Aucheuléen d’Afrique: Perspectives Comportementales.” Paléo 2:27-42. Foley, R. A. 1987 “Hominid Species and Stone Tool Assemblages: How are they Related?” Antiquity 61:380-392. Foley, R. A. and M. M. Lahr 1997 “Mode 3 technologies and the evolution of modern humans.” Cambridge Archaeological Journal 7:3-36. 2003 “On Stony Ground: Lithic Technology, Human Evolution, and the Emergence of Culture.” Evolutionary Anthropology 12:109-122. Frayer, D., M. Wolpoff, A. Thorne, F. Smith, and G. Pope 1993 “Theories of Modern Human Origins: The Paleontological Test.” American Anthropologist 95:14-50. Gamble, C. 1994 Timewalkers: The Prehistory of Global Colonization. Alan Sutton, Stroud. Gardener, P. S. 1997 “The Ecological Structure and Behavioral Implications of Mast Exploitation Strategies.” In, People, Plants, and Landscapes: Studies in Paleoethnobotany, edited by K. J. Gremillion. The University of Alabama Press, Tuscaloosa. Gatehouse, R. P. n.d. Collected papers on file at the South African Museum, Cape Town.
2561955 “The Prehistoric Site at Cape Hangklip.” Transactions of the Royal Society of South Africa 34:335-345. Goodwin, A. J. H. 1926a “South African Stone Implement Industries.” South African Journal of Science 23:784-788. 1926b “The Hardy Collection of Stone Implements.” South African Journal of Science 23:826-832. 1927 “South African Archaeology.” Man 27, article 14. 1928a “An Introduction to the Middle Stone Age in South Africa.” South African Journal of Science 25:410-418. 1928b “Sir Lanham Dale’s Collection of Stone Implements.” South African Journal of Science 5:419-425. 1930 “The Chronology of the Mossel Bay Industry.” South African Journal of Science 27:562-572. 1935 “A Commentary on the History and Present Position of South African Prehistory with Full Bibliography.” Bantu Studies 9:291-417. 1946 “The Loom of Prehistory.” South African Archaeological Society Handbook Series 2:1-151. Goodwin A. J. H. and B. D. Malan 1935 “Archaeology of the Cape St. Blaize Cave, and Raised Beach, Mossel Bay.” Annals of the South African Museum 34:111-140. Goodwin, A. J. H. and C. Van Riet Lowe 1929 “The Stone Age Cultures of South Africa.” Annals of the South African Museum 27:1-146. Gould, R. 1977 Puntutjarpa Rockshelter and the Australian Desert Culture. Anthropological papers, Vol. 54, American Museum of Natural History, New York. Grayson, D. K. 1984 Quantitative Zooarchaeology. Academic Press, Orlando.
2571989 “Sample Size and Relative Abundance in Archaeological Analysis: Illustrations from Spiral Fractures and Seriation.” In, Quantifying Diversity in Archaeology, edited by R. D. Leonard and G. T. Jones. Cambridge University Press, Cambridge. Grayson, D. K. and M. D. Cannon 1999 “Human Paleoecology and Foraging Theory in the Great Basin.” In, Current Models in Great Basin Archaeology, edited by C. Beck. University of Utah Press, Salt Lake City. Grayson, D. K. and F. Delpech 1998 “Changing Diet Breadth in the Early Upper Paleolithic of Southwestern France.” Journal of Archaeological Science, Vol. 25:1119-1129. Gremillion, K. J. 1997 “New Perspectives on the Paleoethnobotany of the Newt Kash Shelter.” In, People, Plants, and Landscapes: Studies in Paleoethnobotany, edited by K. J. Gremillion. The University of Alabama Press, Tuscaloosa. Grine, F. E. 1998 “Additional Human Fossils from the Middle Stone Age of Die Kelders Cave 1, South Africa: 1995 Excavation.” South African Journal of Science 94:229-235. 2000 “Middle Stone Age Human Fossils from Die Kelders Cave 1, Western Cape Province, South Africa.” Journal of Human Evolution 38:129-145. Grine, F. E., R. G. Klein and T.E. Volman 1991 “Dating, archaeology and human fossils from the Middle Stone age levels of Die Kelders, South Africa.” Journal of Human Evolution 21:363-395. Grine, F. E., O. M. Pearson, R. G. Klein and G. P. Rightmire 1998 “Additional human fossils from Klasies River Mouth, South Africa.” Journal of Human Evolution 35:95-107. Grün, R. and P. Beaumont 2001 “Border Cave Revisited: A Revised ESR Chronology.” Journal of Human Evolution 40:467-482. Grün, R. and C. B. Stringer 1991 “Electron Spin Resonance Dating and the Evolution of Modern Humans.” Archaeometry 33:153-199.
258Harpending, H. C., M. A. Batzer, M. Gurven, L. B. Jorde, A. R. Rogers, and S. T. Sherry 1998 “Genetic Traces of Ancient Demography.” Proceedings of the National Academy of Sciences of the United States of America 95:1961-1967. Harris, E. E. and J. Hey 1999 “Human Demography in the Pleistocene: Do Mitochondrial and Nuclear Genes Tell the Same Story?” Evolutionary Anthropology 8:81-86. Heese, C. H. T. D. n.d. Collected papers of C. H. T. D. Heese, on file at Iziko: South African Museum, Cape Town. Hedges, S. B., S. Kumar, K. Tamura, and M. Stoneking 1992 Human Origins and Analysis of Mitochondrial DNA Sequences.” Science 255:737-739. Henshilwood, C. 2004 “Marine Shell Beads from 75,000-year-old Levels at Blombos Cave.” The Digging Stick 21:1-4. Henshilwood, C. S. and C. W. Marean 2004 “The Origin of Modern Human Behavior: A Review and Critique of Models and Test Implications.” Current Anthropology 44:627-651. Henshilwood, C. and J. Sealy 1997 “Bone Artifacts from the Middle Stone Age, Blombos Cave, Southern Cape, South Africa.” Current Anthropology 38:890-895. Henshilwood, C. S., J. C. Sealy, R. Yates, K. Cruz-Uribe, P. Goldberg, F. E. Grine, R. G. Klein, C. Poggenpoel, K. van Niekerk, and I. Watts 2001a “Blombos Cave, Southern Cape, South Africa: Preliminary Report on the 1992-1999 Excavations of the Middle Stone Age Levels.” Journal of Archaeological Science 28:421-448. Henshilwood, C. S., F. d’Errico, C. W. Marean, R. Milo, and R. Yates 2001b “An Early Bone Tool Industry from the Middle Stone Age at Blombos cave, South Africa: Implications for the Origins of Modern Human Behavior, Symbolism, and Language.” Journal of Human Evolution 41:631-678. Henshilwood, C. S., F. d’Errico, R. Yates, Z. Jacobs, C. Tribolo, G. A. T. Duller, N. Mercier, J. C. Sealy, H. Valladas, I. Watts, and A. Wintle 2002 “Emergence of Modern Human Behavior: Middle Stone Age Engravings from South Africa.” Science 295:1278-1280.
259Henshilwood, C., F. d’Errico, M. Vanhaeren, K. van Niekerk, Z. Jacobs 2004 “Middle Stone Age Shell Beads from South Africa.” Science 304:404. Hofreiter, M., D. Serre, H. N. Poinar, M. Kuch, S. Pääbo 2001 “Ancient DNA.” Nature Genetics 2:353-359. Holdaway, S. and L. A. Wandsnider 2004 “Temporal Scales and Archaeological Landscapes from the Eastern Desert in Australia and the Intermontane of North America.” In, Confronting Scales in Archaeology: Issues of Theory and Practice, edited by G. Lock and B. Molyneaux. Kluwer, London. Holliday, T. W. 1997 “Body Proportions in Late Pleistocene Europe and Modern Human Origins.” Journal of Human Evolution 32:423-447. Inskeep, R. R. 1978 The Peopling of Southern Africa. David Philip, Cape Town. Irish, J. D. 1997 “Ancestral Dental Traits in Sub-Saharan Africans and the Origins of Modern Humans.” Journal of Human Evolution 34:81-98. Jacobs, Z. 2004 Development of Luminescence Dating Techniques for Dating of Middle Stone Age Sites in South Africa. Unpublished Doctoral Dissertation, University of Wales, Aberystwyth. Jacobs, Z., G. A. T. Duller, and A. Wintle 2003 “Optical Dating of Dune Sand from Blombos Cave II: Single Grain Data.” Journal of Human Evolution 44:613-625. Kaplan, J. 1990 “The Umhlatuzana Rock Shelter Sequence: 100,000 Year of Stone Age History.” Natal Museum Journal of Humanities 2:1-94. 1997 Archaeological Study: Proposed Pinnacle Point Development. Unpublished report, Agency for Cultural Resource Management, Riebeek West, South Africa. Kaplan, H. and K. Hill 1992 “The evolutionary ecology of food acquisition.” In, Evolutionary Ecology and Human Behavior, edited by E. A. Smith and B. Winterhalder. Aldine de Gruyter, New York.
260Keith, A. 1931 New Discoveries Relating to the Antiquity of Man. Norton, London Keller, C. M. 1973 “Montagu Cave in Prehistory: A Descriptive Analysis.” University of California Anthropological Records 28:1-98. Kelly, R. L. 1988 “The Three Sides of a Biface.” American Antiquity 53(4):717-734. Klein, R. G. 1970 “Problems in the Study of the Middle Stone Age of South Africa.” South African Archaeological Bulletin 99:127-135. 1972 “The Late Quaternary Mammalian Fauna of Nelson Bay Cave (Cape Province, South Africa): Its Implications for Megafaunal Extinctions and Environmental and Cultural Change.” Quaternary Research 2:135-142. 1974 “Environment and Subsistence of Prehistoric Man in the Southern cape Province.” World Archaeology, vol. 5 no. 3:249-284. 1975 “The Mammalian Fauna of the Klasies River Mouth Sites, Southern Cape Province, South Africa.” South African Archaeological Bulletin 31:74-98. 1976 “The Mammalian Fauna of the Klasies River Mouth Sites, Southern Cape Province, South Africa.” South African Archaeological Bulletin 31:75-98. 1979 “Stone Age Exploitation of Animals in Southern Africa.” American Scientist 67:151-160. 1980 “Environmental and Ecological Implications of Large Mammals from Upper Pleistocene and Holocene sites in Southern Africa.” Annals of the South African Museum 81:223-283. 1991 “Size Variation in the Cape Dune Molerat (Batyergus suillus) and Late Quaternary Climatic Change in the Southwestern Cape Province, South Africa.” Quaternary Research 36:243-256. 1992 “The Archaeology of Modern Human Origins.” Evolutionary Anthropology 1:5-14. 1994 “The Problem of Modern Human Origins.” In, Origins of Anatomically Modern Humans, edited by M. H Nitecki and D. V. Nitecki. Plenum Press, New York.
2611995 “Anatomy, Behavior, and Modern Human Origins.” Journal of World Prehistory 9:167-198. 1999 The Human Career: Human Biological and Cultural Origins, 2nd edition. The University of Chicago Press, Chicago. 2000 “Archaeology and the Evolution of Human Behavior.” Evolutionary Anthropology 9:17-36. Klein, R. G., G. Avery, K. Cruz-Uribe, D. Halkett, J. E. Parkington, T. Steele, T. P. Volman, and R. Yates 2004 “The Ysterfontein 1 Middle Stone Age Site, South Africa, and Early Human Exploitation of Coastal Resources.” Proceedings of the National Academy of Sciences of the United States of America 101:5708-5715. Klein, R. G. and K. Cruz-Uribe 1996 “Exploitation of large bovids and seals at Middle and Later Stone Age sites in South Africa.” Journal of Human Evolution 31:315-334. Klein, R. G. and B. Edgar 2002 The Dawn of Human Culture. John Wiley and Sons, New, York. Knight, A. 2003 “The Phylogenetic Relationship between Neandertal and Modern Human Mitochondrial DNAs Based on Informative Nucleotide Sites.” Journal of Human Evolution 44:627-632. Krings, M., C. Capelli, F. Tschentsher, H. Geisert, S. Meyer, A. von Haeseler, K. Grossschmidt, G. Possnert, M. Paunovic, and S. Pääbo 2000 “A View of Neandertal Diversity.” Nature Genetics 26:144-146. Krings, M., H. Geisert, R. W. Schmitz, H. Kraininzki, and S. Pääbo 1999 Proceedings of the National Academy of Sciences of the United States of America 96:5581-5585. Krings, M., A. Stone, R. W. Schmitz, H. Kraininzki, M. Stoneking, and S. Pääbo 1997 “Neandertal DNA Sequences and the Origin of Modern Humans.” Cell 90:19-30. Kuhn, S. L. 1995 Mousterian Lithic Technology: An Ecological Perspective. Princeton University Press, Princeton.
262Leith, G. 1898 “On the Caves, Shell-Mounds and Stone Implements of South Africa.” Journal of the Royal Anthropological Institute 28:258-274. Lewin, Roger 1998 The Origin of Modern Humans. Scientific American Library, New York. Lombard, M. 2005 “Evidence of Hunting and Hafting during the Middle Stone Age at Sibudu Cave, KwaZulu-Natal, South Africa: A Multianalytical Approach.” Journal of Human Evolution 48:279-300. Mabbutt, J. A. 1951 “Cape Hangklip: A Study in Coastal Geomorphology.” Transactions of the Royal Society of South Africa 34:17-24. Madsen, D. B. and D. N. Schmitt 1996 “Mass Collecting and the Diet Breadth Model: A Great Basin Example.” Paper presented at the 25th Great Basin Anthropological Conference, Kings Beach, California. Malan, B. D. 1955 “The Archaeology of Tunnel cave and Skildergat Kop, Fish Hoek.” South African Archaeology Bulletin 10:3-9. Malan, F. n.d. Letter to Heese, Collected papers of C. H. T. D. Heese, on file at Iziko: South African Museum, Cape Town. Malan, J. A. 1991 “Lithostratigraphy of the Klein Brak Formation (Bredasdorp Group).” Lithostratigraphic Series No. 13. South African Committee for Stratigraphy, Pretoria. Marean, C. W. and Z. Assefa 2004 “The Middle and Upper Pleistocene African Record for the Biological and Behavioral Origins of Modern Humans. In Stahl, A. (ed.) African Archaeology: A critical Introduction, pp. 93-129. Blackwell, Malden. Marean, C. W, P. Goldberg, G. Avery, F. E. Grine, and R. G. Klein 2000 “Middle Stone Age Stratigraphy and Excavations at Die Kelders Cave 1 (Western Cape Province, South Africa): the 1992, 1993, and 1995 Field Seasons.” Journal of Human Evolution 38:7-42.
263Marean, C. W. and P. J. Nilssen 2001 The Mossel Bay Archaeology Project (MAP): Background and Preliminary Results from Test Excavations of Middle Stone Age Sites at Pinnacle Point, Mossel Bay. Progress report prepared for the South African Heritage Resource Agency (SAHRA). Marean, C. W., Nilssen, P. J., Brown, K., Jerardino, A., and D. Stynder 2004 “Paleoanthropological Investigations of Middle Stone Age Sites at Pinnacle Point, Mossel Bay (South Africa): Archaeology and Hominid Remains from the 2000 Field Season.” PaleoAnthropology Mason, R. J. 1962 Prehistory of the Transvaal: A record of Human Activity. Witwatersrand University Press, Johannesburg. McBrearty, S. 1981 “Songhor: A Middle Stone Age Site in Western Kenya.” Quaternaria 23:171-190. 1986 The Archaeology of the Muguruk Site, Western Kenya. Unpublished Doctoral Dissertation, University of Illinois. 1988 “The Sangoan–Lupemban and Middle Stone Age sequence at the Muguruk site, Western Kenya.” World Archaeology 19:379-420. McBrearty, S. and A. S. Brooks 2000 “The Revolution That Wasn’t: A New Interpretation of the Origin of Modern Human Behavior.” Journal of Human Evolution 39:453-563. McDougall, I., F. H. Brown, J. G. Fleagle 2005 “Stratigraphic Placement and Age of the Modern Humans from Kibish, Ethiopia.” Nature 433:733-736. Mehlman, M. J. 1977 “Excavations at Nasera Rock, Tanzania.” Azania 12:111-118. 1979 “Mumba-Höhle Revisited: The Relevance of a Forgotten Excavation to Some Current Issues in East African Prehistory.” World Archaeology 11:80-94. 1989 Late Quaternary Archaeological Sequences in Northern Tanzania. Unpublished Doctoral Dissertation, University of Illinois.

2641991 “Context for the Emergence of Modern Man in Eastern Africa: Some New Tanzanian Evidence.” In Cultural Beginnings: Approaches to Understanding Early Hominid Lifeways in the African Savanna, pp. 177-196, edited by J. D. Clark. Monographien 19, Forschunginstitut für Vor- und Frühgeschichte, Römisch-Germanisches Zentralmuseum, Bonn. Mellars, P. 1973 “The Character of the Middle-Upper Paleolithic Transition in Southwest France.” In, The Explanation of Culture Change: Models in Prehistory, edited by C. Renfrew, pp. 255-276. University of Pittsburgh Press, Pittsburgh. 1989 “Major Issues in the Emergence of Modern Humans.” Current Anthropology 30:349-385. 2005 “The Impossible Coincidence. A Single Species Model for the Origins of Modern Human Behavior in Europe.” Evolutionary Anthropology 14:12-27. Meltzer, D. J. 1997 “Monte Verde and the Pleistocene Peopling of the Americas.” Science 276:754-755. Meltzer, D. J., D. K. Grayson, G. Ardila, A. W. Barker, D. F. Dincauze, C. V. Haynes, F. Mena, L. Nunez, and D. J. Stanford 1997 “On the Pleistocene Antiquity of Monte Verde, Southern Chile.” American Antiquity 62:659-664. Milo, R. G. 1998 “Evidence for Hominid Predation at Klasies River Mouth, South Africa, and its Implications for the Behavior of Early Modern Humans.” Journal of Archaeological Science 25:99-133. Mitchell, P. 2002a The Archaeology of Southern Africa. Cambridge University Press, Cambridge. 2002b Catalogue of Stone Age Artefacts from Southern Africa in the British Museum. British Museum Press, London. Minichillo, T. 1999 A Hard Rock is Good to Find: Foraging Strategies and Lithic Resource Modeling. Paper presented at the 64th Annual Meeting of the Society for American Archaeology, Chicago.
265Nagaoka, L. 2005 “Declining Foraging Efficiency and Moa Carcass Exploitation in Southern New Zealand.” Journal of Archaeological Science 32:1328-1338.
O’Connell, J. F. and K. Hawkes 1981 “Alyawara Plant Use and Optimal Foraging Theory.” In, Hunter-Gatherer Foraging Strategies: Ethnographic and Archaeological Analyses, edited by B. Winterhalder and E. A. Smith. University of Chicago Press, Chicago. O’Connell, J. F., K. Hawkes, and N. G. Blurton Jones 1988 “Hadza Hunting, Butchering, and Bone Transport and their Archaeological Implications.” Journal of Anthropological Research 44:113-161. 1990 “Reanalysis of Large Mammal Body Part Transport among the Hadza.” Journal of Archaeological Science 17:301-316. Outram, A. K. 2001 “FOCUS: The Scapula Representation could be the Key: A Further Contribution to the “Klasies Pattern” Debate.” Journal of Archaeological Science 28:1259-1263. Pääbo, S. 2003 “The Mosaic that is our Genome.” Nature 42:409-412. Parkington, J. and C. Poggenpoel 1987 “Diepkloof Rock Shelter.” Papers in the Prehistory of the Western Cape, South Africa (part ii), edited by J. Parkington and M. Hall, pp. 269-293. BAR International Series 332(ii), Oxford. Pearson, O. M. 2004 “Has the Combination of Genetic and Fossil Evidence Solved the Riddle of Modern Humans Origins?” Evolutionary Anthropology 13:145-159. Peringuey, L. 1911 “The Stone Ages of South Africa.” Annals of the South African Museum 8:1-218. Pfeiffer S. and M. K. Zehr 1996 “A Morphological and Histological Study of the Human Humerus from Border Cave.” Journal of Human Evolution 31:49-59. Relethford, J. H. 1999 “Models, Predictions, and the Fossil Record of Modern Human Origins.” Evolutionary Anthropology 8:7-10.

266Rightmire, G. P. and H. J. Deacon 1991 “Comparative Studies of Late Pleistocene Human Remains from Klasies River Mouth, South Africa.” Journal of Human Evolution 20:131-156. Roberts, D. L. 2003 “Age, Genesis and Significance of South African Coastal Belt Silcretes.” Memoir 95. Council for Geoscience, Pretoria. Roth, B. J. 2000 “Obsidian Source Characterization and Hunter-Gatherer Mobility: An Example from the Tucson Basin.” Journal of Archaeological Science 27:305-314. Sampson, C. G. 1962 “The Cape Hangklip Main Site.” Journal of the University of Cape Town Science Society 5:15-24. 1974 The Stone Age Archaeology of Southern Africa. Academic Press, New York. Shackleton, N. J. 1982 “Stratigraphy and Chronology of the KRM Deposits: Oxygen Isotope Evidence.” In, The Middle Stone Age at Klasies River Mouth in South Africa, edited by R. Singer and J. Wymer. University of Chicago Press, Chicago. Sillen, A. and A. G. Morris 1996 “Diagenesis of Bone from Border Cave: Implications for the Age of the Border Cave Hominids.” Journal of Human Evolution 31:499-506. Singer, R. and J. Wymer 1982 The Middle Stone Age at Klasies River Mouth in South Africa. University of Chicago Press, Chicago. Smith, E. A. 1991 Inujjuamiut foraging strategies: Evolutionary ecology of an arctic hunting economy. Aldine De Gruyter, New York. Smith, F. H. 1992 “The Role of Continuity in Modern Human Origins.” In, Continuity or Replacement: Controversies in Homo sapiens Evolution, edited by G. Bräuer and F. H. Smith. A. A. Balkema, Rotterdam.

267Soressi, M. and C. S. Henshilwood 2004 “Middle Stone Age Lithic Technology at Blombos Cave, Western Cape, South Africa.” Paper presented at the annual meetings of the Paleoanthropology Society, Montréal. Stapleton, P. and J. Hewitt 1927 “Stone Implements from a Rock-Shelter at Howieson’s Poort near Grahamstown.” South African Journal of Science 24:574-587. 1928 “Stone Implements from Howieson’s Poort, near Grahamstown.” South African Journal of Science 25:399-409. Stephens, D. W. and J. R. Krebs 1986 Foraging Theory. Princeton University Press, Princeton. Stiner, M. C., N. D. Munro, T. A. Surovell, E. Tchernov, and O. Bar-Yosef 1999 “Paleolithic Population Growth Pulses Evidenced by Small Animal Exploitation.” Science, 283:190-194. Stringer, C. B. and P. Andrews 1988 “Genetic and Fossil Evidence for the Origin of Modern Humans.” Science 239:1263-1269. Stringer, C. B. and R. McKie 1996 African Exodus: The Origins of Modern Humanity. Henry Holt, New York. Tankersley, K. B. 1991 “A Geoarchaeological Investigation of the Distribution and Exchange in the Raw Material Economies of Clovis Groups in Eastern North America.” In Raw Material Economies Among Prehistoric Hunter-Gatherers, pp. 285-306, edited by A. Montet-White and S. Holen. University of Kansas Press, Lawrence. Templeton, A. R. 1992 “Human Origins and Analysis of Mitochondrial DNA Sequences.” Science 255:737. 2002 “Out of Africa, Again and Again.” Nature 416:45-51. Thackeray, A. I. 1992 “The Middle Stone Age South of the Limpopo River.” Journal of World Prehistory, Vol. 6, No. 4:385-440.

2682000 “The Middle Stone Age Artefacts from the 1993 and 1995 Excavations of Die Kelders Cave 1, South Africa.” Journal of Human Evolution 38:147-168. Thackeray, J. F. 1988 “Molluscan Fauna from Klasies River, South Africa.” South African Archaeological Bulletin 43:27-32. 1990 “Carnivore Activity at Klasies River Mouth: A response to Binford.” Palaeontologia Africana 27:101-109. 2002 “Paleoenvironmental Change and a Reassessment of the Age of Late Pleistocene Deposits at Die Kelders Cave, South Africa.” Journal of Human Evolution 43:749-753. Thackeray, J. F. and D. M. Avery 1990 “A Comparison Between the Temperature Indices for Late Pleistocene Sequences at Klasies River and Border Cave, South Africa.” Palaeoecology of Africa and the Surrounding Islands 21:311-315. Tribolo, C. 2003 Apport des Methodes de la Luminescence a la Chronologie des Techno-Facies du Middle Stone Age Associes aux Premiers Hommes Modernes du Sud de l'Afrique. Unpublished Doctoral Thesis, l'Univesité Bordeaux I. Tringham, R., G. Cooper, G. Odell, B. Voytek, and A. Whitman 1974 “Experimentation in the Formation of Edge Damage: A New Approach to Lithic Analysis.” Journal of Field Archaeology 1:171-196. Trinkaus, E. 1993 “A Short Note on the KNM-ER 999 Hominid Femur.” Journal of Human Evolution 24:493-504. Tryon, C. A. and S. McBrearty 2002 “Tephrostratigraphy and the Acheulean to Middle Stone Age Transition in the Kapthurin Formation, Kenya.” Journal of Human Evolution 42:211-235. Tukey, J. W. 1977 Exploratory Data Analysis. Addison-Wesley. New York. Turner, C. G. II 1985 “The Dental Search for Native American Origins.” In, Out of Asia: Peopling the Americas and the Pacific, edited by R. Kirk and E. Szathmary. The Journal of Pacific History, Canberra.

2691987 “Late Pleistocene and Holocene Population History in Asia based on Dental Variation.” American Journal of Physical Anthropology 73-305-323. Turner, A. 1989 “Sample Selection, Schlepp Effects and Scavenging: The Implications of Partial Recovery for the Interpretations of the Terrestrial Mammal Assemblages from Klasies River Mouth.” Journal of Archaeological Science 16:1-11. van Andel, T. H. 1989 “Late Pleistocene Sea Levels and Human Exploitation of the Shore and Shelf of Southern South Africa.” Journal of Field Archaeology 16:133-155. Vigilant, L., M. Stoneking, H. Harpending, K. Hawkes, and A. C. Wilson 1991 “African Populations and the Evolution of Human Mitochondrial DNA.” Science 253:1503-1507. Villa, P., A. Delagnes, and L. Wadley 2005 “A Late Middle Stone Age Artifact Assemblage from Sibudu (KwaZulu-Natal): Comparisons with the European Middle Paleolithic.” Journal of Archaeological Science 32:399-422. Vogel, J. C. 2001 “Radiometric dates for the Middle Stone Age in South Africa.” In, Humanity from African Naissance to Coming Millennia, edited by P. V. Tobias, M. A. Raath, J. Moggi-Cecchi, and G. A. Doyle, pp. 261-268. University of Witwatersrand Press, Johannesburg. Volman, T. P. 1981 The Middle Stone Age in the southern Cape. Ph. D. dissertation, University of Chicago. 1984 “Early Prehistory in Southern Africa.” In, Southern African Prehistory and Paleoenvironments (pp. 169-220), edited by R. G. Klein. Balkema, Rotterdam. Wadley, L. In press “Putting Ochre to the Test: Replication Studies of Adhesives that may have been used for Hafting Tools in the Middle Stone Age.” Journal of Human Evolution. Wadley, L. and Z. Jacobs 2004 “Sibudu Cave, KwaZulu-Natal: Background to the Excavations of Middle Stone Age and Iron Age Occupations.” South African Journal of Science 100:145-151.

270Watts, I. 1997 The Origins of Symbolic Culture: The Southern African Middle Stone Age and Khoisan Ethnography. Unpublished Doctoral Dissertation, University of London. 2002 “Ochre in the Middle Stone Age of Southern Africa: Ritualized Display or Hide Preservative?” South African Archaeological Bulletin 57:64-74. White, T. D., B. Asfaw, D. DeGusta, H. Gilbert, G. D. Richards, G. Suwa, and F. C. Howell 2003 “Pleistocene Homo sapiens from Middle Awash, Ethiopia.” Nature 423:742-747. Winterhalder, B. 1981 “Foraging Strategies in the Boreal Forest: An Analysis of Cree Hunting and Gathering.” In, Hunter-Gatherer Foraging Strategies, edited by B. Winterhalder and E. A. Smith, pp.66-98, University of Chicago Press, Chicago. Winterhalder, B. and C. Goland 1997 “An Evolutionary Ecology Perspective on Diet Choice, Risk, and Plant Domestication.” In People, Plants, and Landscapes, pp. 123-160, edited by K. J. Gremillion. The University of Alabama Press, Tuscaloosa. Wolpoff, M. and R. Caspari 1997 Race and Human Evolution: A Fatal Attraction. Westview Press, Boulder. Wurz, S. 1997 The Howiesons Poort at Klasies River: From Artefacts to Cognition. Unpublished Masters Dissertation, University of Stellenbosch. 1999 “The Howiesons Poort at Klasies River – an argument for symbolic behavior.” South African Archaeological Bulletin 54:38-50. 2000 The Middle Stone Age at Klasies River. Unpublished Doctoral Thesis, University of Stellenbosch. 2002 “Variability in the Middle Stone Age Lithic Sequence, 115,000 – 60,000 Years Ago at Klasies River, South Africa.” Journal of Archaeological Science 29:1001-1015.
271Wurz, S., N. J. le Roux, S. Gardner, and H.J. Deacon 2003 “Discriminating Between the End Products of the Earlier Middle Stone Age Sub-Stages at Klasies River using Biplot Methodology.” Journal of Archaeological Science 30:1107-1126. Yellen, J. E. 1996 “Behavioral and Taphonomic Patterning at Katanda 9: A Middle Stone Age Site, Kivu Province, Zaire. Journal of Archaeological Science 23:915-932. Yellen, J. E., A. S. Brooks, E. Cornelissen, M. J. Mehlman, and K. Stewart 1995 “A Middle Stone Age Worked Bone Tool Industry from Katanda, Upper Semliki Valley, Zaire.” Science 268:553-556.

272Appendix A: Glossary of Terms and Site Names
273Berg – Afrikaans: mountain or mountain range
Blombos – (Afrikaans: flowering bush) A cave site (Blombos Cave, abbreviated
BBC), dune field site (Blombos Sands, abbreviated BBS), single find site
(Blombos Schoolhouse), all near Still Bay. Archaic spelling of Blombosch is
common in older notes.
Blombos Bo – (Afrikaans: above the flowering bush) Singular artifact from
Blombos Schoolhouse.
Cape Flats – Large dune field near Cape Town. This area yielded many of the
early artifacts from the Cape Colony but has not been systematically investigated
since and is now totally built over. Also, early “culture” name for South African
archaeological materials.
Die Kelders – Cave site near Cape Town (Afrikaans: the cellars, abbreviated
DK1).
Fontein – Afrikaans: spring
Gat – Afrikaans: cave

274Hangklip – (Afrikaans: hanging rock, abbreviated CHK) Cape just east of Cape of
Good Hope. The headlands of the cape are dominated by a large sheer rock
formation.
Howiesons Poort – (Afrikaans: Howiesons pass, abbreviated HP) Rockshelter site
near Grahamstown that is the type site for the Howiesons Poort substage of the
MSA. The original spelling of Howieson’s Poort (original for archaeology, the
actual geographic name is Howison’s Poort) was in common use until very
recently.
Klasies River Mouth – (Also Klasies River mainsite, both conveniently
abbreviated KRM) A set of cave sites on the Tsitsikamma coast that has provided
the baseline for the MSA in the southern Cape.
Kleinjongensfontein – (Afrikaans: little children’s spring, abbreviated KJF) Dune
field site near Still Bay.
Kop – Afrikaans: hill
Koppie – Afrikaans: little hill
275Rooikrans – (Afrikaans: red crown) Acacia cyclops, a shrubby tree that was
introduced to the Cape as erosion control from Australia. Completely out of
control, this plant has made many dune field sites inaccessible.
Strand – Afrikaans: beach
Skildergat – (Afrikaans: painted cave) Also known as Peers Cave and Fish Hoek
Cave, large cave with long (ESA – LSA) archaeological sequence in the Fish
Hoek valley.
Trappieskop – (Afrikaans: little steps hill) Large rocky hill on the Fish Hoek
valley riddled with over thirty small caves and shelters, the most archaeologically
important of these (Dale Rose Parlour, abbreviated DRP) sometimes is referred to
by the name of the hill itself; also known as Eales Cave.
Tsitsikamma – (Khoi: place of much water) Section of the Cape coast that was
forested in historic times and encompasses the Klasies River mainsite.
Zeekoe – (Dutch: sea cow, hippopotamus) River valley in the Karoo region of
South Africa that has been the subject of systematic survey.

276
Appendix B: Methodology of Lithic Analyses
277
This ponderous appendix provides specific information on how each
measurement used in the analysis of the lithic materials reported in Chapters 5, 6,
and 7 was taken and recorded.
Methodology for Recording Bifacial points
Every bifacial point or bifacial point fragment was subjected to a series of
measurements which were entered into a Microsoft Excel spreadsheet. All
measurements of length were taken using digital slide calipers (Fowler EuroCal 6-
inch) with a direct input into the spreadsheet. All caliper measurements were
taken to hundredths of millimeters (0.00 mm) but rounded upon entry to the
nearest millimeter (0 mm). All masses were taken using digital scales to the
nearest tenth of gram (0.0 g) and entered manually into the spreadsheet. A
measure of flake scar density was taken by placing a 1-cm circular template on a
representative portion of the artifact and counting all partial or complete flake
scars visible within that template. This scar density estimate was applied only to
the worked face of unifacial points and fragments or to the dorsal face of flakes.
The caliper measurements that were taken were as follows (Figure B.1).
Length - Overall technical length of complete or very nearly complete bifacial
points. When this measure is left blank the point is judged to be too incomplete
for this measure to have meaning.

278
Estimated Length - Estimated overall technical length for broken points, based on
size and shape clues from the remaining portion. When this measure is left blank
and Length is given a value then it is a complete point. If Estimated Length and
Length are both left blank then the point is too incomplete to judge what its
overall length may have been.
Width Top - This measure is taken one-quarter of the way down from the tip
toward the base perpendicular to the technical length. If this measure is left blank
then that means that the distal end (tip) of the point is absent.
Width Mid - This measure is taken midway between the tip and base
perpendicular to the technical length. If this measure is absent then that means
that the point is a base or tip fragment only.
Width Bottom - This measure is taken three-fourths of the way down from the tip
toward the base perpendicular to the technical length. If this measure has been
left blank then that means that the basal portion of the point is absent.
Thickness - This measure is taken orthogonal to technical length and Mid Width
midway between the tip and base of the point. As this measure varies the least of
279all the measures along the point Thickness is taken whenever any fragment that is
judged to be between the Width Top and Width Bottom is present.
Other measures entered into the spreadsheet for each point or fragment are as
follows:
Base - The basal portion of each point is assigned a shape based on a template
developed for this analysis (Figure B.2). The basal or hafting portions of bifacial
points tend to exhibit the freest expression of style. Probably because, although
the hafting element is surely functional, the tip ad cutting edges are under strict
engineering requirements and can vary little and still perform. That is, points
need to be pointy.
Weight - Every artifact was weighed on a digital scale with precision to at least
one-tenth of a gram (0.0 g). Weight, when the density of the raw material is taken
into account, serves as a proxy for volume. It also serves as a compliment to
counts as a measure of representation in an assemblage.
Raw Material - Raw materials for all artifacts are recorded. Some classes of raw
materials, such as silcrete, may be additionally described by color or fineness of
grain. For example “coarse silcrete” or “very fine grey silcrete” when that
description seems to represent real distinctions within an assemblage.

280
Comment - In this field any additional comments, on the location of apparent
hafting, the presence of resharpening, impact fractures, completeness of the
artifact, etc., are entered.
Number - Any unique identifying number on any artifact is entered here. In some
cases this is simply an accession number for the whole assemblage. In some
cases numbers have become illegible. Illegible numbers are recorded with any
illegible portions as “?”. For example, “12?4?”, when the third and fifth digit can
not be read.
Methodology for Recording Lithics
After the lithic artifacts were separated from the other classes of materials in the
lab and labeled with an individual specimen number they were subjected to metric
analyses and also carefully inspected for usewear, retouch, staining, and adhering
residues. To facilitate the inspection of each artifact a high-output microscope
illuminating lamp with fiber-optic arms and lenses was employed. The nature of
the raw materials that dominate the assemblage, particularly the quartzites and
quartzes made the use of bright light for analyses necessary. In the absence of the
bright light many of the technological features recorded here would not have been
observed. This information was entered into a Microsoft Access database with
separate tables for cores (with hammerstones), all flakes (including retouched

281pieces), and small flaking debris (flakes smaller than 1 cm in their largest
dimension). The lithic artifacts were never washed, although screened artifacts
were rinsed with fresh water and sun-dried in the water-screening process in the
field. A soft dry brush was applied to a small area so that a label could be
applied. Each specimen number was written in black India ink directly on a flat
surface of an artifact. Artifacts too small to take a useful label were kept with
their Plotted Find tag (even labeled artifacts were kept with an identifying tag of
some kind). Small flaking debris that was not plotted in the field was not given
individual specimen numbers or labels.
Every flake or unaltered manuport (a stone that is not native to the cave and has
no flaked removals or pecking) was entered into the “lithics 1” database, a brief
description and comments on recording of the database follows.
Specimen Number – The individual specimen number for each artifact, in many
cases this is the Plotted Find number assigned in the field.
Lot Number – This is the number assigned in the field to the smallest stratigraphic
unit (StratUnit) and a 50 cm square. This was used after the field season to tie
each artifact to larger stratigraphic units for analyses (Strat Aggregates). During
analysis all that was known was the Lot Number and as such the analysis was
“blind” with no stratigraphic relationships known by the analyst.
282
Raw Material – This is the class of stone that the artifact was made on. The
classes used in this analysis were; Grey Quartzite, Tan Quartzite, Grey-Red
Mottled Quartzite, Tan-Red Mottled Quartzite, Coarse Quartzite, Quartz, Vein
Quartz, Crystal Quartz, Silcrete, Indurated Shale, Hornfels, Chert, Chalcedony, or
Other/Indeterminate. When recording the raw material classes four color classes
for fine-grained quartzite were used. The color variability was much greater than
this, running from a pale grey that was almost white to a deep reddish brown.
Color differences were further obscured by the dirty state of the plotted artifacts.
Many of the artifacts recorded as brown-tan quartzites would likely have been
greys after a good washing. Many of the color differences involving the reds are
likely due to diagenesis of lithic surfaces postdeposition. It is possible that heat-
treatment my also play a role in color variability. All of the color classes for
quartzite should be considered as one for analysis. The exception to this may be a
high contrast banded tan-red that occurs in beds below the TMS exposed on the
coast. There is an exposure of this at Cape St. Blaize. Unfortunately these few
pieces were swamped by other tan-red quartzites in the coding. The category
“Coarse Quartzite” replaces the one (TMS) used in an earlier reporting of the
artifacts from here (Marean et al. 2004). In general this is the parent material of
the cave. The category of “Vein Quartz” occurs naturally in the cave. In a few
cases it appears to be clearly worked and this would be apparent in the
description. However, if the vast majority of cases are “Indeterminate” and

283“Shatter”, then these are most likely roof spall and if they dominate a StratUnit it
is likely culturally sterile. This raw material is one of the few where the cortex is
coded as “Outcrop” and is distinguished from “Quartz” by the parallel planes
apparent in the former.
Type – This is the traditional descriptor applied to MSA lithics and is useful for
making broad comparisons to other MSA assemblages and for very general
descriptions (for example Volman 1981, Singer and Wymer 1982). The types
used were Flake, Blade, Convergent Flake-Blade, Dejeté, Side-Struck,
Broken/NA, or Indeterminate. Several of the blades appear to have been made
with one very steep lateral that was not cortical or backed. These were typically
heavily prepared and the steep side opposes a long acute cutting edge. A good
example of this is artifact 25716. These are similar to, but not strictly speaking,
naturally-backed knives in Geneste’s and other typologies, they were just
recorded as blades. Blades also often have an edge made up of cortex; this is
most often with a parallel removal, although some blades are entirely cortical.
The category “Dejeté” was added to the general typological description used in
earlier reporting of artifacts from here (Marean et al. 2004). These are flakes
where the longest measure is at about a 45o degree angle to the striking platform.
Many of these are the products of centripedal/discoidal cores. Dejeté flakes grade
into “Convergent Flake-Blades”, with the distinction between the two being
somewhat arbitrary. A good example of one of these ambiguous

284“Dejeté”/“Convergent Flake-Blades” is artifact 21073. Type categories follow
the general convention of Blades being at least twice as long as wide, Side-Struck
flakes being at least twice as wide as long (a category that is almost completely
absent at PP 13B), Convergent Flake-Blades coming to a point, and Flakes being
the remainders.
Completeness – This is a description of whether the artifact seems complete or is
a fragment of a once larger artifact. If it is a fragment a brief description of what
part of the original artifact is given (i.e. “Proximal”). For metric comparisons
between stratigraphic units and between assemblages complete artifacts only are
used, unless otherwise stated.
Maximum Dimension – This is the measure, regardless of orientation, of the
longest line segment that fits within the artifact. This is the only linear measure
that was taken on every single artifact and has no relation to the technical
measures used for more comparative analyses. This measure (with Weight) is a
proxy for artifact size and would be the one that is most useful for size-sorting,
differential screen recovery, and other taphonomic studies. Like all other linear
measures in this study it was taken using electronic calipers* with precision to the
hundredth of mm. These were directly input into Access using a USB input and
rounded in Access to the nearest whole mm.
285Length – This is the technical length. That is, it is the longest dimension
measured along the direction of striking. If an artifact’s whole Length is absent
then this measure is left blank.
Width – This is the longest direction measured perpendicular to Length,
regardless of where it occurs on the artifact. If an artifact’s whole Width is absent
then this measure is left blank.
Thickness – This is the longest measure, below the bulb, orthogonal to Length
and Width. If an artifact is incomplete then this measure is left blank.
Platform Width – This is the longest measure on the striking platform in the same
direction as Width. This measure is taken any time there is an intact platform
present.
Platform Thickness – This the longest measure on the striking platform in the
same direction as Thickness. This measure is taken any time there is an intact
platform present.
Cutting Edge – This is the total length of acute edge along the entire artifact,
regardless of location or completeness. This measure is taken by rolling the
artifact along a rule and rounding to the nearest 5 mm.
286
Platform Shape – This is a description of the shape of the silhouette of the striking
platform. All platforms were recorded as being Flat, Concave, Convex, Chapeau
de Gendarme, Irregular, or most frequently Platform Missing. A common shape,
coded as irregular, is a plain, dihedral, or faceted platform with an “~” shape in
profile. On these S-shaped platforms they appear to be preferentially struck on
the convex, rather than the concave, surface.
Platform Type – This is a description of the condition of the platform on the core
prior to the flake being struck. On an assemblage scale these descriptions are
useful in evaluating technological organization. All platforms are recorded as
Plain, Dihedral, Faceted, Crushed/Shattered, Pointed, Unknown/Indeterminate.
Platform Angle – Platform angle is one of the most difficult things to reliably
measure on an artifact. To record this angle a contact goniometer was applied to
each artifact measuring the outside angle (the angle that was on the core prior to
striking) near the center of the platform. The angle was recording in broad classes
(0o-30o, 31o-60o, 61o-90o, 90o+, and Indeterminate) in the data base.
Lipping – This was recorded as a presence/absence attribute. Lipping is
determined by running your finger across the ventral edge of the platform. If it
catches, then it is lipped. If you have to think about it too much, then it is lipped.

287This is an informal definition and its relationship to hammer type is not
conclusive. On cortical platforms the “lip” may just be a result of the change in
material character below the cortical surface.
Platform Prep – This is a recording of the preparation of the platform angle while
the artifact was still attached to the core. The preparation was recorded as None,
Bruising, Single Flake, Multiple Flakes, Stepped Flake, Multiple Stepped Flakes,
and Indeterminate. “Bruising” as a class is likely the result of crushing or
roughening of the platform edge to provide more control over the flaking process.
Stepped flakes remove a great deal of thickness at the proximal end of the flake
and may be used to change the angle of the platform or to have thinner proximal
ends on the finished artifacts, or they may simply be previously failed attempts at
removing a useable flake.
Bulbar Thinning – This is a presence/absence attribute of the removal of one or
more flakes from the bulb of percussion after it is struck from the core. This
attribute would also be recorded in the Retouch part of the database. Bulbar
Thinning is one of the traits common for artifacts that are intended to be hafted.
Termination – This attribute records the type of edge preserved at the distal end of
the flake. It was recorded as Feathered, Hinged, Snapped/Stepped, Burinated,
Shattered, Over Passed, or Retouched. Burinated and Shattered terminations may

288be indicative of impact fractures in use of the artifact. Over Passed in this
recording system means that the termination of the flake took off part of the
bottom of the core and was not necessarily thicker at the end than in the middle,
as is the case for some massively Over Passed flakes. Retouched terminations are
those where post-flaking retouch has obscured the original termination type.
Cortex – This is the percentage of the ventral surface that rock cortex. It was
recorded in ranges (as these are visual estimates). The recorded ranges are 0%, 1-
20%, 21-40%, 41-60%, 61-80%, 81-99%, and 100%.
Cortex Type – This attribute records the type of cortex present on the artifact and
is only filled in if cortex is indeed present. The classes recorded were Cobble,
Outcrop, and Rind. Cobble cortex could be from beach, stream, or conglomerate
cobbles and dominate the cortices in this assemblage. Outcrop cortex is from
primary geologic contexts and is rare in this assemblage, with the already
mentioned exception of vein quartz. Rind cortex is a description of a cortex that
develops in secondary settings for some raw materials, especially silcrete, but is
rare in this assemblage.
Scar Density – This is a measure of the number of scars from flake removals that
are at least partially visible within a 1 cm circular template placed on a
representative portion of the ventral face.

289
Scar Pattern – This attribute records the patterning of prior flake removals on the
ventral face and how they relate to the organization of the core that the artifact
originated from. In many cases on the dominant quartzite raw materials the
directionality of the scars is indeterminate and is recorded as such. In most cases
it is only possible to infer direction when the scar terminates into cortex or the
scar is the result of retouch. When scar pattern is evident parallel and convergent
flaking dominate the assemblage with a sizable minority of radial/centripedal
removals also present. Blade-like parallel removals are common, even on flakes
that do not strictly meet the arbitrary 2:1 (length/width) ratio.
Retouch – This is a presence/absence trait for the removal of flakes from the
artifact after it has been struck from the core. A series of fairly standard traits
were then recorded only on those artifacts that exhibited retouch.
Retouch Location – This is a description of the part of the flake that is retouched
(i.e. distal dorsal).
Retouch Type – This is a description of the dominant type of retouch on the
artifact using the terminology of Tixier et al. (1980). Nearly all burins occur on
the tip (impact burin) or on the platform (burin during flaking). These are all of
the “technical burin” type referred to in the South African archaeological
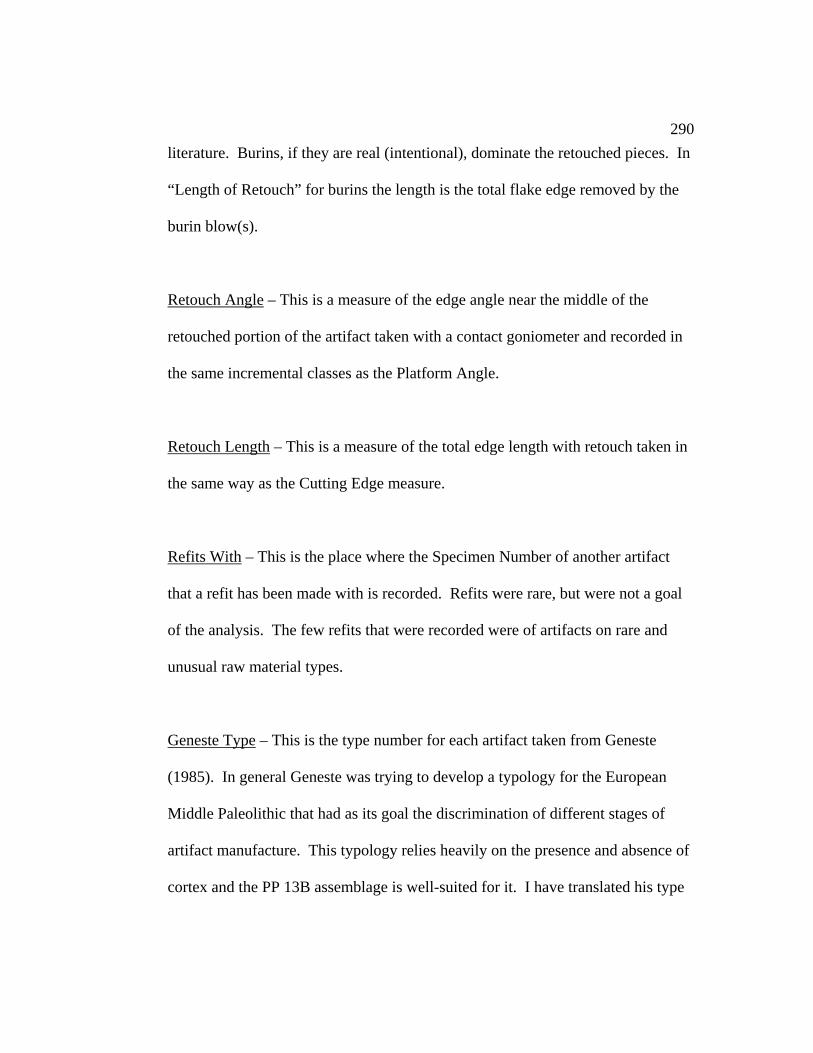
290literature. Burins, if they are real (intentional), dominate the retouched pieces. In
“Length of Retouch” for burins the length is the total flake edge removed by the
burin blow(s).
Retouch Angle – This is a measure of the edge angle near the middle of the
retouched portion of the artifact taken with a contact goniometer and recorded in
the same incremental classes as the Platform Angle.
Retouch Length – This is a measure of the total edge length with retouch taken in
the same way as the Cutting Edge measure.
Refits With – This is the place where the Specimen Number of another artifact
that a refit has been made with is recorded. Refits were rare, but were not a goal
of the analysis. The few refits that were recorded were of artifacts on rare and
unusual raw material types.
Geneste Type – This is the type number for each artifact taken from Geneste
(1985). In general Geneste was trying to develop a typology for the European
Middle Paleolithic that had as its goal the discrimination of different stages of
artifact manufacture. This typology relies heavily on the presence and absence of
cortex and the PP 13B assemblage is well-suited for it. I have translated his type

291table into English and note that Levallois techniques are loosely applied to the
MSA materials (Table 6.1).
Bifacial Thinning – This is a presence/absence attribute. The presence of bifacial
thinning flakes would be noted in the Geneste typology as well, as Type 22. The
inclusion of a separate category in the database was the result of my other MSA
research focusing on bifacial points and bifacial reduction.
Weight – This is the mass to the nearest tenth of a gram for every artifact in the
database. Masses were taken using an electronic scale** for every complete or
fragmentary lithic artifact.
Unaltered Manuport – This is a presence/absence attribute and represents rocks
that have entered the cave through human actions but do not appear to b otherwise
modified in any way. Many of the rocks placed in the category Unaltered
Manuport are small quartz-quartzite pebbles. It is probable that a large
percentage of these have simply eroded out of the parent material of the cave.
They are so small as to be of dubious functionality. Other possibilities include;
tracked in, included in animal guts/shell fish anchors, or children’s toys. The raw
material coded for these is what they appear to be based on the cortical surface.
In some cases quartz may be coded as quartzite and visa versa. The color
292recorded for the quartzites is probably incorrect even more often than for other
artifacts as the cortex and interior colors vary in unpredictable ways.
Comments – This section is one in which any observations that did not fit readily
into the database format were entered. Two abbreviations that were commonly
used in the comments section are PED and HP. PED stands for “possible edge
damage” and refers to artifacts that it might be useful to examine systematically
under a microscope. PED was an unfortunate use of terminology as the edge
damage was real; it was just the source of that damage that was being questioned.
In later analyses PED was referred to as Type 2 Edge Damage (Bird and
Minichillo 2005). HP refers to artifacts that have some Howiesons Poort aspect to
them. Strictly speaking, as the Howiesons Poort should be defined by a whole
suite of attributes found together no single artifact would make an assemblage
Howiesons Poort. LSA artifacts may also get this HP note erroneously attached
to them. Other common comments were Chunk and Shatter. “Chunk” refers to a
blocky piece that does not appear to be a core. “Shatter” refers to angular debris
with no apparent orientation. As noted in “Vein Quartz” above, Shatter (and
sometimes Chunk) probably includes some non-artifactual material. Another
fairly common comment is “Siret”. Siret refers to flakes that have been split
longitudinally through the platform during flaking.
293Every core, hammerstone, or core rejuvenation flake (core tablet) was entered into
the “cores 1” database. Many of the attributes recorded duplicated the ones
described above for the flakes. When measuring Length, Width, and Thickness
for Core Rejuvenation Flakes or the single Lame a Crete in the assemblage the
artifacts are oriented as flakes and not as cores. A brief description is provided
below for those that are different.
Volman Type – This is the core typology applied by Volman to a number of MSA
lithic assemblages in his dissertation (Volman 1981). This is given in addition to
the Geneste types for the cores. I most cases I found the Geneste typology more
useful as it had more categories for the types of cores in the MSA assemblage at
PP 13B. I also found the Volman typology confusing and, at least in some
categories, redundant. Other analysts I have spoken to have also found this
typology confusing. It is only used here to provide some basis for comparison to
older assemblages at some time.
Number of Removals – This is a count of all of the partial or complete flake
removal scars apparent anywhere on the remaining core.
Scar Pattern – this is the pattern of removals that is visible on the remaining core.
This follows the same classes as for the flakes but in most cases it is much easier
to determine the patterning on the cores.
294
Maximum Length – This is the longest measure in any direction on the core.
Maximum Width – This is the longest measure in any direction perpendicular to
the Maximum Length.
Maximum Thickness – This is the longest measure orthogonal to the Maximum
Length and Maximum Width.
Comments – Some common comments on the “cores 1” table were hammerstone,
core rejuvenation flake, and exhausted. Exhausted refers to cores that appear to
have been knapped down to a size that no longer could produce useful flakes and
was then abandoned. Many of the discoidal core fragments are crude bifacial
points and this is noted in their coding. Smaller, more finely finished fragments
of bifacial points are coded with the retouched lithics (rather than the cores).
Where this distinction is drawn is not entirely clear. If a piece will contribute
more to our analysis as a core then it is coded as a core, etc.
The final database table was made up of the “small flaking debris”. This category
would typically be coded as 23, 24, 25, and 26 in Geneste’s typology. All of the
lithics entered into this database came out of one of the screens (10 mm, 3 mm, or
1.5 mm). Only flakes and flake fragments are coded here. Chunks and unaltered
295manuports are not entered into this database and unless they were large enough to
be given an individual specimen number during sorting are retained in the original
bags, but not entered into the lithics database in any way at this time. This Small
Flaking Debris database is designed to examine the raw material variability in the
finer fractions, quantify bifacial reduction for comparison to other assemblages,
and look for bladelets and bladelet fragments that may have been missed during
sorting. With these goals in mind, a fairly high percentage of small debris of
questionable artifactual origin, although in many cases retained in the collection,
is not coded. Due to the small size of many of the artifacts (especially in the 3
mm fraction) a raw material class for which there is a count may have “0” entered
in the weight column. This means that the total weight for that category did not
register on a 0.1-gram precision scale. “Total Weight” is an actual measure of all
of the Small Flaking Debris together, not a sum of the individual categories.
Consequently, summing all of the categories may arrive at a slightly different
figure.
* Two electronic calipers were used in this study, a Sylvac EuroCal Mark III 150 mm and a Mitutoyo 500 series 150 mm. Both of these calipers have a .01 mm precision and were linked using a USB cable input. ** OHAUS Scout SP4001 portable electronic scale, 4 kg capacity, .1 g precision.
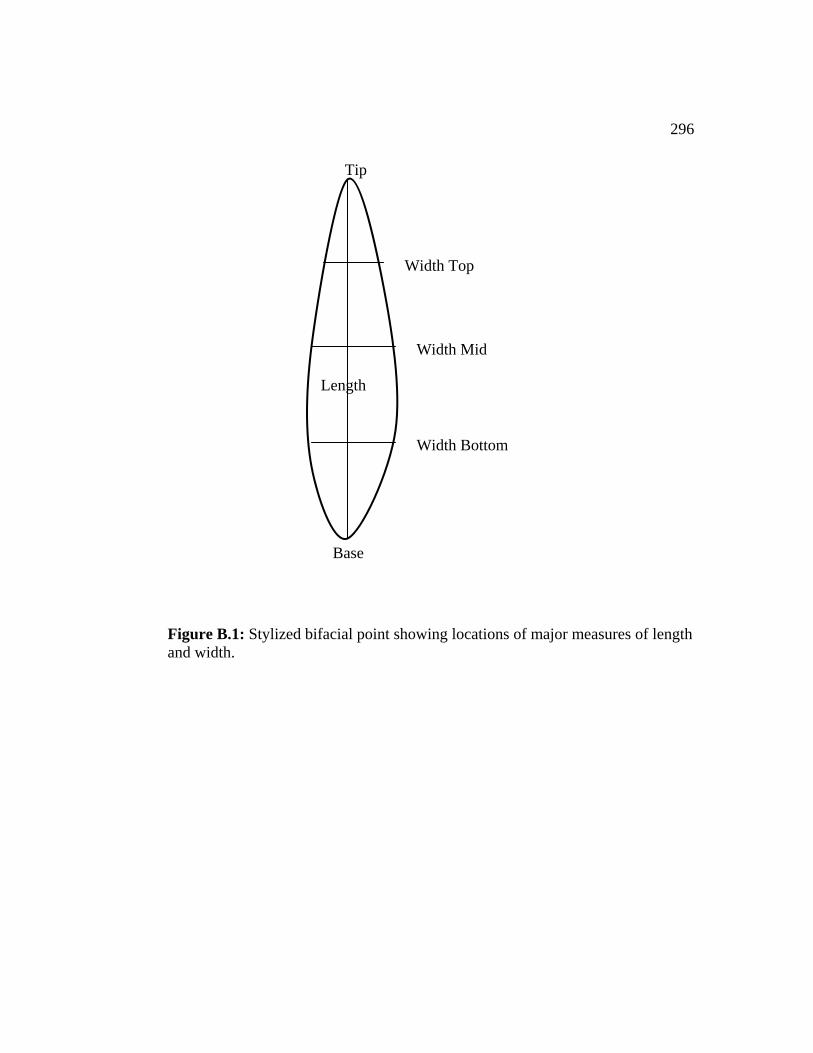
296
Figure B.1: Stylized bifacial point showing locations of major measures of length and width.
Length
Width Top
Width Mid
Width Bottom
Tip
Base

297
1 Straight, point clear 2 Narrow excurvate, point clear 3 Wide excurvate, point clear
4 Elliptical, curved base, no point 5 Subrectangular, broad curved base 6 Platform, complete or partial platform
7 Missing/Unknown/Unidentifiable
Basal/Hafting Element
Shape Template
Figure B.2: Template of basal/hafting element types used to classify all of the Still Bay bifacial points.