© copyright 2000, julia hartman 1 scatterplot output: editing the graph you can edit the output to...
TRANSCRIPT

© Copyright 2000, Julia Hartman © Copyright 2000, Julia Hartman 11
Scatterplot Output:Scatterplot Output:
Editing the GraphEditing the Graph
You can edit the output to display the entire variable label.
Click inside the border to select the graph.

© Copyright 2000, Julia Hartman © Copyright 2000, Julia Hartman 22
Scatterplot Output:Scatterplot Output:
Editing the GraphEditing the Graph
Next
© Copyright 2000, Julia Hartman © Copyright 2000, Julia Hartman 33
Scatterplot Output:Scatterplot Output:
Editing the GraphEditing the Graph
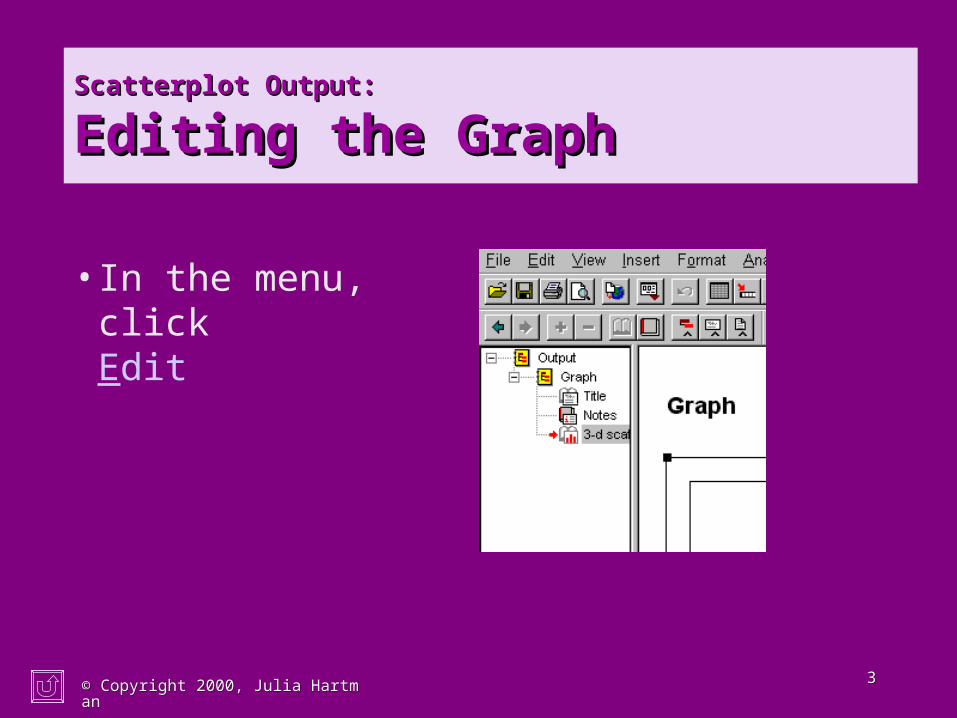
• In the menu, clickEdit

© Copyright 2000, Julia Hartman © Copyright 2000, Julia Hartman 44
Scatterplot Output:Scatterplot Output:
Editing the GraphEditing the Graph
• In the menu, clickEdit
• Point to SPSS Chart Object

© Copyright 2000, Julia Hartman © Copyright 2000, Julia Hartman 55
Scatterplot Output:Scatterplot Output:
Editing the GraphEditing the Graph
• In the menu, clickEdit
• Point to SPSS Chart Object

© Copyright 2000, Julia Hartman © Copyright 2000, Julia Hartman 66
Scatterplot Output:Scatterplot Output:
Editing the GraphEditing the Graph
• In the menu, clickEdit
• Point to SPSS Chart Object
• Point to Open

© Copyright 2000, Julia Hartman © Copyright 2000, Julia Hartman 77
Scatterplot Output:Scatterplot Output:
Editing the GraphEditing the Graph
• In the menu, clickEdit
• Point to SPSS Chart Object
• Point to Open
…and click.

© Copyright 2000, Julia Hartman © Copyright 2000, Julia Hartman 88
Scatterplot Output:Scatterplot Output:
Editing the GraphEditing the Graph
• In the menu of the SPSS Chart Editor, click Chart

© Copyright 2000, Julia Hartman © Copyright 2000, Julia Hartman 99
Scatterplot Output:Scatterplot Output:
Editing the GraphEditing the Graph
• In the menu of the SPSS Chart Editor, click Chart
• Point to Axis

© Copyright 2000, Julia Hartman © Copyright 2000, Julia Hartman 1010
Scatterplot Output:Scatterplot Output:
Editing the GraphEditing the Graph
• In the menu of the SPSS Chart Editor, click Chart
• Point to Axis
…and click.

© Copyright 2000, Julia Hartman © Copyright 2000, Julia Hartman 1111
Scatterplot Output:Scatterplot Output:
Editing the X AxisEditing the X Axis
To begin with the X scale axis,click the OK button.

© Copyright 2000, Julia Hartman © Copyright 2000, Julia Hartman 1212
Scatterplot Output:Scatterplot Output:
Editing the X AxisEditing the X Axis
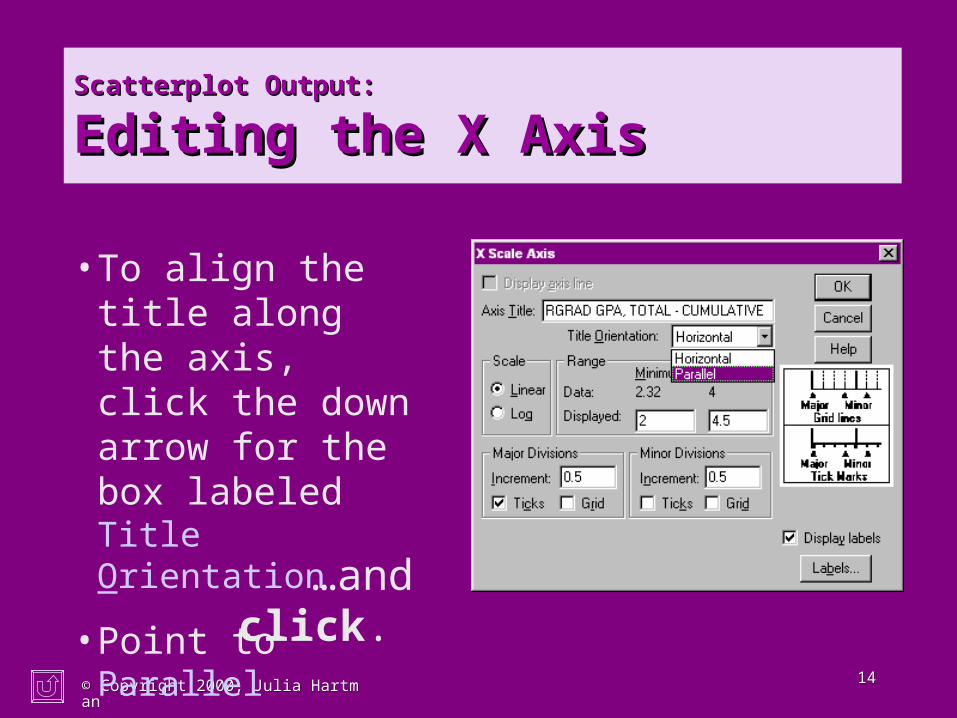
• To align the title along the axis, click the down arrow for the box labeled Title Orientation

© Copyright 2000, Julia Hartman © Copyright 2000, Julia Hartman 1313
Scatterplot Output:Scatterplot Output:
Editing the X AxisEditing the X Axis
• To align the title along the axis, click the down arrow for the box labeled Title Orientation
• Point to Parallel
© Copyright 2000, Julia Hartman © Copyright 2000, Julia Hartman 1414
Scatterplot Output:Scatterplot Output:
Editing the X AxisEditing the X Axis
• To align the title along the axis, click the down arrow for the box labeled Title Orientation
• Point to Parallel
…and click.

© Copyright 2000, Julia Hartman © Copyright 2000, Julia Hartman 1515
Scatterplot Output:Scatterplot Output:
Editing the X AxisEditing the X Axis
No other changes are made in this tutorial, so click the OK button.

© Copyright 2000, Julia Hartman © Copyright 2000, Julia Hartman 1616
Scatterplot Output:Scatterplot Output:
Editing the Y AxisEditing the Y Axis
The other axis titles will be edited in the same way.• In the menu, click
Chart

© Copyright 2000, Julia Hartman © Copyright 2000, Julia Hartman 1717
Scatterplot Output:Scatterplot Output:
Editing the Y AxisEditing the Y Axis
• In the menu, click Chart
• Point to Axis

© Copyright 2000, Julia Hartman © Copyright 2000, Julia Hartman 1818
Scatterplot Output:Scatterplot Output:
Editing the Y AxisEditing the Y Axis
…and click.
• In the menu, click Chart
• In the menu, click Chart
• Point to Axis

© Copyright 2000, Julia Hartman © Copyright 2000, Julia Hartman 1919
Scatterplot Output:Scatterplot Output:
Editing the Y AxisEditing the Y Axis
• Click the radio button labeled Y scale

© Copyright 2000, Julia Hartman © Copyright 2000, Julia Hartman 2020
Scatterplot Output:Scatterplot Output:
Editing the Y AxisEditing the Y Axis
• Click the radio button labeled Y scale
• Then click the OK button

© Copyright 2000, Julia Hartman © Copyright 2000, Julia Hartman 2121
Scatterplot Output:Scatterplot Output:
Editing the Y AxisEditing the Y Axis
• To align the title along the axis, click the down arrow for the box labeled Title Orientation

© Copyright 2000, Julia Hartman © Copyright 2000, Julia Hartman 2222
Scatterplot Output:Scatterplot Output:
Editing the Y AxisEditing the Y Axis
• To align the title along the axis, click the down arrow for the box labeled Title Orientation
• Point to Parallel

© Copyright 2000, Julia Hartman © Copyright 2000, Julia Hartman 2323
Scatterplot Output:Scatterplot Output:
Editing the Y AxisEditing the Y Axis
• To align the title along the axis, click the down arrow for the box labeled Title Orientation
• Point to Parallel
…and click.

© Copyright 2000, Julia Hartman © Copyright 2000, Julia Hartman 2424
Scatterplot Output:Scatterplot Output:
Editing the Y AxisEditing the Y Axis
No other changes are made in this tutorial, so click the OK button.

© Copyright 2000, Julia Hartman © Copyright 2000, Julia Hartman 2525
Scatterplot Output:Scatterplot Output:
Editing the Z AxisEditing the Z Axis
• In the menu, click Chart

© Copyright 2000, Julia Hartman © Copyright 2000, Julia Hartman 2626
Scatterplot Output:Scatterplot Output:
Editing the Z AxisEditing the Z Axis
• In the menu, click Chart
• Point to Axis

© Copyright 2000, Julia Hartman © Copyright 2000, Julia Hartman 2727
Scatterplot Output:Scatterplot Output:
Editing the Z AxisEditing the Z Axis
…and click.
• In the menu, click Chart
• Point to Axis

© Copyright 2000, Julia Hartman © Copyright 2000, Julia Hartman 2828
Scatterplot Output:Scatterplot Output:
Editing the Z AxisEditing the Z Axis
• Click the radio button labeled Z scale

© Copyright 2000, Julia Hartman © Copyright 2000, Julia Hartman 2929
Scatterplot Output:Scatterplot Output:
Editing the Z AxisEditing the Z Axis
• Click the radio button labeled Z scale
• Then click the OK button

© Copyright 2000, Julia Hartman © Copyright 2000, Julia Hartman 3030
Scatterplot Output:Scatterplot Output:
Editing the Z AxisEditing the Z Axis
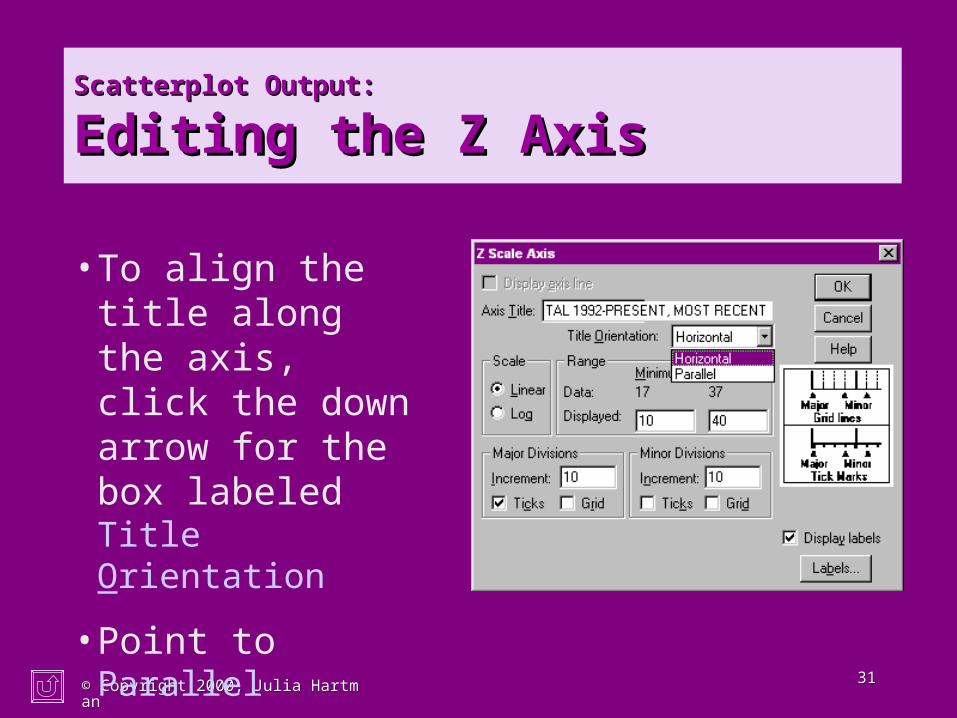
• To align the title along the axis, click the down arrow for the box labeled Title Orientation
© Copyright 2000, Julia Hartman © Copyright 2000, Julia Hartman 3131
Scatterplot Output:Scatterplot Output:
Editing the Z AxisEditing the Z Axis
• To align the title along the axis, click the down arrow for the box labeled Title Orientation
• Point to Parallel

© Copyright 2000, Julia Hartman © Copyright 2000, Julia Hartman 3232
Scatterplot Output:Scatterplot Output:
Editing the Z AxisEditing the Z Axis
• To align the title along the axis, click the down arrow for the box labeled Title Orientation
• Point to Parallel
…and click.

© Copyright 2000, Julia Hartman © Copyright 2000, Julia Hartman 3333
Scatterplot Output:Scatterplot Output:
Editing the Z AxisEditing the Z Axis
No other changes are made in this tutorial, so click the OK button.

© Copyright 2000, Julia Hartman © Copyright 2000, Julia Hartman 3434
Scatterplot Output:Scatterplot Output:
Editing the GraphEditing the Graph
No more editing of the chart is included this tutorial, so close the SPSS Chart Editor by clicking the Close ( ) button.

© Copyright 2000, Julia Hartman © Copyright 2000, Julia Hartman 3535
Scatterplot Output:Scatterplot Output:
Editing the GraphEditing the Graph
Additional editing could improve the appearance of the chart but is not included this tutorial.
Next

© Copyright 2000, Julia Hartman © Copyright 2000, Julia Hartman 3636
An Interactive Tutorial for An Interactive Tutorial for SPSS 10.0 for WindowsSPSS 10.0 for Windows©©::
Plotting Regression EquationsPlotting Regression Equations
• Repeat this tutorial
Click one of the following:
• Repeat the chart editing part of this tutorial
• Return to the list of tutorials