computer and internet u… · web vie
TRANSCRIPT

Name of author
Vivianna Margarita De Jesus Monge
University/College
University of Puerto RicoRio Piedras CampusCollege of Social SciencesDepartment of Sociology and Anthropology
Title of module
Secondary data analysis of the computer and Internet use in the households in Puerto Rico in 2014, using the Puerto Rico Community Survey sample
Brief description
Due to the recent increase of databases that are available in the Internet for the public use, the secondary data analysis is a research method that has become more popular inPuerto Rico. Because of its advantages of realization in less time and with less money, in comparison with other research methods, and possible exemption of revision by an institutional review board, both undergraduate and graduate students should know more about this method and consider it for future research, such as papers and dissertations. To increase the interest of the students, this module is based on the variables that are included, since 2013, in the American Community Survey, which are about the computer and Internet use in the households.
Keywords
Secondary data analysis, Puerto Rico Community Survey, use, computer, Internet
Purpose
Do secondary data analysis with the 2014 Puerto Rico Community Survey, which was developed by the United States Census Bureau and is available at the Puerto Rico Institute of Statistics Web site.
Target students
Upper-level undergraduate students, preferably with basic knowledge of IBM SPSS Statistics
Estimated time of duration
Three hours (One three-hour class or two one and half-hour classes)

2
Learning objectives
Students will be able to
1. Examine a database, using Microsoft Excel to download it and later selecting the variables of study and preparing them for analysis.
2. Statistically analyze (frequency tables, in specific) a database, using IBM SPSS Statistics.
Teaching/facilitation notes
Requisites:
1. Classroom with computers for students and a computer and projector for the professor or a classroom with desks so the students can use their personal computers and a computer and projector for the professor2. Access to the Internet, Google Chrome, IBM SPSS Statistics, Microsoft Excel, and Word 3. Prior reading by the students of these publications, as minimum: Computer and Internet use in the United States: 2013; A compass for understanding and using American Community Survey data: What PUMS data users need to know, and Maximizing research opportunities: Secondary data analysis (see Resource list/guide and Bibliography).
Instructions for the professor:
1. Using Google Chrome, go to the Puerto Rico Institute of Statistics Web site, which is www.estadisticas.pr.
a. Click on Estadísticas.b. Click on Encuesta sobre la Comunidad de Puerto Rico.
i. Click on Public Use Microdata Sample (PUMS).ii. Click on 2014, in Bases de Datos.
1) Save the zip folder prcs_pums_files_2014_1yr.a) Unzip the folder prcs_pums_files_2014_1yr.
iii. Click on 2014, in Diccionario de Variables.1) Save the zip folder prcs_pums_docs_2014_1yr.
a) Unzip the folder prcs_pums_docs_2014_1yr.

3
2. Open the folder prcs_pums_files_2014_1yr.a. Open the database ss14hpr, using Microsoft Excel (for this module, the demonstration is done with the 2013 version).b. Change the file type from CSV (Comma Separated Values) to Excel (from .csv to .xlsx).
i. Select the File menu, select Save As, and select the folder (it could be the same).ii. In Save as type, select Excel Workbook.
c. Close Microsoft Excel.d. Open IBM SPSS Statistics (for this module, the demonstration is done with the 21 version).
i. Select the File menu, select Open, and select Data.ii. In Files of type, select Excel (*.xls, *.xlsx, *.xlsm).iii. In Look in, find the location of the file.iv. In Opening Excel Data Source, leave on the check mark for Read variable names from the first row of data and click OK.
3. Open the folder prcs_pums_docs_2014_1yr.a. Open the codebook or data dictionary PUMSDataDict14, to identify the variables about computer and Internet use and know the technical information of each variable. Next, the example of the variable of ACCESS (name of the variable in the database) is presented, whose label or description is Access to the Internet, its width is 1 (the maximum number of digits for its values is 1), and its categories are 1 (Yes, with subscription to an Internet service), 2 (Yes, without a subscription to an Internet service), and 3 (No Internet access at this house, apartment, or mobile home). Also, in this variable, there are cases without

4
information (answer for this question in the questionnaire) because they were vacant households or group quarters, such as residential treatment centers, shelters for homeless people, prisons, and military barracks.
i. See example:
ACCESS (Variable name in SPSS) 1 (Variable width)Access to the Internet (Variable label)b (Blank). N/A (Not applicable) (GQ) (Group quarters) (Neither this variable applies to vacant households)
(Categories of variable)1 (Value) Yes, with subscription to an Internet service (label)2 (Value) Yes, without a subscription to an Internet service (label)3 (Value) No Internet access at this house, apartment, or mobile home (label)
ii. See the variables about computer and Internet use (Asking the students to highlight the text in the Data Dictionary in Adobe Reader for a fast identification of the variables or handing out a copy of this list of variables is recommended):
ACCESS 1Access to the Internetb .N/A (GQ)1 .Yes, with subscription to an Internet service2 .Yes, without a subscription to an Internet service3 .No Internet access at this house, apartment, or mobile home
BROADBND 1Mobile broadband planb .N/A (GQ)1 .Yes2 .No
COMPOTHX 1Other computer equipmentb .N/A (GQ)1 .Yes2 .No
DIALUP 1Dial-up serviceb .N/A (GQ)1 .Yes2 .No

5
DSL 1DSL serviceb .N/A (GQ)1 .Yes2 .No
FIBEROP 1Fiber-optic Internet serviceb .N/A (GQ)1 .Yes2 .No
HANDHELD 1Handheld computerb .N/A (GQ)1 .Yes2 .No
LAPTOP 1Laptop, desktop, or notebook computerb .N/A (GQ)1 .Yes2 .No
MODEM 1Cable Internet serviceb .N/A (GQ)1 .Yes2 .No
OTHSVCEX 1Other Internet serviceb .N/A (GQ)1 .Yes2 .No
SATELLITE 1Satellite Internet serviceb .N/A (GQ)1 .Yes2 .No
b. Open the document 2014_ACSSubjectDefinitions, to read the information of the 11 variables about computer and Internet use, like the number of the question in the questionnaire, the categories of the variable in this survey, definition and history of the concept, and the cases for which the question applied.

6
i. From page 13 to 15, there is the information for the variables about the computer and Internet use.
4. Go to www.census.gov, under PEOPLE & HOUSEHOLDS, click on American Community Survey, click on Methodology, under Methodology Resources, click on Questionnaire Archive, click on 2014, under La Encuesta Sobre La Comunidad De Puerto Rico (Puerto Rico Community Survey) and Questionnaire, click on English and Spanish to download the questionnaire in both languages. So, the questionnaire that was used in the survey can be read, to know what was asked to the participants about the computer and Internet use.
5. After knowing the 11 variables about the computer and Internet use in the occupied households, consider asking the students:
a. In general, about the variables:i. What is your opinion about them? What do you expect to find?
b. Regarding the possible results that will appear in the frequency tables:i. What could be the percentage of occupied households with subscription to an Internet service? (It is responded with the variable ACCESS.)ii. What could be the percentage of occupied households with dial-up service? (It is responded with the variable DIALUP.)iii. What could be the percentage of occupied households with DSL service? (It is responded with the variable DSL.)iv. What could be the percentage of occupied households with cable modem service? (It is responded with the variable MODEM.)v. What could be the percentage of occupied households with fiber-optic service? (It is responded with the variable FIBEROP.)vi. What could be the percentage of occupied households with mobile broadband plan for a computer or a cell phone? (It is responded with the variable BROADBND.)vii. What could be the percentage of occupied households with satellite Internet service? (It is responded with the variable SATELLITE.)viii. What could be the percentage of occupied households with some other Internet service? (It is responded with the variable OTHSVCEX.)ix. What could be the percentage of occupied households with a desktop, laptop, netbook, or notebook computer? (It is responded with the variable LAPTOP.)x. What could be the percentage of occupied households with a handheld computer, smart mobile phone, or other handheld wireless computer? (It is responded with the variable HANDHELD.)

7
xi. What could be the percentage of occupied households with some other type of computer? (It is responded with the variable COMPOTHX.)
c. Request the students for each one of them to select three research questions from the previous section (5b), which will be the three variables to analyze, to later answer the questions with the three frequency tables that each student will do.
i. Request for all the students to select the variable ACCESS and for each one of the students to select two additional variables. ii. Besides the variable ACCESS, select two additional variables for demonstration in the classroom.
6. In IBM SPSS Statistics Data Editor (SPSS file that contains the database to analyze), from the Variable View, identify the 11 variables about the computer and Internet use, request to each student to identify the three variables that selected, and for each of the three variables, write the variable label as it appears in the Data Dictionary, under Label. To write the labels of the categories, under Values, select the field that says None and click on the three dots
. In the Value labels dialog box, in Value, write the value (for the variable Access, write 1) and in Label, write the label (for the variable Access, write Yes, with subscription to an Internet service), and click on Add. Continue adding the values and labels of the categories of the variable and click on OK.
7. In IBM SPSS Statistics Data Editor, select the menu Analyze and select Descriptive Statistics and Frequencies, to do the frequency tables.
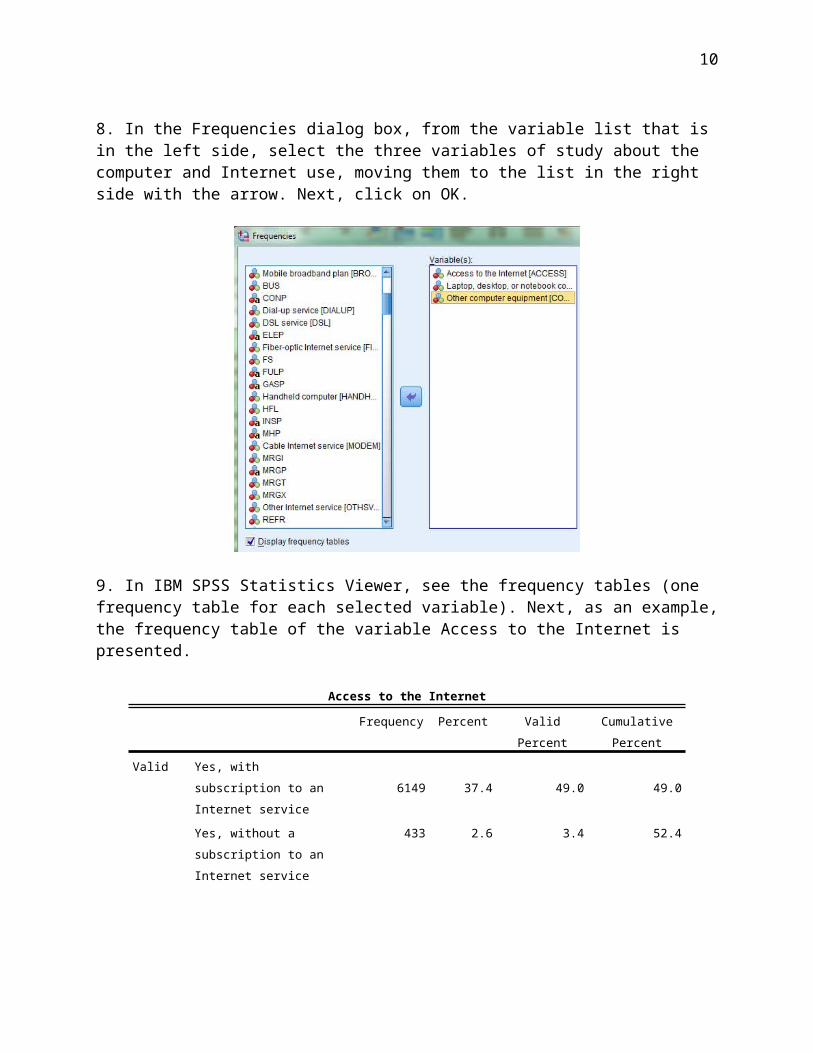
8. In the Frequencies dialog box, from the variable list that is in the left side, select the three variables of study about the computer and Internet use, moving them to the list in the right side with the arrow. Next, click on OK.

8
9. In IBM SPSS Statistics Viewer, see the frequency tables (one frequency table for each selected variable). Next, as an example, the frequency table of the variable Access to the Internet is presented.
Access to the Internet
Frequency Percent Valid Percent Cumulative
Percent
Valid
Yes, with subscription to an
Internet service6149 37.4 49.0 49.0
Yes, without a subscription
to an Internet service433 2.6 3.4 52.4
No Internet access at this
house, apartment, or mobile
home
5975 36.3 47.6 100.0
Total 12557 76.3 100.0
Missing System 3898 23.7
Total 16455 100.0
a. The frequency table includes Frequency, Percent, Valid Percent, Cumulative Percent, and Missing System, for which the students should know their definitions, to correctly understand the table and answer the research question.
i. Frequency – Number of times each value occurred in the database. For example, 6,149 occupied households had subscription to an Internet service.ii. Percent – Proportion multiplied by 100; proportion that is the result from the division between the frequency of that category and the total of all the cases in the database. For

9
example, this total includes the valid cases (Valid) (qualified to answer that question in the questionnaire for being occupied households) and the missing cases (Missing System) (not qualified to answer that question in the questionnaire for being vacant households or group quarters).iii. Valid Percent – Proportion multiplied by 100; proportion that is the result from the division between the frequency of that category and the total of all valid cases (Valid) (qualified to answer that question in the questionnaire for being occupied households).iv. Cumulative Percent – Percentage that is based in the Valid Percent of the first value and increases as it adds up the percentages of the next values until reaching 100 % by adding the percentage of the last value. v. Missing System – Missing cases for not qualifying to answer the question in the questionnaire that corresponds to the variable under analysis. For example, 3,898 is the number of cases that are vacant households or group quarters. In the Data Dictionary, it refers to the cases that, for this variable, its cells are blank in the database because the question did not apply to them. (At this house, apartment, or mobile home – do you or any member of this household access the Internet).
b. In the interpretation of the percentages, it is important to pay attention to the total of the valid cases and to concentrate in the Valid Percent, for being the percentage that is calculated based on the valid cases. Also, the definition of the variable, as it appears in the Subject Definitions, and the order of the questions in the questionnaire, for a question possibly depending on the previous question, should be reviewed.
i. Regarding to the use of a computer, for the question 9, 12,557 occupied households informed if someone owns or uses a desktop, laptop, netbook, or notebook computer (variable LAPTOP); if someone owns or uses a handheld computer, smart mobile phone, or other handheld wireless computer (variable HANDHELD); and if someone owns or uses some other type of computer (variable COMPOTHX). Therefore, 12,557 is the total of valid cases for these three variables.ii. Concerning access to the Internet (variable ACCESS), 6,149 occupied households informed having subscription to an Internet service. By answering yes to question 10, then, they should have answered the question 11 about type of service. Hence, 6,149 is the total of valid cases for the variables BROADBND, DIALUP, DSL, FIBEROP, MODEM, OTHSVCEX, and SATELLITE.
10. Copy the three frequency tables in IBM SPSS Statistics Viewer and paste them in Microsoft Word (for this module, the demonstration is done with the 2013 version). To copy in the Viewer, select the frequency table, go to the Edit menu, and select Copy. In Microsoft Word, click on the Paste icon, under Home. Next, copy and paste the other two frequency tables with the same procedure.
11. Discuss the results in the classroom, beginning with the variable ACCESS, for being the variable that everybody has the same frequency table. Next, ask the students to orally inform
10
about the other frequency tables and comment about the results, in particular, if they were expected.
12. In Microsoft Word, request the students to write a paragraph as interpretation for each frequency table and response to the research question, that they established in the beginning (part 5b), like “What could be the percentage of occupied households with subscription to an Internet service?”
a. An additional paragraph should indicate that the results are based on the 2014 Puerto Rico Community Survey sample that was developed by the United States Census Bureau, besides some other relevant information about the methodology.b. A bibliographic search could be requested to the students about the topic of computer and Internet use, so they can include a comparison between their results and the literature, like the publication Computer and Internet use in the United States: 2013. Next, images from this publication with data that could be considered for a comparison are included.
Resource list/guide
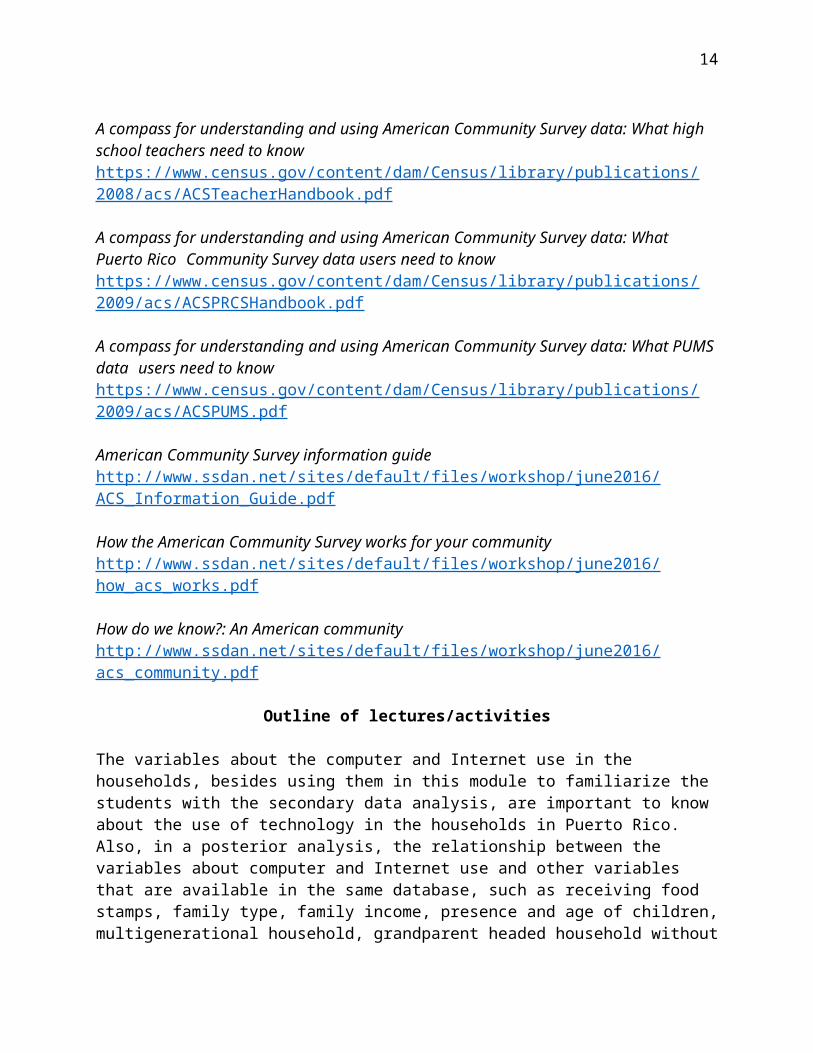
A compass for understanding and using American Community Survey data: What high school teachers need to knowhttps://www.census.gov/content/dam/Census/library/publications/2008/acs/ACSTeacherHandbook.pdf
A compass for understanding and using American Community Survey data: What Puerto Rico Community Survey data users need to knowhttps://www.census.gov/content/dam/Census/library/publications/2009/acs/ACSPRCSHandbook.pdf

11
A compass for understanding and using American Community Survey data: What PUMS data users need to knowhttps://www.census.gov/content/dam/Census/library/publications/2009/acs/ACSPUMS.pdf
American Community Survey information guidehttp://www.ssdan.net/sites/default/files/workshop/june2016/ACS_Information_Guide.pdf
How the American Community Survey works for your communityhttp://www.ssdan.net/sites/default/files/workshop/june2016/how_acs_works.pdf
How do we know?: An American communityhttp://www.ssdan.net/sites/default/files/workshop/june2016/acs_community.pdf
Outline of lectures/activities
The variables about the computer and Internet use in the households, besides using them in this module to familiarize the students with the secondary data analysis, are important to know about the use of technology in the households in Puerto Rico. Also, in a posterior analysis, the relationship between the variables about computer and Internet use and other variables that are available in the same database, such as receiving food stamps, family type, family income, presence and age of children, multigenerational household, grandparent headed household without present parent, workers in the family, and complete plumbing facilities, could be examined. Besides, this is contribution to the accumulation of knowledge about the conditions of the households in this country that in turn could be used in the planning and designing of programs and services for the population, in particular, the communities that require more attention.
Assessment
See Appendix A.
Bibliography
Castle, J. E. (2003). Maximizing research opportunities: Secondary data analysis. Journal of Neuroscience Nursing, 35(5), 287-90.
Cheng, H. G., & Phillips, M. R. (2014). Secondary analysis of existing data: Opportunities and implementation. Shanghai Archives of Psychiatry, 26(6), 371–375. http://doi.org/10.11919/j.issn.1002-0829.214171
Comité Institucional para la Protección de los Seres Humanos en la Investigación. (2014). Categorías de investigaciones que cualifican como exentas de revisión. Retrieved from http://graduados.uprrp.edu/index.php?option=com_content&view=article&id=178&Itemid=440&lang=es

12
Connect Puerto Rico. (2014). Key findings from Connect Puerto Rico’s 2014 Residential Technology Assessment. Retrieved from http://www.estadisticas.pr/iepr/LinkClick.aspx?fileticket=1gqrREittm8%3d&tabid=451
File, T., & Ryan, C. (2014). Computer and Internet use in the United States: 2013. Retrieved from https://www.census.gov/history/pdf/2013computeruse.pdf
Smith, A. K., Ayanian, J. Z., Covinsky, K. E., Landon, B. E., McCarthy, E. P., Wee, C. C., & Steinman, M. A. (2011). Conducting high-value secondary dataset analysis: An introductory guide and resources. Journal of General Internal Medicine, 26(8), 920–929. http://doi.org/10.1007/s11606-010-1621-5
United States Census Bureau. (n.d.). Why we ask: Computer and Internet use. Retrieved from https://www2.census.gov/programs-surveys/acs/about/qbyqfact/Computer_Internet.pdf
Copyright
Copyright by Vivianna Margarita De Jesus Monge, 2017
Web site
Available at the Social Science Data Analysis Network Web site, which is http://www.ssdan.net/.

13
Appendix A
Assignment – Secondary data analysis (36 points)
Due date: ________________
Instructions
1. Write a brief report, that includes an introduction, analysis (interpretation of results [frequency tables]), and conclusion.
2. About the introduction, it must be the presentation of the research topic: the use of computer and Internet in the households. Also, it must indicate the importance of the study of this topic and your three research questions (What could be the percentage of occupied households with …?).
3. Regarding the analysis (interpretation of results), you must select three variables, about the use of computers and Internet; do three frequency tables (one frequency table for each variable), with IBM SPSS Statistics; copy the tables that are in the SPSS output; open Microsoft Word; paste the frequency tables in the document; and write the interpretation for each frequency table.
a. In the interpretation, you must pay attention to the total of valid cases and the Valid Percent in the frequency table, for this percentage is based on the valid cases. Also, you must know the variable definition as it appears in the Subject Definitions and take notice of the order of questions in the questionnaire, for the question possibly depends on the response to the previous question.
i. Concerning the use of a computer, for the question 9, 12,557 occupied households informed if someone owns or uses a desktop, laptop, netbook, or notebook computer (variable LAPTOP); if someone owns or uses a handheld computer, smart mobile phone, or other handheld wireless computer (variable HANDHELD); and if someone owns or uses some other type of computer (variable COMPOTHX). Hence, 12,557 is the total of valid cases for these variables.
ii. About Internet access (variable ACCESS), 6,149 occupied households informed having subscription to an Internet service. By answering yes to the question 10, next they should have answered the question 11 regarding type of service. Therefore, 6,149 is the total of valid cases for the variables BROADBND, DIALUP, DSL, FIBEROP, MODEM, OTHSVCEX, and SATELLITE.
b. In the interpretation, the first paragraph must indicate that the results are based on the 2014 Puerto Rico Community Survey sample that was developed by the United Census Bureau, besides some other relevant information about the methodology. The next three paragraphs must be the interpretation (one paragraph for each frequency table).
14
i. Each paragraph of interpretation of the frequency table must begin with the definition of the variable as it appears in the Subject Definitions and the question in the questionnaire. Next, it must include the valid percentage as an answer for the question that was established in the beginning: What could be the percentage of occupied households with …?
4. Concerning the conclusion, it must include the research limitations (could be about the questionnaire [question writing, for example] or research method [secondary data analysis]) and recommendations for future research, either about the methodology or study of the use of computer and Internet in the households.
Notes
1. Must have minimum 3 pages and be written in paragraphs, double space, Times New Roman 12, and subtitles (Introduction, Analysis, and Conclusion). 2. Must be individually done.

15