) charge variant analysis - thermo fisher...
TRANSCRIPT

A Fast and Robust Linear pH Gradient Separation Platform for Monoclonal Antibody (MAb) Charge Variant AnalysisShanhua Lin, Julia Baek, and Chris Pohl Thermo Fisher Scientific, Sunnyvale, CA, USA

2 A Fast and Robust Linear pH Gradient Separation Platform for Monoclonal Antibody (MAb) Charge Variant Analysis
A Fast and Robust Linear pH Gradient Separation Platform for Monoclonal Antibody (MAb) Charge Variant Analysis Shanhua Lin,1 Julia Baek,1 and Chris Pohl1 1Thermo Fisher Scientific, Sunnyvale, CA, USA
Conclusions
Using pH gradient method, linear signal response is achieved with up to 300 µg protein loading;
Using pH gradient method, the elution pH values of MAbs are in linear relationship with their corresponding pI values;
Using pH gradient method, fast separation of MAb charge variants is achieved within a 10-min cycle time.
References 1. Lin, S., Baek, J., Decrop, W., Rao, S., Agroskin, Y., and Pohl, C.
Development of a Cation-Exchange pH Gradient Separation Platform. Presented at 39th International Symposium on High Performance Liquid Phase Separations and Related Techniques, Amsterdam, The Netherlands, June 16-20, 2013.
Overview Purpose: Evaluate the loading capacity, elution pH, and the throughput using linear pH gradient separation method for MAb variant analysis.
Methods: A linear pH gradient from pH 5.6 to pH 10.2 is generated over time by running a linear pump gradient from 100% Thermo Scientific™ CX-1 pH Gradient Buffer A (pH 5.6) to 100% CX-1 pH Gradient Buffer B (pH 10.2) . Online monitoring of the mobile phase pH value confirmed that a linear pH gradient was achieved.
Results: 1. Linear UV response with up to 300 µg of protein loading; 2. The elution pH values of MAbs are in linear relationship with their corresponding pI values; 3. a fast separation of MAb charge variants is achieved in a 10-min cycle time.
Introduction Recombinant monoclonal antibodies (MAbs) can be highly heterogeneous due to modifications such as sialylation, deamidation and C-terminal lysine truncation. Salt gradient cation exchange chromatography has been used with some success in characterizing MAb charge variants. However, additional effort is often required to tailor the salt gradient method for an individual MAb. In the fast-pace drug development environment, a fast and robust platform method is desired to accommodate the majority of the MAb analyses.
We recently introduced a cation-exchange pH gradient buffer system which meets the fast and robust platform method requirement (ref. 1) This buffer system consists of a low-pH buffer A at pH 5.6 and a high-pH buffer B at pH 10.2. A linear pH gradient from pH 5.6 to pH 10.2 is generated over time by running a linear pump gradient from 100% buffer A to 100% buffer B. Using various MAbs with pI values ranging from 7 to 10, we demonstrated that the linear pH gradient method separates charge variants consistently. The loading capacity on a Thermo Scientific™ MAbPac™ SCX-10 column when running pH gradient is investigated by injecting increasing amount of protein standards. The study shows that there is a linear signal response up to 300 µg of protein loading. Furthermore, a fast separation of charge variants is achieved in a 10-min cycle time using 2 mL/min flow rate on a MAbPac SCX-10, 5 µm, 4 × 50 mm column.
Methods Sample Preparation:
All standard proteins were purchased from Sigma-Aldrich®. Monoclonal antibodies was a gift from a local biotech company. Proteins and MAb were dissolved in deionized water.
Columns and Buffers
MAbPac SCX-10, 10 µm, 4 × 250 mm (P/N 074625)
MAbPac SCX-10, 5 µm, 4 × 50 mm (P/N 078656)
CX-1 pH Gradient Buffer A (pH 5.6), 125 mL (P/N 083273)
CX-1 pH Gradient Buffer B (pH 10.2), 125 mL (P/N 083275)
Liquid Chromatography
HPLC experiments were carried out using an Thermo Scientific™ Dionex™ UltiMate™ 3000 BioRS System equipped with:
SRD-3600 Membrane Degasser
DGP-3600RS Biocompatible Rapid Separation Pump
TCC-3000SD Thermostated Column Compartment with two biocompatible 10-port valves
WPS-3000TBRS Biocompatible Rapid Separation Thermostated Autosampler
VWD-3400RS UV Detector equipped with a Micro Flow Cell
PCM-3000 pH and Conductivity Monitor
Results
The linear pH gradient was achieved by employing a multi-component buffer system containing multiple zwitterionic buffer species with pI values ranging from 6 to 10. Eluent A was titrated to pH 5.6 and eluent B was titrated to pH 10.2. In this pH range, each buffer species was either neutral or negatively charged. Therefore they were not retained by cation exchange column stationary phase and served as good buffers for the mobile phase and the stationary phase.
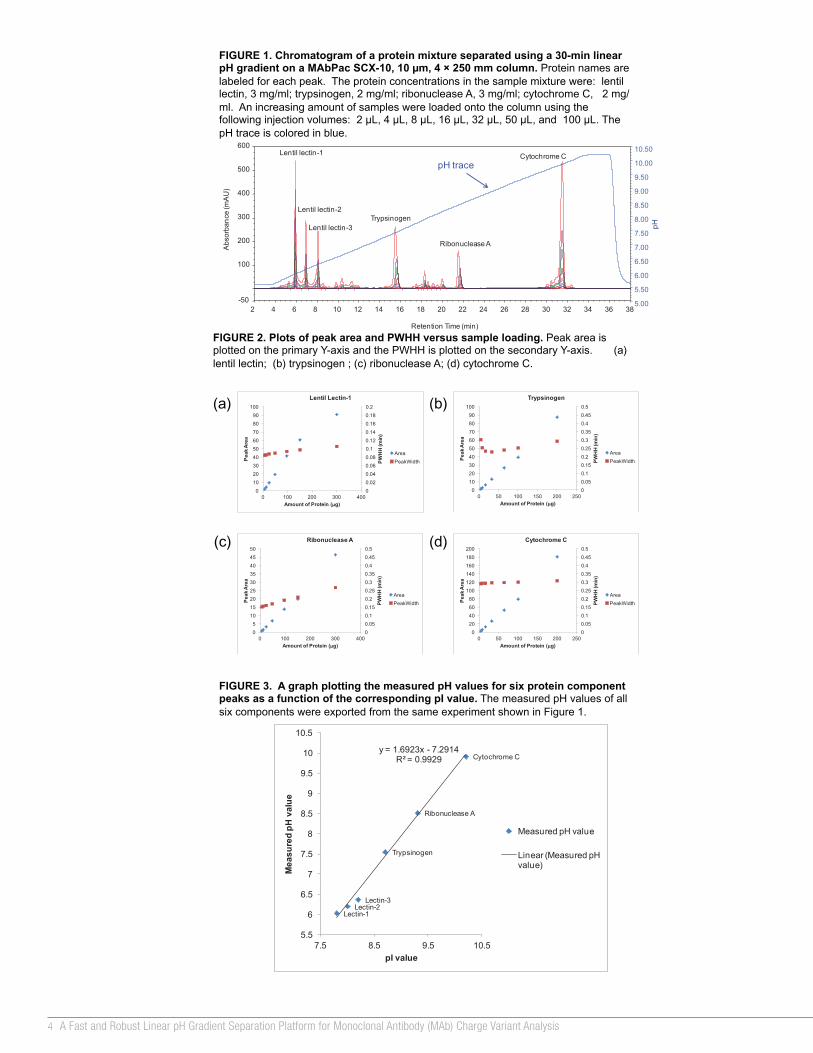
The separation of proteins with different pI values by pH gradient was demonstrated in Figure 1. The protein mixture contained lentil lectin with three isoforms of lectin-1 (pI 7.8), lectin-2 (pI 8.0), lectin-3 (pI 8.2), trypsinogen (pI 8.7), ribonuclease A (pI 9.3), and cytochrome C (pI 10.2). The concentration of these proteins were 3 mg/mL, 2 mg/mL, 3 mg/mL and 2 mg/mL respectively. Figure 1 showed the multiple UV traces of chromagrams recorded from a series injections of the protein mixture at 2 µL, 4 µL, 8 µL, 16 µL, 32 µL, 50 µL, and 100 µL. The peak area and peak width at half height (PWHH) were plotted against the sample loading in Figure 2a, 2b, 2c and 2d for lentil lectin-1, trypsinogen, ribonuclease A, and cytochrome C respectively. Trypsinogen, ribonuclease A, and cytochrome c exhibited very linear response up 100 µL of sample loading while lentil lectin-1 showed linear response up to 50 µL of sample loading. The separation of these proteins maintained throughout the range of 20 µg to 1,000 µg total protein loading.
Table 1. A 30 min linear gradient method for the MAbPac SCX-10, 10 µm, 4 × 250 mm, cation exchange columns . Total run time is 40 min. The linear pH range covers from pH 5.6 to pH 10.2.
FIGURE 1. Chromatogram of a protein mixture separated using a 30-min linear pH gradient on a MAbPac SCX-10, 10 µm, 4 × 250 mm column. Protein names are labeled for each peak. The protein concentrations in the sample mixture were: lentil lectin, 3 mg/ml; trypsinogen, 2 mg/ml; ribonuclease A, 3 mg/ml; cytochrome C, 2 mg/ml. An increasing amount of samples were loaded onto the column using the following injection volumes: 2 µL, 4 µL, 8 µL, 16 µL, 32 µL, 50 µL, and 100 µL. The pH trace is colored in blue.
FIGURE 6. Fast MAb variant separation using pH gradient on a MAbPac SCX-10, 5 µm, 4 × 50 mm column. (a) 15-min gradient method; (b) 7.5-min gradient method. The MAb sample concentration was 5 mg/mL.
Preparation of Eluents
Eluent A and B each was prepared by simply diluting the corresponding 10 X CX-1 pH Gradient Buffer 10 fold using deionized water.
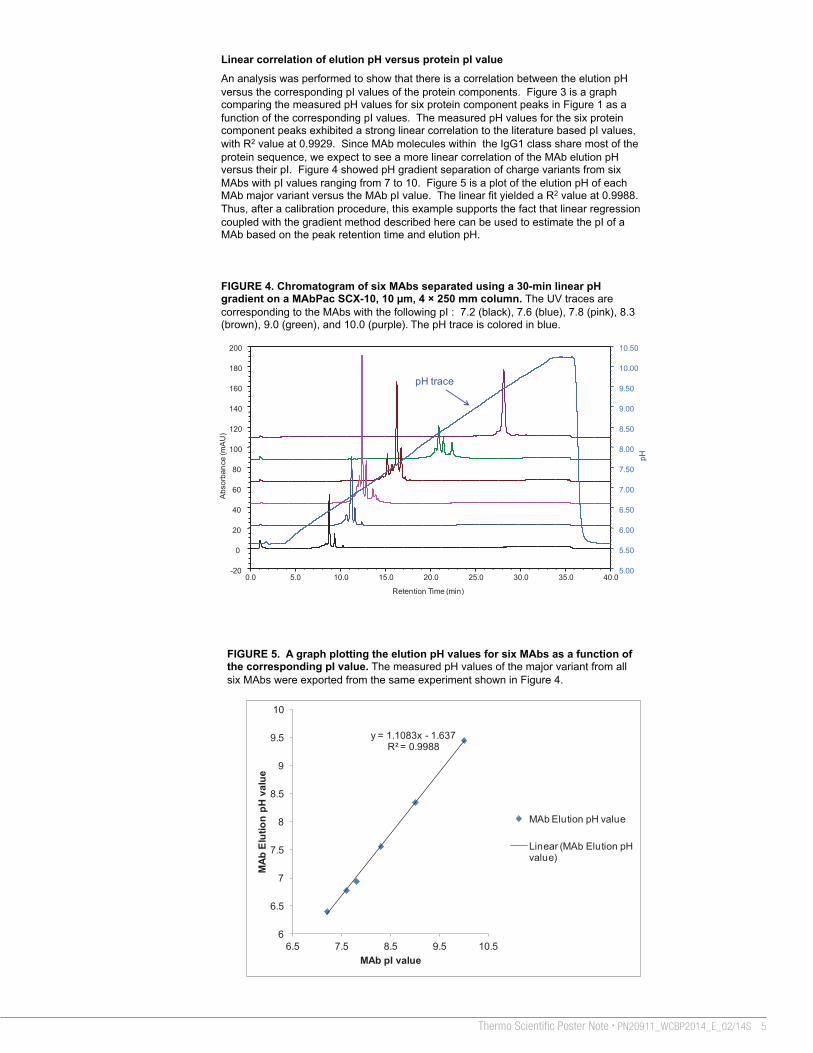
FIGURE 3. A graph plotting the measured pH values for six protein component peaks as a function of the corresponding pI value. The measured pH values of all six components were exported from the same experiment shown in Figure 1.
Gradients
The linear pH gradient was generated by running a linear gradient from 100% eluent A (pH 5.6) to 100% eluent B (pH 10.2). For pH gradient analysis carried out on the MAbPac SCX-10, 10 µm, 4 × 250 mm columns, the gradient method in Table 1 was used. For pH gradient analysis carried out on the MAbPac SCX-10, 5 µm, 4 × 50 mm columns, the gradient method in Table 2 or Table 3 was used. All methods cover the pH range from pH 5.6 to pH 10.2.
Table 3. A 7.5 min linear gradient method for MAbPac SCX-10, 5 µm, 4 × 50 mm, cation exchange columns. Total run time is 10 min. The linear pH range covers from pH 5.6 to pH 10.2.
Fast pH Gradient Separation
The pH gradient method is fast and rugged. Figure 6 showed pH gradient runs on a MAbPac SCX-10, 5 µm, 4 × 50 mm column. Using 1 mL/min flow rate, MAb variants separation can be achieved within 15 min with a total run time of 20 min (figure 6a). Using 2 mL/min flow rate, MAb variants separation can be achieved within 7.5 min with a total run time of 10 min (figure 6b). In both cases, the linearity of the pH gradient maintained.
Lectin-1Lectin-2
Lectin-3
Trypsinogen
Ribonuclease A
Cytochrome Cy = 1.6923x - 7.2914
R² = 0.9929
5.5
6
6.5
7
7.5
8
8.5
9
9.5
10
10.5
7.5 8.5 9.5 10.5
Mea
sure
d p
H v
alu
e
pI value
Measured pH value
Linear (Measured pH value)
© 2014 Thermo Fisher Scientific Inc. All rights reserved. Sigma is a registered trademark of Sigma-Aldrich Co. LLC. All other trademarks are the property of Thermo Fisher Scientific and its subsidiaries.
This information is not intended to encourage use of these products in any manners that might infringe the intellectual property rights of others.
0.0 1.0 2.0 3.0 4.0 5.0 6.0 7.0 8.0 9.0 10.0 -20
0
20
40
60
80
100
120
140
5.00
6.00
7.00
8.00
9.00
10.00
11.00
Abs
orba
nce
(mA
U)
Retention Time (min)
pH trace
(b)
0.0 2.0 4.0 6.0 8.0 10.0 12.0 14.0 16.0 18.0 20.0 -50
0
50
100
150
200
250
5.00
6.00
7.00
8.00
9.00
10.50
Abs
orba
nce
(mA
U)
Retention Time (min)
pH trace (a)
0
0.02
0.04
0.06
0.08
0.1
0.12
0.14
0.16
0.18
0.2
0
10
20
30
40
50
60
70
80
90
100
0 100 200 300 400
PW
HH
(min
)
Pea
k A
rea
Amount of Protein (µg)
Lentil Lectin-1
Area
PeakWidth
0
0.05
0.1
0.15
0.2
0.25
0.3
0.35
0.4
0.45
0.5
0
10
20
30
40
50
60
70
80
90
100
0 50 100 150 200 250
PW
HH
(min
)
Pea
k A
rea
Amount of Protein (µg)
Trypsinogen
Area
PeakWidth
0
0.05
0.1
0.15
0.2
0.25
0.3
0.35
0.4
0.45
0.5
0
5
10
15
20
25
30
35
40
45
50
0 100 200 300 400
PW
HH
(min
)
Pea
k A
rea
Amount of Protein (µg)
Ribonuclease A
Area
PeakWidth
0
0.05
0.1
0.15
0.2
0.25
0.3
0.35
0.4
0.45
0.5
0
20
40
60
80
100
120
140
160
180
200
0 50 100 150 200 250
PW
HH
(min
)
Pea
k A
rea
Amount of Protein (µg)
Cytochrome C
Area
PeakWidth
FIGURE 4. Chromatogram of six MAbs separated using a 30-min linear pH gradient on a MAbPac SCX-10, 10 µm, 4 × 250 mm column. The UV traces are corresponding to the MAbs with the following pI : 7.2 (black), 7.6 (blue), 7.8 (pink), 8.3 (brown), 9.0 (green), and 10.0 (purple). The pH trace is colored in blue.
Linear correlation of elution pH versus protein pI value
An analysis was performed to show that there is a correlation between the elution pH versus the corresponding pI values of the protein components. Figure 3 is a graph comparing the measured pH values for six protein component peaks in Figure 1 as a function of the corresponding pI values. The measured pH values for the six protein component peaks exhibited a strong linear correlation to the literature based pI values, with R2 value at 0.9929. Since MAb molecules within the IgG1 class share most of the protein sequence, we expect to see a more linear correlation of the MAb elution pH versus their pI. Figure 4 showed pH gradient separation of charge variants from six MAbs with pI values ranging from 7 to 10. Figure 5 is a plot of the elution pH of each MAb major variant versus the MAb pI value. The linear fit yielded a R2 value at 0.9988. Thus, after a calibration procedure, this example supports the fact that linear regression coupled with the gradient method described here can be used to estimate the pI of a MAb based on the peak retention time and elution pH.
FIGURE 5. A graph plotting the elution pH values for six MAbs as a function of the corresponding pI value. The measured pH values of the major variant from all six MAbs were exported from the same experiment shown in Figure 4.
y = 1.1083x - 1.637R² = 0.9988
6
6.5
7
7.5
8
8.5
9
9.5
10
6.5 7.5 8.5 9.5 10.5
MA
b E
luti
on
pH
va
lue
MAb pI value
MAb Elution pH value
Linear (MAb Elution pH value)
2 4 6 8 10 12 14 16 18 20 22 24 26 28 30 32 34 36 38-50
100
200
300
400
500
600
5.00
5.50
6.00
6.50
7.00
7.50
8.00
8.50
9.00
9.50
10.00
10.50
Abs
orba
nce
(mA
U)
Retention Time (min)
pH traceLentil lectin-1
Lentil lectin-2
Lentil lectin-3Trypsinogen
Ribonuclease A
Cytochrome C
0.0 5.0 10.0 15.0 20.0 25.0 30.0 35.0 40.0-20
0
20
40
60
80
100
120
140
160
180
200
5.00
5.50
6.00
6.50
7.00
7.50
8.00
8.50
9.00
9.50
10.00
10.50
pH trace
Ab
sorb
an
ce (m
AU
)
Retention Time (min)
FIGURE 2. Plots of peak area and PWHH versus sample loading. Peak area is plotted on the primary Y-axis and the PWHH is plotted on the secondary Y-axis. (a) lentil lectin; (b) trypsinogen ; (c) ribonuclease A; (d) cytochrome C.
(d)
(b)
(c)
(a)
Table 2. A 15 min linear gradient method for MAbPac SCX-10, 5 µm, 4 × 50 mm, cation exchange columns. Total run time is 20 min. The linear pH range covers from pH 5.6 to pH 10.2.
Time (minutes) Flow rate (mL/min) %A %B
0–8.5 2 100 0
0.5–8 2 100–0 0–100
8–8.5 2 0 100
8.5–10 2 100 0
Time (minutes) Flow rate (mL/min) %A %B
0–1 1 100 0
1–16 1 100–0 0 –100
16–17 1 0 100
17–20 1 100 0
Time (minutes) Flow rate (mL/min) %A %B
0–1 1 100 0
1–31 1 100–0 0–100
31–34 1 0 100
34–40 1 100 0
PO20911_E 01/14S

3Thermo Scientific Poster Note • PN20911_WCBP2014_E_02/14S
A Fast and Robust Linear pH Gradient Separation Platform for Monoclonal Antibody (MAb) Charge Variant Analysis Shanhua Lin,1 Julia Baek,1 and Chris Pohl1 1Thermo Fisher Scientific, Sunnyvale, CA, USA
Conclusions
Using pH gradient method, linear signal response is achieved with up to 300 µg protein loading;
Using pH gradient method, the elution pH values of MAbs are in linear relationship with their corresponding pI values;
Using pH gradient method, fast separation of MAb charge variants is achieved within a 10-min cycle time.
References 1. Lin, S., Baek, J., Decrop, W., Rao, S., Agroskin, Y., and Pohl, C.
Development of a Cation-Exchange pH Gradient Separation Platform. Presented at 39th International Symposium on High Performance Liquid Phase Separations and Related Techniques, Amsterdam, The Netherlands, June 16-20, 2013.
Overview Purpose: Evaluate the loading capacity, elution pH, and the throughput using linear pH gradient separation method for MAb variant analysis.
Methods: A linear pH gradient from pH 5.6 to pH 10.2 is generated over time by running a linear pump gradient from 100% Thermo Scientific™ CX-1 pH Gradient Buffer A (pH 5.6) to 100% CX-1 pH Gradient Buffer B (pH 10.2) . Online monitoring of the mobile phase pH value confirmed that a linear pH gradient was achieved.
Results: 1. Linear UV response with up to 300 µg of protein loading; 2. The elution pH values of MAbs are in linear relationship with their corresponding pI values; 3. a fast separation of MAb charge variants is achieved in a 10-min cycle time.
Introduction Recombinant monoclonal antibodies (MAbs) can be highly heterogeneous due to modifications such as sialylation, deamidation and C-terminal lysine truncation. Salt gradient cation exchange chromatography has been used with some success in characterizing MAb charge variants. However, additional effort is often required to tailor the salt gradient method for an individual MAb. In the fast-pace drug development environment, a fast and robust platform method is desired to accommodate the majority of the MAb analyses.
We recently introduced a cation-exchange pH gradient buffer system which meets the fast and robust platform method requirement (ref. 1) This buffer system consists of a low-pH buffer A at pH 5.6 and a high-pH buffer B at pH 10.2. A linear pH gradient from pH 5.6 to pH 10.2 is generated over time by running a linear pump gradient from 100% buffer A to 100% buffer B. Using various MAbs with pI values ranging from 7 to 10, we demonstrated that the linear pH gradient method separates charge variants consistently. The loading capacity on a Thermo Scientific™ MAbPac™ SCX-10 column when running pH gradient is investigated by injecting increasing amount of protein standards. The study shows that there is a linear signal response up to 300 µg of protein loading. Furthermore, a fast separation of charge variants is achieved in a 10-min cycle time using 2 mL/min flow rate on a MAbPac SCX-10, 5 µm, 4 × 50 mm column.
Methods Sample Preparation:
All standard proteins were purchased from Sigma-Aldrich®. Monoclonal antibodies was a gift from a local biotech company. Proteins and MAb were dissolved in deionized water.
Columns and Buffers
MAbPac SCX-10, 10 µm, 4 × 250 mm (P/N 074625)
MAbPac SCX-10, 5 µm, 4 × 50 mm (P/N 078656)
CX-1 pH Gradient Buffer A (pH 5.6), 125 mL (P/N 083273)
CX-1 pH Gradient Buffer B (pH 10.2), 125 mL (P/N 083275)
Liquid Chromatography
HPLC experiments were carried out using an Thermo Scientific™ Dionex™ UltiMate™ 3000 BioRS System equipped with:
SRD-3600 Membrane Degasser
DGP-3600RS Biocompatible Rapid Separation Pump
TCC-3000SD Thermostated Column Compartment with two biocompatible 10-port valves
WPS-3000TBRS Biocompatible Rapid Separation Thermostated Autosampler
VWD-3400RS UV Detector equipped with a Micro Flow Cell
PCM-3000 pH and Conductivity Monitor
Results
The linear pH gradient was achieved by employing a multi-component buffer system containing multiple zwitterionic buffer species with pI values ranging from 6 to 10. Eluent A was titrated to pH 5.6 and eluent B was titrated to pH 10.2. In this pH range, each buffer species was either neutral or negatively charged. Therefore they were not retained by cation exchange column stationary phase and served as good buffers for the mobile phase and the stationary phase.
The separation of proteins with different pI values by pH gradient was demonstrated in Figure 1. The protein mixture contained lentil lectin with three isoforms of lectin-1 (pI 7.8), lectin-2 (pI 8.0), lectin-3 (pI 8.2), trypsinogen (pI 8.7), ribonuclease A (pI 9.3), and cytochrome C (pI 10.2). The concentration of these proteins were 3 mg/mL, 2 mg/mL, 3 mg/mL and 2 mg/mL respectively. Figure 1 showed the multiple UV traces of chromagrams recorded from a series injections of the protein mixture at 2 µL, 4 µL, 8 µL, 16 µL, 32 µL, 50 µL, and 100 µL. The peak area and peak width at half height (PWHH) were plotted against the sample loading in Figure 2a, 2b, 2c and 2d for lentil lectin-1, trypsinogen, ribonuclease A, and cytochrome C respectively. Trypsinogen, ribonuclease A, and cytochrome c exhibited very linear response up 100 µL of sample loading while lentil lectin-1 showed linear response up to 50 µL of sample loading. The separation of these proteins maintained throughout the range of 20 µg to 1,000 µg total protein loading.
Table 1. A 30 min linear gradient method for the MAbPac SCX-10, 10 µm, 4 × 250 mm, cation exchange columns . Total run time is 40 min. The linear pH range covers from pH 5.6 to pH 10.2.
FIGURE 1. Chromatogram of a protein mixture separated using a 30-min linear pH gradient on a MAbPac SCX-10, 10 µm, 4 × 250 mm column. Protein names are labeled for each peak. The protein concentrations in the sample mixture were: lentil lectin, 3 mg/ml; trypsinogen, 2 mg/ml; ribonuclease A, 3 mg/ml; cytochrome C, 2 mg/ml. An increasing amount of samples were loaded onto the column using the following injection volumes: 2 µL, 4 µL, 8 µL, 16 µL, 32 µL, 50 µL, and 100 µL. The pH trace is colored in blue.
FIGURE 6. Fast MAb variant separation using pH gradient on a MAbPac SCX-10, 5 µm, 4 × 50 mm column. (a) 15-min gradient method; (b) 7.5-min gradient method. The MAb sample concentration was 5 mg/mL.
Preparation of Eluents
Eluent A and B each was prepared by simply diluting the corresponding 10 X CX-1 pH Gradient Buffer 10 fold using deionized water.
FIGURE 3. A graph plotting the measured pH values for six protein component peaks as a function of the corresponding pI value. The measured pH values of all six components were exported from the same experiment shown in Figure 1.
Gradients
The linear pH gradient was generated by running a linear gradient from 100% eluent A (pH 5.6) to 100% eluent B (pH 10.2). For pH gradient analysis carried out on the MAbPac SCX-10, 10 µm, 4 × 250 mm columns, the gradient method in Table 1 was used. For pH gradient analysis carried out on the MAbPac SCX-10, 5 µm, 4 × 50 mm columns, the gradient method in Table 2 or Table 3 was used. All methods cover the pH range from pH 5.6 to pH 10.2.
Table 3. A 7.5 min linear gradient method for MAbPac SCX-10, 5 µm, 4 × 50 mm, cation exchange columns. Total run time is 10 min. The linear pH range covers from pH 5.6 to pH 10.2.
Fast pH Gradient Separation
The pH gradient method is fast and rugged. Figure 6 showed pH gradient runs on a MAbPac SCX-10, 5 µm, 4 × 50 mm column. Using 1 mL/min flow rate, MAb variants separation can be achieved within 15 min with a total run time of 20 min (figure 6a). Using 2 mL/min flow rate, MAb variants separation can be achieved within 7.5 min with a total run time of 10 min (figure 6b). In both cases, the linearity of the pH gradient maintained.
Lectin-1Lectin-2
Lectin-3
Trypsinogen
Ribonuclease A
Cytochrome Cy = 1.6923x - 7.2914
R² = 0.9929
5.5
6
6.5
7
7.5
8
8.5
9
9.5
10
10.5
7.5 8.5 9.5 10.5
Mea
sure
d p
H v
alu
e
pI value
Measured pH value
Linear (Measured pH value)
© 2014 Thermo Fisher Scientific Inc. All rights reserved. Sigma is a registered trademark of Sigma-Aldrich Co. LLC. All other trademarks are the property of Thermo Fisher Scientific and its subsidiaries.
This information is not intended to encourage use of these products in any manners that might infringe the intellectual property rights of others.
0.0 1.0 2.0 3.0 4.0 5.0 6.0 7.0 8.0 9.0 10.0 -20
0
20
40
60
80
100
120
140
5.00
6.00
7.00
8.00
9.00
10.00
11.00
Abs
orba
nce
(mA
U)
Retention Time (min)
pH trace
(b)
0.0 2.0 4.0 6.0 8.0 10.0 12.0 14.0 16.0 18.0 20.0 -50
0
50
100
150
200
250
5.00
6.00
7.00
8.00
9.00
10.50
Abs
orba
nce
(mA
U)
Retention Time (min)
pH trace (a)
0
0.02
0.04
0.06
0.08
0.1
0.12
0.14
0.16
0.18
0.2
0
10
20
30
40
50
60
70
80
90
100
0 100 200 300 400
PW
HH
(min
)
Pea
k A
rea
Amount of Protein (µg)
Lentil Lectin-1
Area
PeakWidth
0
0.05
0.1
0.15
0.2
0.25
0.3
0.35
0.4
0.45
0.5
0
10
20
30
40
50
60
70
80
90
100
0 50 100 150 200 250
PW
HH
(min
)
Pea
k A
rea
Amount of Protein (µg)
Trypsinogen
Area
PeakWidth
0
0.05
0.1
0.15
0.2
0.25
0.3
0.35
0.4
0.45
0.5
0
5
10
15
20
25
30
35
40
45
50
0 100 200 300 400
PW
HH
(min
)
Pea
k A
rea
Amount of Protein (µg)
Ribonuclease A
Area
PeakWidth
0
0.05
0.1
0.15
0.2
0.25
0.3
0.35
0.4
0.45
0.5
0
20
40
60
80
100
120
140
160
180
200
0 50 100 150 200 250
PW
HH
(min
)
Pea
k A
rea
Amount of Protein (µg)
Cytochrome C
Area
PeakWidth
FIGURE 4. Chromatogram of six MAbs separated using a 30-min linear pH gradient on a MAbPac SCX-10, 10 µm, 4 × 250 mm column. The UV traces are corresponding to the MAbs with the following pI : 7.2 (black), 7.6 (blue), 7.8 (pink), 8.3 (brown), 9.0 (green), and 10.0 (purple). The pH trace is colored in blue.
Linear correlation of elution pH versus protein pI value
An analysis was performed to show that there is a correlation between the elution pH versus the corresponding pI values of the protein components. Figure 3 is a graph comparing the measured pH values for six protein component peaks in Figure 1 as a function of the corresponding pI values. The measured pH values for the six protein component peaks exhibited a strong linear correlation to the literature based pI values, with R2 value at 0.9929. Since MAb molecules within the IgG1 class share most of the protein sequence, we expect to see a more linear correlation of the MAb elution pH versus their pI. Figure 4 showed pH gradient separation of charge variants from six MAbs with pI values ranging from 7 to 10. Figure 5 is a plot of the elution pH of each MAb major variant versus the MAb pI value. The linear fit yielded a R2 value at 0.9988. Thus, after a calibration procedure, this example supports the fact that linear regression coupled with the gradient method described here can be used to estimate the pI of a MAb based on the peak retention time and elution pH.
FIGURE 5. A graph plotting the elution pH values for six MAbs as a function of the corresponding pI value. The measured pH values of the major variant from all six MAbs were exported from the same experiment shown in Figure 4.
y = 1.1083x - 1.637R² = 0.9988
6
6.5
7
7.5
8
8.5
9
9.5
10
6.5 7.5 8.5 9.5 10.5
MA
b E
luti
on
pH
va
lue
MAb pI value
MAb Elution pH value
Linear (MAb Elution pH value)
2 4 6 8 10 12 14 16 18 20 22 24 26 28 30 32 34 36 38-50
100
200
300
400
500
600
5.00
5.50
6.00
6.50
7.00
7.50
8.00
8.50
9.00
9.50
10.00
10.50
Abs
orba
nce
(mA
U)
Retention Time (min)
pH traceLentil lectin-1
Lentil lectin-2
Lentil lectin-3Trypsinogen
Ribonuclease A
Cytochrome C
0.0 5.0 10.0 15.0 20.0 25.0 30.0 35.0 40.0-20
0
20
40
60
80
100
120
140
160
180
200
5.00
5.50
6.00
6.50
7.00
7.50
8.00
8.50
9.00
9.50
10.00
10.50
pH trace
Ab
sorb
an
ce (m
AU
)
Retention Time (min)
FIGURE 2. Plots of peak area and PWHH versus sample loading. Peak area is plotted on the primary Y-axis and the PWHH is plotted on the secondary Y-axis. (a) lentil lectin; (b) trypsinogen ; (c) ribonuclease A; (d) cytochrome C.
(d)
(b)
(c)
(a)
Table 2. A 15 min linear gradient method for MAbPac SCX-10, 5 µm, 4 × 50 mm, cation exchange columns. Total run time is 20 min. The linear pH range covers from pH 5.6 to pH 10.2.
Time (minutes) Flow rate (mL/min) %A %B
0–8.5 2 100 0
0.5–8 2 100–0 0–100
8–8.5 2 0 100
8.5–10 2 100 0
Time (minutes) Flow rate (mL/min) %A %B
0–1 1 100 0
1–16 1 100–0 0 –100
16–17 1 0 100
17–20 1 100 0
Time (minutes) Flow rate (mL/min) %A %B
0–1 1 100 0
1–31 1 100–0 0–100
31–34 1 0 100
34–40 1 100 0
PO20911_E 01/14S
4 A Fast and Robust Linear pH Gradient Separation Platform for Monoclonal Antibody (MAb) Charge Variant Analysis
A Fast and Robust Linear pH Gradient Separation Platform for Monoclonal Antibody (MAb) Charge Variant Analysis Shanhua Lin,1 Julia Baek,1 and Chris Pohl1 1Thermo Fisher Scientific, Sunnyvale, CA, USA
Conclusions
Using pH gradient method, linear signal response is achieved with up to 300 µg protein loading;
Using pH gradient method, the elution pH values of MAbs are in linear relationship with their corresponding pI values;
Using pH gradient method, fast separation of MAb charge variants is achieved within a 10-min cycle time.
References 1. Lin, S., Baek, J., Decrop, W., Rao, S., Agroskin, Y., and Pohl, C.
Development of a Cation-Exchange pH Gradient Separation Platform. Presented at 39th International Symposium on High Performance Liquid Phase Separations and Related Techniques, Amsterdam, The Netherlands, June 16-20, 2013.
Overview Purpose: Evaluate the loading capacity, elution pH, and the throughput using linear pH gradient separation method for MAb variant analysis.
Methods: A linear pH gradient from pH 5.6 to pH 10.2 is generated over time by running a linear pump gradient from 100% Thermo Scientific™ CX-1 pH Gradient Buffer A (pH 5.6) to 100% CX-1 pH Gradient Buffer B (pH 10.2) . Online monitoring of the mobile phase pH value confirmed that a linear pH gradient was achieved.
Results: 1. Linear UV response with up to 300 µg of protein loading; 2. The elution pH values of MAbs are in linear relationship with their corresponding pI values; 3. a fast separation of MAb charge variants is achieved in a 10-min cycle time.
Introduction Recombinant monoclonal antibodies (MAbs) can be highly heterogeneous due to modifications such as sialylation, deamidation and C-terminal lysine truncation. Salt gradient cation exchange chromatography has been used with some success in characterizing MAb charge variants. However, additional effort is often required to tailor the salt gradient method for an individual MAb. In the fast-pace drug development environment, a fast and robust platform method is desired to accommodate the majority of the MAb analyses.
We recently introduced a cation-exchange pH gradient buffer system which meets the fast and robust platform method requirement (ref. 1) This buffer system consists of a low-pH buffer A at pH 5.6 and a high-pH buffer B at pH 10.2. A linear pH gradient from pH 5.6 to pH 10.2 is generated over time by running a linear pump gradient from 100% buffer A to 100% buffer B. Using various MAbs with pI values ranging from 7 to 10, we demonstrated that the linear pH gradient method separates charge variants consistently. The loading capacity on a Thermo Scientific™ MAbPac™ SCX-10 column when running pH gradient is investigated by injecting increasing amount of protein standards. The study shows that there is a linear signal response up to 300 µg of protein loading. Furthermore, a fast separation of charge variants is achieved in a 10-min cycle time using 2 mL/min flow rate on a MAbPac SCX-10, 5 µm, 4 × 50 mm column.
Methods Sample Preparation:
All standard proteins were purchased from Sigma-Aldrich®. Monoclonal antibodies was a gift from a local biotech company. Proteins and MAb were dissolved in deionized water.
Columns and Buffers
MAbPac SCX-10, 10 µm, 4 × 250 mm (P/N 074625)
MAbPac SCX-10, 5 µm, 4 × 50 mm (P/N 078656)
CX-1 pH Gradient Buffer A (pH 5.6), 125 mL (P/N 083273)
CX-1 pH Gradient Buffer B (pH 10.2), 125 mL (P/N 083275)
Liquid Chromatography
HPLC experiments were carried out using an Thermo Scientific™ Dionex™ UltiMate™ 3000 BioRS System equipped with:
SRD-3600 Membrane Degasser
DGP-3600RS Biocompatible Rapid Separation Pump
TCC-3000SD Thermostated Column Compartment with two biocompatible 10-port valves
WPS-3000TBRS Biocompatible Rapid Separation Thermostated Autosampler
VWD-3400RS UV Detector equipped with a Micro Flow Cell
PCM-3000 pH and Conductivity Monitor
Results
The linear pH gradient was achieved by employing a multi-component buffer system containing multiple zwitterionic buffer species with pI values ranging from 6 to 10. Eluent A was titrated to pH 5.6 and eluent B was titrated to pH 10.2. In this pH range, each buffer species was either neutral or negatively charged. Therefore they were not retained by cation exchange column stationary phase and served as good buffers for the mobile phase and the stationary phase.
The separation of proteins with different pI values by pH gradient was demonstrated in Figure 1. The protein mixture contained lentil lectin with three isoforms of lectin-1 (pI 7.8), lectin-2 (pI 8.0), lectin-3 (pI 8.2), trypsinogen (pI 8.7), ribonuclease A (pI 9.3), and cytochrome C (pI 10.2). The concentration of these proteins were 3 mg/mL, 2 mg/mL, 3 mg/mL and 2 mg/mL respectively. Figure 1 showed the multiple UV traces of chromagrams recorded from a series injections of the protein mixture at 2 µL, 4 µL, 8 µL, 16 µL, 32 µL, 50 µL, and 100 µL. The peak area and peak width at half height (PWHH) were plotted against the sample loading in Figure 2a, 2b, 2c and 2d for lentil lectin-1, trypsinogen, ribonuclease A, and cytochrome C respectively. Trypsinogen, ribonuclease A, and cytochrome c exhibited very linear response up 100 µL of sample loading while lentil lectin-1 showed linear response up to 50 µL of sample loading. The separation of these proteins maintained throughout the range of 20 µg to 1,000 µg total protein loading.
Table 1. A 30 min linear gradient method for the MAbPac SCX-10, 10 µm, 4 × 250 mm, cation exchange columns . Total run time is 40 min. The linear pH range covers from pH 5.6 to pH 10.2.
FIGURE 1. Chromatogram of a protein mixture separated using a 30-min linear pH gradient on a MAbPac SCX-10, 10 µm, 4 × 250 mm column. Protein names are labeled for each peak. The protein concentrations in the sample mixture were: lentil lectin, 3 mg/ml; trypsinogen, 2 mg/ml; ribonuclease A, 3 mg/ml; cytochrome C, 2 mg/ml. An increasing amount of samples were loaded onto the column using the following injection volumes: 2 µL, 4 µL, 8 µL, 16 µL, 32 µL, 50 µL, and 100 µL. The pH trace is colored in blue.
FIGURE 6. Fast MAb variant separation using pH gradient on a MAbPac SCX-10, 5 µm, 4 × 50 mm column. (a) 15-min gradient method; (b) 7.5-min gradient method. The MAb sample concentration was 5 mg/mL.
Preparation of Eluents
Eluent A and B each was prepared by simply diluting the corresponding 10 X CX-1 pH Gradient Buffer 10 fold using deionized water.
FIGURE 3. A graph plotting the measured pH values for six protein component peaks as a function of the corresponding pI value. The measured pH values of all six components were exported from the same experiment shown in Figure 1.
Gradients
The linear pH gradient was generated by running a linear gradient from 100% eluent A (pH 5.6) to 100% eluent B (pH 10.2). For pH gradient analysis carried out on the MAbPac SCX-10, 10 µm, 4 × 250 mm columns, the gradient method in Table 1 was used. For pH gradient analysis carried out on the MAbPac SCX-10, 5 µm, 4 × 50 mm columns, the gradient method in Table 2 or Table 3 was used. All methods cover the pH range from pH 5.6 to pH 10.2.
Table 3. A 7.5 min linear gradient method for MAbPac SCX-10, 5 µm, 4 × 50 mm, cation exchange columns. Total run time is 10 min. The linear pH range covers from pH 5.6 to pH 10.2.
Fast pH Gradient Separation
The pH gradient method is fast and rugged. Figure 6 showed pH gradient runs on a MAbPac SCX-10, 5 µm, 4 × 50 mm column. Using 1 mL/min flow rate, MAb variants separation can be achieved within 15 min with a total run time of 20 min (figure 6a). Using 2 mL/min flow rate, MAb variants separation can be achieved within 7.5 min with a total run time of 10 min (figure 6b). In both cases, the linearity of the pH gradient maintained.
Lectin-1Lectin-2
Lectin-3
Trypsinogen
Ribonuclease A
Cytochrome Cy = 1.6923x - 7.2914
R² = 0.9929
5.5
6
6.5
7
7.5
8
8.5
9
9.5
10
10.5
7.5 8.5 9.5 10.5
Mea
sure
d p
H v
alu
e
pI value
Measured pH value
Linear (Measured pH value)
© 2014 Thermo Fisher Scientific Inc. All rights reserved. Sigma is a registered trademark of Sigma-Aldrich Co. LLC. All other trademarks are the property of Thermo Fisher Scientific and its subsidiaries.
This information is not intended to encourage use of these products in any manners that might infringe the intellectual property rights of others.
0.0 1.0 2.0 3.0 4.0 5.0 6.0 7.0 8.0 9.0 10.0 -20
0
20
40
60
80
100
120
140
5.00
6.00
7.00
8.00
9.00
10.00
11.00
Abs
orba
nce
(mA
U)
Retention Time (min)
pH trace
(b)
0.0 2.0 4.0 6.0 8.0 10.0 12.0 14.0 16.0 18.0 20.0 -50
0
50
100
150
200
250
5.00
6.00
7.00
8.00
9.00
10.50
Abs
orba
nce
(mA
U)
Retention Time (min)
pH trace (a)
0
0.02
0.04
0.06
0.08
0.1
0.12
0.14
0.16
0.18
0.2
0
10
20
30
40
50
60
70
80
90
100
0 100 200 300 400
PW
HH
(min
)
Pea
k A
rea
Amount of Protein (µg)
Lentil Lectin-1
Area
PeakWidth
0
0.05
0.1
0.15
0.2
0.25
0.3
0.35
0.4
0.45
0.5
0
10
20
30
40
50
60
70
80
90
100
0 50 100 150 200 250
PW
HH
(min
)
Pea
k A
rea
Amount of Protein (µg)
Trypsinogen
Area
PeakWidth
0
0.05
0.1
0.15
0.2
0.25
0.3
0.35
0.4
0.45
0.5
0
5
10
15
20
25
30
35
40
45
50
0 100 200 300 400
PW
HH
(min
)
Pea
k A
rea
Amount of Protein (µg)
Ribonuclease A
Area
PeakWidth
0
0.05
0.1
0.15
0.2
0.25
0.3
0.35
0.4
0.45
0.5
0
20
40
60
80
100
120
140
160
180
200
0 50 100 150 200 250
PW
HH
(min
)
Pea
k A
rea
Amount of Protein (µg)
Cytochrome C
Area
PeakWidth
FIGURE 4. Chromatogram of six MAbs separated using a 30-min linear pH gradient on a MAbPac SCX-10, 10 µm, 4 × 250 mm column. The UV traces are corresponding to the MAbs with the following pI : 7.2 (black), 7.6 (blue), 7.8 (pink), 8.3 (brown), 9.0 (green), and 10.0 (purple). The pH trace is colored in blue.
Linear correlation of elution pH versus protein pI value
An analysis was performed to show that there is a correlation between the elution pH versus the corresponding pI values of the protein components. Figure 3 is a graph comparing the measured pH values for six protein component peaks in Figure 1 as a function of the corresponding pI values. The measured pH values for the six protein component peaks exhibited a strong linear correlation to the literature based pI values, with R2 value at 0.9929. Since MAb molecules within the IgG1 class share most of the protein sequence, we expect to see a more linear correlation of the MAb elution pH versus their pI. Figure 4 showed pH gradient separation of charge variants from six MAbs with pI values ranging from 7 to 10. Figure 5 is a plot of the elution pH of each MAb major variant versus the MAb pI value. The linear fit yielded a R2 value at 0.9988. Thus, after a calibration procedure, this example supports the fact that linear regression coupled with the gradient method described here can be used to estimate the pI of a MAb based on the peak retention time and elution pH.
FIGURE 5. A graph plotting the elution pH values for six MAbs as a function of the corresponding pI value. The measured pH values of the major variant from all six MAbs were exported from the same experiment shown in Figure 4.
y = 1.1083x - 1.637R² = 0.9988
6
6.5
7
7.5
8
8.5
9
9.5
10
6.5 7.5 8.5 9.5 10.5
MA
b E
luti
on
pH
va
lue
MAb pI value
MAb Elution pH value
Linear (MAb Elution pH value)
2 4 6 8 10 12 14 16 18 20 22 24 26 28 30 32 34 36 38-50
100
200
300
400
500
600
5.00
5.50
6.00
6.50
7.00
7.50
8.00
8.50
9.00
9.50
10.00
10.50
Abs
orba
nce
(mA
U)
Retention Time (min)
pH traceLentil lectin-1
Lentil lectin-2
Lentil lectin-3Trypsinogen
Ribonuclease A
Cytochrome C
0.0 5.0 10.0 15.0 20.0 25.0 30.0 35.0 40.0-20
0
20
40
60
80
100
120
140
160
180
200
5.00
5.50
6.00
6.50
7.00
7.50
8.00
8.50
9.00
9.50
10.00
10.50
pH trace
Ab
sorb
an
ce (m
AU
)
Retention Time (min)
FIGURE 2. Plots of peak area and PWHH versus sample loading. Peak area is plotted on the primary Y-axis and the PWHH is plotted on the secondary Y-axis. (a) lentil lectin; (b) trypsinogen ; (c) ribonuclease A; (d) cytochrome C.
(d)
(b)
(c)
(a)
Table 2. A 15 min linear gradient method for MAbPac SCX-10, 5 µm, 4 × 50 mm, cation exchange columns. Total run time is 20 min. The linear pH range covers from pH 5.6 to pH 10.2.
Time (minutes) Flow rate (mL/min) %A %B
0–8.5 2 100 0
0.5–8 2 100–0 0–100
8–8.5 2 0 100
8.5–10 2 100 0
Time (minutes) Flow rate (mL/min) %A %B
0–1 1 100 0
1–16 1 100–0 0 –100
16–17 1 0 100
17–20 1 100 0
Time (minutes) Flow rate (mL/min) %A %B
0–1 1 100 0
1–31 1 100–0 0–100
31–34 1 0 100
34–40 1 100 0
PO20911_E 01/14S
5Thermo Scientific Poster Note • PN20911_WCBP2014_E_02/14S
A Fast and Robust Linear pH Gradient Separation Platform for Monoclonal Antibody (MAb) Charge Variant Analysis Shanhua Lin,1 Julia Baek,1 and Chris Pohl1 1Thermo Fisher Scientific, Sunnyvale, CA, USA
Conclusions
Using pH gradient method, linear signal response is achieved with up to 300 µg protein loading;
Using pH gradient method, the elution pH values of MAbs are in linear relationship with their corresponding pI values;
Using pH gradient method, fast separation of MAb charge variants is achieved within a 10-min cycle time.
References 1. Lin, S., Baek, J., Decrop, W., Rao, S., Agroskin, Y., and Pohl, C.
Development of a Cation-Exchange pH Gradient Separation Platform. Presented at 39th International Symposium on High Performance Liquid Phase Separations and Related Techniques, Amsterdam, The Netherlands, June 16-20, 2013.
Overview Purpose: Evaluate the loading capacity, elution pH, and the throughput using linear pH gradient separation method for MAb variant analysis.
Methods: A linear pH gradient from pH 5.6 to pH 10.2 is generated over time by running a linear pump gradient from 100% Thermo Scientific™ CX-1 pH Gradient Buffer A (pH 5.6) to 100% CX-1 pH Gradient Buffer B (pH 10.2) . Online monitoring of the mobile phase pH value confirmed that a linear pH gradient was achieved.
Results: 1. Linear UV response with up to 300 µg of protein loading; 2. The elution pH values of MAbs are in linear relationship with their corresponding pI values; 3. a fast separation of MAb charge variants is achieved in a 10-min cycle time.
Introduction Recombinant monoclonal antibodies (MAbs) can be highly heterogeneous due to modifications such as sialylation, deamidation and C-terminal lysine truncation. Salt gradient cation exchange chromatography has been used with some success in characterizing MAb charge variants. However, additional effort is often required to tailor the salt gradient method for an individual MAb. In the fast-pace drug development environment, a fast and robust platform method is desired to accommodate the majority of the MAb analyses.
We recently introduced a cation-exchange pH gradient buffer system which meets the fast and robust platform method requirement (ref. 1) This buffer system consists of a low-pH buffer A at pH 5.6 and a high-pH buffer B at pH 10.2. A linear pH gradient from pH 5.6 to pH 10.2 is generated over time by running a linear pump gradient from 100% buffer A to 100% buffer B. Using various MAbs with pI values ranging from 7 to 10, we demonstrated that the linear pH gradient method separates charge variants consistently. The loading capacity on a Thermo Scientific™ MAbPac™ SCX-10 column when running pH gradient is investigated by injecting increasing amount of protein standards. The study shows that there is a linear signal response up to 300 µg of protein loading. Furthermore, a fast separation of charge variants is achieved in a 10-min cycle time using 2 mL/min flow rate on a MAbPac SCX-10, 5 µm, 4 × 50 mm column.
Methods Sample Preparation:
All standard proteins were purchased from Sigma-Aldrich®. Monoclonal antibodies was a gift from a local biotech company. Proteins and MAb were dissolved in deionized water.
Columns and Buffers
MAbPac SCX-10, 10 µm, 4 × 250 mm (P/N 074625)
MAbPac SCX-10, 5 µm, 4 × 50 mm (P/N 078656)
CX-1 pH Gradient Buffer A (pH 5.6), 125 mL (P/N 083273)
CX-1 pH Gradient Buffer B (pH 10.2), 125 mL (P/N 083275)
Liquid Chromatography
HPLC experiments were carried out using an Thermo Scientific™ Dionex™ UltiMate™ 3000 BioRS System equipped with:
SRD-3600 Membrane Degasser
DGP-3600RS Biocompatible Rapid Separation Pump
TCC-3000SD Thermostated Column Compartment with two biocompatible 10-port valves
WPS-3000TBRS Biocompatible Rapid Separation Thermostated Autosampler
VWD-3400RS UV Detector equipped with a Micro Flow Cell
PCM-3000 pH and Conductivity Monitor
Results
The linear pH gradient was achieved by employing a multi-component buffer system containing multiple zwitterionic buffer species with pI values ranging from 6 to 10. Eluent A was titrated to pH 5.6 and eluent B was titrated to pH 10.2. In this pH range, each buffer species was either neutral or negatively charged. Therefore they were not retained by cation exchange column stationary phase and served as good buffers for the mobile phase and the stationary phase.
The separation of proteins with different pI values by pH gradient was demonstrated in Figure 1. The protein mixture contained lentil lectin with three isoforms of lectin-1 (pI 7.8), lectin-2 (pI 8.0), lectin-3 (pI 8.2), trypsinogen (pI 8.7), ribonuclease A (pI 9.3), and cytochrome C (pI 10.2). The concentration of these proteins were 3 mg/mL, 2 mg/mL, 3 mg/mL and 2 mg/mL respectively. Figure 1 showed the multiple UV traces of chromagrams recorded from a series injections of the protein mixture at 2 µL, 4 µL, 8 µL, 16 µL, 32 µL, 50 µL, and 100 µL. The peak area and peak width at half height (PWHH) were plotted against the sample loading in Figure 2a, 2b, 2c and 2d for lentil lectin-1, trypsinogen, ribonuclease A, and cytochrome C respectively. Trypsinogen, ribonuclease A, and cytochrome c exhibited very linear response up 100 µL of sample loading while lentil lectin-1 showed linear response up to 50 µL of sample loading. The separation of these proteins maintained throughout the range of 20 µg to 1,000 µg total protein loading.
Table 1. A 30 min linear gradient method for the MAbPac SCX-10, 10 µm, 4 × 250 mm, cation exchange columns . Total run time is 40 min. The linear pH range covers from pH 5.6 to pH 10.2.
FIGURE 1. Chromatogram of a protein mixture separated using a 30-min linear pH gradient on a MAbPac SCX-10, 10 µm, 4 × 250 mm column. Protein names are labeled for each peak. The protein concentrations in the sample mixture were: lentil lectin, 3 mg/ml; trypsinogen, 2 mg/ml; ribonuclease A, 3 mg/ml; cytochrome C, 2 mg/ml. An increasing amount of samples were loaded onto the column using the following injection volumes: 2 µL, 4 µL, 8 µL, 16 µL, 32 µL, 50 µL, and 100 µL. The pH trace is colored in blue.
FIGURE 6. Fast MAb variant separation using pH gradient on a MAbPac SCX-10, 5 µm, 4 × 50 mm column. (a) 15-min gradient method; (b) 7.5-min gradient method. The MAb sample concentration was 5 mg/mL.
Preparation of Eluents
Eluent A and B each was prepared by simply diluting the corresponding 10 X CX-1 pH Gradient Buffer 10 fold using deionized water.
FIGURE 3. A graph plotting the measured pH values for six protein component peaks as a function of the corresponding pI value. The measured pH values of all six components were exported from the same experiment shown in Figure 1.
Gradients
The linear pH gradient was generated by running a linear gradient from 100% eluent A (pH 5.6) to 100% eluent B (pH 10.2). For pH gradient analysis carried out on the MAbPac SCX-10, 10 µm, 4 × 250 mm columns, the gradient method in Table 1 was used. For pH gradient analysis carried out on the MAbPac SCX-10, 5 µm, 4 × 50 mm columns, the gradient method in Table 2 or Table 3 was used. All methods cover the pH range from pH 5.6 to pH 10.2.
Table 3. A 7.5 min linear gradient method for MAbPac SCX-10, 5 µm, 4 × 50 mm, cation exchange columns. Total run time is 10 min. The linear pH range covers from pH 5.6 to pH 10.2.
Fast pH Gradient Separation
The pH gradient method is fast and rugged. Figure 6 showed pH gradient runs on a MAbPac SCX-10, 5 µm, 4 × 50 mm column. Using 1 mL/min flow rate, MAb variants separation can be achieved within 15 min with a total run time of 20 min (figure 6a). Using 2 mL/min flow rate, MAb variants separation can be achieved within 7.5 min with a total run time of 10 min (figure 6b). In both cases, the linearity of the pH gradient maintained.
Lectin-1Lectin-2
Lectin-3
Trypsinogen
Ribonuclease A
Cytochrome Cy = 1.6923x - 7.2914
R² = 0.9929
5.5
6
6.5
7
7.5
8
8.5
9
9.5
10
10.5
7.5 8.5 9.5 10.5
Mea
sure
d p
H v
alu
e
pI value
Measured pH value
Linear (Measured pH value)
© 2014 Thermo Fisher Scientific Inc. All rights reserved. Sigma is a registered trademark of Sigma-Aldrich Co. LLC. All other trademarks are the property of Thermo Fisher Scientific and its subsidiaries.
This information is not intended to encourage use of these products in any manners that might infringe the intellectual property rights of others.
0.0 1.0 2.0 3.0 4.0 5.0 6.0 7.0 8.0 9.0 10.0 -20
0
20
40
60
80
100
120
140
5.00
6.00
7.00
8.00
9.00
10.00
11.00
Abs
orba
nce
(mA
U)
Retention Time (min)
pH trace
(b)
0.0 2.0 4.0 6.0 8.0 10.0 12.0 14.0 16.0 18.0 20.0 -50
0
50
100
150
200
250
5.00
6.00
7.00
8.00
9.00
10.50
Abs
orba
nce
(mA
U)
Retention Time (min)
pH trace (a)
0
0.02
0.04
0.06
0.08
0.1
0.12
0.14
0.16
0.18
0.2
0
10
20
30
40
50
60
70
80
90
100
0 100 200 300 400
PW
HH
(min
)
Pea
k A
rea
Amount of Protein (µg)
Lentil Lectin-1
Area
PeakWidth
0
0.05
0.1
0.15
0.2
0.25
0.3
0.35
0.4
0.45
0.5
0
10
20
30
40
50
60
70
80
90
100
0 50 100 150 200 250
PW
HH
(min
)
Pea
k A
rea
Amount of Protein (µg)
Trypsinogen
Area
PeakWidth
0
0.05
0.1
0.15
0.2
0.25
0.3
0.35
0.4
0.45
0.5
0
5
10
15
20
25
30
35
40
45
50
0 100 200 300 400
PW
HH
(min
)
Pea
k A
rea
Amount of Protein (µg)
Ribonuclease A
Area
PeakWidth
0
0.05
0.1
0.15
0.2
0.25
0.3
0.35
0.4
0.45
0.5
0
20
40
60
80
100
120
140
160
180
200
0 50 100 150 200 250
PW
HH
(min
)
Pea
k A
rea
Amount of Protein (µg)
Cytochrome C
Area
PeakWidth
FIGURE 4. Chromatogram of six MAbs separated using a 30-min linear pH gradient on a MAbPac SCX-10, 10 µm, 4 × 250 mm column. The UV traces are corresponding to the MAbs with the following pI : 7.2 (black), 7.6 (blue), 7.8 (pink), 8.3 (brown), 9.0 (green), and 10.0 (purple). The pH trace is colored in blue.
Linear correlation of elution pH versus protein pI value
An analysis was performed to show that there is a correlation between the elution pH versus the corresponding pI values of the protein components. Figure 3 is a graph comparing the measured pH values for six protein component peaks in Figure 1 as a function of the corresponding pI values. The measured pH values for the six protein component peaks exhibited a strong linear correlation to the literature based pI values, with R2 value at 0.9929. Since MAb molecules within the IgG1 class share most of the protein sequence, we expect to see a more linear correlation of the MAb elution pH versus their pI. Figure 4 showed pH gradient separation of charge variants from six MAbs with pI values ranging from 7 to 10. Figure 5 is a plot of the elution pH of each MAb major variant versus the MAb pI value. The linear fit yielded a R2 value at 0.9988. Thus, after a calibration procedure, this example supports the fact that linear regression coupled with the gradient method described here can be used to estimate the pI of a MAb based on the peak retention time and elution pH.
FIGURE 5. A graph plotting the elution pH values for six MAbs as a function of the corresponding pI value. The measured pH values of the major variant from all six MAbs were exported from the same experiment shown in Figure 4.
y = 1.1083x - 1.637R² = 0.9988
6
6.5
7
7.5
8
8.5
9
9.5
10
6.5 7.5 8.5 9.5 10.5
MA
b E
luti
on
pH
va
lue
MAb pI value
MAb Elution pH value
Linear (MAb Elution pH value)
2 4 6 8 10 12 14 16 18 20 22 24 26 28 30 32 34 36 38-50
100
200
300
400
500
600
5.00
5.50
6.00
6.50
7.00
7.50
8.00
8.50
9.00
9.50
10.00
10.50
Abs
orba
nce
(mA
U)
Retention Time (min)
pH traceLentil lectin-1
Lentil lectin-2
Lentil lectin-3Trypsinogen
Ribonuclease A
Cytochrome C
0.0 5.0 10.0 15.0 20.0 25.0 30.0 35.0 40.0-20
0
20
40
60
80
100
120
140
160
180
200
5.00
5.50
6.00
6.50
7.00
7.50
8.00
8.50
9.00
9.50
10.00
10.50
pH trace
Ab
sorb
an
ce (m
AU
)
Retention Time (min)
FIGURE 2. Plots of peak area and PWHH versus sample loading. Peak area is plotted on the primary Y-axis and the PWHH is plotted on the secondary Y-axis. (a) lentil lectin; (b) trypsinogen ; (c) ribonuclease A; (d) cytochrome C.
(d)
(b)
(c)
(a)
Table 2. A 15 min linear gradient method for MAbPac SCX-10, 5 µm, 4 × 50 mm, cation exchange columns. Total run time is 20 min. The linear pH range covers from pH 5.6 to pH 10.2.
Time (minutes) Flow rate (mL/min) %A %B
0–8.5 2 100 0
0.5–8 2 100–0 0–100
8–8.5 2 0 100
8.5–10 2 100 0
Time (minutes) Flow rate (mL/min) %A %B
0–1 1 100 0
1–16 1 100–0 0 –100
16–17 1 0 100
17–20 1 100 0
Time (minutes) Flow rate (mL/min) %A %B
0–1 1 100 0
1–31 1 100–0 0–100
31–34 1 0 100
34–40 1 100 0
PO20911_E 01/14S

6 A Fast and Robust Linear pH Gradient Separation Platform for Monoclonal Antibody (MAb) Charge Variant Analysis
A Fast and Robust Linear pH Gradient Separation Platform for Monoclonal Antibody (MAb) Charge Variant Analysis Shanhua Lin,1 Julia Baek,1 and Chris Pohl1 1Thermo Fisher Scientific, Sunnyvale, CA, USA
Conclusions
Using pH gradient method, linear signal response is achieved with up to 300 µg protein loading;
Using pH gradient method, the elution pH values of MAbs are in linear relationship with their corresponding pI values;
Using pH gradient method, fast separation of MAb charge variants is achieved within a 10-min cycle time.
References 1. Lin, S., Baek, J., Decrop, W., Rao, S., Agroskin, Y., and Pohl, C.
Development of a Cation-Exchange pH Gradient Separation Platform. Presented at 39th International Symposium on High Performance Liquid Phase Separations and Related Techniques, Amsterdam, The Netherlands, June 16-20, 2013.
Overview Purpose: Evaluate the loading capacity, elution pH, and the throughput using linear pH gradient separation method for MAb variant analysis.
Methods: A linear pH gradient from pH 5.6 to pH 10.2 is generated over time by running a linear pump gradient from 100% Thermo Scientific™ CX-1 pH Gradient Buffer A (pH 5.6) to 100% CX-1 pH Gradient Buffer B (pH 10.2) . Online monitoring of the mobile phase pH value confirmed that a linear pH gradient was achieved.
Results: 1. Linear UV response with up to 300 µg of protein loading; 2. The elution pH values of MAbs are in linear relationship with their corresponding pI values; 3. a fast separation of MAb charge variants is achieved in a 10-min cycle time.
Introduction Recombinant monoclonal antibodies (MAbs) can be highly heterogeneous due to modifications such as sialylation, deamidation and C-terminal lysine truncation. Salt gradient cation exchange chromatography has been used with some success in characterizing MAb charge variants. However, additional effort is often required to tailor the salt gradient method for an individual MAb. In the fast-pace drug development environment, a fast and robust platform method is desired to accommodate the majority of the MAb analyses.
We recently introduced a cation-exchange pH gradient buffer system which meets the fast and robust platform method requirement (ref. 1) This buffer system consists of a low-pH buffer A at pH 5.6 and a high-pH buffer B at pH 10.2. A linear pH gradient from pH 5.6 to pH 10.2 is generated over time by running a linear pump gradient from 100% buffer A to 100% buffer B. Using various MAbs with pI values ranging from 7 to 10, we demonstrated that the linear pH gradient method separates charge variants consistently. The loading capacity on a Thermo Scientific™ MAbPac™ SCX-10 column when running pH gradient is investigated by injecting increasing amount of protein standards. The study shows that there is a linear signal response up to 300 µg of protein loading. Furthermore, a fast separation of charge variants is achieved in a 10-min cycle time using 2 mL/min flow rate on a MAbPac SCX-10, 5 µm, 4 × 50 mm column.
Methods Sample Preparation:
All standard proteins were purchased from Sigma-Aldrich®. Monoclonal antibodies was a gift from a local biotech company. Proteins and MAb were dissolved in deionized water.
Columns and Buffers
MAbPac SCX-10, 10 µm, 4 × 250 mm (P/N 074625)
MAbPac SCX-10, 5 µm, 4 × 50 mm (P/N 078656)
CX-1 pH Gradient Buffer A (pH 5.6), 125 mL (P/N 083273)
CX-1 pH Gradient Buffer B (pH 10.2), 125 mL (P/N 083275)
Liquid Chromatography
HPLC experiments were carried out using an Thermo Scientific™ Dionex™ UltiMate™ 3000 BioRS System equipped with:
SRD-3600 Membrane Degasser
DGP-3600RS Biocompatible Rapid Separation Pump
TCC-3000SD Thermostated Column Compartment with two biocompatible 10-port valves
WPS-3000TBRS Biocompatible Rapid Separation Thermostated Autosampler
VWD-3400RS UV Detector equipped with a Micro Flow Cell
PCM-3000 pH and Conductivity Monitor
Results
The linear pH gradient was achieved by employing a multi-component buffer system containing multiple zwitterionic buffer species with pI values ranging from 6 to 10. Eluent A was titrated to pH 5.6 and eluent B was titrated to pH 10.2. In this pH range, each buffer species was either neutral or negatively charged. Therefore they were not retained by cation exchange column stationary phase and served as good buffers for the mobile phase and the stationary phase.
The separation of proteins with different pI values by pH gradient was demonstrated in Figure 1. The protein mixture contained lentil lectin with three isoforms of lectin-1 (pI 7.8), lectin-2 (pI 8.0), lectin-3 (pI 8.2), trypsinogen (pI 8.7), ribonuclease A (pI 9.3), and cytochrome C (pI 10.2). The concentration of these proteins were 3 mg/mL, 2 mg/mL, 3 mg/mL and 2 mg/mL respectively. Figure 1 showed the multiple UV traces of chromagrams recorded from a series injections of the protein mixture at 2 µL, 4 µL, 8 µL, 16 µL, 32 µL, 50 µL, and 100 µL. The peak area and peak width at half height (PWHH) were plotted against the sample loading in Figure 2a, 2b, 2c and 2d for lentil lectin-1, trypsinogen, ribonuclease A, and cytochrome C respectively. Trypsinogen, ribonuclease A, and cytochrome c exhibited very linear response up 100 µL of sample loading while lentil lectin-1 showed linear response up to 50 µL of sample loading. The separation of these proteins maintained throughout the range of 20 µg to 1,000 µg total protein loading.
Table 1. A 30 min linear gradient method for the MAbPac SCX-10, 10 µm, 4 × 250 mm, cation exchange columns . Total run time is 40 min. The linear pH range covers from pH 5.6 to pH 10.2.
FIGURE 1. Chromatogram of a protein mixture separated using a 30-min linear pH gradient on a MAbPac SCX-10, 10 µm, 4 × 250 mm column. Protein names are labeled for each peak. The protein concentrations in the sample mixture were: lentil lectin, 3 mg/ml; trypsinogen, 2 mg/ml; ribonuclease A, 3 mg/ml; cytochrome C, 2 mg/ml. An increasing amount of samples were loaded onto the column using the following injection volumes: 2 µL, 4 µL, 8 µL, 16 µL, 32 µL, 50 µL, and 100 µL. The pH trace is colored in blue.
FIGURE 6. Fast MAb variant separation using pH gradient on a MAbPac SCX-10, 5 µm, 4 × 50 mm column. (a) 15-min gradient method; (b) 7.5-min gradient method. The MAb sample concentration was 5 mg/mL.
Preparation of Eluents
Eluent A and B each was prepared by simply diluting the corresponding 10 X CX-1 pH Gradient Buffer 10 fold using deionized water.
FIGURE 3. A graph plotting the measured pH values for six protein component peaks as a function of the corresponding pI value. The measured pH values of all six components were exported from the same experiment shown in Figure 1.
Gradients
The linear pH gradient was generated by running a linear gradient from 100% eluent A (pH 5.6) to 100% eluent B (pH 10.2). For pH gradient analysis carried out on the MAbPac SCX-10, 10 µm, 4 × 250 mm columns, the gradient method in Table 1 was used. For pH gradient analysis carried out on the MAbPac SCX-10, 5 µm, 4 × 50 mm columns, the gradient method in Table 2 or Table 3 was used. All methods cover the pH range from pH 5.6 to pH 10.2.
Table 3. A 7.5 min linear gradient method for MAbPac SCX-10, 5 µm, 4 × 50 mm, cation exchange columns. Total run time is 10 min. The linear pH range covers from pH 5.6 to pH 10.2.
Fast pH Gradient Separation
The pH gradient method is fast and rugged. Figure 6 showed pH gradient runs on a MAbPac SCX-10, 5 µm, 4 × 50 mm column. Using 1 mL/min flow rate, MAb variants separation can be achieved within 15 min with a total run time of 20 min (figure 6a). Using 2 mL/min flow rate, MAb variants separation can be achieved within 7.5 min with a total run time of 10 min (figure 6b). In both cases, the linearity of the pH gradient maintained.
Lectin-1Lectin-2
Lectin-3
Trypsinogen
Ribonuclease A
Cytochrome Cy = 1.6923x - 7.2914
R² = 0.9929
5.5
6
6.5
7
7.5
8
8.5
9
9.5
10
10.5
7.5 8.5 9.5 10.5
Mea
sure
d p
H v
alu
e
pI value
Measured pH value
Linear (Measured pH value)
© 2014 Thermo Fisher Scientific Inc. All rights reserved. Sigma is a registered trademark of Sigma-Aldrich Co. LLC. All other trademarks are the property of Thermo Fisher Scientific and its subsidiaries.
This information is not intended to encourage use of these products in any manners that might infringe the intellectual property rights of others.
0.0 1.0 2.0 3.0 4.0 5.0 6.0 7.0 8.0 9.0 10.0 -20
0
20
40
60
80
100
120
140
5.00
6.00
7.00
8.00
9.00
10.00
11.00
Abs
orba
nce
(mA
U)
Retention Time (min)
pH trace
(b)
0.0 2.0 4.0 6.0 8.0 10.0 12.0 14.0 16.0 18.0 20.0 -50
0
50
100
150
200
250
5.00
6.00
7.00
8.00
9.00
10.50 A
bsor
banc
e (m
AU
)
Retention Time (min)
pH trace (a)
0
0.02
0.04
0.06
0.08
0.1
0.12
0.14
0.16
0.18
0.2
0
10
20
30
40
50
60
70
80
90
100
0 100 200 300 400
PW
HH
(min
)
Pea
k A
rea
Amount of Protein (µg)
Lentil Lectin-1
Area
PeakWidth
0
0.05
0.1
0.15
0.2
0.25
0.3
0.35
0.4
0.45
0.5
0
10
20
30
40
50
60
70
80
90
100
0 50 100 150 200 250
PW
HH
(min
)
Pea
k A
rea
Amount of Protein (µg)
Trypsinogen
Area
PeakWidth
0
0.05
0.1
0.15
0.2
0.25
0.3
0.35
0.4
0.45
0.5
0
5
10
15
20
25
30
35
40
45
50
0 100 200 300 400
PW
HH
(min
)
Pea
k A
rea
Amount of Protein (µg)
Ribonuclease A
Area
PeakWidth
0
0.05
0.1
0.15
0.2
0.25
0.3
0.35
0.4
0.45
0.5
0
20
40
60
80
100
120
140
160
180
200
0 50 100 150 200 250
PW
HH
(min
)
Pea
k A
rea
Amount of Protein (µg)
Cytochrome C
Area
PeakWidth
FIGURE 4. Chromatogram of six MAbs separated using a 30-min linear pH gradient on a MAbPac SCX-10, 10 µm, 4 × 250 mm column. The UV traces are corresponding to the MAbs with the following pI : 7.2 (black), 7.6 (blue), 7.8 (pink), 8.3 (brown), 9.0 (green), and 10.0 (purple). The pH trace is colored in blue.
Linear correlation of elution pH versus protein pI value
An analysis was performed to show that there is a correlation between the elution pH versus the corresponding pI values of the protein components. Figure 3 is a graph comparing the measured pH values for six protein component peaks in Figure 1 as a function of the corresponding pI values. The measured pH values for the six protein component peaks exhibited a strong linear correlation to the literature based pI values, with R2 value at 0.9929. Since MAb molecules within the IgG1 class share most of the protein sequence, we expect to see a more linear correlation of the MAb elution pH versus their pI. Figure 4 showed pH gradient separation of charge variants from six MAbs with pI values ranging from 7 to 10. Figure 5 is a plot of the elution pH of each MAb major variant versus the MAb pI value. The linear fit yielded a R2 value at 0.9988. Thus, after a calibration procedure, this example supports the fact that linear regression coupled with the gradient method described here can be used to estimate the pI of a MAb based on the peak retention time and elution pH.
FIGURE 5. A graph plotting the elution pH values for six MAbs as a function of the corresponding pI value. The measured pH values of the major variant from all six MAbs were exported from the same experiment shown in Figure 4.
y = 1.1083x - 1.637R² = 0.9988
6
6.5
7
7.5
8
8.5
9
9.5
10
6.5 7.5 8.5 9.5 10.5
MA
b E
luti
on
pH
va
lue
MAb pI value
MAb Elution pH value
Linear (MAb Elution pH value)
2 4 6 8 10 12 14 16 18 20 22 24 26 28 30 32 34 36 38-50
100
200
300
400
500
600
5.00
5.50
6.00
6.50
7.00
7.50
8.00
8.50
9.00
9.50
10.00
10.50
Abs
orba
nce
(mA
U)
Retention Time (min)
pH traceLentil lectin-1
Lentil lectin-2
Lentil lectin-3Trypsinogen
Ribonuclease A
Cytochrome C
0.0 5.0 10.0 15.0 20.0 25.0 30.0 35.0 40.0-20
0
20
40
60
80
100
120
140
160
180
200
5.00
5.50
6.00
6.50
7.00
7.50
8.00
8.50
9.00
9.50
10.00
10.50
pH trace
Ab
sorb
an
ce (m
AU
)
Retention Time (min)
FIGURE 2. Plots of peak area and PWHH versus sample loading. Peak area is plotted on the primary Y-axis and the PWHH is plotted on the secondary Y-axis. (a) lentil lectin; (b) trypsinogen ; (c) ribonuclease A; (d) cytochrome C.
(d)
(b)
(c)
(a)
Table 2. A 15 min linear gradient method for MAbPac SCX-10, 5 µm, 4 × 50 mm, cation exchange columns. Total run time is 20 min. The linear pH range covers from pH 5.6 to pH 10.2.
Time (minutes) Flow rate (mL/min) %A %B
0–8.5 2 100 0
0.5–8 2 100–0 0–100
8–8.5 2 0 100
8.5–10 2 100 0
Time (minutes) Flow rate (mL/min) %A %B
0–1 1 100 0
1–16 1 100–0 0 –100
16–17 1 0 100
17–20 1 100 0
Time (minutes) Flow rate (mL/min) %A %B
0–1 1 100 0
1–31 1 100–0 0–100
31–34 1 0 100
34–40 1 100 0
PO20911_E 01/14S

www.thermofisher.com©2016 Thermo Fisher Scientific Inc. All rights reserved. Sigma is a registered trademark of Sigma-Aldrich Co. LLC. All other trademarks are the property of Thermo Fisher Scientific Inc. and its subsidiaries. This information is presented as an example of the capabilities of Thermo Fisher Scientific Inc. products. It is not intended to encourage use of these products in any manners that might infringe the intellectual property rights of others. Specifications, terms and pricing are subject to change. Not all products are available in all countries. Please consult your local sales representative for details.
PN20911_E 07/16S
Africa +43 1 333 50 34 0Australia +61 3 9757 4300Austria +43 810 282 206Belgium +32 53 73 42 41Brazil +55 11 3731 5140Canada +1 800 530 8447China 800 810 5118 (free call domestic)
400 650 5118
Denmark +45 70 23 62 60Europe-Other +43 1 333 50 34 0Finland +358 9 3291 0200France +33 1 60 92 48 00Germany +49 6103 408 1014India +91 22 6742 9494Italy +39 02 950 591
Japan +81 6 6885 1213Korea +82 2 3420 8600Latin America +1 561 688 8700Middle East +43 1 333 50 34 0Netherlands +31 76 579 55 55 New Zealand +64 9 980 6700 Norway +46 8 556 468 00
Russia/CIS +43 1 333 50 34 0Singapore +65 6289 1190Sweden +46 8 556 468 00 Switzerland +41 61 716 77 00Taiwan +886 2 8751 6655UK/Ireland +44 1442 233555USA +1 800 532 4752