> april 2017 the fisheries and aquaculture sector in … pêche... · > april 2017...
TRANSCRIPT
Key figures FranceAgriMer> april 2017
>>> Fisheries and aquaculture
The fisheries and aquaculture sector in France
ProductionFirmsTradeConsumption

2/ The fisheries and aquaculture sector in France > Édition 2017 © FranceAgriMer 2017 /
SUMMARYProduction page 3
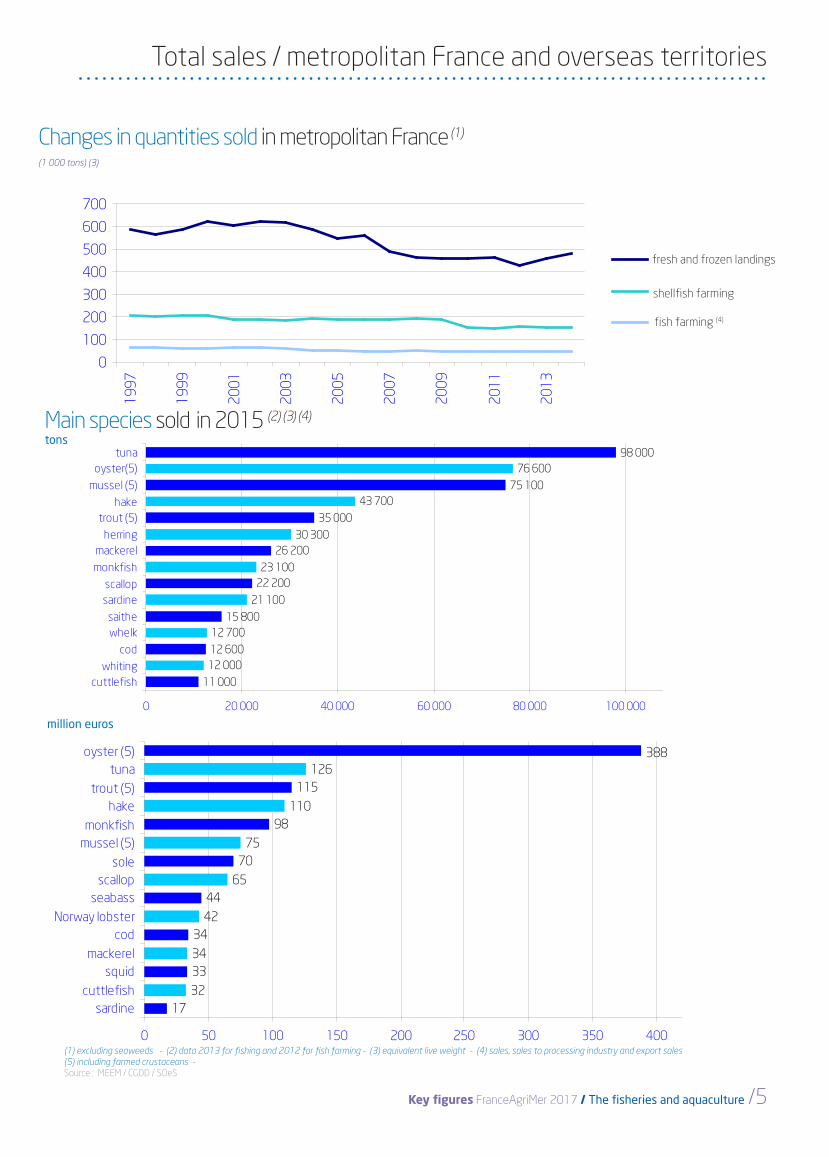
Total sales of fisheries and aquaculture products
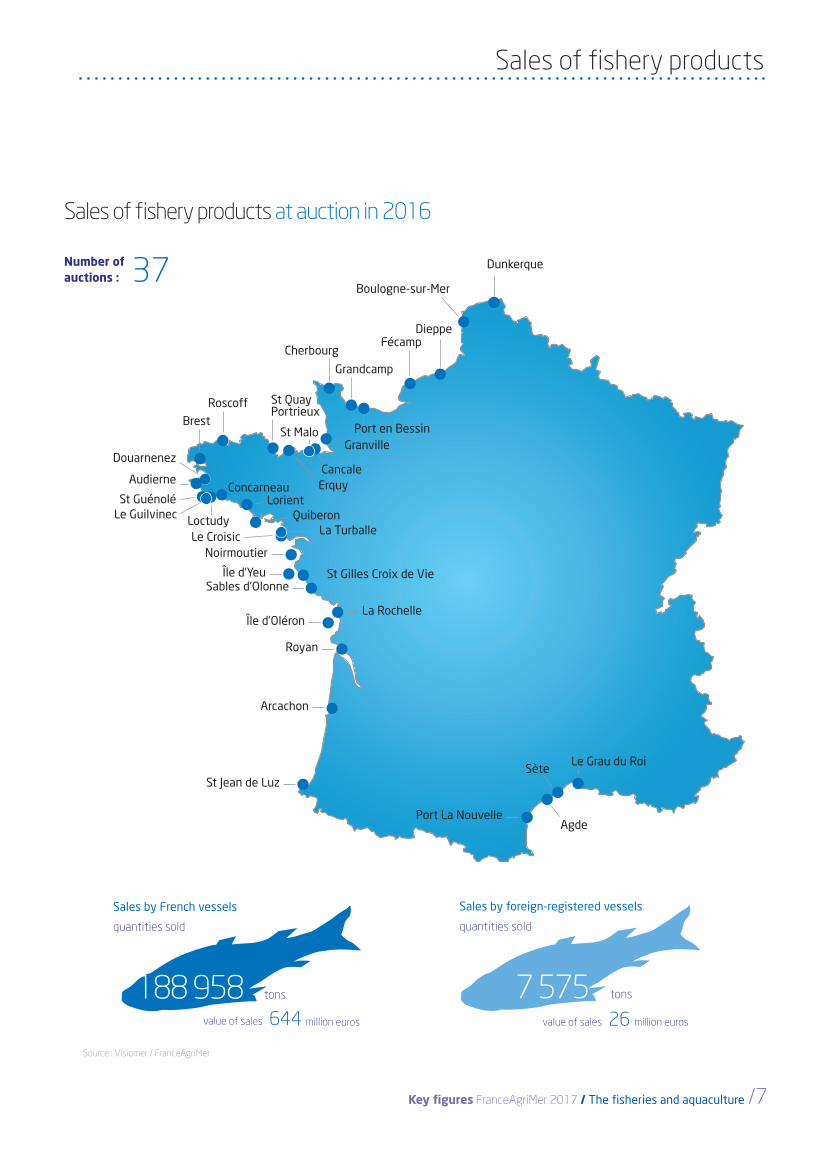
Sales of fisheries products at auction
Sales of aquaculture products
Fishing fleet
Aquaculture firms
Jobs
Firms page 15
Fishmonger firms
Trading firms
Processing firms
Trade page 19
Supply balance
Imports and exports by main species
Imports and exports by presentation
Imports and exports by species group
Imports and exports by geographical area
Consumption page 25
Supply balance
Households purchases
Catering purchases
Breakdown of purchases by distribution channel

/3
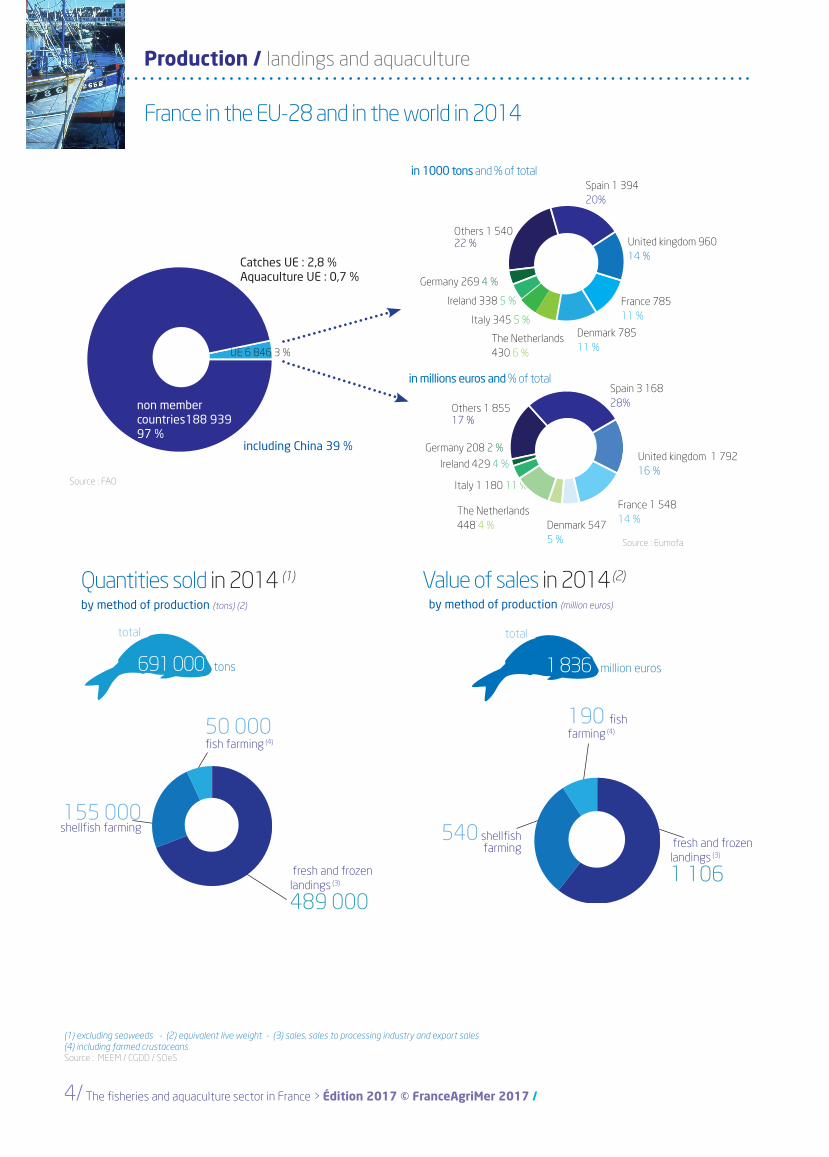
Productionfishing fleet / aquaculture firms / jobs total sales of fisheries and aquaculture products
4/ The fisheries and aquaculture sector in France > Édition 2017 © FranceAgriMer 2017 /
by method of production (tons) (2) by method of production (million euros)
Quantities sold in 2014 (1) Value of sales in 2014 (2)
total
1 836 million euros
total
691 000 tons
50 000fish farming (4)
155 000 shellfish farming
fresh and frozen landings (3)
489 000
190 fish farming (4)
fresh and frozen landings (3)
1 106
540 shellfish farming
(1) excluding seaweeds - (2) equivalent live weight - (3) sales, sales to processing industry and export sales(4) including farmed crustaceans Source : MEEM / CGDD / SOeS
France in the EU-28 and in the world in 2014
1732333434
4244
6570
7598
110115
126388
0 50 100 150 200 250 300 350 400 450
sardinecuttlefish
squidmackerel
codNorway lobster
seabassscallop
solemussel (5)monkfish
haketrout (5)
tunaoyster (5)
Production / landings and aquaculture Total sales / metropolitan France and overseas territories
Pays-tiers : 171 980 Pays-tiers : 171 980 96 %
Captures : 5,4 %Aquaculture : 1,5 %
Pays-tiers : 171 980
Catches UE : 2,8 %Aquaculture UE : 0,7 %
UE 6 846 3 %
including China 39 %
Source : FAO
Spain 1 394 20%
United kingdom 96014 %
Denmark 78511 %
France 78511 %
Others 1 54022 %
The Netherlands 430 6 %
Italy 345 5 %
Ireland 338 5 %
Germany 269 4 %
Spain 3 16828%Others 1 855
17 %
The Netherlands 448 4 %
Italy 1 180 11 %
Ireland 429 4 %
Germany 208 2 %
France 1 54814 %Denmark 547
5 %
United kingdom 1 79216 %
in 1000 tons and % of total
in millions euros and % of total
non member countries188 93997 %
Source : Eumofa
Key figures FranceAgriMer 2017 / The fisheries and aquaculture /5
Value of sales in 2014 (2)
Main species sold in 2015 (2) (3) (4)
tons
(1) excluding seaweeds - (2) data 2013 for fishing and 2012 for fish farming - (3) equivalent live weight - (4) sales, sales to processing industry and export sales(5) including farmed crustaceans - Source : MEEM / CGDD / SOeS
Changes in quantities sold in metropolitan France (1)
(1 000 tons) (3)
million euros
0
100
200
300
400
500
600
700
1997
1999
2001
2003
2005
2007
2009
2011
2013
fresh and frozen landings
shellfish farming
fish farming (4)
11 00012 00012 60012 700
15 80021 100
22 20023 100
26 20030 300
35 00043 700
75 10076 600
98 000
0 20 000 40 000 60 000 80 000 100 000 120 000
cuttlefishwhiting
codwhelksaithe
sardinescallop
monkfishmackerel
herringtrout (5)
hakemussel (5)
oyster(5)tuna
1732333434
4244
6570
7598
110115
126388
0 50 100 150 200 250 300 350 400 450
sardinecuttlefish
squidmackerel
codNorway lobster
seabassscallop
solemussel (5)monkfish
haketrout (5)
tunaoyster (5)
Total sales / metropolitan France and overseas territories
Source : Eumofa
fresh and frozen landings
shellfish farming
fish farming (4)

6/ The fisheries and aquaculture sector in France > Édition 2017 © FranceAgriMer 2017 /
Production / landings
Fresh and frozen landings in 2015 (1)
Sales
value (million euros) / quantity (tons) (2)
Other regions (3)
330 M¤ / 163 700 t
Nord - Pas-de-Calais54 M€ / 26 600 t
Haute-Normandie 37 M€ / 15 200 t
Basse-Normandie93 M€ / 39 500 t
Bretagne351 M€ / 141 100 t
Pays de la Loire111 M€ / 29 500 t
Poitou-Charentes53 M€ / 10 000 t
Aquitaine30 M€ / 6 700 t
Languedoc-Roussillon 33 M€ 33 M€ / 7 600 t
Provence-Alpes-Côte d’Azur5 M€ / 1 100 t
Corse8 M€ / 2 900 t
(1) excluding seaweeds and freshwater fishing -
(2) equivalent live weight
(3) including sales in overseas territories and foreign sales
Source : MEEM / CGDD / SOeS
Production / landings
Key figures FranceAgriMer 2017 / The fisheries and aquaculture /7
Sales of fishery products
Sales of fishery products at auction in 2016
Source : Visiomer / FranceAgriMer
Number of auctions : 37
Douarnenez
Audierne
St GuénoléLe Guilvinec
Dunkerque
Boulogne-sur-Mer
DieppeFécamp
Grandcamp
St Quay Portrieux
Roscoff
BrestPort en Bessin
ErquyConcarneau
Granville
Cancale
Cherbourg
St Malo
Île d’Yeu
La Rochelle
St Gilles Croix de Vie
La Turballe
Agde
SèteLe Grau du Roi
LorientQuiberon
Sables d’Olonne
Île d’Oléron
Royan
Arcachon
St Jean de Luz
Port La Nouvelle
NoirmoutierLe Croisic
Loctudy
value of sales 644 million euros
Sales by French vessels
quantities sold
188 958 tons
value of sales 26 million euros
Sales by foreign-registered vessels
quantities sold
7 575 tons
Sales of fishery products
8/ The fisheries and aquaculture sector in France > Édition 2017 © FranceAgriMer 2017 /
Source : Visiomer / FranceAgriMer
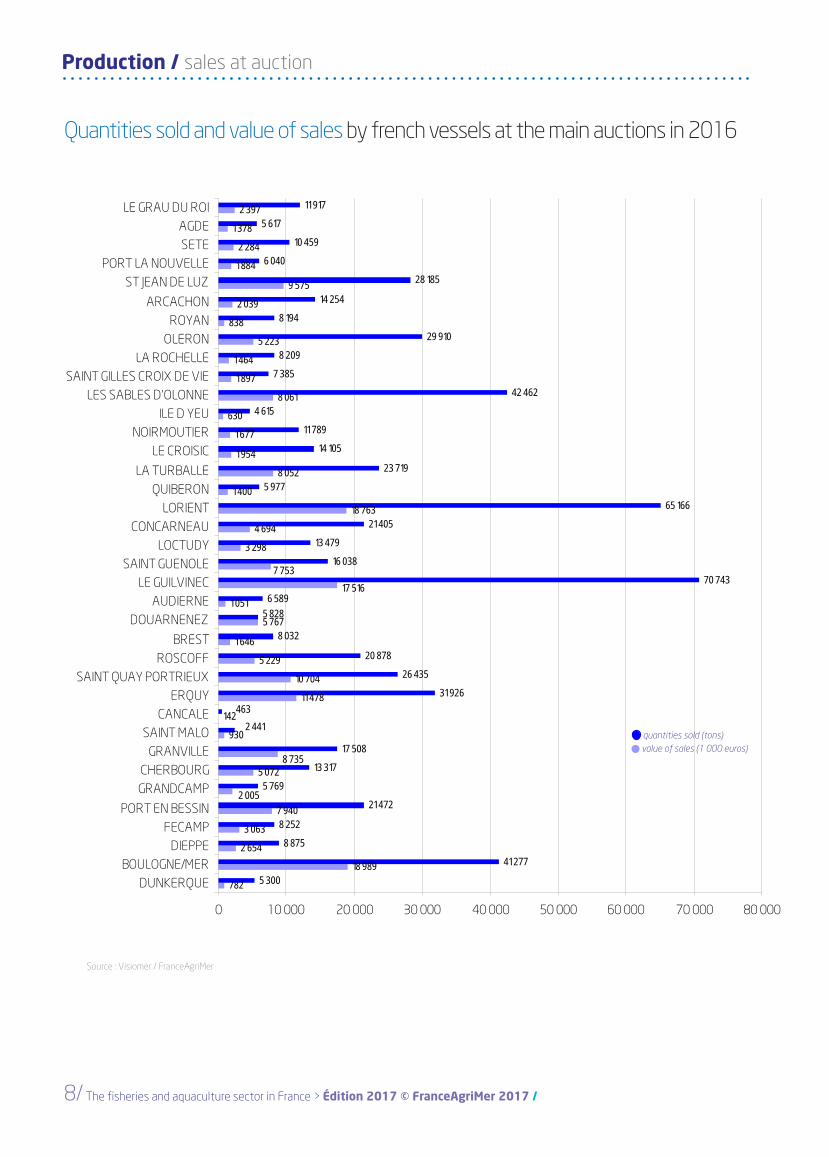
Quantities sold and value of sales by french vessels at the main auctions in 2016
quantities sold (tons) value of sales (1 000 euros)
> Production / sales at auction Sales of fishery products Production / sales at auction
782
18 989
2 654
3 063
7 940
5 072
930
142
11 478
10 704
5 229
1 646
5 767
1 051
3 298
4 694
18 763
1 400
8 052
1 954
1 677
630
8 061
1 897
1 464
5 223
838
2 039
9 575
1 884
2 284
1 378
2 397
5 300
41 277
8 875
8 252
21 472
5 769
13 317
17 508
31 926
26 435
20 878
8 032
6 589
70 743
16 038
13 479
21 405
65 166
5 977
23 719
14 105
11 789
4 615
42 462
7 385
8 209
29 910
8 194
14 254
28 185
6 040
10 459
5 617
11 917
7 75317 516
2 005
8 735
5 828
2 441463
0 10 000 20 000 30 000 40 000 50 000 60 000 70 000 80 000
DUNKERQUEBOULOGNE/MER
DIEPPEFECAMP
PORT EN BESSIN
GRANDCAMPCHERBOURG
GRANVILLESAINT MALO
CANCALEERQUY
SAINT QUAY PORTRIEUXROSCOFF
BREST
DOUARNENEZAUDIERNE
LE GUILVINECSAINT GUENOLE
LOCTUDYCONCARNEAU
LORIENTQUIBERON
LA TURBALLE
LE CROISICNOIRMOUTIER
ILE D YEULES SABLES D'OLONNE
SAINT GILLES CROIX DE VIELA ROCHELLE
OLERONROYAN
ARCACHON
ST JEAN DE LUZPORT LA NOUVELLE
SETEAGDE
LE GRAU DU ROI
Key figures FranceAgriMer 2017 / The fisheries and aquaculture /9
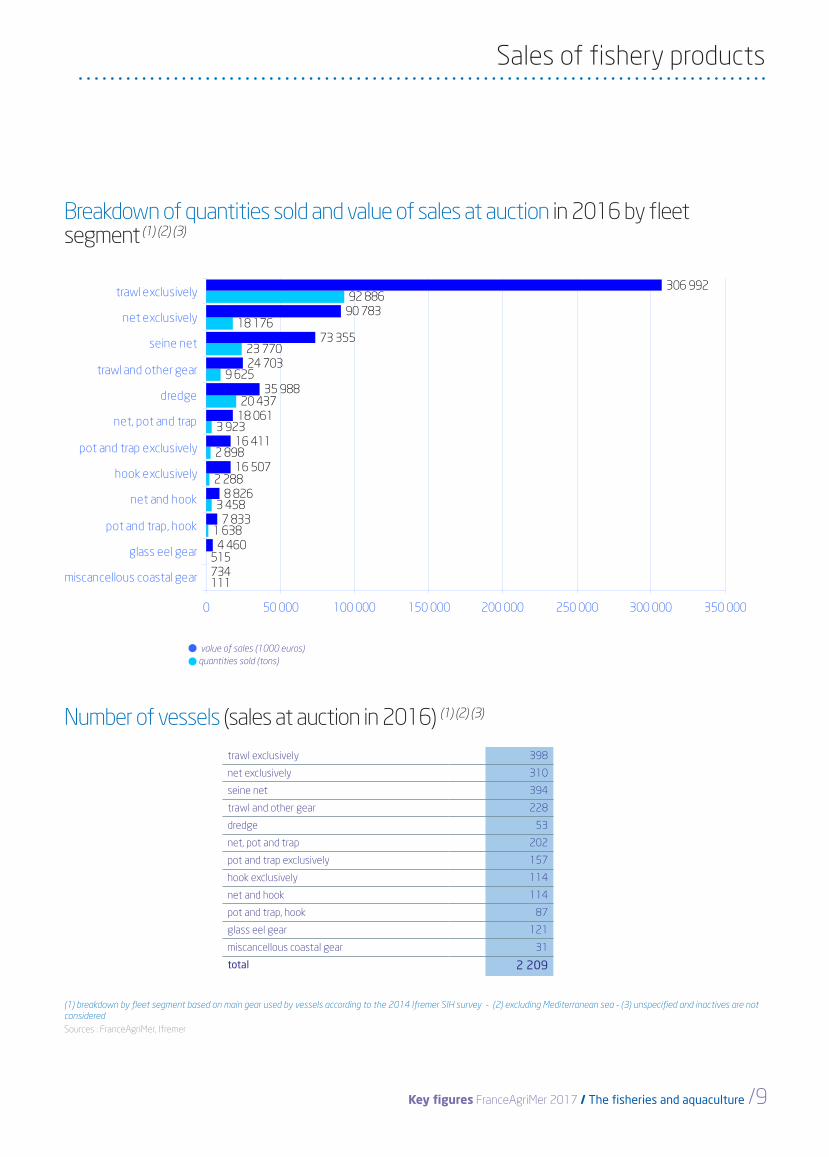
quantities sold (tons)
Breakdown of quantities sold and value of sales at auction in 2016 by fleet segment (1) (2) (3)
(1) breakdown by fleet segment based on main gear used by vessels according to the 2014 Ifremer SIH survey - (2) excluding Mediterranean sea - (3) unspecified and inactives are not considered
quantities sold (tons) value of sales (1 000 euros)
Number of vessels (sales at auction in 2016) (1) (2) (3)
trawl exclusively 398
net exclusively 310
seine net 394
trawl and other gear 228
dredge 53
net, pot and trap 202
pot and trap exclusively 157
hook exclusively 114
net and hook 114
pot and trap, hook 87
glass eel gear 121
miscancellous coastal gear 31
total 2 209
Sources : FranceAgriMer, Ifremer
value of sales (1000 euros)
Sales of fishery products
782
18 989
2 654
3 063
7 940
5 072
930
142
11 478
10 704
5 229
1 646
5 767
1 051
3 298
4 694
18 763
1 400
8 052
1 954
1 677
630
8 061
1 897
1 464
5 223
838
2 039
9 575
1 884
2 284
1 378
2 397
5 300
41 277
8 875
8 252
21 472
5 769
13 317
17 508
31 926
26 435
20 878
8 032
6 589
70 743
16 038
13 479
21 405
65 166
5 977
23 719
14 105
11 789
4 615
42 462
7 385
8 209
29 910
8 194
14 254
28 185
6 040
10 459
5 617
11 917
7 75317 516
2 005
8 735
5 828
2 441463
0 10 000 20 000 30 000 40 000 50 000 60 000 70 000 80 000
DUNKERQUEBOULOGNE/MER
DIEPPEFECAMP
PORT EN BESSIN
GRANDCAMPCHERBOURG
GRANVILLESAINT MALO
CANCALEERQUY
SAINT QUAY PORTRIEUXROSCOFF
BREST
DOUARNENEZAUDIERNE
LE GUILVINECSAINT GUENOLE
LOCTUDYCONCARNEAU
LORIENTQUIBERON
LA TURBALLE
LE CROISICNOIRMOUTIER
ILE D YEULES SABLES D'OLONNE
SAINT GILLES CROIX DE VIELA ROCHELLE
OLERONROYAN
ARCACHON
ST JEAN DE LUZPORT LA NOUVELLE
SETEAGDE
LE GRAU DU ROI
111
515
1 638
3 458
2 288
2 898
3 923
20 437
9 625
23 770
18 176
92 886
734
4 460
7 833
8 826
16 507
16 411
18 061
35 988
24 703
73 355
90 783
306 992
0 50 000 100 000 150 000 200 000 250 000 300 000 350 000
miscancellous coastal gear
glass eel gear
pot and trap, hook
net and hook
hook exclusively
pot and trap exclusively
net, pot and trap
dredge
trawl and other gear
seine net
net exclusively
trawl exclusively

10/ The fisheries and aquaculture sector in France > Édition 2017 © FranceAgriMer 2017 /
Production / sales at auction
Sales of fishery productsMain species sold at auction by French vessels in 2016
Changes in quantities sold by the French vessels by species group (1 000 tons)
Changes in value of sales by the French vessels by species group (million euros)
Value of sales (1 000 euros)Quantities sold (tons)
Source : Visiomer / FranceAgriMer
mussel
75 1006 2536 729
7 9968 6738 8409 26710 01810 73010 901
14 95316 899
19 44728 515
30 10333 168
45 60047 330
49 19356 320
72 471
0 10 000 20 000 30 000 40 000 50 000 60 000 70 000 80 000
sardineturbot
haddockwhelk
red mulletwhiting
squidmackerelanchovy
soleseabream
Norway lobsterJohn Dory
seabasspollack
codhake
monkfishcuttlefish
scallop
0
50
100
150
200
250
300
350
2001200220032004200520062007200820092010201120122013201420152016
cephalopodsbivalvescrustaceanstuna and small pelagicsother fish
0
100
200
300
400
500
600
700
800
900
2001200220032004200520062007200820092010201120122013201420152016
cephalopodsbivalvescrustaceanstuna and small pelagicsother fish
cephalopods
bivalves
crustaceans
tuna and small pelagics
other fish
cephalopods
bivalves
crustaceans
tuna and small pelagics
other fish
2001
2002
2003
2004
2005
2006
2007
2008
2009
2010
2011
2012
2013
2014
2015
2016
2001
2002
2003
2004
2005
2006
2007
2008
2009
2010
2011
2012
2013
2014
2015
2016
300
250
200
150
100
50
0
900
800
700
600
500
400
300
200
100
0
Production / Sales of fishery products
585627
1 5111 578
1 9892 054
2 3872 970
3 9504 1494 2434 253
5 0566 770
7 63410 403
13 98315 63115 743
18 272
0 5 000 10 000 15 000 20 000
turbotseabreamJohn Doryred mullet
pollackcod
seabassanchovyhaddock
squidsole
Norway lobsterwhelk
mackerelcuttlefish
whitingmonkfish
scallopsardine
hake
Key figures FranceAgriMer 2017 / The fisheries and aquaculture /11
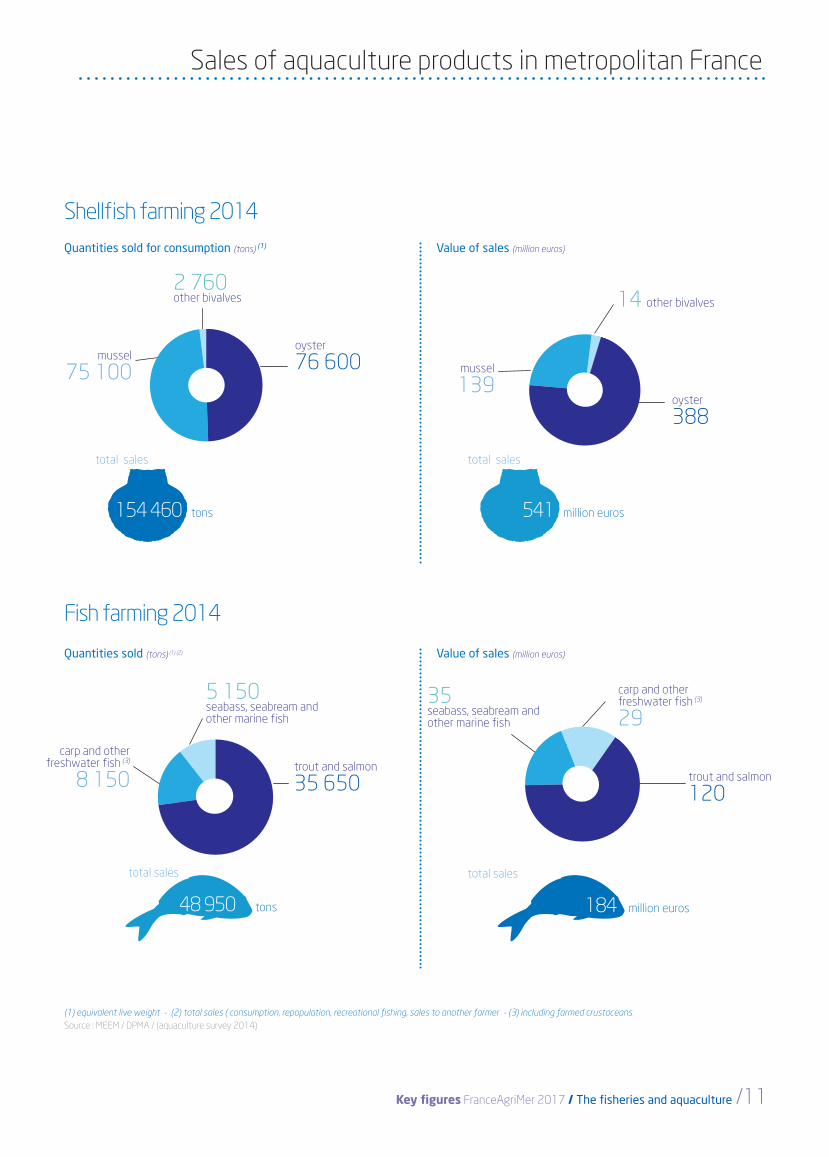
Shellfish farming 2014
Fish farming 2014
Quantities sold for consumption (tons) (1) Value of sales (million euros)
total sales
541 million euros
total sales
154 460 tons
Quantities sold (tons) (1) (2) Value of sales (million euros)
(1) equivalent live weight - (2) total sales ( consumption, repopulation, recreational fishing, sales to another farmer - (3) including farmed crustaceans
total sales
184 million euros
2 760other bivalves
oyster
76 600mussel
75 100
14 other bivalves
oyster
388
mussel
139
5 150seabass, seabream and other marine fish
trout and salmon
35 650
carp and other freshwater fish (3)
8 150
35seabass, seabream and other marine fish
trout and salmon
120
carp and other freshwater fish (3)
29
Source : MEEM / DPMA / (aquaculture survey 2014)
total sales
48 950 tons
Sales of aquaculture products in metropolitan France

12/ The fisheries and aquaculture sector in France > Édition 2017 © FranceAgriMer 2017 /
Fishing fleet / Aquaculture firmsProduction
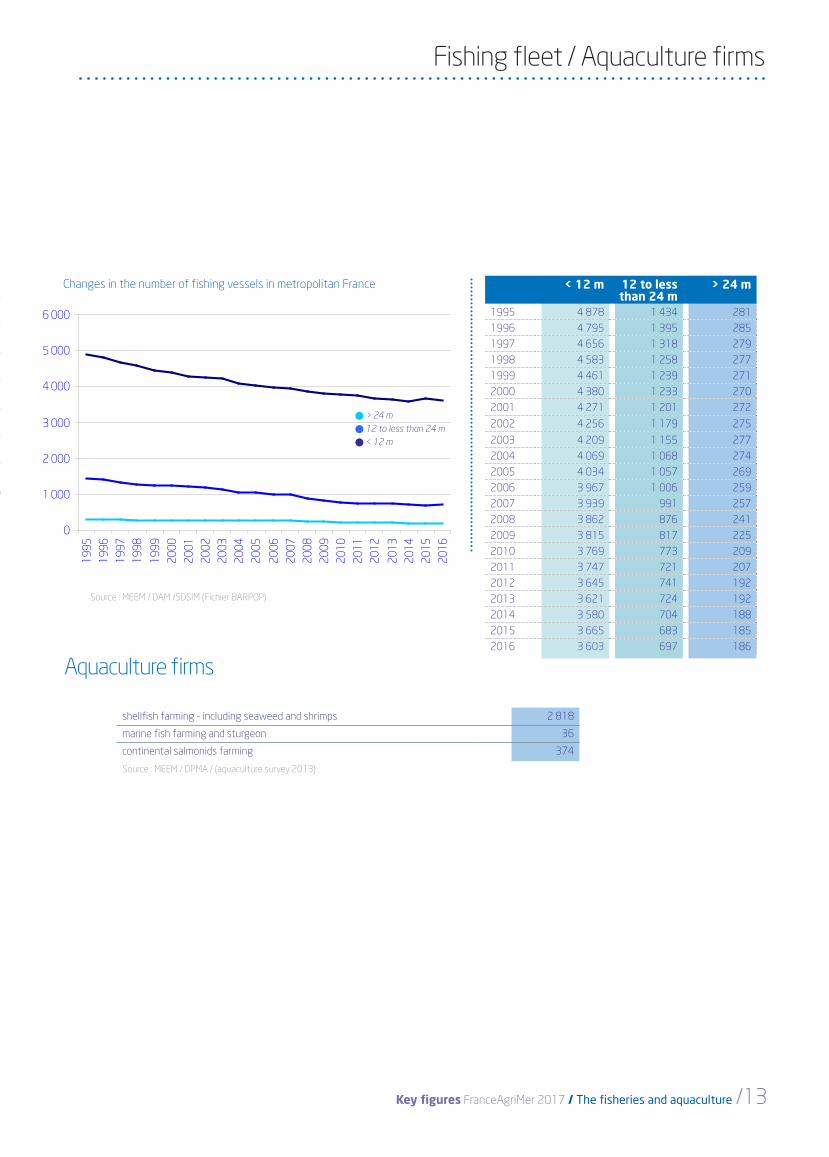
Fishing fleet
Breakdown of total vessels by length in 2016 (metropolitan France) Breakdown of total vessels by fishery category in 2014 (metropolitan France) (1)
Small scale fisheries out of port less than 24 hours Coastal fisheries Between 24 hours and 96 hours out of port Offshore fisheries more than 96 hours out of port High seas fisheries vessels over 1 000 GRT (gross register tonnage) or vessels over 150 GRT if out of port more than 20 days
Total France
7 373 vessels
Source : MEEM / DAM /SDSIM
4 486metropolitan France 2 887 overseas
territories
Production
2 788
815697
14937
0
500
1 000
1 500
2 000
2 500
3 000
less than10 meters
from 10 to< 12
meters
from 12 to< 24
meters
from 24 to< 40
meters
more than40 meters
457270
28 17
3 253
0
500
1 000
1 500
2 000
2 500
3 000
3 500
small scalefisheries
coastalfisheries
offshorefisheries
hight seasfisheries
bothaquaculture
and smallscale
fisheries
0
1 000
2 000
3 000
4 000
5 000
6 000
1995
1996
1997
1998
1999
2000
2001
2002
2003
2004
2005
2006
2007
2008
2009
2010
2011
2012
2013
2014
2015
2016
Key figures FranceAgriMer 2017 / The fisheries and aquaculture /13
Fishing fleet / Aquaculture firms
Aquaculture firms
Breakdown of total vessels by fishery category in 2014 (metropolitan France) (1)
Changes in the number of fishing vessels in metropolitan France
shellfish farming - including seaweed and shrimps 2 818
marine fish farming and sturgeon 36
continental salmonids farming 374
Source : MEEM / DPMA / (aquaculture survey 2013)
Source : MEEM / DAM /SDSIM (Fichier BARPOP)
> 24 m 12 to less than 24 m < 12 m
< 12 m 12 to less than 24 m
> 24 m
1995 4 878 1 434 281
1996 4 795 1 395 285
1997 4 656 1 318 279
1998 4 583 1 258 277
1999 4 461 1 239 271
2000 4 380 1 233 270
2001 4 271 1 201 272
2002 4 256 1 179 275
2003 4 209 1 155 277
2004 4 069 1 068 274
2005 4 034 1 057 269
2006 3 967 1 006 259
2007 3 939 991 257
2008 3 862 876 241
2009 3 815 817 225
2010 3 769 773 209
2011 3 747 721 207
2012 3 645 741 192
2013 3 621 724 192
2014 3 580 704 188
2015 3 665 683 185
2016 3 603 697 186
Fishing fleet / Aquaculture firms
457270
28 17
3 253
0
500
1 000
1 500
2 000
2 500
3 000
3 500
small scalefisheries
coastalfisheries
offshorefisheries
hight seasfisheries
bothaquaculture
and smallscale
fisheries
0
1 000
2 000
3 000
4 000
5 000
6 000
1995
1996
1997
1998
1999
2000
2001
2002
2003
2004
2005
2006
2007
2008
2009
2010
2011
2012
2013
2014
2015
2016

14/ The fisheries and aquaculture sector in France > Édition 2017 © FranceAgriMer 2017 /
JobsNumber of seamen employed on board French fishing vessels in 2015 (seamen of all nationalities)
>
Total France
16 236
Total France
Number of full time equivalent jobs in 2013 (1)
Regional sharing13 454metropolitan France
overseas territories
2 782
less than 1 000between 1 000 and 2 000between 2 000 and 5 000
Source : MEDDE/DAM/SDSIM
jobs FTEJshellfish farming 16 277 8 763marine fish farming and sturgeon 674 617continental salmonids farming 1 667 1 295
(1) including seasonal jobs
Source : MEEM/DPMA/ (aquaculture survey 2013)
7 461
2 690
3 246
981
4 779
0
1 000
2 000
3 000
4 000
5 000
6 000
7 000
8 000
smal
l sca
le fi
sher
ies
coas
tal f
isher
ies
offs
hore
fish
erie
s
high
seas
fish
erie
sbo
th a
quac
ultu
re a
nd s
mall
scale
fish
erie
s
Production
9 003
2 8353 212
1 186
0
1 000
2 000
3 000
4 000
5 000
6 000
7 000
8 000
9 000
10 000
small scale fisheries coastal fisheries offshore fisheries high sea fisheries
Languedoc-Roussillon 1 067
Haute-Normandie 831
Basse-Normandie 1 469
Pays de la Loire 1 116
Poitou-Charentes 742
Aquitaine 1 435
Provence-Alpes-Côte d’Azur 811
Bretagne 4 800
Corse 282
overseas territories 2 782
Nord - Pas-de-Calais - Picardie 901

/15
FIRMSfishmonger's / trading / processing by sales / by region

16/ The fisheries and aquaculture sector in France > Édition 2017 © FranceAgriMer 2017 /
firms
Fishmonger's in 2010
2 926
number of establishments net sales
1 135 million euros
7 475
full time equivalent jobs
Sources : Via.Aqua and Proteis for FranceAgriMer
Number of establishments per region
moins de 50de 50 à 150de 150 à 250plus de 250
Languedoc-Roussillon 292
Haute-Normandie 99
Île-de-France 373
Alsace 12
Franche-Comté 16
Lorraine 29
Basse-Normandie 116Champagne-Ardenne 23
Limousin 21
Picardie 56
Nord - Pas-de-Calais 144
Provence-Alpes-Côte d’Azur 372
Bretagne 326
Bourgogne 22
Rhône-Alpes 100
Auvergne 30
Midi-Pyrénées 131
Centre 57
Pays de la Loire 226
Poitou-Charentes 213
Aquitaine 239
Corse 29
Trading firmsFishmonger firmsFirms /
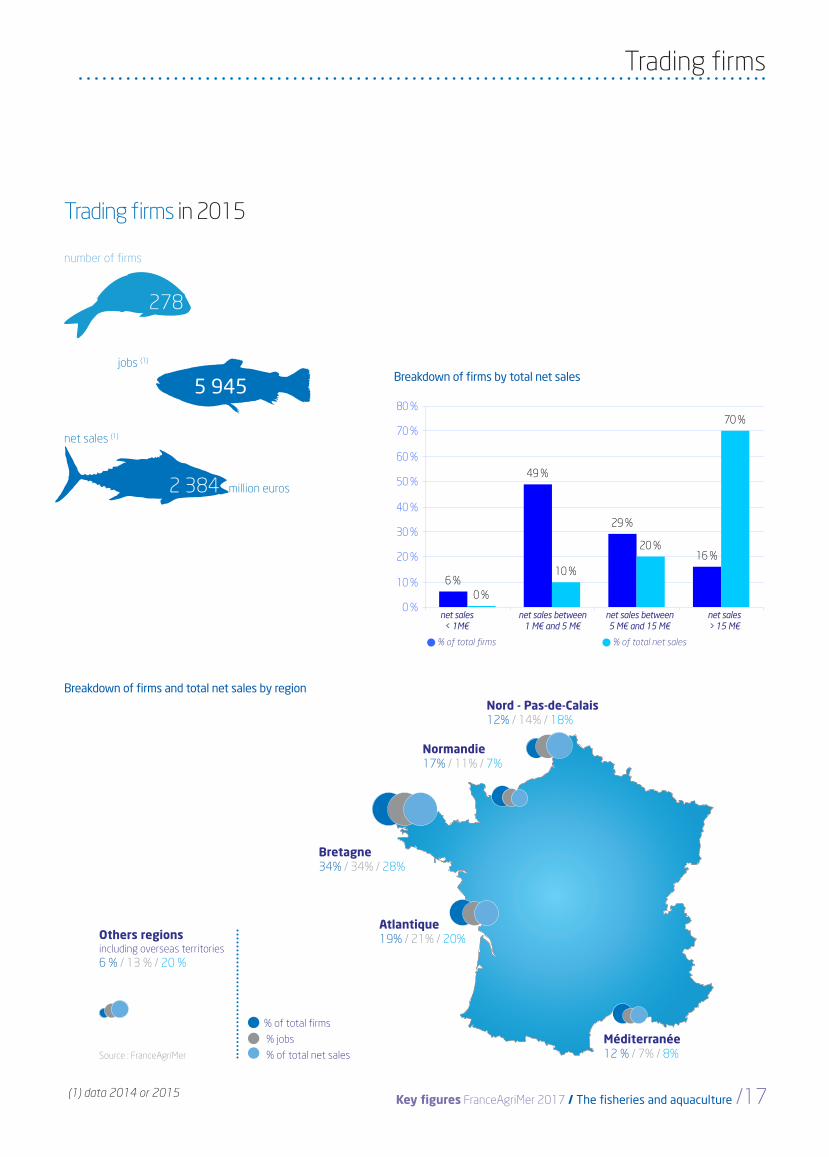
Key figures FranceAgriMer 2017 / The fisheries and aquaculture /17
Trading firms in 2015
278
number of firms
5 945jobs (1)
Breakdown of firms and total net sales by region
% of total firms
Breakdown of firms by total net sales
% of total net sales
2 384 million euros
net sales (1)
net sales between 5 M€ and 15 M€
net sales between 1 M€ and 5 M€
net sales > 15 M€
net sales < 1M€
Nord - Pas-de-Calais 12% / 14% / 18%
Normandie 17% / 11% / 7%
Bretagne 34% / 34% / 28%
Atlantique 19% / 21% / 20%
Méditerranée 12 % / 7% / 8%
% of total firms
% jobs
% of total net sales
Others regionsincluding overseas territories6 % / 13 % / 20 %
Source : FranceAgriMer
6 %
49 %
29 %
16 %
0 %
10 %
20 %
70 %
0 %
10 %
20 %
30 %
40 %
50 %
60 %
70 %
80 %
net sales < 1 M€ net salesbetween 1M€ and
5M€
net salesbetween 5M€ and
15M€
net sales > 15 M€
Trading firms
(1) data 2014 or 2015
Firms /

18/ The fisheries and aquaculture sector in France > Édition 2017 © FranceAgriMer 2017 /
firms
Seafood processing net sales
Processing main activity firms in 2015
Breakdown of processing firms and sales by region (3)
cooked shrimps
5 %
cooked meals
15 %27 %
first processing(1)
37 %canned
seafood/soup5 %fresh delicatessen (surimi, caviar, etc.)
1% others(2)
10 %cured fish includedsmoked salmon
Source : FranceAgriMer / processing firms survey
(1) filleting, cutting, peeling, packaging, surgelation(2) seaweeds, in fish products, others(3) small sample estimation
499
number of firms
112
jobs
% of total firms
Breakdown of firms by total net sales (3)
% of total net sales
% of total firms
% of total net sales
Others regionsincluding overseas territories34 % / 51 %
Hauts-de-France 12 % / 5 %
Normandie 7 % / 10 %
Bretagne 23 % / 18 %
Nouvelle-Aquitaine 15 % / 12 %
Méditerranée 9 % / 4 %
31 million euros
12 million euros for processing
including seafood and fish farming processing
Processing main activity firms
22 %
31 %
23 % 24 %
0 % 3 % 6 %
91 %
0 %
10 %
20 %
30 %
40 %
50 %
60 %
70 %
80 %
90 %
100 %
net sales < 1 M€ net salesbetween 1 M€
and 5 M€
net salesbetween 5 M€
and 15 M€
net sales > 15 M€
net sales per film
Firms /
% of total firms
% of total net sales
Méditerranée 9 % / 4 %
/19
TRADEimports / exports by presentation / by species / by geographical origine / main species
20/ The fisheries and aquaculture sector in France > Édition 2017 © FranceAgriMer 2017 /
-1 500
-1 200
-900
-600
-300
0
300
600
-2 500
-2 000
-1 500
-1 000
-500
0
500
1 000
-6 000
-5 000
-4 000
-3 000
-2 000
-1 000
0
1 000
2 000
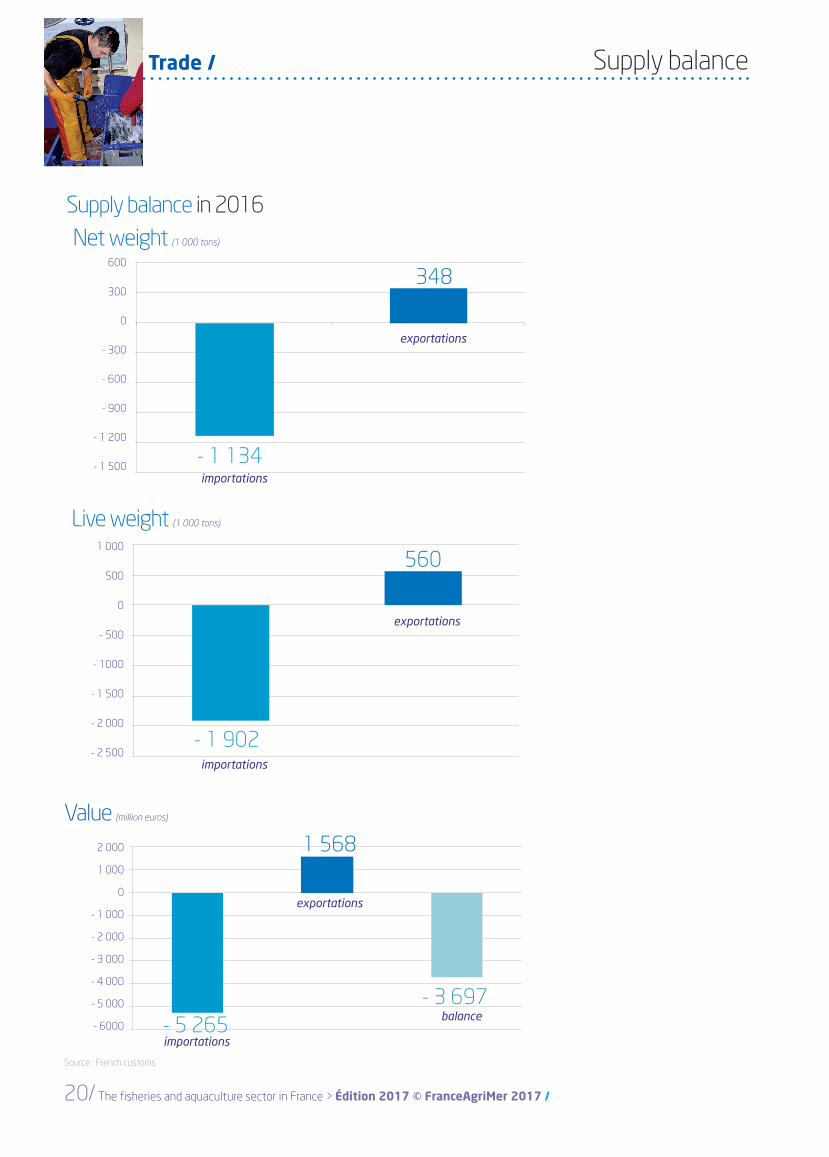
Net weight (1 000 tons)
Source : French customs
Value (million euros)
Live weight (1 000 tons)
Supply balance in 2016
exportations
importations
348600
300
0
- 300
- 600
- 900
- 1 200
- 1 500- 1 134
exportations
importations
1 000
500
0
- 500
- 1000
- 1 500
- 2 000
- 2 500- 1 902
560
2 000
1 000
0
- 1 000
- 2 000
- 3 000
- 4 000
- 5 000
- 6000balance
importations
exportations
1 568
- 3 697- 5 265
5356576666
869295
167227
242470
529829
1 250
0 200 400 600 800 1 000 1 200 1 400
seabreamcephalopods
hakeNorway lobster
mackerelmussel
crabsardinelobsterscallop
saithe, pollackcod
tunashrimpsalmon
Supply balance Imports and exports / metropolitan France and overseas territoriesTrade /

Key figures FranceAgriMer 2017 / The fisheries and aquaculture /21
Imports - main species in 2016
Exports - main species in 2016
Source : French customs
Value (million euros)
Value (million euros)
5356576666
869295
167227
242470
529829
1 250
0 200 400 600 800 1 000 1 200 1 400
seabreamcephalopods
hakeNorway lobster
mackerelmussel
crabsardinelobsterscallop
saithe, pollackcod
tunashrimpsalmon
Imports and exports / metropolitan France and overseas territories
161819
2425
303131
4757
73
76112
212229
0 50 100 150 200 250
hakesole
mackerelcod
monkfishcrab
troutscalloplobster
toothfishoyster
cephalopodsshrimp
tunasalmon
Trade /

22/ The fisheries and aquaculture sector in France > Édition 2017 © FranceAgriMer 2017 /
>
Imports by volume (1 000 tons) Imports by value (million euros)
Imports by presentation in 2016
(1) data collection methodology is detailed on inside back cover - Source : French customs
Imports by volume (1 000 tons) Imports by value (million euros)
Imports by species group in 2016
net weightlive weight (1)
net weightlive weight (1)
150
207
563
1 634
2 215
0 500 1 000 1 500 2 000 2 500
non food use
salted, dried, smoked
canned
live, fresh, chilled
frozen
70
129
191
142
488
152
318
247
185
999
0 200 400 600 800 1 000 1 200
non food use
bivalves andcephalopods
trout, salmon, eel andfresh water fish
crustaceans
marine fish
150
551
1 331
1 179
2 054
0 500 1 000 1 500 2 000 2 500
non food use
bivalves andcephalopods
trout, salmon, eeland fresh water fish
crustaceans
marine fish
181
35
19
39
62
232
48
26
75
178
0 50 100 150 200 250
marine fish
trout, salmon, eel and freshwater fish
crustaceans
bivalves and cephalopods
non food use
Trade / aquatic products Imports and exports / metropolitan France and overseas territories
70
30
127
310
424
152
69
281
334
923
0 200 400 600 800 1 000
non food use
salted, dried, smoked
canned
live, fresh, chilled
frozen
Key figures FranceAgriMer 2017 / The fisheries and aquaculture /23
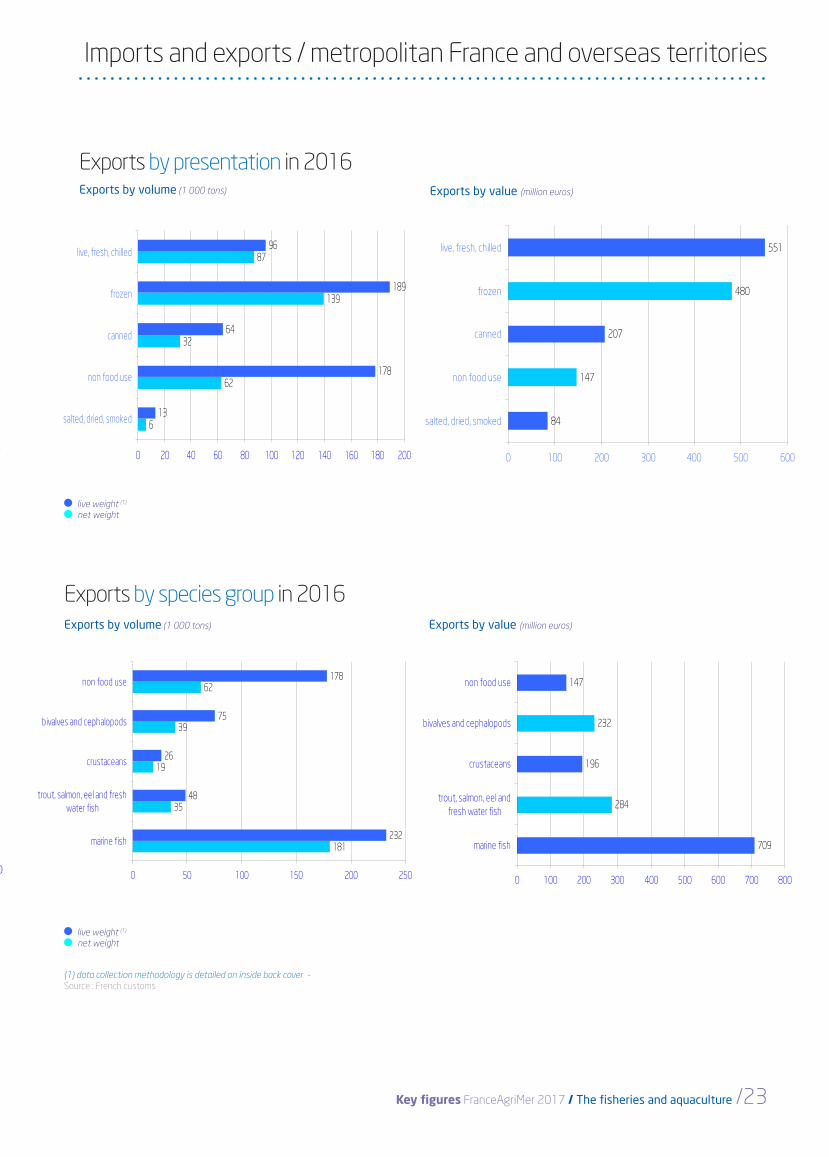
Exports by presentation in 2016
(1) data collection methodology is detailed on inside back cover - Source : French customs
Exports by volume (1 000 tons) Exports by value (million euros)
Exports by species group in 2016Exports by volume (1 000 tons) Exports by value (million euros)
net weightlive weight (1)
net weightlive weight (1)
150
207
563
1 634
2 215
0 500 1 000 1 500 2 000 2 500
non food use
salted, dried, smoked
canned
live, fresh, chilled
frozen
150
551
1 331
1 179
2 054
0 500 1 000 1 500 2 000 2 500
non food use
bivalves andcephalopods
trout, salmon, eeland fresh water fish
crustaceans
marine fish
84
147
207
480
551
0 100 200 300 400 500 600
salted, dried, smoked
non food use
canned
frozen
live, fresh, chilled
181
35
19
39
62
232
48
26
75
178
0 50 100 150 200 250
marine fish
trout, salmon, eel and freshwater fish
crustaceans
bivalves and cephalopods
non food use
709
284
196
232
147
0 100 200 300 400 500 600 700 800
marine fish
trout, salmon, eel andfresh water fish
crustaceans
bivalves and cephalopods
non food use
Imports and exports / metropolitan France and overseas territories
6
62
32
139
87
13
178
64
189
96
0 20 40 60 80 100 120 140 160 180 200
salted, dried, smoked
non food use
canned
frozen
live, fresh, chilled

24/ The fisheries and aquaculture sector in France > Édition 2017 © FranceAgriMer 2017 /
Imports of aquatic products by geographical origin in 2016
Exports of aquatic products by destination in 2016
Source : French Customs
Source : French Customs
Value (million euros)
Value (million euros)
Imports and exports
2179European Union of 28
2110 other countries
976 EFTA (Norway, Iceland, Switzerland)
1 201European Union of 28
268other countries
99EFTA (Norway, Iceland,Switzerland)
Trade Imports and exports
117
129133
136143
177
181192
204209
262
267428
578783
0 200 400 600 800 1 000
Marocco
PolandIreland
Vietnam
IndiaIceland
DenmarkGermany
China
United StatesThe Netherlands
EcuadorSpain
United Kingdom
Norway
22
222424
262727
2955
89
122139
173
250268
0 50 100 150 200 250 300
Luxembourg
ChinaIvory Coast
Denmark
SeychellesHong Kong
Portugal
United StatesThe Netherlands
Switzerland
United KingdomGermanyBelgium
ItalySpain

2179European Union of 28
/25
CONSUMPTIONsupply balance / purchases households / catering / breakdown of purchases by distribution channel

26/ The fisheries and aquaculture sector in France > Édition 2017 © FranceAgriMer 2017 /
662
1 717
-367
2 012
-500
0
500
1 000
1 500
2 000
2 500
0
Supply balance in 2015 (1) (2) (3)
Balance changes in production, imports and exports (1) (2) (3)
production (4) supply bilanexportationsimportations
(1) data collection methodology is detailed on inside back cover - (2) live weight - (3) excluding non food use - (4) estimates for 2014 and 2015 Source : FranceAgriMer
in volume (1 000 tons) in value (million euros)
(1 000 tons)
imports production (4)
exports
Supply balance
production (4) supply bilanexportationsimportations
Consumption / supply balance
0
500
1 000
1 500
2 000
2 500
1999 2000 2001 2002 2003 2004 2005 2006 2007 2008 2009 2010 2011 2012 2013 2014 2015
1 889
4 813
-1 484
5 218
-2 000
-1 000
0
1 000
2 000
3 000
4 000
5 000
6 000

Key figures FranceAgriMer 2017 / The fisheries and aquaculture /27
imports production (4)
exports
(1) data collection methodology is detailed on inside back cover - (2) live weight - (3) average 2013-2015 Source : FranceAgriMer
Breakdown by products in 2015 (1) (2)
9 %shellfish from captures
59 %finfish from captures
19 %farmed shellfish
13 % farmed finfish
34 kg
Average annual consumptionper capita (2) (3)
Supply balance
(kg)
Changes in supply balance (1) (2)
total finfish shellfish (bivalves, crustaceans and cephalopods)
Average growth rate over the last ten years -1%
0,0
5,0
10,0
15,0
20,0
25,0
30,0
35,0
40,0
1999 2000 2001 2002 2003 2004 2005 2006 2007 2008 2009 2010 2011 2012 2013 2014 2015
Supply balance
1 889
4 813
-1 484
5 218
-2 000
-1 000
0
1 000
2 000
3 000
4 000
5 000
6 000
28/ The fisheries and aquaculture sector in France > Édition 2017 © FranceAgriMer 2017 /
0%
10%
20%
30%
40%
50%
60%
70%
80%
90%
100%
fresh products chilled delicatessen canned products frozen products
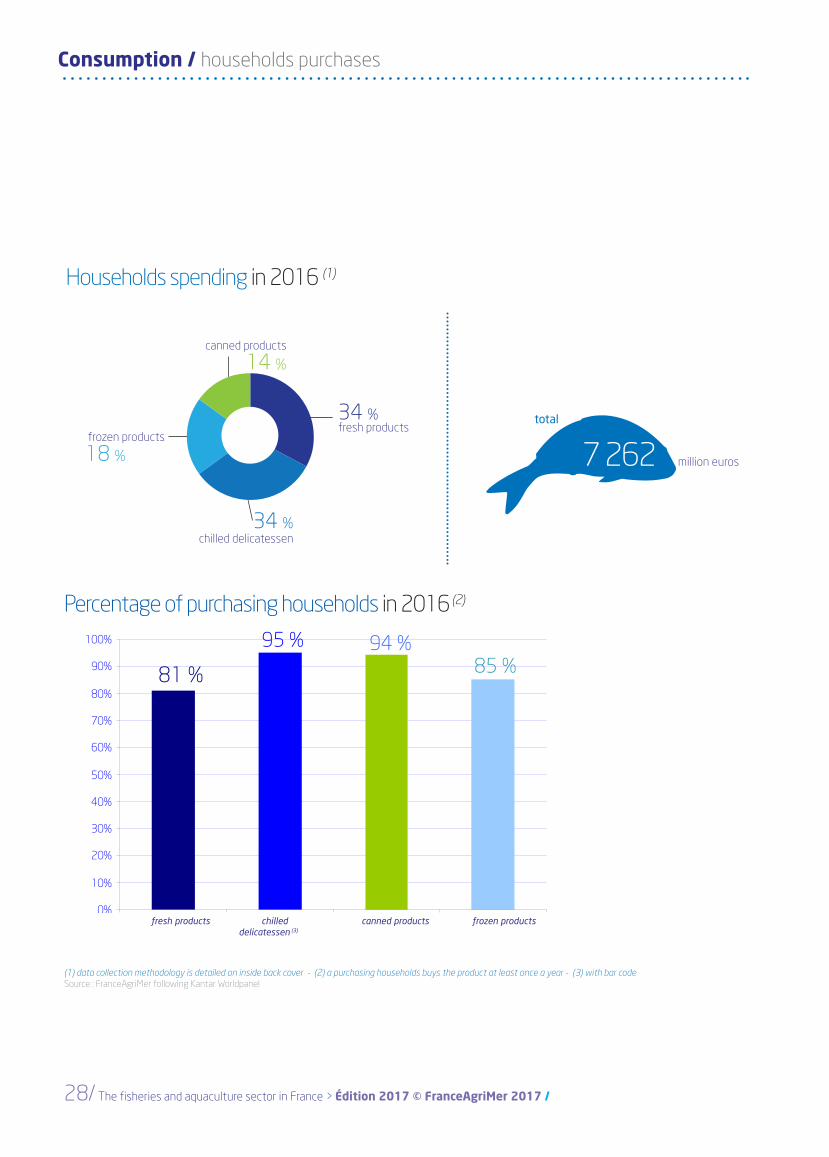
Percentage of purchasing households in 2016 (2)
34 %chilled delicatessen
frozen products
18 %
canned products
14 %
34 %fresh products
fresh products chilled canned products frozen products delicatessen (3)
81 %
95 % 94 %85 %
Households spending in 2016 (1)
(1) data collection methodology is detailed on inside back cover - (2) a purchasing households buys the product at least once a year - (3) with bar code Source : FranceAgriMer following Kantar Worldpanel
total
7 262 million euros
> Consumption / households purchases
Purchases by French households for home consumption
Consumption / households purchases Purchases by French
Key figures FranceAgriMer 2017 / The fisheries and aquaculture /29
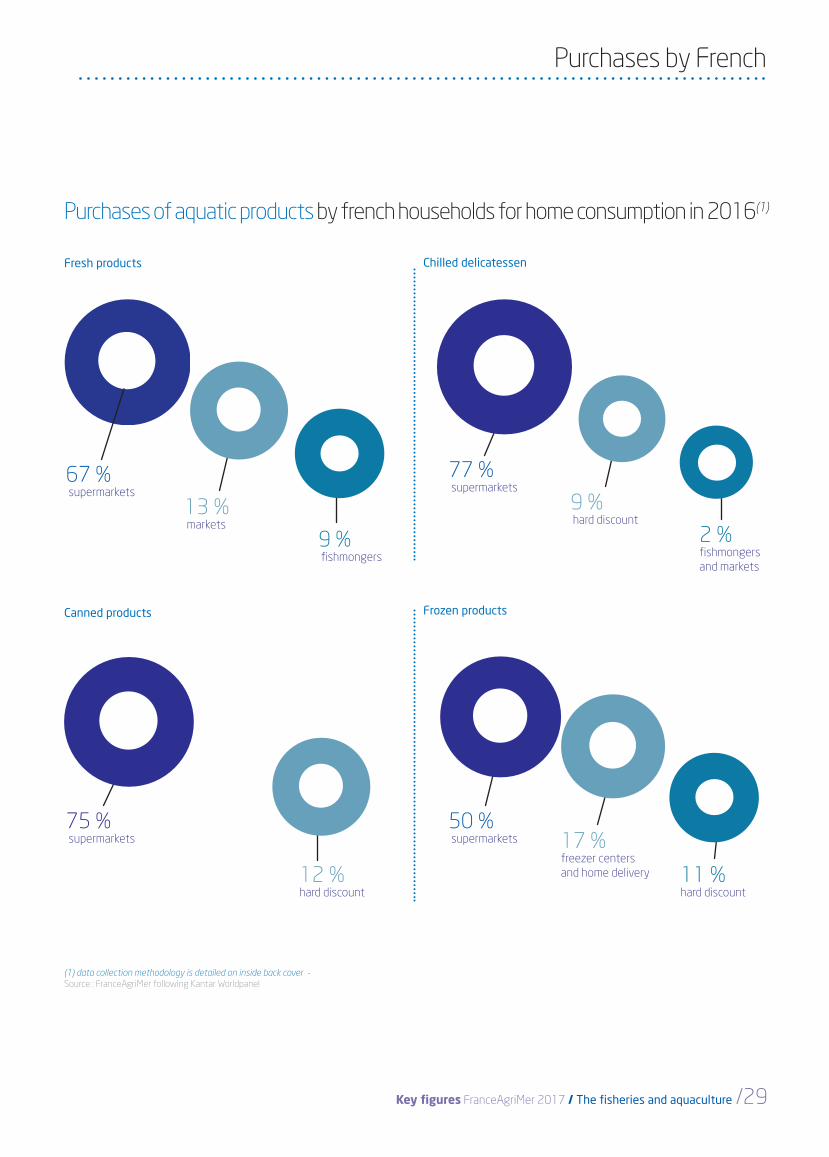
Purchases of aquatic products by french households for home consumption in 2016(1)
Fresh products
Canned products
Chilled delicatessen
Frozen products
Purchases by French households for home consumption
(1) data collection methodology is detailed on inside back cover -Source : FranceAgriMer following Kantar Worldpanel
75 % supermarkets
12 %hard discount
77 % supermarkets
9 % hard discount
2 %fishmongers and markets
50 % supermarkets 17 %
freezer centers and home delivery 11 %
hard discount
67 % supermarkets
13 % markets
9 % fishmongers
Purchases by French

30/ The fisheries and aquaculture sector in France > Édition 2017 © FranceAgriMer 2017 /
Breakdown of expenditures by presentation and species group in 2016 (1)
19 %cooked shrimp
cured fish
32 %
37 %others
12 %surimi55 %
fish fillets
crustaceans
8 %
bivalves and cephalopods
23 %
14 %whole fish
Fresh products
Frozen products
Chilled delicatessen
Canned products
(1) data collection methodology is detailed on inside back cover Source : FranceAgriMer following Kantar Worldpanel
ready meals
18 %
crustaceans
13 %fish
56 %
13 %bivalves and cephalopods
others18 %
47 %tuna (excluding tuna salads)
mackerel
14 %
sardine
16 %
tuna salads
5 %
Consumption / households purchases Purchases by French households for home consumption

Key figures FranceAgriMer 2017 / The fisheries and aquaculture /31
tuna salads
5 %
(1) data collection methodology is detailed on inside back cover - (2) net weight Source : FranceAgriMer following Kantar Worldpanel
tons (2)
million euros
Main species purchased fresh in 2016 (1)
percentage of purchasing households (%)
Purchases by French households for home consumption
3 8403 9564 4564 7804 8174 9375 2785 454
6 0546 449
7 44821 280
22 35825 673
42 886
0 5 000 10 000 15 000 20 000 25 000 30 000 35 000 40 000 45 000 50 000
sardinebrown crab
mackerelcommon dab
hakemonkfish
whitingwhelktrout
scallopsaithe
salmoncod
oystermussel
1011111111
1314
1618
1919
2034
4143
0 5 10 15 20 25 30 35 40 45
seabasssardine
mackerelhake
scallopling
whelkcommon
whitingoyster
troutsaithe
musselcod
seabream
3240
51515252
6166
757882
160189
350374
0 50 100 150 200 250 300 350 400
scallopbrown crab
hakesole
seabassseabream
Norway lobsterwhiting
troutsaithe
monkfishmusseloyster
codsalmon
salmon
cod
mussel
saithe
trout
oyster
whiting
common
whelk
ling
scallop
hake
mackerel
sardine
seabass
salmon
cod
oyster
mussel
monkfish
saithe
trout
whiting
norway lobster
seabream
seabass
sole
hake
brown crab
scallop
mussel
oyster
cod
salmon
saithe
scallop
trout
whelk
whiting
monkfish
hake
common dab
mackerel
brown crab
sardine
32/ The fisheries and aquaculture sector in France > Édition 2017 © FranceAgriMer 2017 /
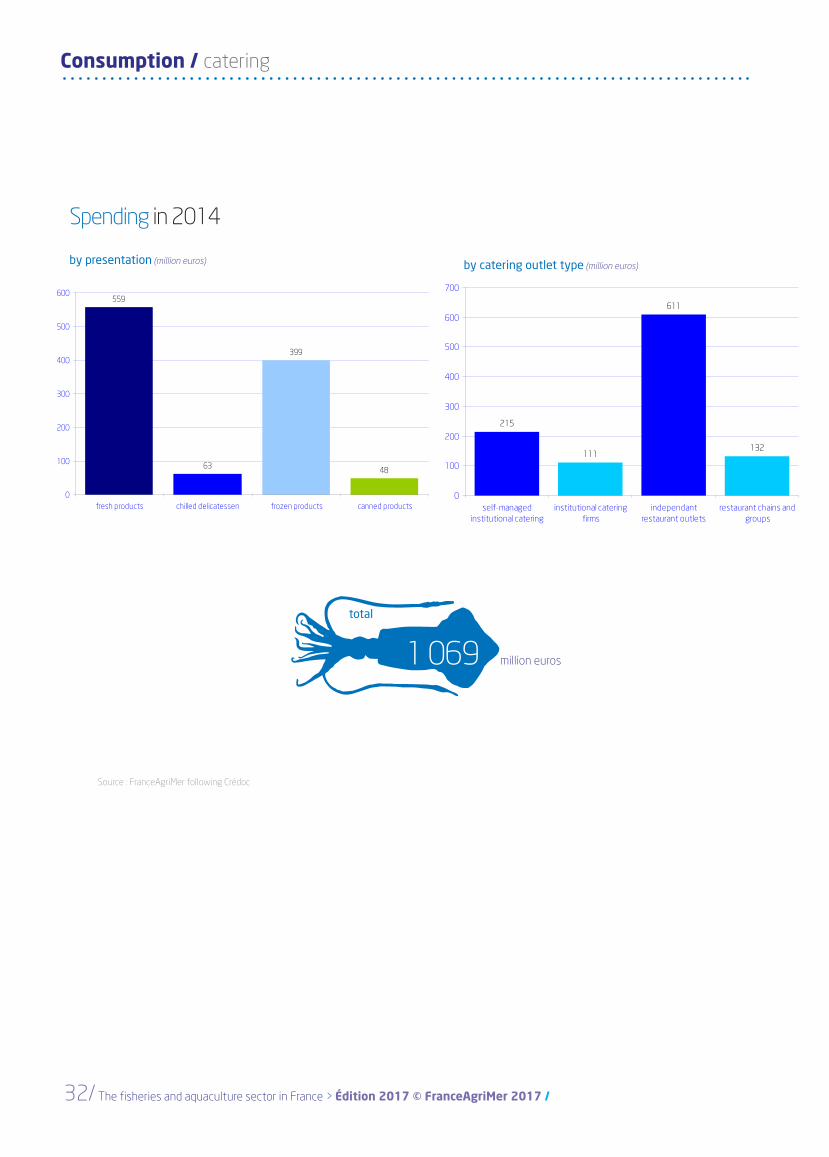
Spending in 2014
Source : FranceAgriMer following Crédoc
by presentation (million euros) by catering outlet type (million euros)
1 069 million euros
total
> Consumption / catering
Purchases of aquatic products by the catering sector
215
111
611
132
0
100
200
300
400
500
600
700
self-managedinstitutional catering
institutional cateringfirms
independantrestaurant outlets
restaurant chains andgroups
Consumption / catering Purchases of aquatic products by the catering sector
559
63
399
48
0
100
200
300
400
500
600
fresh products chilled delicatessen frozen products canned products

Key figures FranceAgriMer 2017 / The fisheries and aquaculture /33
Purchases of aquatic products by the catering sector
Spending by catering outlet and by presentation in 2014
Self-managed institutional catering
Independant restaurant outlets
Institutional catering firms
Restaurant chains and groups
Source : FranceAgriMer following Crédoc
215
111
611
132
0
100
200
300
400
500
600
700
self-managedinstitutional catering
institutional cateringfirms
independantrestaurant outlets
restaurant chains andgroups
Purchases of aquatic products by the catering sector
27%
2%
62%
8%
0%
10%
20%
30%
40%
50%
60%
70%
fresh products chilled delicatessen frozen products canned products
20%
1%
74%
5%
0%
10%
20%
30%
40%
50%
60%
70%
80%
fresh products chilled delicatessen frozen products canned products
66%
9%
22%
3%
0%
10%
20%
30%
40%
50%
60%
70%
fresh products chilled delicatessen frozen products canned products
49%
3%
45%
2%
0%
10%
20%
30%
40%
50%
fresh products chilled delicatessen frozen products canned products

34/ The fisheries and aquaculture sector in France > Édition 2017 © FranceAgriMer 2017 /
Consumption
Breakdown of purchases by presentation for different outlets in 2014 (value)
Breakdown of purchases by outlet for different presentations in 2014 (quantities) (3)
(1) including hard discount, freezer centres and home delivery - (2) including direct sales - (3) net weight
Source : Kantar Worldpanel and Crédoc for FranceAgriMer
supermarkets (1) fishmongers and markets (2)
restaurantsinstitutional catering
fresh products chilled delicatessenfrozen productscanned products
fresh products
chilled delicatessen
frozen products
canned products
Consumption Breakdown of purchases by distribution channel
96%
70%
96%
74% 5%
12%
18%
2%
18%
3%
1%2%
2%
0% 10% 20% 30% 40% 50% 60% 70% 80% 90% 100%
supermarkets (1)
fishmongers and markets (2)
restaurants
institutional catering
27%
63%
87%
33%
2%
8%
13%
33%
62%
26%
19%
8%
3%
15%
0% 10% 20% 30% 40% 50% 60% 70% 80% 90% 100%
produits frais
produits traiteurs réfrigérés
produits surgelés
conserves
supermarkets (1)
fishmongers and markets (2)
restaurants
institutional catering

Key figures FranceAgriMer 2017 / The fisheries and aquaculture /35
supermarkets (1) fishmongers and markets (2)
restaurantsinstitutional catering
Data Included data are the last available on april the 12th 2017.
Foreign Trade Raw Import/export data is provided by French Customs on a net weight basis. It is converted here into their live weight equivalent, i.e. before any product processing, using coefficients that have been established for each product code.
Processing Processing firms data arise from a survey carried out in 2015 among main or secondary processing activity identified firms. Besides, information about non-processing trading firms arises from FranceAgriMer's updated fish trading firms database (notably following the French National Institute for Statistics and Economic Studies' firm lists, sanitary approvals, financial databases and professional sources).
Consumption French consumption may be measured in two ways :• firstly, by calculating supply balance or apparent consumption (production + imports - exports),• secondly by using consumer and restaurant panels.
Apparent consumption is measured in live weight equivalent and includes the overseas territories (French Caribbean Islands, Reunion Island, Mayotte and French Guyana). In contrast, consumer and restaurant data are expressed in net weight, meaning the weight as purchased by the final consumer (consumer panel) or by restaurants (restaurant panel), and exclude consumption in the overseas territories (and in Corsica for consumer panels). Panel data is based on declarations made by consumers and restaurant buyers and is thus non-exhaustive. Coverage varies according to the product in question, and the overall rate of coverage is approximately 80%.
To find out more information, especially about prices at all levels of the sector (production, trade, consumption), and their trends :• Bilan annuel FranceAgriMer 2016 des ventes déclarées en halles à marée• Bilan annuel FranceAgriMer 2016 du commerce extérieur des produits de la pêche et de
l’aquaculture*• Bilan annuel FranceAgriMer 2016 de la consommation des produits de la pêche et de
l’aqua culture*
* coming 2017
VISIOMer données des notes de vente du réseau inter-criées et hors criées MEEM Ministère de l'Environnement, de l'Énergie et de la MerDPMA Direction des Pêches Maritimes et de l'AquacultureSOeS Service d'Observation et des StatistiquesDAM Direction des Affaires MaritimesSDSIM Sous Direction des Systèmes d'information maritimesIfremer Institut français de recherche pour l'exploitation de la mer
Data collection methodology

MINISTÈREDE L’AGRICULTURE
DE L'AGROALIMENTAIREET DE LA FORÊT
MINISTÈRE DE L'ENVIRONNEMENT
DE L’ÉNERGIEET DE LA MER
www.franceagrimer.frwww.agriculture.gouv.fr12 rue Henri Rol-Tanguy / TSA 20002 / 93555 Montreuil cedex
Tél. : +33 1 73 30 30 00 / Fax : +33 1 73 30 30 30
KEY FIGURES FISHERIES AND AQUACULTURE / Les filières pêche et aquaculture en France est une publication de FranceAgriMer Directrice de la publication : Christine Avelin / Rédaction : direction Marchés, études et prospective / unité : pêche et aquaculture Copyright : tous droits de reproduction réservés, sauf autorisation de FranceAgriMer. Conception et réalisation : service de la Communication / Photo : Pixtal / Impression : atelier d’impression de l’Arborial / avril 2017 / n° ISSN : 2264-6264