~~ ao'i.astroweb.cwru.edu/heather/323.17/ellipticals_rotation.pdf · galaxy ngc 3379. the dots...
TRANSCRIPT
~~ ao'I. ~.f~ ~~e¥"~'
dd- ozM.S ~~ -I'D~
_~~~h?
~ ~ -tk, ~ ~~~~~
.s~ ~E~. . .
_ ~ ~ z;:z~ .?
~ we. ~OId .s~ &~ ~
~f5 £S~~S~CD,vJ~?
~0t¥ ~z;J,d;;;"S i' I'J~ &. 8t~ . +~ ~J•.
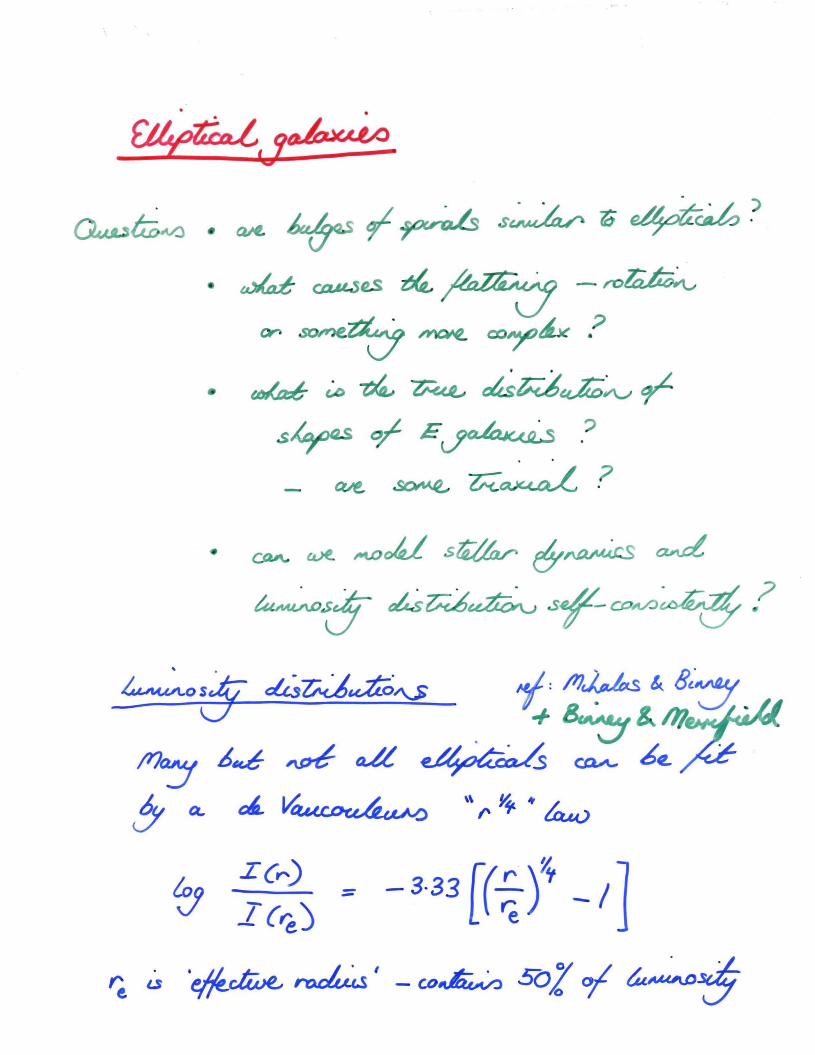
~ ~~ ~ rdt ~ <:aA- 6fl. .
!y Q. elL ~ \\f\~. ~
tot) I (",) ::: - 3·33 [i(.!:...)~ ]v T/ '\ . ~-I
-lteJ e
~ U .~~~t -CD~ solo! ~5

14 - I I. I
\ \
\ 16 \
\ NGC 3379 \
\
18
20
22 OIl
::l..
24
.26
28 \
\ \
30 \ \
\ 32
Figure 5-12. The brightness profile of the giant El galaxy NGC 3379. The dots and circles are photoelectric measurements by different observers along the galaxy's east-west profile. Note the beautiful fit to the ,1/4 law (see text) over 10 mag of surface brightness. [From C)6), by permission. Copyright © 1979 by the Am ~ j-:an Astronomical Society.]
~<>~f'ej~ ~ ~ co~A./J
[y~ ~s~~"-' o~ ..... ~L V<V<<HV;J
/l..- 6~ M.Dt4.h C<V\.. ,,¥,rodUCQ. ,r' If,. duus ... .. ,

L~~c fJ",j<k 1·· 0. ~J~ ~ ,,/ ~ .. y~ L _ _r ~~ /<. aAJi 0/ ~~ ~S
~~ CDt.StlS.

~6- Se-R. of ~ /oss-.£~ et#~ ~
.~--~~~ cI· Q. ~. 0dt, ~~ 6~
~ ~ b&~ Jd% k QQS~ .?
IS ....-----------....
~ ~
~ -lO
~
---------~&6'~ ~ ~ ~5" • f
. -r~
30
I r
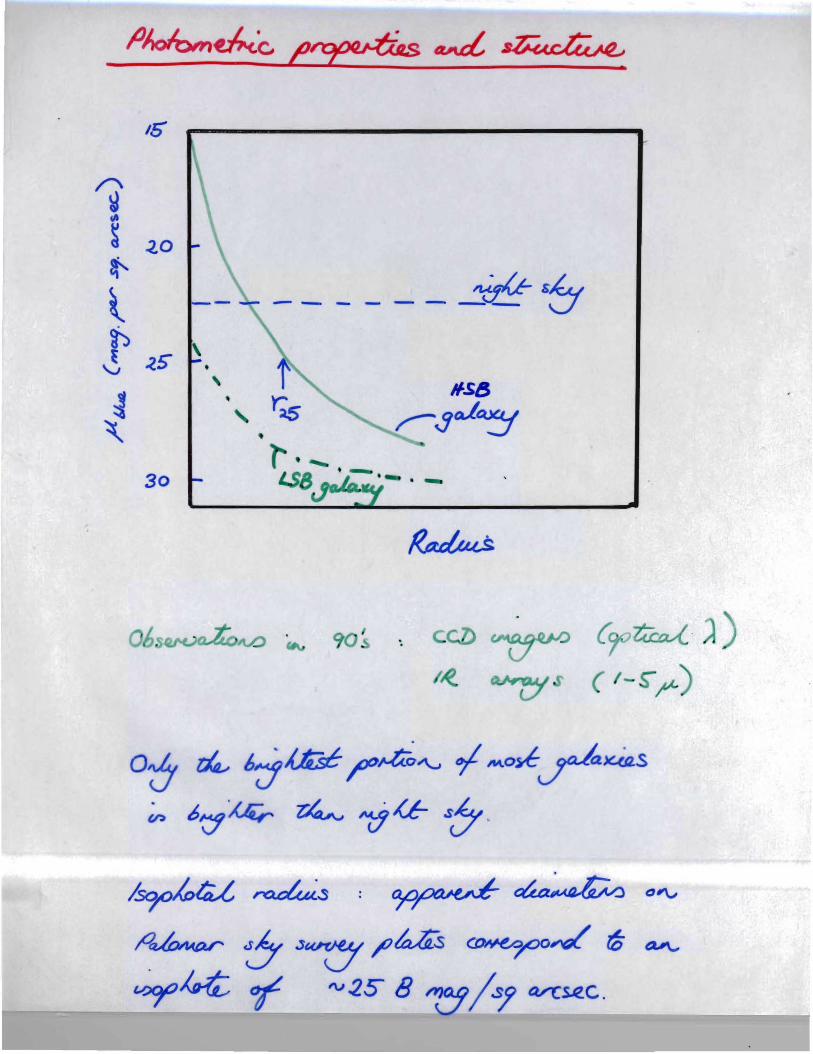
o~ l'4- "'jUilt~~"-' ~ _o~r~s
~ b\f4:r z:4v "&~ S&.
~It>~ raks : ry;~ ~ Qf\.,
"o~ & S~ /l1JiS ~~-t ~ 4'\
_~~v.xy;~ or 'V~5" 8 7:f/sl tVC~c'~__---1
NOAO/IRAF V2.10.4EXPORT massey.tofu Mon 08:57:31 19-Feb-96 [mnu18feb88.0003l: Tucson ZD=60 UT0520 2400. ap:1 beam:1
18 r-----...,....------,----~--- __----~---.............,
Spectrum of the Kitt Peak dark (moonless] sky19
1"\
~ ( jr~ L.J Q.)
<.n L.J 20 '-n::::s Q.)
'-ro ='
:- 21 Q.)
~
U"1 Q.)
~
='
j22
23
24 4000 4500 5000 5500 6000 6500
Wavelength (angstroms)
NOAO/IRAF V2.10.4EXPORT 4meter1 khaki Sun 02:16:21 01-Sep-96[skymag]: n6822forc-81 and sky! 600. ap:1 beam:1
16 r---r-----~-----r"------,----_r__---_r_-___,
6500 7000 7500 8000 8500 9000 Wavelength (angstroms)
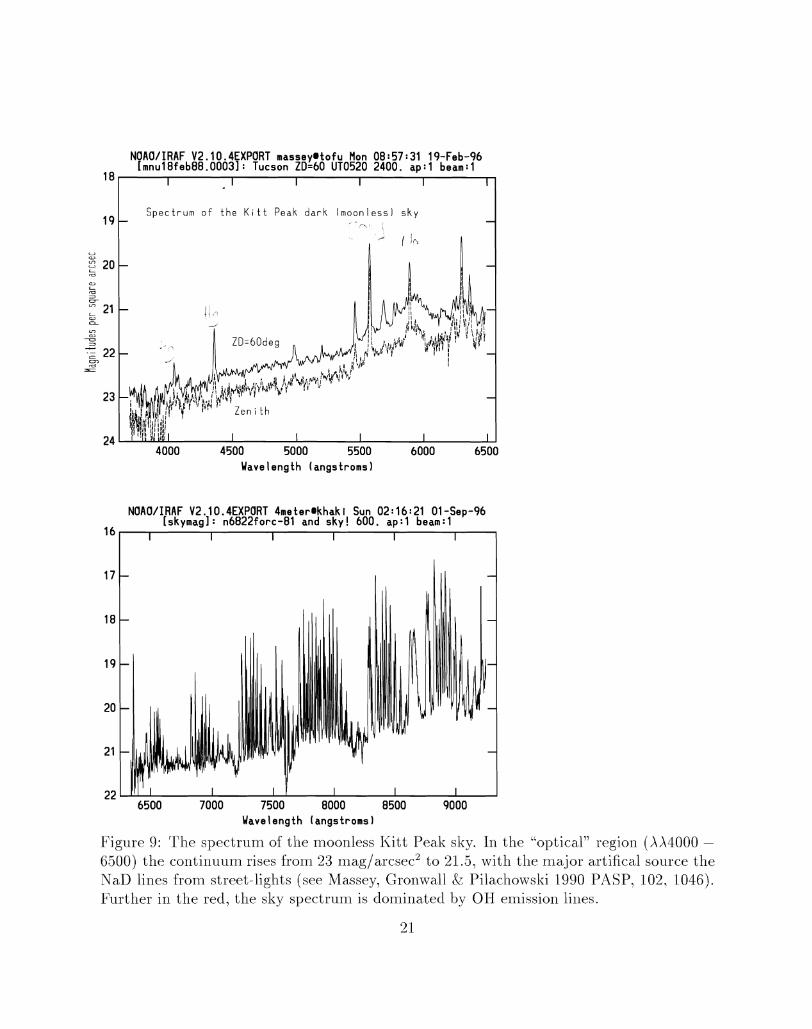
Figure 9: TIle spectruln of tIle moollless I{itt Peal< sky. In the "Ol)tical" regioll (AA4000 6500) the continuum rises from 23 Inagjarcsec2 to 21.5, \iVith tIle major artifical source the NaD lines frolll street-ligllts (see Massey, Grollwall & Pilacll0wski 1990 PASP, 102, 1046). Further in the red, the sky spectrum is dominated by OR elnission liIles.
21
17
18
19
20
21
22 a..........L.~L...- ....l.._ .............l..___.......... ___L.. ..........__......I

~~ts
%se ~~ a ~~ C&AAJ<U~) aa.st.o : c-.6~ ~ fjU 04.sUr.C~"V
~ QA.. ~~ ¥J~ ~ ~ ~
~~ td ~ /Qk',
2) . ~~'V ~ ~ ~/\aM.{J.
CfLoILs~ ~ ~ F rko$ , ~
fj'~
j-( )lr -e rL_,L
~ r 74rs ~~ ~~~ t:L ~ _)~udc~~~
~ rue. doCT ~ .... y.
II\,.
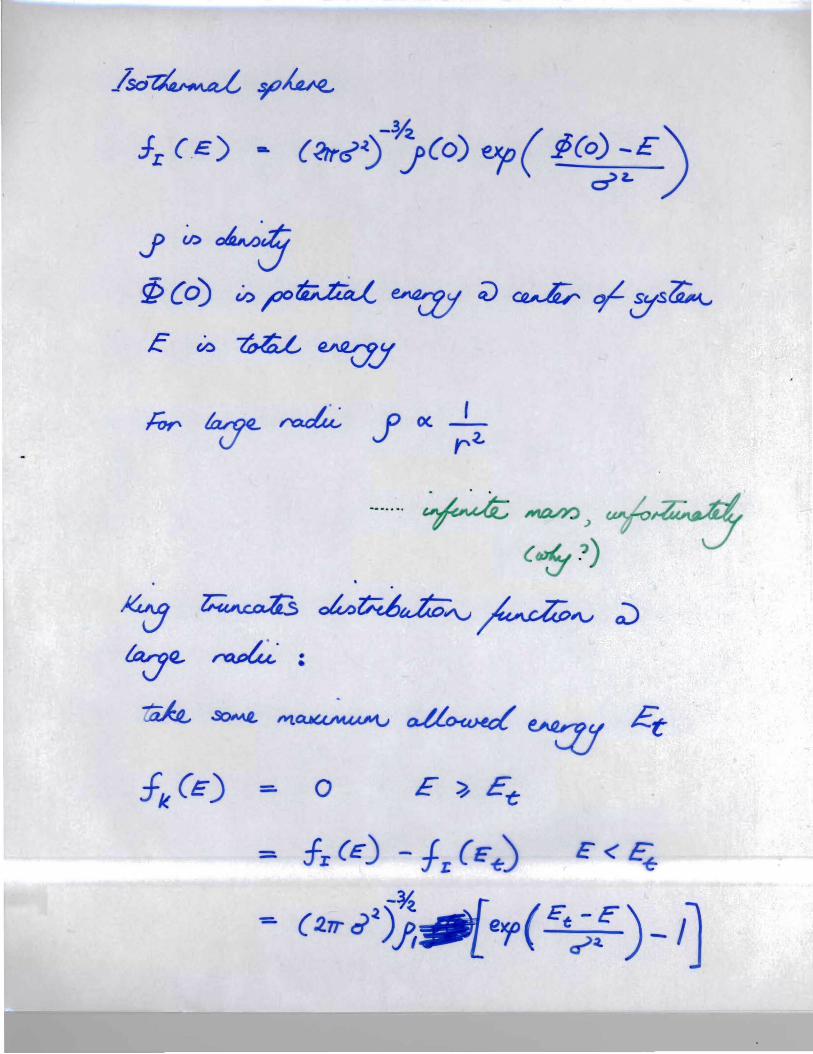
y v..~"5
~(o) .:o;oo~ ~ ;) ~ ~8"S~
E ~ loU ~y
hJr tarr-~ f ;?0{
. ' . ....... ~ ~~
( .) .. .
~ ~ ck~~"\.J ~"V ;;)
~e. ~':
10k ~ "'!~ ~~ Er
f (€) :=. 0 E~E-ck
= freE) -fr(E-t-) E<~
-~ J= ( 2.". d:l).It e~ ( E'e;a.E ) _ I

0.5
0.2
0.1
0.05 --.. tlll .2
0.02
0.01
0.005
0.002
0.001 0.1 0.2 0.5 1 2 20 50 100 200 500
Figure 5-9. Star-density profiles of globular clusters and dwarf ellipticals. The data points are for the Sculptor dwarf galaxy (~), the globular cluster NGC 5053 (0), and the globular cluster NGC 6388 (0). The curves are members of King's family of theoretical profiles and are labeled by their c values [c = log(rt/rc)]. The sets of data points have been shifted vertically and horizontally until their bestfitting King curves have rc = 1. [From data published in (HI), (11), (Kl).]
s~
58 fobJfU"' e&s~ 010 I1lG ) ~I( at.uaf(ol~~:s) .
eI.¥~ ..... s~~ :Y.j~ ..... ~
o/W'- wd1 # !i ~ M.OC!ds
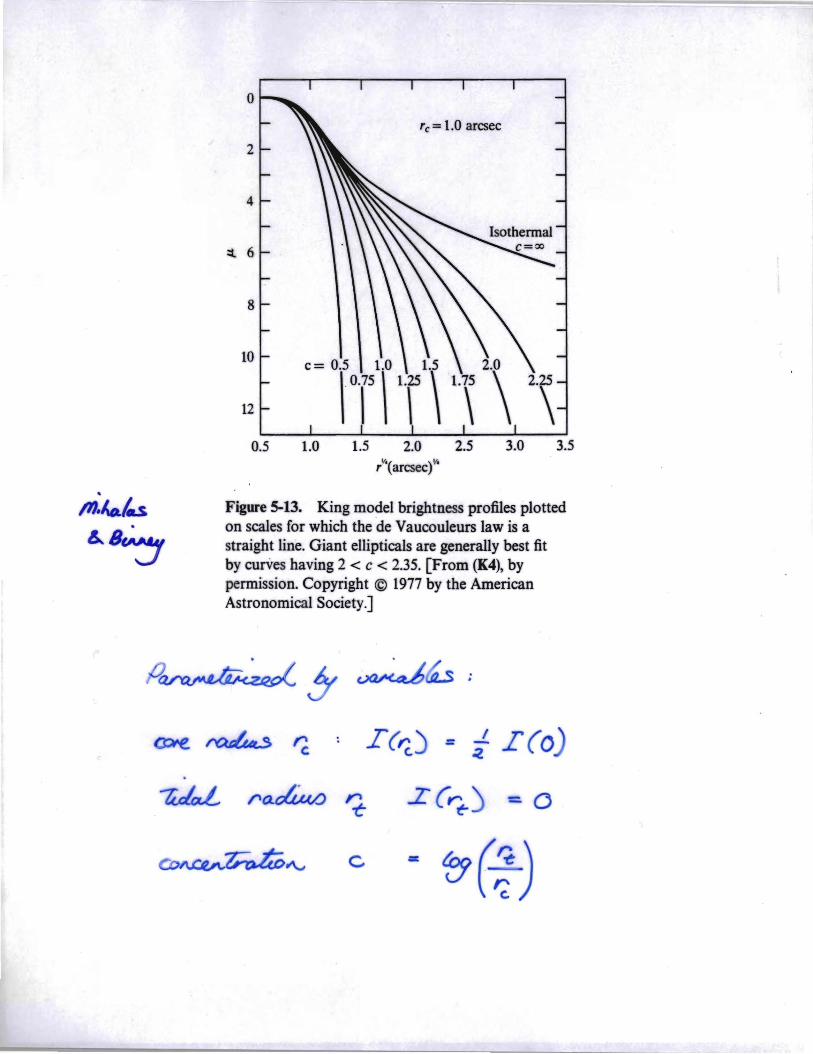
o 'c = 1.0 arcsec
2
4
:l 6
8
10
12
0.5 1.0 1.5 2.0 2.5 ,Y'(arcsecf"
Figure 5-13. King model brightness profiles plotted on scales for which the de Vaucouleurs law is a straight line. Giant ellipticals are generally best fit by curVes having 2 < c < 2.35. [From (K4), by permission. Copyright © 1977 by the American Astronomical Society.]
3.0 3.5
= :zI I(o
=0
c =
I
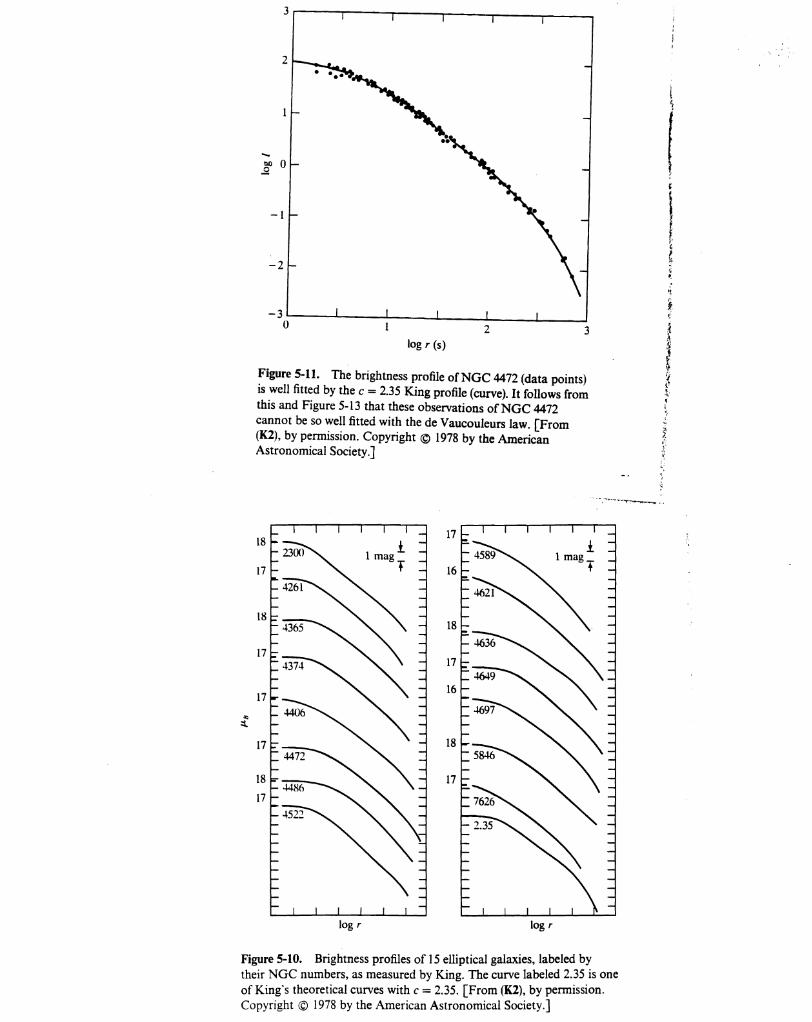
3r---.....--.......---,----r--__...,....__-..
2
t
00 0..Q ~.
-1
-2
log r (s)
Figure 5-11. The brightness profile ofNGC 4472 (data points) is well fitted by the c = 2.35 King profile (curve). It follows from this and Figure 5-13 that these observations of NGC 4472 cannot be so well fitted with the de Vaucouleurs law. [From (K2), by pennission. Copyright © 1978 by the American Astronomical Society.]
18
17
18
17
17
17
18
17
!1 mag
T
17
16
18
17
16
18
17
log r log r
Figure 5-10. Brightness profiles of 15 elliptical galaxies, labeled by their NGC numbers, as measured by King. The curve labeled 2.35 is one of King"s theoretical curves with c = 2.35. [From (1(2), by pennission. Copyright © 1978 by the American Astronomical Society.]

rU) ~. or -S<..cZ4iVl) A£ 0 ~ ~.~~
~~~
0
were calculated from the effective diameters, A.. in the ---- •
..... '" \j) \j)
~ 48
IJ
~ 250 M co .....
200
150
'"
U TO,T
100
50
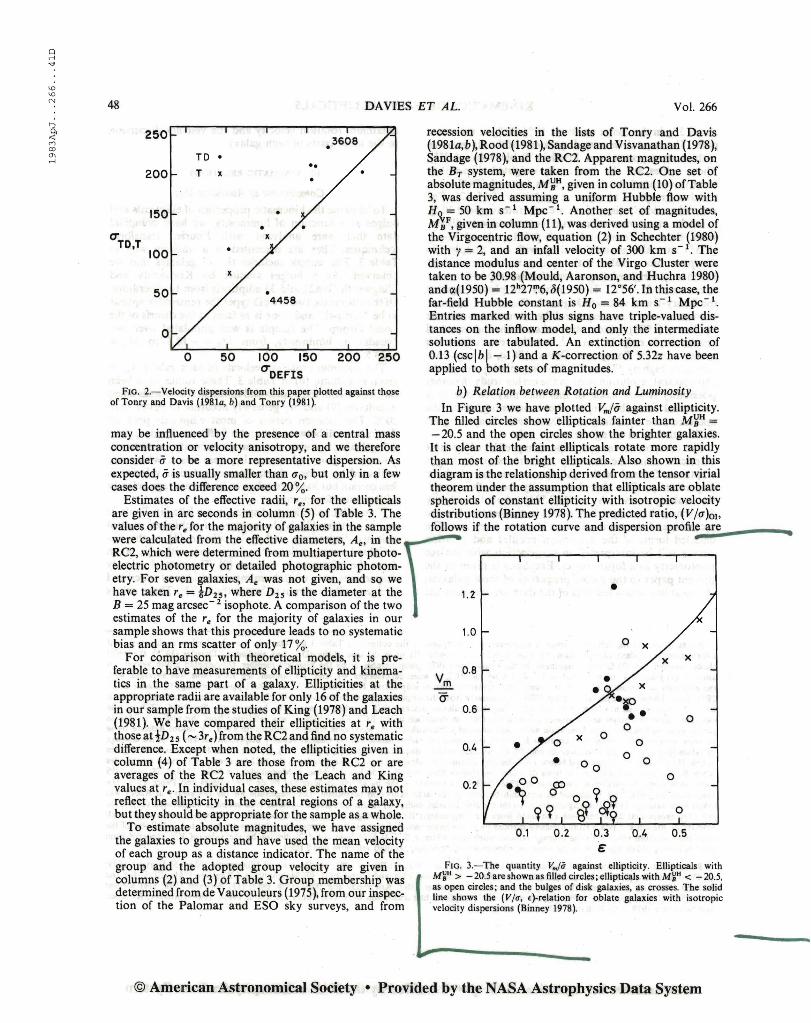
FIG. 2.-Velocity dispersions from this paper plotted against those of Tonry and Davis (1981a, b) and Tonry (1981).
may be influenced by the presence of a central mass concentration or velocity anisotropy, and we therefore consider ij to be a more representative dispersion. As expected, ij is usually smaller than 0"0, but only in a few cases does the difference exceed 20 %.
Estimates of the effective radii, r.. for the ellipticals are given in arc seconds in column (5) of Table 3. The values of the re for the majority of galaxies in the sample
RC2, which were determined from multiaperture photoelectric photometry or detailed photographic photometry. For seven galaxies, Ae was not given, and so we have taken re = iD B , where D2S is the diameter at the B = 25 mag arcsec- 2 isophote. A comparison of the two estimates of the re for the majority of galaxies in our sample shows that this procedure leads to no systematic bias and an rms scatter of only 17 %.
For comparison with theoretical models, it is preferable to have measurements of ellipticity and kinematics in the same part of a galaxy. Ellipticities at the appropriate radii are available for only 16 of the galaxies in our sample from the studies of King (1978) and Leach (1981). We have compared their ellipticities at re with those at tD2s (- 3re ) from the RC2 and find no systematic difference. Except when noted, the ellipticities given in column (4) of Table 3 are those from the RC2 or are averages of the RC2 values and the Leach and King values at reo In individual cases, these estimates may not reflect the ellipticity in the central regions of a galaxy, but they should be appropriate for the sample as a whole.
To estimate absolute magnitudes, we have assigned the galaxies to groups and have used the mean velocity of each group as a distance indicator. The name of the group and the adopted group velocity are given in columns (2) and (3) of Table 3. Group membership was determined from de Vaucouleurs (1975),from our inspection of the Palomar and ESO sky surveys, and from
DAVIES ET AL. Vol. 266
TO . .. T x
.
50 100 150 200 250 UOEFIS .
4458
recession velocities in the lists of Tonry and Davis (1981a,b), Rood (1981), Sandage and Visvanathan (1978), Sandage (1978), and the RC2. Apparent magnitudes, on the BT system, were taken from the RC2. One set of absolute magnitudes, M~H, given in column (10) of Table 3, was derived assuming a uniform Hubble flow with Ho = 50 km S-I Mpc- I . Another set of magnitudes, M~F, given in column (11), was derived using a model of the Virgocentric flow, equation (2) in Schechter (1980) with}' = 2, and an infall velocity of 300 km s- I. The distance modulus and center of the Virgo Cluster were taken to be 30.98 (Mould, Aaronson, and Huchra 1980) and (;((1950) = 12h27~6, 15(1950) = 12°56'. In this case, the far-field Hubble constant is Ho = 84 km S-I Mpc- I .
Entries marked with plus signs have triple-valued distances on the inflow model, and only the intermediate solutions are tabulated. An extinction correction of 0.13 (csclbl - 1) and a K-correction of 5.32z have been applied to both sets of magnitudes.
b) Relation between Rotation and Luminosity
In Figure 3 we have plotted Vm/a against ellipticity. The filled circles show ellipticals fainter than M~H = - 20.5 and the open circles show the brighter galaxies. It is clear that the faint ellipticals rotate more rapidly than most of the bright ellipticals. Also shown in this diagram is the relationship derived from the tensor virial theorem under the assumption that ellipticals are oblate spheroids of constant ellipticity with isotropic velocity distributions (Binney 1978). The predicted ratio, (V/O")Oh follows if the rotation curve and dispersion profil:e~a:.:.r~e .....
•
0.1 0.2 0.4 0.5
FIG. 3.:-The quantity V../ii against ellipticity. Ellipticals with M~H > -20.5areshownasfilledcircles;ellipticalswithM~H < -20.5, as open circles; and the bulges or disk galaxies, as crosses. The solid line shows the (V/lT, ()-relation for oblate galaxies with isotropic velocity dispersions (Binney 1978).
© American Astronomical Society • Provided by the NASA Astrophysics Data System