© anja g. burns / wwf-us review of trade in ornamental
TRANSCRIPT

1
© Anja G. Burns / WWF-US
Review of Trade in Ornamental Coral, Coral Products and Reef Associated Species to the
United States
November 2012
World Wildlife Fund, Washington DC

2
© WWF. 2012
All rights reserved.
This material has no commercial purposes. The reproduction of the material contained in this product is prohibited
for sale or other commercial purposes.
Any reproduction in full or in part of this publication must credit WWF as copyright owner.
The document was financed by Kingfisher Foundation.
The opinions, findings and conclusions stated herein are those of the author[s] and do not necessarily reflect those of
the donor and partner organizations listed in the acknowledgements.
Suggested citation:
Craig, V., Allan, C., Lyet, A. Brittain, A., Richman, E, 2011. Review of trade in ornamental coral, coral products
and reef associated species to the United States. World Wildlife Fund, Washington DC. USA,

3
Acknowledgements
Many people were involved in the production of this report.
The US trade data analyses in this report were produced by Valerie Craig and Arnaud Lyet PhD
The project was managed by and conclusions drawn by Crawford Allan
Research and case studies were provided by Anna Brittain and Eliza Richman
Additional research and product production by Ben Freitas
Aquaria trade research by Brendan Galloway
The production team would like to thank the following people for their critical inputs towards this report:
Environmental Defense Fund: Cara Cooper, Ted Morton
Defenders of Wildlife: Daniel Thornhill
Humane Society International: Teresa Telecky
WWF: America Pintabutr, Roberta Elias, Elizabeth Schuler,
TRAFFIC: Ernie Cooper, Steve Broad, Julie Gray for report reviews

4
Contents Acknowledgements .................................................................................................................................... 3
Executive Summary ....................................................................................................................................... 5
Introduction.................................................................................................................................................... 7
Trade and Use ................................................................................................................................................ 7
Impacts of Trade ............................................................................................................................................ 9
The U.S. Market for Corals and Reef-Associated Species .......................................................................... 13
Imports to the United States ................................................................................................................ 14
Volume of Imports ............................................................................................................................... 14
Origin of Imports ................................................................................................................................. 17
Purpose of Imported Products ............................................................................................................. 20
Source of Imported Products ............................................................................................................... 21
Primary Ports of Entry to the United States ......................................................................................... 23
Exports from the United States ............................................................................................................ 23
Key Species in Trade ................................................................................................................................... 28
Ornamental Fish Species in Trade ....................................................................................................... 28
Elegant and Endangered: The Banggai Cardinalfish from Indonesia.................................................. 29
Pet or Medicine? Seahorses: Hippocampus kuda ................................................................................ 32
Tridacna gigas – The heavyweight champion of mollusks ................................................................. 37
Underwater Finery – Precious Black and Gold Corals ........................................................................ 42
Conclusion ............................................................................................................................................... 48
Recommendations .................................................................................................................................... 50
Recommendations to the U.S. Government: ....................................................................................... 50
Recommendations to Marine Ornamental Industry: ............................................................................ 51
Recommendations to Civil Society: .................................................................................................... 52
References ................................................................................................................................................ 58
5
Executive Summary
The United States is the world’s largest consumer and importer of coral reef associated species for
ornamental purposes, including aquaria, jewelry, curio and home décor. Analysis indicates that the U.S.
market share of global imports is 63% and North America, as a whole, imports on average two thirds of
all organisms involved in the marine ornamental trade. This report analyses the trade of coral reef
associated species imported to the U.S. for ornamental purposes and examines issues and concerns related
to the harvest, supply chain, and overall trade of some of the most threatened species in the trade. The
analysis in this report covers the past decade of trade records from 2000 to 2009 and reveals, among other
data, that:
• Records of imports of coral products in the U.S. have shown a five-fold increase over the past ten
years;
• The most important genus of coral in terms of total import volume is Corallium species, with
imports over two and-a-half times greater than any other genus of coral.
• Imports of marine tropical fish imports have remained fairly steady with approximately 15
million marine fish imported each year;
• The imports of invertebrates, specifically for items such as jewelry, unlike that for corals and
marine tropical fish, have seen significant fluctuation in the ten-year period from 1999 to 2009,
with a clear downward trend since peaking in 2004;
• The area known as the Coral Triangle, (Indonesia, the Philippines, Malaysia, Solomon Islands,
Timor-Leste, and Papua New Guinea) continues to be the primary source countries for corals,
coral products and reef-associated species exported to the U.S.
• In terms of exports, the U.S. is a fairly small player, exporting just over 1% of the total
international trade in exports of coral reef associated species.
The collection of specimens for the ornamental trade can involve the use of destructive practices, such as
the use of cyanide, for collection of fish and invertebrates and the coral structures themselves. Many of
the target species live amongst the rocks and corals, which can be indiscriminately destroyed for the
collection of their inhabitants. Some species collected for trade are locally threatened species or the catch
rates, given the biology and status of the population of the species are indicative that the trade is
unsustainable. The collection practices involved in acquiring coral reef species for trade raise concerns,
including the use of toxins, overfishing, and survivability rates after being caught, among other issues.
Furthermore, there remain significant concerns surrounding the legal trade of threatened and/or
endangered species, such as Banggai cardinalfish, a popular species in the aquarium trade that lacks
international protections despite being listed as an endangered species by the IUCN Red List. The trade in
some species for traditional medicines, such as seahorses (Hippocampus spp.), as well as the illegal trade
of species, such as the giant clam (Tridacna gigas) and black and gold corals, also raise concerns
regarding the effectiveness of governments and international agreements, such as CITES, to ensure
adequate protections for vulnerable species.
These concerns suggest that governments, industry, and consumers, need to play a more active role in
ensuring that the trade in coral reef species does not continue to drive declines in vulnerable species.
Efforts to establish new import and export standards in the U.S., based on sustainability criteria, for
collection, handling, and transport activities should be developed, including strengthening and supporting
CITES as an instrument for effective regulation. Additionally, the U.S. government should establish additional data collecting requirements to improve the level of specificity of the species appearing in trade
to provide a more accurate picture of the animals in trade. Industry, too, should make greater efforts to

6
source the coral reef species they sell more responsibly, including through the establishment of
independent standards and certification for best practices to assist consumers wanting and willing to make
informed purchasing decisions regarding the origin and sustainability of coral reef species.
There is an opportunity and responsibility for the United States, through its purchasing power, to ensure
that the trade is conducted in a responsible manner. The U.S. role as the largest global consumer should
compel the government, the industry, and the consumers to become more active participants in the chain
governing the trade in coral reef species to ensure that the species harvested are done so both legally and
sustainably.

7
Introduction Coral reefs are among the most complex ecosystems on the planet. They form some of the most intricate
and varied marine habitats in the world, providing a home to a vast and dazzling array of marine
organisms. Fish, seabirds, sponges, jellyfish, worms, crustaceans, mollusks, sea snakes, sea turtles and
hosts of other marine life make their homes on coral reefs. A third of the world‘s marine fish species
(over 4,000 species), approximately 800 species of reef-building corals, and numerous marine
invertebrates, live in, on, or around coral reefs (Paulay 1997). Despite this biological richness, coral reefs
account for less than one quarter of 1% of the marine environment. Totaling an estimated 284,300 square
kilometers (109,800 sq. mi.), coral reefs around the globe occupy an area just half the size of France, with
coral reefs in the seas of Southeast Asia accounting for almost 30% of this total and those in Australia and
the Pacific accounting for roughly 37% (UNEP 2001).
Coral reef associated species include species that form the reef structure and species that live in and
around reefs. They rely on the reef for their existence. Reef-building species include corals, sea fans,
sponges and clams. Stony corals, or scleractinians, deposit hard calcium carbonate exoskeletons that form
the building blocks of coral reefs and provide habitat for thousands of reef associated species (Harrison
2011). Reef inhabitants include a multitude of invertebrate species, crabs, lobsters, shrimp, clams, conch,
snails, sea slugs, starfish, urchins etc. The fish living in and around the reef range from the tiniest blenny
to the largest of reef sharks. Reptiles such as sea turtles and sea snakes inhabit the reef as well. Coral reefs
are also vital to the world’s fisheries. They form nurseries for about a quarter of the ocean’s fish,
providing a source of food and livelihood for local communities and world markets (Paulay 1997). An
estimated one billion people depend on coral reefs for food and income, with direct and indirect benefits
of reefs estimated to value $375 billion each year (Costanza et al. 1997).
Scientists have documented that tropical coral reefs are being lost at a rate of two percent per year, which
is approximately twice as fast as rainforest destruction (Bruno et al. 2007). The causes of coral reef
decline can be as complex as the coral reefs themselves. Mass tourism, unregulated coastal development,
overfishing, land based pollution, coral bleaching resulting from global climate change, and ocean
acidification are all primary threats to coral reefs (Burke et al. 2011). Illegal, unregulated and poorly-
managed legal trade in coral reef species and destructive collection methods are also impacting the
resilience and survival of coral reefs. The degradation of coral reefs has been calculated to cost nearly
US$ 30 billion annually in net benefits that these ecosystems provide in goods and services to the global
economy – including tourism, fisheries, and coastal protection (Cesar 2003). By helping to prevent
coastal erosion, flooding, and the loss of property on shore, reefs save additional billions of dollars each
year by reducing insurance and reconstruction costs, eliminating the need for costly coastal defenses, as
well as reducing the costs of human displacement and loss of life.
The breathtaking beauty of coral reefs makes them natural works of art that capture the imagination. But
this quality is both a boon and a curse for reefs. Reefs are treasured for their biodiversity and economic
potential to encourage tourism. They also suffer from sometimes damaging extractive practices to meet
the demand by people who want to capture the essence of the reef’s beauty to adorn their own home or
business and some do not mind if the harvest was unsustainable or destructive.
Trade and Use
This report analyses trade to the U.S. of coral reef associated species imported for ornamental purposes.
The incredible diversity of these species and their uses in trade for ornament are typically grouped under
the following categories:

8
•Aquaria industry: live reef fish, invertebrates (corals, mollusks such as clams and snails, etc.) and
live rock.
•rnaments/home décor: dried and preserved dead stony (hard) corals and mollusk shells
(clams,conch, etc.).
•Jewelry: precious corals (black, red, pink, gold corals) and polished mollusk shells, some stony
corals.
•Curios: dried specimens of fish (seahorses, porcupine fish, etc.) and mollusk shells.
The aquaria industry often uses the generic term ornamental fish to describe aquatic animals kept in the
aquarium hobby, which includes fish, invertebrates such as corals and crustaceans, and live rock. Live
rock is a general term for any type of rock encrusted with, and/or containing within its crevices a wide variety of marine organisms, like algae and colorful sessile invertebrates.
Although the majority of people in the ornamental fish hobby keep freshwater aquariums, saltwater and
coral reef aquariums have become increasingly popular. Improvements in husbandry technology and
knowledge on captive husbandry have contributed to the growth in the number of hobbyists and therefore
supply of the marine ornamental fish trade. A rise in U.S. consumers’ ability to afford and maintain this
hobby has increased demand. Both have resulted in the growth of the marine aquaria industry. Between
1.5 and 2 million people have marine aquariums worldwide, with half in the United States and a quarter in
Europe (Green 2002). There is a lack of recent data on the size of the global trade in coral reef species,
with the most comprehensive assessment carried out more than eight years ago. However, according to
the 2003 data from the Global Marine Aquarium Database (GMAD), the most accurate approximation of
annual global trade encompassed 20-25 million marine ornamental fish, 11-12 million corals, and 9-10
million marine ornamental invertebrates (Wabnitz et al. 2003). At the time of the most comprehensive
review of incomes from the aquaria industry, the industry represented US$200-330 million annually
(Wabnitz et al. 2003). However, this growing industry has conservationists, scientists, policy makers,
business interests, and hobbyists concerned about its impact on the health and sustainability of coral reef
ecosystems around the world.
The demand for live corals for ornamental use has been growing as have the development of technologies
for keeping corals alive in aquaria. Because coral identification is difficult and requires expertise in coral
taxonomy, species in trade are more difficult to identify than marine fish and other invertebrates.
However, in trade data for CITES listed coral species is required by law and has to be as accurate as
possible, preferably to species level. In contrast, there are few trade regulations and trade data are
requirements for the vast majority of fish and invertebrate species in trade). Some estimates of the
composition and volumes of trade in marine ornamental species have been published and these include:
• 140 species of stony coral (almost entirely Scleractinia) in trade with 12 million pieces traded
annually, accounting for 56% of the total trade in coral (Wabnitz et al. 2003).
• 61 species of soft coral in trade with 400,000 pieces traded annually (Wabnitz et al. 2003).
• Drastic increases in the use of live rock due to the rise in popularity of reef tanks. Live rock is
traded in three varieties: Pacific, Atlantic and aquacultured (Wabnitz et al. 2003).
• Approximately 20-25 million marine ornamental fish are caught annually from over 50
taxonomic families and encompass 1,500 species (Monticini 2010).

9
• 516 invertebrate species in the aquarium trade, mostly mollusks, shrimps and anemones (Wabnitz
et al. 2003).
• Live giant clams constituting an increasing proportion of the invertebrate trade for the purpose of
aquaria due to the crucial role they play in removing nitrates, nitrites and ammonia from tank
water, which are poisonous in high quantities to other aquarium animals (Wabnitz et al. 2003).
Consequently, wild populations of giant clams have considerably deteriorated over the past 20-30
years even with the advent of aquacultured giant clams.
Marine curiosities (curio), ornaments, home décor and jewelry include a wide variety of dead marine
animals or plants, whether in part or whole, used for decoration. Coral and reef-related species that are
imported as curios are sold as a range of things from souvenirs to jewelry to arts and crafts and ornaments
(Grey et al. 2005). Mollusk shells and corals make up the majority of the invertebrate portion of the trade,
while preserved sharks, porcupine fish and seahorses make up the majority of the marine fish groups
encompassed in the trade (Grey et al. 2005). Corals used for jewelry command high prices due to limited
supply and are called precious corals because they are one of the most highly valuable marine resources
(Tsounis et al. 2010). This has led to major booms in the demand for coral jewelry, particularly for red
and pink corals (Coralliidae) (CITES 2010). Specific amounts of a given species are hard to classify
because when coral is sold as polished, finished product, such as beads, it is difficult to identify the
species (Tsounis et al. 2010).
Impacts of Trade The collection of specimens for the ornamental trade can involve the use of destructive practices for
collection of fish and invertebrates and the coral structures themselves. Many of the target species live
amongst the rocks and corals, which can be indiscriminately destroyed for the collection of their
inhabitants. Some species collected for trade domestically and even internationally are locally threatened
species or the catch rates, given the biology and status of the population of the species are indicative that
the trade is unsustainable. The collection practices involved in acquiring coral reef species for trade raise
concerns, including the use of toxins, overfishing, and survivability rates after being caught, among other
issues. It is possible to consistently harvest sustainably and in ways that are far less detrimental to the
species’ and reefs survival. However, these concerted efforts to manage reefs are not comprehensively
applied and the cheaper option for the quick profit more often prevails. Some of the main problems with
unsustainable and destructive practices are detailed here:
Cyanide Use
The use of cyanide in coral reef fish collection began in the 1960s in Taiwan and the Philippines. Cyanide
pellets are crushed and mixed with seawater in squirt bottles. Fishermen then squirt the mixture into small
openings in the reefs where fish frequently hide, stunning the fish and making them easy to capture. By
the mid-1980s some estimates suggested that at least 80% of all fish harvested in the Philippines for the
aquaria trade were caught using cyanide; by the 1990s use spread to Indonesia, where over 90% of boats
transporting live fish had cyanide on board (Wabnitz et al. 2003). Cyanide use continued to spread to
Thailand, Papua New Guinea, Malaysia, Vietnam, the Maldives and Yemen, and it is estimated that at
one time approximately 150,000 kg were used every year (Monticini 2010). The use of cyanide weakens
fish and results in high mortality rates of fish post capture (Rubec 1987). Cyanide also destroys coral
ecosystems and causes accidental deaths of non- target specimens. The rate of death within hours of
collection of fish caught using the toxins is estimated at the high end to be 75% mortality; 20% to 50%
die after a couple of hours, and an additional 25% to 30% die before export (Wabnitz et al. 2003).
Furthermore, retail outlets commonly report a 30% to 50% mortality rate upon arrival (Wabnitz et al.

10
2003). While fishing with cyanide is now illegal in most countries – in Indonesia for example, it is
punishable by fines up to US$12,000 (Wabnitz et al. 2003) – in much of the world those tasked with
enforcing these laws are easily avoided due to the fast acting nature of cyanide, or bribes can be paid,
resulting in the widespread use of cyanide throughout the Asia-Pacific region (Donnelly et al. 2000).
Over Exploitation
A study on the effects of collecting fish for the aquarium trade showed that 8 of the 10 most commonly
traded species declined in abundance from as much as 57% to as low as 38% compared to an area where
no fishing took place (Tissot 1999). Unsustainable fishing results in shifts in fish size and species
composition within coral communities, which may precipitate large-scale ecosystem changes alone or
when combined with other threats (Burke 2011). For example, unsustainable fishing of large predatory
and herbivorous fishes is blamed (or pointed to) as the beginning of the end for some Caribbean reefs
(Mumby 2006). In the absence of predators and competing herbivores, the long-spined sea urchin became
the primary control of macro algae levels on these reefs. Their increased population density left the sea
urchins extremely susceptible to an unknown disease that killed off over 90% of the species in the
Western Atlantic in 1982. This in turn led to algal overgrowth and the decline of reefs in the region (Cesar
2003).
Poor Maintenance of Live Animals in Trade
One estimate of the rate of mortality of tropical fish prior to reaching the aquarium market is estimated at
80% (Monticini 2010). However, it is hard to accurately quantify these results as the mortality rates post-
import are largely not systematically quantified or made public “due to the sensitivity of such
information”, which could portray the industry in a bad light if high mortality rates are recorded (Wabnitz
et al. 2003). The mortality is due to physiological damage, use of chemicals (such as cyanide), disease,
and inadequately following procedures of stocking and shipping. Approximately 15% of fish die
immediately upon being caught, 10% during transport and 5% while in stocking stations (Monticini
2010). Once at a stocking facility, fish are quarantined for anywhere between a few hours to a few
months. Some fish are starved for a minimum of 48 hours prior to shipment, to prevent regurgitation of
food and decrease fecal excretion to avoid fouling of the water. (Wabnitz et al. 2003, Monticini 2010).
Depending on the species, fasting may last up to 10 days upon arrival (Monticini 2010). Because the
mortality rate is so high, significantly more fish are caught than become part of the trade. Post-harvest
mortality levels are lower for corals and invertebrates than fish, yet more coral and live rock is harvested
and therefore killed, than go into trade, as some pieces are ultimately deemed unsatisfactory and don’t
enter international trade.
Source Countries and Consumer Markets The number of countries participating in the trade of coral reef species includes about 45 importing and
exporting nations. The most current estimate show that the majority of organisms – fish, corals, live rock,
and other invertebrates – captured for the global marine aquarium trade originate from the Western
Pacific (85%), with smaller contributions originating from the Caribbean (6%), and from the United
States (6%) (Green 2002). More specifically, previous reports have shown that:
• In 2002, 99.5% of the trade in coral originated from the Western Pacific (Green 2002). The
majority of the trade is collected from an area known as the Coral Triangle, which refers to a
roughly triangular area of the incredibly biologically diverse tropical marine waters of Indonesia,
Malaysia, Papua New Guinea, Philippines, Solomon Islands and Timor-Leste and that contains at
least 500 species of reef-building corals in each ecoregion. Tonga, Vanuatu, and Bali also

11
participate in the trade within the region. Since the late 1980s, Indonesia has been the largest
coral exporting country with 71% of global trade for all coral species (Wabnitz et al. 2003).
• Fiji and Indonesia are currently the world‘s largest suppliers of live rock (Livengood 2011).
However, since much of the harvested rock is deemed unsuitable for trade and thrown back, true
collection figures are undoubtedly much higher than reported trade (Wabnitz et al. 2003).
• 85% of fish in the marine ornamental trade are from the West Pacific (Green 2002). The
Philippines, Indonesia, the Solomon Islands, Sri Lanka, Australia, Fiji, the Maldives and Palau
represent 98% of the total number of fish exported between 1997 and 2002 (Wabnitz et al. 2003).
• By 2002 75% of marine invertebrates for the aquaria trade originated from the West Pacific
(Green 2002).
The marine aquarium trade is a fairly large industry in some of the source countries, in Sri Lanka, for
example, it is estimated that over 50,000 people are directly involved in the export of marine ornamentals
(Wabnitz et al. 2003).
There have been several studies looking at the trade flows of coral reef species internationally,
particularly the report by the United Nations Environment Program (UNEP) World Conservation
Monitoring Centre in 2003 (Wabnitz et al. 2003). The UNEP report identified the U.S. as the largest
single global consumer market for coral reef associated species. The report stated that the U.S. imported
more than two thirds of global supply and the E.U. was the second largest importer, with a small number
of other countries importing. UNEP estimated that the United States imported 3.9 million specimens of
live corals each year (73% of total live coral trade globally). The report also cited that the U.S. imported
80% of the total market share of stony corals, and 64% of the total trade in soft corals (Wabnitz et al.
2003). The specific break down of primary importers of hard/stony corals by country was the United
States, Japan, Germany, France, China, Canada, the Netherlands and the United Kingdom; importing over
95% of all live corals traded globally (Wabnitz et al. 2003). According to this 2003 UNEP report, the
United States accounted for 73% of total live coral imports; with 14% by the EU, 7% by Japan, 2% by
Canada and 1% by the Republic of Korea (Wabnitz et al. 2003). A study by TRAFFIC in 2007 that
analyzed global wildlife trade showed that, with the trade in ornamental corals only, the U.S. and the E.U.
continued to dominate imports. However, this more recent analysis by TRAFFIC indicated that the U.S.
market share had declined to 63%, even though the overall volume of U.S. imports increased (Engler and
Parry-Jones 2007).
The absence of updates in information on the levels of trade and the changes in data that have been
observed with more recent examinations, highlight the need for a new analysis of trade data. The
information in the main results section of this report updates the data for the U.S. trade in coral reef
associated ornamental species to provide the latest insights into the trade dynamics.
Description of the Supply Chain
The supply chain for the marine ornamental trade is organized in a complex and extremely variable
manner, involving a series of collectors/fishers, wholesalers, middlemen, trans-shippers, manufacturers,
artisans, exporters and importers, wholesalers, and finally retailers. The majority of collectors are small-
scale fishermen who either work alone or in small groups and are either self-employed or work for
wholesalers and exporters. Techniques vary based on the organisms, but rudimentary, artisanal equipment
such as hand nets and fishing lines are most often used in the harvesting of live species (Wabnitz et al.
2003). For deeper water, precious corals dredging may be used or scuba collection where depths are not
prohibitive.

12
Upon capture, corals, fish and invertebrates are separated. Where facilities exist, and where the supply
chain is longer and more involved, the catch is typically brought back to a stocking area on the same day
it is captured. However, this is less important for species that are traded as dead specimens like precious
corals that are used for jewelry or corals and mollusks that are used as curios. The corals are sorted into
groups based on their growth form and wrapped securely and packaged depending on whether their use is
for live trade or dried home décor, jewelry etc. The corals and live animals are boxed, loaded into an on-
site container and taken to the wharf or airport for overseas dispatch. Live fish and corals have to be sent
by airfreight or express air courier to avoid undue mortality caused by lengthy transit times. Large bulk
shipments of dried stony corals may be shipped by sea freight as it is cheaper than air freight and time
sensitivity does not apply. Within the importing country, the shipments pass clearances and checks by
border agencies such as customs to check permits such as CITES where relevant and deal with import
duties, tariffs, and other documentary requirements. The corals, invertebrates, and fish are sent to the
wholesaler‘s warehouse, often using a broker to facilitate shipments. From the wholesaler the wildlife is
then distributed to various retailers.
The Role of the United States
The United States is the world’s largest consumer and importer of coral reef associated species for the
aquarium, home décor, and jewelry industries (Tissot et al. 2010). Most research and estimates in the
literature agree that North America imports on average two thirds of all organisms involved in the marine
ornamental trade (e.g. Green 2002). Through its purchasing power, there is an opportunity and
responsibility for the United States to ensure that the trade is conducted in a responsible manner. The
following trade analysis aims to generate greater understanding of the U.S. trade, and in doing so, to
provide indicators for the trends in the harvest in marine ornamental species from source country coral
reefs.

13
The U.S. Market for Corals and Reef-Associated Species
It is clear that the United States is the most significant consumer market globally for corals and reef
associated species, across the broad spectrum of use for these species ranging from aquaria,
ornamentation, pharmaceutical and household purposes (see the Introduction and references therein). The
U.S. is the top importer of corals, with almost 65% of all global imports in 2005 (Engler and Parry-Jones
2007).
The following section of the report covers new trade data analysis regarding imports of coral reef species
into the U.S. This is to compare with the literature review summarized earlier in the report and to provide
the latest assessment of the trade volumes, flows and trends in the U.S.
Aquarium fish prepared for live fish export. Copyright Tanya Petersen/WWF-Canon
Trade Analysis: Method and Data Sources The volumes and frequency of imports are very large; the records held by the USFWS show on average
nearly half a million import records per year of coral reef associated species. Data was requested from the
USFWS Law Enforcement Management Information System (LEMIS) through the Freedom of
Information Act (FOIA). Data obtained included all wildlife trade records for the years 2000-2009, which
totaled approximately four million records. The analysis began by eliminating all records that were
clearly not corals or species that inhabit coral reefs (mammals, reptiles, etc.). Then, by focusing on
records where a genus was listed (including where genus was a category such as “Other live invertebrates”), each genus was reviewed to determine its relevance as a reef-associated species. For the
purpose of this analysis, the term “associated” means that the species (or vast majority of species in a

14
genus where only genus was specified) lives in or on the reef and/or collection of the species could have
an impact on the reef. While numerous records are reported by weight rather than number of specimens,
this analysis only included those reports recorded by number of specimens. This preliminary work
resulted in approximately 800,000 remaining records to be used for the final trade analysis.
One of the difficulties with LEMIS data is the lack of consistency in the units used in recording
shipments; shipments may be recorded by number of items or by weight. The vast majority of corals and
reef-associated species imported to the U.S. are accounted for by number of items, therefore any
shipments recorded in units other than number (kilogram, etc.) were not counted in this analysis. In
consideration of the two factors listed above, namely the subjectivity of species/genera included in the
analysis and the elimination of all shipments measured in units other than number, any actual numbers
listed in the report for total imports and/or exports (such as total imports, imports of corals, number of
shipments from a particular country, etc.) for a given year or period of years should be considered a
conservative estimate. Rather than focus on absolute number, the value of the analysis is in gauging the
relative differences among groups/years and trends in trade.
Imports to the United States In reviewing imports of corals, coral products and reef-associated species, it is useful to break total
imports into the three primary categories of corals, fish, and invertebrates other than corals. CITES
regulates trade in stony corals and therefore there are systems in place to monitor and manage trade and
permits are required for international trade. Most other marine species from coral reefs that are in trade
for ornamental use are not controlled under CITES. Thus, there are reporting requirements under CITES
that are upheld by the USFWS, and the data for CITES species such as stony corals are much more
detailed, and data can be considered to be more reliable is available for a longer time-scale. Thus, the
trade analysis regarding corals and coral products addresses trade for the years 2000-2009. Trade in
invertebrates reflects data from the same time period, 2000-2009, while marine tropical fish imports were
reviewed for five years of data, 2005-2009. The U.S. Fish and Wildlife Service changed the way in which
they record imports of tropical fish between the years 2003-2004. Previously, the vast majority of tropical
fish imports were held under a generic “tropical fish” category; however, after 2004 the records were
separated to identify marine and freshwater fish as different groupings for the purposes of recording
import and export data.
Volume of Imports
Figure 1: U.S. Imports of Corals and Coral Products (No. of specimens), 2000-2009
0
2000000
4000000
6000000
8000000
10000000
12000000
1999 2000 2001 2002 2003 2004 2005 2006 2007 2008 2009 2010
Source: TRAFFIC analysis of USFWS LEMIS data, 2011

15
In the United States, records of imports of coral products have shown a five-fold increase over the past
ten years (Figure 1). From 2003 through 2007 the import volume was fairly steady, with a sudden jump in
2008 and 2009. This increase can largely be attributed to a growth in exports from China; whether that
increase is an actual one or simply reflects a change in data reporting will be discussed in more detail in
the section regarding countries of origin.
Over the past decade, the most important genus of coral in terms of total import volume is Corallium
species, with imports over two and-a-half times greater than any other genus of coral. Corallium,
otherwise commonly known as “red/pink” or “precious” coral, is primarily used for jewelry. While most
Corallium imports originate in the tropical waters of the Coral Triangle, the most important species for
trade purposes (preferred, more valuable) in the genus, C. rubrum, is found in the colder, deeper waters of
the Mediterranean (Göthel 1992).
Figure 2: U.S. Imports of Marine Tropical Fish (No. of specimens), 2005-2009
Since reporting of marine tropical fish imports became more specific and consistent in 2005, import
numbers have remained fairly steady with approximately 15 million marine fish imported each year,
although the overall trend is showing a decline (Figure 2). Because the majority of marine tropical fish
imports are simply identified as “Tropical Fish, Marine Spp.” rather than by genus and/or species, it is not
possibly to accurately identify the top imported species by the import records alone. Information
regarding species imports is provided in the industry overviews, highlighting those genera and species of
particular importance to the various industries that depend on trade in reef-associated species.
0
5000000
10000000
15000000
20000000
2004 2005 2006 2007 2008 2009 2010
Source: WWF analysis of USFWS LEMIS data, 2011

16
Tropical reef fish collector using cyanide to capture deep water species, Indonesia. Copyright naturepl.com/David
Fleetham/WWF-Canon

17
Particularly with fish and invertebrates, numbers in trade should be considered relative rather than
absolute as numerous shipments of these species are recorded by weight rather than number of specimens,
yet only those shipments recorded by number of specimens have been included in this analysis. In the
case of marine tropical fish it is important to note that, while many fish products may be recorded by
weight, the vast majority of products associated with coral reefs are imported live for the marine
aquarium trade and are recorded by number of individuals. This is evidenced by the number of products
overall imported live, which tracks closely with imports of marine tropical fish. Those fish products
recorded by weight are generally less relevant for the purposes of this analysis as they are primarily not
reef-associated species or are imported in very small quantities.
Figure 3: U.S. Imports of Other Live Invertebrates (No. of specimens), 2000-2009
Unlike the data for corals and marine tropical fish that show clear trends in import volume, the imports of
invertebrates has seen significant fluctuation in the ten year period from 1999 to 2009, with a clear
downward trend since peaking in 2004 (Figure 3). Interestingly, imports of items listed as “jewelry” have
seen fluctuation over the years, corresponding with a high degree to the fluctuation in invertebrate
imports, particularly the shelled species that are utilized in jewelry. As with fish, the majority of
invertebrate imports are not identified by their specific genus or species but are rather lumped into a broad
category of “Other Live Invertebrates;” thus making it virtually impossible to identify those genera or
species imported in the greatest volume.
Origin of Imports Map 1: Imports of Corals and Reef-associated Species by Origin, 2005-2009
0
40000000
80000000
120000000
160000000
200000000
1999 2001 2003 2005 2007 2009
Source: WWF analysis of USFWS LEMIS data, 2011

18
Figure 4: U.S. Imports of Corals and Reef-associated Species by Origin (Top Countries), 2005-2009
Asia, and specifically the Coral Triangle, continues to be the primary area from which corals, coral
products and reef-associated species imported to the U.S. originate. For all products combined, the top
countries of origin for the period examined are Indonesia, China, the Philippines, Japan, and Australia
(Figure 4).
0%
10%
20%
30%
40%
50%
60%
70%
80%
90%
100%
2005 2006 2007 2008 2009
Australia
Philippines
Japan
China
Indonesia
Source: WWF analysis of USFWS LEMIS data, 2011
Source: WWF analysis of USFWS LEMIS data, 2011

19
Figure 5: U.S. Imports of Corals by Origin (No. of specimens), 2000-2009
For coral products, a few countries in particular play a key role. Indonesia has remained a steady source
of coral and coral product imports to the U.S. throughout the period 2000-2009, with imports hovering
around 1 million items per year. However, in recent years China has become a significant player. The
years 2004, 2006, and 2007 saw spikes of imports from China up over 2 million items in each of those
years; then, from 2007 to 2009, import numbers have jumped tremendously to between 5 and 6 million
items per year, with 2008 as the peak year (Figure 5).
It is important to note that China is likely not the primary country of origin for all of the coral products
exported. Rather, China is a major center for processing of coral products into finished items such as
jewelry or items for home décor. The question raised by import data is why exports from China to the
U.S. increased so dramatically from 2007 to 2009; a question for which there are a number of potential
explanations. In 2008, China requested that a number of species of Corallium be listed in Appendix III of
CITES, resulting in the requirement of appropriate CITES documentation for all exports of these species
from China (FWS, 2008). It is plausible that this increase in paperwork resulted in an improvement in
documentation for many of the coral products exported by China, thereby ensuring that coral jewelry
products in particular are now identified as wildlife products and accounted for in wildlife trade data.
Figure 6: U.S. Imports of Marine Tropical Fish by Origin (No. of specimens), 2005-2009
0
1000000
2000000
3000000
4000000
5000000
6000000
7000000
2000 2001 2002 2003 2004 2005 2006 2007 2008 2009
China
Indonesia
Taiwan
Japan
Italy
Source: WWF analysis of USFWS LEMIS data, 2011

20
The primary countries of origin for imports of marine tropical fish have been more consistent from 2005
to 2009. Since 2005, the top two countries of origin for marine tropical fish have been the Philippines and
Indonesia, with the Philippines consistently the top country of origin for exports to the U.S.
Purpose of Imported Products
When wildlife products are imported to the United States, the exporter must state the purpose for which
the products will be used. While there are a wide range of purpose categories ranging from use in botanic
gardens to hunting trophies to traveling exhibitions, the primary purpose for coral products and reef-
associated species is commercial trade. This broad category simply identifies the product as having
commercial value and that it will be sold to an end-user in the U.S. or re-exported. Over 99% of all corals,
coral products and reef-associated species that enter the U.S. are identified as items for commercial trade.
Among the remaining imports, the identified purpose varies by product type.
Figure 7: Stated purpose, other than commercial trade, for U.S. coral imports (No. of specimens), 2005-2009
0
1000000
2000000
3000000
4000000
5000000
6000000
7000000
8000000
2005 2006 2007 2008 2009
Philippines
Indonesia
Sri Lanka
Singapore
Thailand
0
1000
2000
3000
4000
5000
6000
7000
2005 2006 2007 2008 2009
Scientific
Personal
Breeding
Educational
Traveling Exhibitions
Biomedical Research
Zoos
Reintroduction to the Wild
Hunting Trophies
Source: WWF analysis of USFWS LEMIS data, 2011
Source: WWF analysis of USFWS LEMIS data, 2011

21
For coral imports from 2005 to 2009, 99.9% of imports were for commercial trade. The most frequently
stated purposes other than commercial trade for importation are scientific and personal use . Although
imports for captive breeding operations were relatively high in 2005, no imports for breeding purposes
were recorded in 2008 and 2009.
Figure 8: Stated purpose, other than commercial trade, for marine tropical fish imports (No. of specimens),
2005-2009
As with coral products, 99.9% of marine tropical fish imports from 2005 to 2009 were for commercial
trade. The remaining trade was for a variety of purposes, primarily personal use, scientific purposes and
hunting trophies. Notably, there were no imports hunting trophies in 2009. Also notable is the increase in
imports for biomedical research; while there were almost no imports for this purpose in 2005 and 2006,
2007 saw a dramatic increase with still significant, although lower, import numbers in 2008 and 2009.
Source of Imported Products
Along with information regarding purpose, origin and other aspects, exporters must also report on the
source of their products. The two broad categories for source are specimens taken from the wild and
animals bred in captivity. For the purpose of this analysis, the latter category includes all of the primary
definitions used by the U.S. Fish and Wildlife Service: 1) animals bred in captivity, parts and derivatives;
2) species listed in CITES Appendix-1 animals bred in captivity for commercial purposes; and 3) animals
born in captivity that do not fulfill the definition of “bred in captivity” under CITES rules (Resolution
Conf. 10.16) (USFWS-OLE, 2009).
The vast majority of corals, coral products and reef-associated species imported to the U.S. are taken from
the wild. From 2005-2009, approximately 95% of all imported items were from wild sources.
0
2000
4000
6000
8000
10000
12000
2005 2006 2007 2008 2009
Personal
Scientific
Hunting Trophies
Biomedical Research
Reintroduction to the Wild
Breeding
Educational
Zoos
Source: WWF analysis of USFWS LEMIS data, 2011

22
Figure 9: Captive and Wild Sourcing of U.S. Imports, 2005-2009
i All Species
ii Coral Products iii Marine Tropical Fish
As demonstrated previously, the total imports of coral products have seen a dramatic increase in the past
two years. However, the increase in imports, average for the period of 2005-2009 has primarily been met
with products from the wild, as imports from captive-bred operations have remained fairly stable (Figure
9).
For marine tropical fish, percentages have remained fairly consistent since 2005, with the majority of
products originating in the wild. On average, only 5% of marine tropical fish imports are captive-bred,
while the remaining 95% are taken from the wild. However, it is worth noting that there is no legally
consistent way to label non-CITES species of captive bred fish, corals or invertebrates, which could be
preventing the data from accurately reflecting the true volume of captive bred species in trade.
Source: WWF analysis of USFWS LEMIS data, 2011

23
Primary Ports of Entry to the United States
Map 2: Primary Ports of Entry for Corals and Reef-Associated Species, 2005-2009
Los Angeles is overwhelmingly the most important point of entry overall for shipments of corals, coral
products and reef-associated species. Los Angeles accounts for over 50% more imported product than the
ports of New York and Newark combined, which together make up the second most important port of
entry for these products. Perhaps unsurprisingly, the ports of New York and Newark combined make up
the primary port for products that are re-exported, followed by Chicago, Anchorage and Miami.
The picture changes slightly when looking at individual product categories. Los Angeles remains the
primary port in all cases; however, although Miami is not high in relative significance for imports of coral
products it is the second biggest port for imports of marine tropical fish.
Exports from the United States
Although the major role of the United States in the market for corals and reef-associated species is as an
importer, the U.S. also plays a role in the export market, albeit a very small role, particularly when
compared to the major exporting nations of the Coral Triangle. For the years 2005-2009, trade records for
exports from the United States were just over 1% of the total international trade in coral reef associated
species; with the remaining records consisting primarily of import records with a small percentage of re-
export records.
As with the analysis of import data, the trade analysis regarding the exports of corals and invertebrates
will address trade for the years 2000-2009, while marine tropical fish exports will only be reviewed for
the five years of data, 2005-2009.
Source: TRAFFIC analysis of USFWS LEMIS data, 2011
Los Angeles
New York
Chicago Newark
Miami
Seattle

24
Volume of Exports
Figure 10: U.S. Exports of Corals and Coral Products (No. of specimens), 2000-2009
As demonstrated in Figure 10 above, coral exports have been generally very low over the past ten years,
with the exception of 2003 and 2007 in particular. Over 85% of shipments of coral and coral products
from the U.S. contain fewer than ten items, with almost 60% of shipments only containing one item. In
2003, there were three particularly large shipments, two of which had over 5,000 specimens of cultivated
(captive bred) live bubble coral (Physogyra spp.) destined for Ireland. The peak in 2007 can be largely
attributed to a single shipment of 10,000 specimens of live, wild elkhorn coral larvae (Acropora palmata)
collected after spawning. This species is critically endangered and has been listed on CITES Appendix II
since 1985, which means that permits are required for export; this particular shipment was for scientific
purposes and was shipped to the Rotterdam Zoo in the Netherlands.
In the LEMIS trade records, corals are, for the most part, identified by genus and are not lumped into
broad categories like the majority of fish and invertebrates. For this reason, it is possible to look at the
particular genera most prevalent in the U.S. trade. In the last ten years, the genera that have seen the
highest exports are Physogyra and Acropora, which is not surprising given the few high-volume
shipments noted above.
Figure 11: U.S. Exports of Marine Tropical Fish (No. of specimens), 2005-2009
Export volumes of marine tropical fish have held fairly steady for the past five years, with a dip in 2007.
As noted previously, the majority of trade records for marine tropical fish are classified in the broad
0
2000
4000
6000
8000
10000
12000
14000
1999 2000 2001 2002 2003 2004 2005 2006 2007 2008 2009 2010
0
50000
100000
150000
200000
2004 2005 2006 2007 2008 2009 2010
Source: WWF analysis of USFWS LEMIS data, 2011
Source: WWF analysis of USFWS LEMIS data, 2011

25
category “Tropical Fish, Marine Spp.” so it is not possible to comment on the primary species exported
from the United States. The vast majority are exported live for commercial trade.
Figure 12: U.S. Exports of Other Invertebrates (No. of specimens), 2000-2009
Similar to the import volumes of marine invertebrates and unlike either the import or export data for
corals and marine tropical fish, export volumes of invertebrates have seen significant fluctuation over the
past ten years (Figure 12). As with fish, the majority of invertebrate imports are not identified by their
specific genus or species but are rather lumped into a broad category of “Other Live Invertebrates;” thus
making it virtually impossible to identify those genera or species imported in the greatest volume.
Approximately 69 % of export shipments contained fewer than 100 items, although the number of
shipments per year has been declining while the quantity per shipment has increased. The peak years of
2003 and 2004 were primarily due to a few very large shipments; in 2003 there was a single shipment of
100,000 live, captive-bred invertebrates to Vietnam and two shipments of 30,000 wild invertebrates to
Italy, and in 2004 there were again two shipments of 30,000 wild invertebrates to Italy.
Destination for Exports Figure 13: Top Destination Countries for U.S. Exports of Corals and Reef-associated Species, 2005-2009
Germany, Japan, Canada and, Mexico, are the primary destination countries for U.S. exports of corals and
reef-associated species (Figure 13) with relatively negligible amounts exported elsewhere. Vietnam
appears as a top country in the last five years of the analysis even though they have only received one
0
100000
200000
300000
400000
500000
600000
700000
1999 2000 2001 2002 2003 2004 2005 2006 2007 2008 2009 2010
0
20000
40000
60000
80000
100000
120000
140000
160000
2005 2006 2007 2008 2009
Germany
Japan
Canada
Vietnam
Mexico
Italy
United Kingdom
Source: WWF analysis of USFWS LEMIS data, 2011
Source: WWF analysis of USFWS LEMIS data, 2011

26
shipment from the U.S. because that single shipment contained 150,000 items – live, captive-bred marine
invertebrates.
For corals and coral products specifically, export volumes have been relatively low in the last decade, as
noted previously, with the exception on the large shipments in 2003 and 2007 that caused peaks in
volumes for those years. Canada has more consistently been a destination country for U.S. coral exports,
although volumes have decreased from a few thousand items in 2000 and 2002 down to less than 100
items per year for the most recent six years of data. The other consistent destination country over time has
been Japan; there were peak years in 2001 and 2007 where Japan imported over 500 items, but numbers
have more steadily held around 50 items per year. The majority of shipments of coral products to Canada
consisted of jewelry, although by volume Canada imported more live specimens than jewelry. Japan
primarily imports coral jewelry items from the United States.
Figure 14: Top Destination Countries for U.S. Exports of Marine Tropical Fish, 2005-2009
As with imports, the primary destination countries for U.S. exports of marine tropical fish have been more
consistent from 2005 to 2009. Mexico and Japan are the top two destinations in terms of total imports of
U.S. product over the past five years, although the United Kingdom, Germany and Canada consistently
import relatively high volumes each year.
Source of Exported Products
Along with information regarding purpose, origin and other aspects, imports and exports must also report
on the source of their products. The two broad categories for source are specimens taken from the wild
and animals bred in captivity. As in the analysis of imported products, for the purpose of this analysis, the
latter category includes all of the primary definitions used by the U.S. Fish and Wildlife Service:
1) animals bred in captivity, parts and derivatives;
2) CITES Appendix I animals bred in captivity for commercial purposes; and
3) animals born in captivity that do not fulfill the definition of “bred in captivity” in CITES
Resolution Conf. 10.16 (USFWS-OLE, 2009).
0
10000
20000
30000
40000
50000
60000
70000
2005 2006 2007 2008 2009
Mexico
Japan
United Kingdom
Germany
Canada
Hong Kong
France
Netherlands
Source: WWF analysis of USFWS LEMIS data, 2011

27
The majority of corals, coral products and reef-associated species exported from source countries to the
U.S. are taken from the wild. From 2005-2009, approximately 88% of all exported items were from wild
sources.
Figure 15: Source of Exports, 2005-2009
All Species
Coral Products Marine Tropical Fish
Overall, as with imports, the vast majority of exported corals, reef-associated species and their products
are of wild origin. The figures above (Figure 15) show an average for the five years; captive-bred coral
exports have been steady through those years, although captive-bred marine tropical fish exports in 2009
were nearly double those of each of the previous four years.
Source: WWF analysis of USFWS LEMIS data, 2011

28
Key Species in Trade This part of the report provides specific examples of harvest and trade in some key species that are the
main coral reef associated species used for ornamental purposes in the United States.
Ornamental fisheries are highly selective and focus their efforts on species that are easily harvested or
caught, or exhibit high market values. For example, species selected for trade for ornamental purposes for
aquaria are live reef fish, corals and invertebrates that are desirable esthetically or exhibit interesting
behaviors. With all ornamental use of reef species there are specific factors that make particular species
more desirable and profitable to trade. Often trends fluctuate to a degree based upon fashion, demand
dynamics and availability of quality supply.
Ornamental Fish Species in Trade Globally the main marine fish groups that have dominated the aquarium market are: Pomacentridae,
Acanthuridae, Blastidae, Labridae, Pomacanthidae, Chaetodontidae, and Syngnathidae. Amphiphrion
spp., Dascyllus spp., and Chaetodon spp. are among the favored genera (Olivier 2001).
Looking at the most commonly traded families internationally, species of Pomacentridae (damselfishes)
dominate, (Green 2003). The Pomacentridae genus consists of over 360 species, and is characterized by
small, colorful, and commonly found fish, throughout tropical seas. Damselfishes, live throughout coral
reef ecosystems, are oftentimes highly territorial, and inhabit the branches of coral colonies. This family
also includes the highly popularized relative the clownfish. Throughout the hobby this particular family is
known for its affordability, and is usually marketed towards beginners.
The following families of marine fish species are listed in order of popularity in international trade:
Pomacentridae damselfishes, see above;
Pomacanthidae represent the relatively delicate, large angelfish;
Acanthuridae a large, herbivorous family commonly known as tangs or surgeonfish;
Labridae which consists of an extensive array of colorful reef species known as wrasses;
Gobiidae gobies which are characteristically small fishes found commonly in association with
coral colonies;
Chaetodontidae or the butterfly fish are colorful relatives of the angelfish, many members of this
family have specific dietary requirements (coral polyps, sponges) making the majority
of species unsuitable for aquarium life;
Callionymidae commonly known as dragonettes, are also poorly adapted to aquarium life. They
display striking coloration, small size, and a notoriously specific dietary habit
consisting of (microorganisms/micro fauna). A vast majority of this species slowly
starve to death despite hobbyist efforts. [However, it should be noted that in 2010,
ORA (Oceans Reefs and Aquariums) began to successfully mass produce, and wean
this species onto commercially available frozen foods].
Microdesmidae the dartfish are another small, colorful and active family;
Serranidae the sea basses;

29
Blenniidae blennies, a small reef dweller, similar in size, and behavior to gobies.
Trade trends can change over time and demand for certain species will vary depending on fashion,
availability and price. For data provided by exporters and importers for the years 1997-2002 for example,
the most commonly traded marine ornamental fish species for aquaria were (Wabnitz et al. 2003):
• Blue-Green Damselfish (Chromis viridis)
• Clown Anemonefish (Amphiprion ocellaris)
• Whitetail Dascyllus (Dascyllus aruanus)
• Sapphire Devil (Chrysiptera cyanea)
• Threespot Dascyllus (Dascyllus trimaculatus)
Elegant and Endangered: The Banggai Cardinalfish from Indonesia
Trade Concerns Since its rediscovery in 1994 the Banggai cardinalfish (Pterapogon kauderni) has become highly prized
in the aquarium trade. Its rapid rise in popularity is due to a number of factors, namely its striking spotted
and striped pattern and elegant, elongated fins, ease of capture as it inhabits shallow coastal waters
(typically found between 1.5 and 2.5 m), and a low market price that is not reflective of this species’
increasing scarcity (Allen and Donaldson 2007, ARKive 2009, Blundell 2010). Banggai cardinalfish are endemic to Indonesian coastal waters, with suitable habitat along just 32 islands
in the Banggai Archipelago, limiting the species range to 34 km2, or 13 square miles (see map) (CITES
2007, Vagelli et al. 2008). The Banggai Archipelago is located in the center of the Coral Triangle, which
contains the most biologically diverse expanse of coral reefs anywhere in the world, but is also one of the
most vulnerable marine ecosystems in the world due to both direct human pressures and the indirect
impacts of human-induced climate change (CITES 2007, Hoegh-Guldberg et al. 2009).
Banggai cardinalfish live in small groupings, the majority contain less than ten individuals, while the
largest recorded community had several hundred members. The sedentary nature of Banggai
communities, paired with unique reproductive traits (the species lacks a pelagic larval phase) and local
geomorphology (strong currents and deep trenches between islands) make it virtually impossible for
groups to disperse to new potential habitats or interact with sister populations. Due to the isolation of
Banggai communities these fish assemblages exhibit high levels of genetic diversity between groups
separated by extremely short distances – often just a few kilometers; even populations occurring on reefs
of the same islands are genetically distinct, and makes them extremely vulnerable to any form of fishing
pressure (Allen and Donaldson 2007, ARKive 2009, CITES 2007, Vagelli 2008, Vagelli et al. 2008). Overfishing and environmentally destructive fishing practices – primarily dynamite fishing – have led to
extinctions of at least two local populations and brought the Banggai cardinalfish to an IUCN designated
endangered status in little more than a decade after commercial trade began. In 2007, the IUCN Red List
of Threatened Species completed an assessment of Pterapogon kauderni and listed the species as
endangered, meaning the species is “considered to be facing a very high risk of extinction in the wild”
(Vagelli 2008). Early in the Banggai aquarium trade hobbyists reported that wild sourced Banggai
individuals were hardy and resilient, but as capture and trade rapidly expanded these cardinalfish have
become more and more fragile and vulnerable, with survivability described as “pitiful at best” (Blundell
2010). Some traders state that only captive bred specimens should be purchased in spite of the premium
paid for captive fish due to its endangered species status.
30
Population Viability and Conservation Controversy
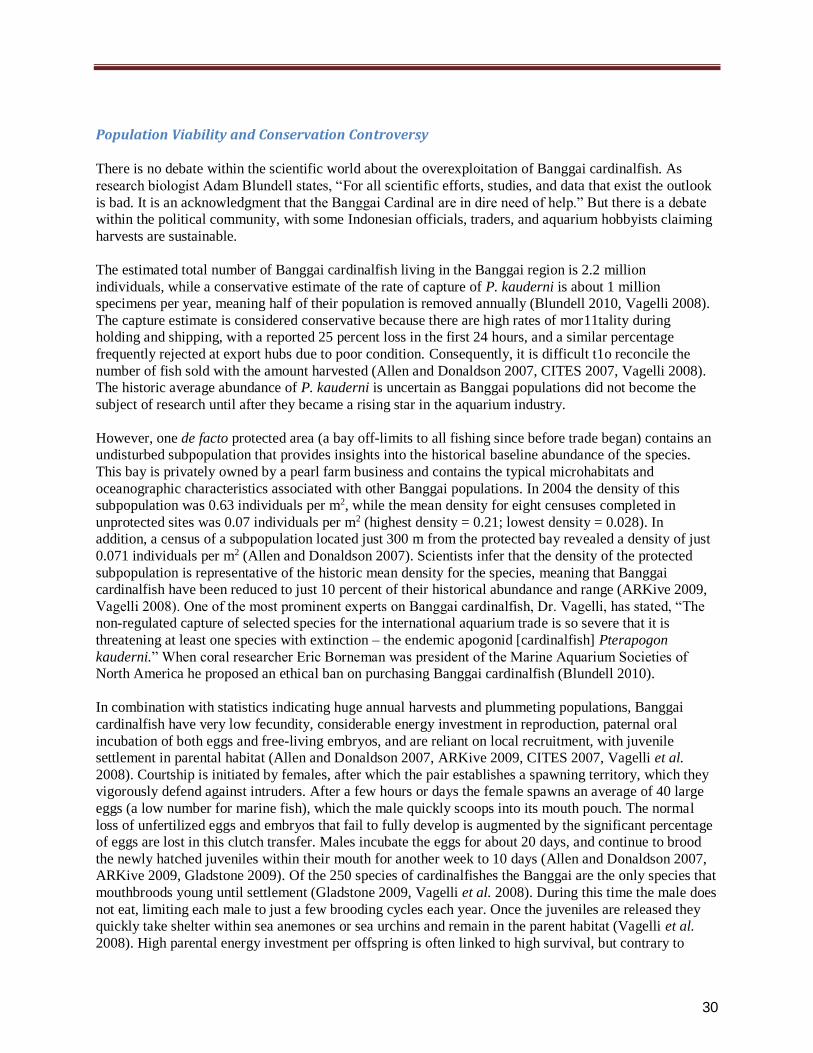
There is no debate within the scientific world about the overexploitation of Banggai cardinalfish. As
research biologist Adam Blundell states, “For all scientific efforts, studies, and data that exist the outlook
is bad. It is an acknowledgment that the Banggai Cardinal are in dire need of help.” But there is a debate
within the political community, with some Indonesian officials, traders, and aquarium hobbyists claiming
harvests are sustainable. The estimated total number of Banggai cardinalfish living in the Banggai region is 2.2 million
individuals, while a conservative estimate of the rate of capture of P. kauderni is about 1 million
specimens per year, meaning half of their population is removed annually (Blundell 2010, Vagelli 2008).
The capture estimate is considered conservative because there are high rates of mor11tality during
holding and shipping, with a reported 25 percent loss in the first 24 hours, and a similar percentage
frequently rejected at export hubs due to poor condition. Consequently, it is difficult t1o reconcile the
number of fish sold with the amount harvested (Allen and Donaldson 2007, CITES 2007, Vagelli 2008).
The historic average abundance of P. kauderni is uncertain as Banggai populations did not become the
subject of research until after they became a rising star in the aquarium industry. However, one de facto protected area (a bay off-limits to all fishing since before trade began) contains an
undisturbed subpopulation that provides insights into the historical baseline abundance of the species.
This bay is privately owned by a pearl farm business and contains the typical microhabitats and
oceanographic characteristics associated with other Banggai populations. In 2004 the density of this
subpopulation was 0.63 individuals per m2, while the mean density for eight censuses completed in
unprotected sites was 0.07 individuals per m2 (highest density = 0.21; lowest density = 0.028). In
addition, a census of a subpopulation located just 300 m from the protected bay revealed a density of just
0.071 individuals per m2 (Allen and Donaldson 2007). Scientists infer that the density of the protected
subpopulation is representative of the historic mean density for the species, meaning that Banggai
cardinalfish have been reduced to just 10 percent of their historical abundance and range (ARKive 2009,
Vagelli 2008). One of the most prominent experts on Banggai cardinalfish, Dr. Vagelli, has stated, “The
non-regulated capture of selected species for the international aquarium trade is so severe that it is
threatening at least one species with extinction – the endemic apogonid [cardinalfish] Pterapogon
kauderni.” When coral researcher Eric Borneman was president of the Marine Aquarium Societies of
North America he proposed an ethical ban on purchasing Banggai cardinalfish (Blundell 2010).
In combination with statistics indicating huge annual harvests and plummeting populations, Banggai
cardinalfish have very low fecundity, considerable energy investment in reproduction, paternal oral
incubation of both eggs and free-living embryos, and are reliant on local recruitment, with juvenile
settlement in parental habitat (Allen and Donaldson 2007, ARKive 2009, CITES 2007, Vagelli et al.
2008). Courtship is initiated by females, after which the pair establishes a spawning territory, which they
vigorously defend against intruders. After a few hours or days the female spawns an average of 40 large
eggs (a low number for marine fish), which the male quickly scoops into its mouth pouch. The normal
loss of unfertilized eggs and embryos that fail to fully develop is augmented by the significant percentage
of eggs are lost in this clutch transfer. Males incubate the eggs for about 20 days, and continue to brood
the newly hatched juveniles within their mouth for another week to 10 days (Allen and Donaldson 2007,
ARKive 2009, Gladstone 2009). Of the 250 species of cardinalfishes the Banggai are the only species that
mouthbroods young until settlement (Gladstone 2009, Vagelli et al. 2008). During this time the male does
not eat, limiting each male to just a few brooding cycles each year. Once the juveniles are released they
quickly take shelter within sea anemones or sea urchins and remain in the parent habitat (Vagelli et al.
2008). High parental energy investment per offspring is often linked to high survival, but contrary to

31
expectations P. kauderni suffers high early mortality (Gladstone 2009, Vagelli 2008). Due to the lack of a
pelagic larval phase there is no prospect for recovery of depleted subpopulations through outside
recruitment. This unique reproductive trait comes with a cost, increasing species vulnerability to
environmental change and overexploitation (Vagelli et al. 2008).
The scientific evidence of severely depleted and stressed populations and reproductive vulnerability led
United States delegates to propose the inclusion of P. kauderni in Appendix II of CITES in 2007. The
U.S. invited Indonesia to co-sponsor the proposal, but Indonesia sent a letter stating that they could not
support the measure, and that the government was expecting “positive impacts from the current
management program being undertaken at the area, such as the establishing of District Marine Protected
Areas and a fishermen certification system in collaboration with the Marine Aquarium Council (MAC).”
Notably, the U.S. did receive letters of support from the only local NGO that was working on
conservation and educational issues in the Banggai Archipelago at the time, as well as from the head of
the Banggai Fisheries and Marine Affairs Department.
The U.S. submitted the proposal for consideration at the June 2007 14th meeting of the Conference of the
Parties to CITES (CoP14). However, after the proposal was introduced on the floor of the Conference,
Indonesia voiced strong opposition, saying the proposal would have severe consequences for local
livelihoods and conservation efforts were already underway in the region. The perspectives provided at
CoP14 by Indonesia and the UN Food and Agriculture Organization (FAO) on the species’ status and
productivity resulted in several countries endorsing Indonesia’s position on the proposal. The U.S.
withdrew the proposal before the vote due to such strong range state opposition.
In his 2008 assessment of the failed CITES proposal, Dr. Vagelli states that during a field survey in
March-April 2007 he was able to establish that “there were no areas being established to protect P. kauderni, no local aquaculture project being developed, and no village in the Banggai Archipelago [had
been] approached by the government to implement any conservation or management plan directed toward
P. kauderni.” In addition, representatives from MAC Indonesia contacted Dr. Vagelli and admitted a lack
of knowledge on the species’ conservation status and the Banggai region generally, and said they were
not planning a certification system for trade of P. kauderni. In fact, it was not until August 2007 that the
first meeting of regional stakeholders was conducted (Vagelli 2008).
Livelihood Significance and Illegal Trade The Banggai cardinalfish fishery provides a supplementary source of income for local collectors.
Regional surveys have found that as little as 80 and no more than 230 fishers are actively engaged in
harvest and local trade of the Banggai (Lunn and Moreau 2004, Vagelli 2008). This is largely due to the
lack of economic incentives. When this species was first introduced to the aquarium trade, the retail price
per fish was ~US$100. Today the retail price for wild-harvested individuals has dropped to US$ 15-25,
but collectors only receive a minute fraction of that sum. Collectors are reported to receive just a few
cents per fish (CITES 2007). According to Dr. Vagelli (2008),
The real economic importance of the capture and trade of this species within this region is virtually nil. The reality is that…the vast majority of the Banggai people make their living
with more profitable and traditional economic activities such as agriculture, seaweed culture, and [food and ornamental] fisheries. About 55% of the region’s GDP is due to
agricultural and traditional fisheries activities.

32
Despite claims by the Indonesia CITES management authority that regulating the capture and
international trade of P. kauderni would have significant negative economic impacts in the Banggai
Archipelago, observations and evidence indicate that the
Banggai cardinalfish is not a significant source of income
or employment in the region. In addition, there is outside,
illegal collection by Balinese fishers; boats come directly
from Bali and fish for about a week. People living outside
the Banggai district are prohibited from fishing in the area
without purchasing government permits. The magnitude of
this outside capture is unmonitored and unknown (Vagelli
2008). This illegal activity has gone unaddressed,
indicating a lack of official concern about the livelihood
impacts of these harvests. The aquaria trade industry itself
has recognized the challenge, in the July 2009 issue of
Tropical Fish Magazine, Keiron Todd states “Who is
affecting this species? We, the aquarium hobbyists, are.
Who would be affected by a cessation of its collection?
Only a handful of people — to the tune of about a hundred
bucks a year each.”
Captive Breeding and Aquaculture
The feasibility of captive breeding and in-situ aquaculture of P. kauderni was exhibited as long ago as
1997, when the New Jersey Academy for Aquatic Sciences began a captive breeding program (Allen and
Donaldson 2007, Vagelli 2008). Facilities can raise market-size fish within 100-130 days and survival
rates are good, ranging from 66-95% (CITES 2007). Nonetheless, replacement of wild capture by captive
breeding has not been taken up at the community level or within the aquarium trade (Allen and
Donaldson 2007, Gladstone 2009). The issue, as with most aquaculture operations in developing
countries, is start-up costs and competition with more rapid, lower investment wild capture. Locals
willing to invest the time and resources to launch an aquaculture operation would likely be unable to
compete with the low price of fish caught using a hand net, held for a short period in a floating cage, and
sold to exporters within a few hours or days. In order to incentivize local aquaculture, the trade of wild
caught specimens would still need to be restricted and regulated (Vagelli 2008). An additional risk is that
a viral disease has been documented in wild-caught individuals maintained in captivity (CITES 2007).
This not only threatens the sustainability of the breeding operations, but it also raises the concern that in
open water culture operations the disease could be spread to nearby fish populations. In the United States,
some traders are proposing that buyers opt for the captive bred specimens as it becomes more widely
know about the endangered species status in the wild.
Pet or Medicine? Seahorses: Hippocampus kuda
Trade Concerns
There are more than forty recognized species of seahorses (genus Hippocampus). It is estimated that at
least 25 million seahorses are traded globally each year (Koldewey et al. 2010; Pawar et al. 2010). It is estimated that one million live seahorses are traded each year (4% of the 25 million traded
internationally), primarily destined for the U.S., Europe, Japan and Taiwan (Pawar et al. 2010). The
CITES Controls? Despite the abundance of information of the declines brought about in the collection and trade of the Banggai cardinalfish, the absence of a CITES listing for the species means that it remains unregulated in international trade. As a result, retailers and collectors can import as many specimens as they would like without having to meet any requirements as to the sustainability of the trade or collection of the species.

33
majority of seahorses traded are dead animals used for traditional medicine (particularly traditional
Chinese medicine or TCM), with high demand in Hong Kong, Taiwan, and the Peoples Republic of
China, and a growing market in expatriate Chinese communities in Asia, the United States and Europe
(Miththapala 2005, Nijman 2010). In China and Taiwan, tonics and medicines derived from seahorse
extracts are used to treat sexual dysfunction, respiratory and circulatory problems, kidney and liver
diseases, and other minor ailments (Tacio 2008). Seahorses are also collected for private and public
aquariums, and as curios, alongside shells and dried starfish.
The seahorse trade has been on the rise; while just 32 countries were involved in the seahorse trade in
1995, this expanded to at least 80 countries by 2001 (Giles et al. 2006, Koldewey et al. 2010, Scales
2010). Demand for these unusual fish exceeds available supply. Interviews and surveys of fishers and
traders indicate declines in many commercially desirable species (Giles et al. 2006, Miththapala 2005,
Perry et al. 2010, Project Seahorse 2003, Salin et al. 2005). The IUCN Red List of Threatened Species
lists 37 species of seahorses, seven of which are listed as vulnerable, one as endangered, and the rest as
data deficient (Project Seahorse, 2003). In 2002 the entire Hippocampus genus was listed under Appendix
II of CITES, requiring that all Parties to the Convention ensure any trade of these species does not
threaten the sustainability of wild populations.
Identification challenges
The taxonomy of seahorses makes them difficult to identify; they lack many of the distinct characteristics
used to identify other bony fish and they are able to alter their external appearance, changing skin color
and growing filaments that provide camouflage (Koldewey et al. 2010, Scales 2010). This complex
seahorse taxonomy has contributed to difficulties in distinguishing species in trade, and gathering
accurate data on the magnitude of trade. The CITES listing went into effect in September 2004 and
significantly increased trade attention, with a correlated improvement in species identification. For
instance, the U.S. Fish and Wildlife Service LEMIS database showed just over 1100 individuals of the
vulnerable, yellow/spotted seahorse (H. kuda) imported into the U.S. in 2004, but this number increased
to more than 11,000 in 2005, and ranged from 36,000-49,000 in subsequent years. Nonetheless, the
majority of seahorse imports are still listed generally as “Hippocampus spp.” in both domestic and
international trade data, indicating that trade data for the most popular commercial seahorse species –
including H. kuda – are likely significant underestimates of the true number imported. In addition, the
CITES database is only a record of legal, international (non-domestic) trade, and hence is likely a great
underestimate of total global trade.
Life History

34
There are many inherent characteristics of seahorse reproduction,
dispersal, and habitat commensalism that make them particularly
vulnerable to overexploitation. Most species of seahorses are
monogamous or exhibit high mate fidelity. Seahorses also have a
long period of parental care with typically small brood sizes; the
males carry the young to term in a brood pouch. The weight of
seahorse armor makes them slow swimmers and they often
attach to a substrate to prevent currents from carrying them
away, leading to a small home range and limited dispersal
(Miththapala 2005, Project Seahorse 2003, Scales 2010,
Koldewey et al. 2010). This means that if a mate is lost a
significant energy investment is required to find a new partner,
likely leading to reproductive costs (Scales 2010). Seahorses
inhabit shallow coastal waters, primarily seagrasses, coral reefs,
and mangroves, making them particularly susceptible to habitat
degradation and loss, fishery bycatch, and targeting by divers
given their proximity to human populations (Project Seahorse
2003, Salin et al. 2005).
Trade, purpose and identification
Hippocampus kuda is listed as Vulnerable under the IUCN Red
List classification, due to population declines of at least thirty
percent, attributed to bycatch, targeted catch, and habitat
degradation. “While there is little information on changes in
numbers of the species, there is indirect evidence to suggest that
declines have taken place and are continuing” (Project Seahorse
2003). Hippocampus kuda is one of the most common species
traded live for use in aquariums (Scales 2010). It is also one of
the most valuable seahorses used in TCM. This species has many
desirable qualities for the traditional medicine sector, including
large size, smooth texture, and pale complexion when dried, and
hence is in high demand. These traits are also attractive for the
aquarium and curio trade (Garcia et al. 2009, Project Seahorse
2003, Scales 2010). According to U.S. FWS data, seahorses are
the second most important taxon in terms of value and volumes
of marine curio imports into the U.S. Hippocampus kuda is one
of at least five species of seahorses that have been imported for
the curio market (Grey et al. 2005).
Exporting countries and harvest methods Hippocampus kuda is native to the Indo-Pacific and is found in
the coastal waters of India, throughout Southeast Asia, northern Australia, Japan, and some of the Pacific
Islands, including Hawaii (Project Seahorse 2003). The primary exporting countries are India, Malaysia,
Thailand, Vietnam, the Philippines and Indonesia (Giles et al. 2006, Miththapala 2005, Perry et al. 2010,
Salin et al. 2005). Many of these countries also sell this species domestically for traditional medicine.
(domestic trade is generally not monitored systematically). CITES trade records indicate that Thailand is
the largest global exporter of dried seahorses (Perry et al. 2010). U.S. FWS LEMIS data indicates that,
since 2006, the vast majority of imports of H. kuda into the U.S. have originated in Vietnam, while from
Illegal Trade There are many indications that there is significant illegal and unrecorded trade of seahorses, including H. kuda. Under the Philippines national fisheries code seahorses can no longer be legally exported, but Project Seahorse has confirmed that trade continues. It is believed that many seahorses harvested in the Philippines are channeled through illicit trade routes in Malaysia and Thailand (Perry et al. 2010, Scales 2010). Officially, exports of marine aquarium fish are prohibited by law in Malaysia, but European trade records still show some shipments. In Thailand H. kuda is one of three species of seahorses for which exports of live species have also been prohibited, but illegal exports are still being recorded (Perry et al. 2010). In a study in India in 2001 that used catch data to derive the volume of dry seahorse trade it was found that catch tonnage greatly exceeded official statistics, indicating that a significant amount of trade occurred through non-conventional routes. Concerns about seahorse conservation led the government of India to outlaw the capture of wild seahorses that same year, but while capture and export of seahorses has been substantially reduced, trade from India is still taking place (Salin et al. 2005). There is extensive illegal trade of natural resources along the border between China and Vietnam, and seahorses are believed to be a part of this trade (Giles et al. 2006). High demand and attractive prices mean that seahorse landings continue in all of these countries despite certain national prohibitions.

35
2004-2005 the majority came from Indonesia, and from 2000-2003 the majority came from the
Philippines. A 2006 study on the catch and trade of seahorses in Vietnam (Giles et al.) indicated that
exporting seahorses is a relatively new phenomenon in Vietnam, likely linked to decreased supply in
other countries in the region. Markets in China and US have increased sourcing from Vietnam due to
normalization of trade relations in the1990s. Additionally, fishing fleets have expanded and gear has
improved, and with trawling effort increasing, mostly inshore, this has lead to increased seahorse bycatch. Trade studies in South India, Malaysia, Thailand, and Vietnam have all revealed H. kuda as one of the
main species harvested. A recent study on culture of H. kuda in sea cages (Garcia et al. 2009) also stated
that it is one of the most heavily traded species in the Philippines, despite the fact that the trade of
seahorses has been outlawed. The vast majority of seahorses landed in Southeast Asia, including H. kuda,
are caught as bycatch by trawlers targeting shrimp and other inshore fish. Trawling not only poses a direct
threat to seahorse populations, but also leads to widespread habitat degradation that further threatens the
resilience and survival of seagrasses, coral reefs, and associated species. A much smaller number of
seahorses are hand caught by swimmers and divers. Although targeted seahorse fisheries are relatively
small in scale, they still serve as a critical source of livelihoods for tens of thousands of fishers in the
region (Salin et al. 2005, Sanders et al. 2008).
Addressing overexploitation
While it is recognized that countries in the Indo-Pacific are the most important contributors to the
seahorse trade, not enough is known about these seahorse fisheries and their degree of exploitation. Few
species of seahorses have been comprehensively assessed, and prior to 2004 few countries recorded any
aspects of seahorse trade, to the point that some officials did not even know their countries were involved.
Seahorses are used in traditional medicine within India, Indonesia and the Philippines, and domestic
consumption may be particularly large in both Malaysia and Thailand (Perry et al. 2010). Domestic use
needs to be better tracked and recorded in order to determine sustainable export levels. CITES depends on
self-reporting at the national level and is not established in a way that is cannot address illegal trade,
domestic trade, or bycatch issues. From a conservation perspective, non-selective trawling poses the
greatest threat to seahorse populations. But if there is a lack of scientific data on populations,
reproduction of species, harvest levels and mortality then it is very difficult for CITES scientific
authorities to determine if the trade is to the detriment of the species or not. It is vital that more
information is provided to ensure that effective CITES Non-Detriment Findings can be performed and the
authorities make those findings. The challenge is often a widespread lack of resources to undertake the
field research and analyze the data. However, in many cases countries will still issue export documents
for species where they have little understanding of the impact on the species populations in the wild.
Other methods are required to deal with this and some countries like those in the European Union have a
process to prohibit imports if they believe that the species are being harvested unsustainably, even if
CITES permits are issued at import. Other countries should also apply such a mechanism for species of
concern where it can be proven that the assessments are not being undertaken or the species are being
impacted seriously due to harvest. Additionally, there needs to be improved identification and tighter
restrictions at trade gateways in order to incentivize shifts in fisheries practices and improve fisheries
management in exporting countries. The image below is a screen capture from the TRAFFIC online “Wildlife Trade Tracker” a Google maps
based system that spatially plots data from U.S. FWS LEMIS database on trade to and from the U.S. This
screen capture shows trade flows of seized or abandoned shipments of Hippocampus kuda, highlighting
the country of origin, relative volumes and details of total amount of specimens seized between 2003-
2009. Vietnam was the most prevalent source country for illegal shipments to the U.S. of with two thirds
of the total illegal trade in this seahorse species, all were shipments of live animals.

36
iv
U.S. Seizures of Hippocampus kuda (source: TRAFFIC Wildlife Trade Tracker Mapping Tool, 2011)
Note: Up arrows = export / Down arrows = import. Red arrows = major export by number of items. Green arrows = lower level
of export by number of items
Potential for Captive-breeding
There are at least thirteen species of seahorses being cultured or under research for their culture potential,
of which H. kuda is one. The majority of seahorse culture is occurring in developed countries at a small
scale and bolstering the aquarium trade. Economic viability is a challenge for culture operations due to
price competition with wild caught species. In developing countries that are experimenting with seahorse
culture, technical challenges have proven difficult to overcome in terms of success of reproduction and
juvenile survival (Garcia et al. 2009, Koldewey et al. 2010). Large-scale aquaculture to supply the
traditional medicine market and reduce exploitation of wild populations for the TCM trade has not yet
proven to be viable. Apart from questions on the desirability of wild specimens over captive bred ones,
the costs and energy investment of seahorse culture also has not made it an attractive livelihood
alternative for local fishers. Culturing will only have a conservation benefit if it can reduce overexploitation in major exporting
countries, without leading to other environmental costs commonly associated with aquaculture operations,
including water pollution, eutrophication, spreading of disease, and release of exotic species. Since
developing countries are the primary exporters of wild seahorses, culture of seahorses on a sustainable,
economically beneficial, local-scale needs to be based in the countries with the greatest potential to
reduce pressure on wild populations (Koldewey et al. 2010).

37
Tridacna gigas – The heavyweight champion of mollusks
Trade Concerns The giant clam species Tridacna gigas is the most heavily exploited of all Tridacnids (Okuzawa et al.
2008). They are among the top ten most traded invertebrates worldwide, popular in the aquarium trade,
commonly harvested for food, and their shells are sold as ornaments (Okuzawa et al. 2008, Othman et al. 2010). The extraction and collection of giant clams is quite simple, as these are sessile organisms
typically occurring at less than 20 m in depth (ARKive 2008, Lindsay et al. 2004). Tridacnids have long been, and still are, an important component of the diets of people throughout
Southeast and East Asia. In most coastal communities throughout this region Tridacnids are still gathered
on a daily basis and can be found at local markets (Lindsay et al. 2004, Okuzawa et al. 2008). This
subsistence food purpose has contributed to illegal poaching, despite regulations that have been put in
place in many countries to protect this unique species (Gomez and Mingo-Licuanan 2006).
The illegal trade in the species to the U.S. only based upon known seizures of shipments from 2003-2009
involved 42 illegal exports from 13 countries, totaling 129 clam specimens, often shells. The average
number of illegal shipment seizures in the U.S. per source country is 3, with an average of 10 items per
seizure and an average of 6 U.S. seizures per year. The image below is a screen capture from “Wildlife
Trade Tracker” This screen capture shows trade flows of seized or abandoned shipments of Tridacna gigas, highlighting the country of origin, relative volumes and details of total amount of specimens seized
between 2003-2009. Tonga, followed by the Philippines were the most prevalent source countries for
illegal shipments to the U.S. of this clam species.
Life History These enormous shellfish often reach a meter or more in length, and can weigh up to 300 kg (~660 lbs),
making this the largest species of bivalve mollusk in the fossil record, and the heaviest species of living
mollusks. Their lifespan in the wild can exceed 100 years (ARKive 2008).
Status Despite being listed in Appendix II of CITES in 1985, T. gigas remains listed as Vulnerable in the IUCN
Red List of Threatened Species (Wells 1996). Between 1983 and 1996 the status of T. gigas was assessed
six times and confirmed as vulnerable each time. Unfortunately, since 1996 there has been no follow-up
assessment of the population status of this giant clam species, despite continued evidence of
overexploitation for the aquarium and food trade, and despite new risks associated with climate change.
Of the seven species of giant clam included in the IUCN Red List four are listed as vulnerable, the other
three as conservation dependent, and all are listed as in need of updating, given that none of these species
have been assessed for over fifteen years. A 2010 comprehensive analysis of available information on the
status of giant clam populations revealed that the majority of the most recent surveys date from the late
1980s (Othman et al. 2010).

38
T. gigas is considered extinct or virtually extinct in Myanmar, Thailand, Malaysia, the Philippines and
Taiwan, as well as several small island nations, although restocking of T. gigas in protected areas in the
Philippines may have led to small pockets of local populations (Mingoa-Licuanan and Gomez 2002,
Okuzawa et al. 2008, Othman et al. 2010, Wells 1996). In addition to overexploitation, Tridacna species
are threatened by land-based pollutant runoff, harmful fishing practices used to collect other coral-
associated species, and stress-induced bleaching due to warming sea surface temperatures attributed to
climate change (Othman et al. 2010).
Distribution Prior to the rapid escalation of the aquarium trade T. gigas could be found throughout the shallow tropical
waters of the Indian and Pacific oceans, typically associated with coral reefs. The species’ range extended
from East Africa to Micronesia, and Australia to Japan, but in the past three decades over harvesting has
severely reduced the number and extent of this species (ARKive 2008, Othman et al. 2010). The greatest
diversity of giant clams is found in the central Indo-Pacific (Othman et al. 2010).
Reproduction, Symbiosis and Commensalism Giant clams, including T. gigas, are prime builders for coral reefs, providing shelter for small marine life.
All Tridacna species have a mutually beneficial relationship with photosynthetic algae known as
zooanthellae. These algae inhabit their mantles, gaining protection from predation by being associated
with these large organisms, and in turn provide the majority of the clam’s nutrients as the clam obtains the
carbon by-products of photosynthesis (ARKive 2008, Othman et al. 2010). In addition, giant clams also
provide protection for a small species of pea crab – a single pair will often be founding sheltering in the
cavity of the clam. Since giant clams are unable to move they reproduce by spouting sperm and eggs into
the sea, where fertilization occurs (ARKive 2008). The larvae that survive the open ocean phase
eventually settle on the reef. There are also high rates of mortality among juveniles as it takes several
years for them to grow large enough to be immune to predators (Okuzawa et al. 2008).
U.S. Seizures of Tridacna gigas (source: TRAFFIC Wildlife Trade Tracker Mapping Tool, 2011)

39
Exporting Countries and Trends The U.S. has consistently been one of the primary import markets for Tridacna species. In 2002, 70
percent of the giant clams exported for the aquarium trade went to the U.S. (Mingoa-Licuanan and Gomez
2002). Vietnam has been a rapidly rising competitor in the marine ornamental trade in the 21st century,
and between 2003 and 2009 consistently exported the largest numbers of Tridacnids. U.S. imports of
Tridacnids climbed from 60,000 individuals in 2002 to 120,000 in 2007, but have dipped the past few
years, again nearing 2002 levels (see Table A). There is known to be some successful culture in the
Marshall and Solomon Islands (Mingoa-Licuanan and Gomez 2002), which likely accounts for the small
percentage of imports of captive bred individuals, but still by far the majority are wild caught (see Table
B). For Tridacna gigas specifically, imports have declined from nearly 4,000 individuals in 2005 to less than
1,000 in 2009 (see Table C). It is unlikely that this is due to a decline in demand, given their consistent
popularity in the aquarium trade for several decades, but more likely can be attributed to a lack of
available supply. Since T. gigas has already been fished to extinction or alarmingly low numbers in many
of the larger countries involved in the marine aquarium trade, supplies are now being sourced from just a
few small island nations, primarily Tonga (LEMIS 2010). As with most tropical marine species sought
after in the ornamental trade, the Philippines have historically been a major supplier of Tridacna species,
including T. gigas. Local extinctions in the late-1980s led to early restrictions of harvest and trade of
Tridacna, and of course there are no contemporary trade statistics as the Philippines has outlawed trade of
CITES listed species. Nonetheless, there was evidence in 2002 that illegal shell trade continued to occur
in the Philippines, and more recent CITES trade statistics reveal wide disparities in yearly giant clam
trade figures, suggesting inconsistencies in several countries in their control of the clam trade (Mingoa-
Licuanan and Gomez 2002, Othman et al. 2010). Fiji and Vietnam have imposed zero CITES export
quotas for the species since 2009.
Culture & Restocking Local extinction of T. gigas in the Philippines led to one of the earliest restocking initiatives in the region;
the University of Philippines Marine Science Institute began a culture and restocking effort in the late
1980s. T. gigas have been one of the most attractive targets for culture and stock replenishment because
they spawn prolifically, have a short larval life, require minimum maintenance during grow-out, and their
sustenance travels with them in the form of their symbiotic algae (Lebata-Ramos et al. 2010, Lindsay et
al. 2004, Othman et al. 2010). While the culturing process has proven successful, the real challenges
come with transport, choosing appropriate restocking locations, followed by protection of reintroduced
individuals until they are large enough to avoid predation (some three years) and then mature enough to
reproduce (another six years). Due to this significant time and financial investment culture and restocking
efforts have necessarily focused on rebuilding severely depleted and/or locally extinct populations rather
than commercial grow out operations (Gomez and Mingo-Licuanan 2006, Okuzawa et al. 2008). Many restocking efforts have had high rates of mortality due to poaching and illegal fishing, leading to
increased emphasis on partnering with local communities and creating incentives for protection. While
tens of thousands of giant clams have been restocked in the Philippines (primarily T. gigas and T.
squamosa) follow-up on a large project in the early 2000s revealed that grow-out of the clams to larger
sizes was largely unsuccessful, and the few that did survive were ultimately donated to a protected area in
a neighboring province. A Pew Charitable Trusts grant for a Fellowship project distributed from 2002-
2004 allowed additional restocking of T. gigas (~1,000 sub-adult and ~10,000 juveniles). A follow-up one
year later again linked insufficient levels of onsite staff to high juvenile mortality. However, more than 90
percent of sub-adults did survive (Gomez and Mingo-Licuanan 2006).

40
Given the length of husbandry required, and the difficulties encountered with monitoring and
enforcement, restocking of hatchery produced giant clams has waned in recent years in the Philippines.
As Okuzawa et al. state (2008):
The ultimate criteria of restocking success is whether the released animals contribute to
the genetic pool of the local population and whether their offspring are able to survive and reproduce, which may take decades…As the seeded animals need protection before they
can reproduce, the best strategy is to couple stock enhancement programs with established MPAs that have strong community support.
Recognizing the critical role protected areas can play in minimizing poaching-related mortalities, there is
a new giant clam stock enhancement program underway in the Philippines’ Sagay Marine Reserve,
chosen because of the presence of Bantay Dagay (deputized fish wardens) that protect the area (Lebata-
Ramos et al. 2010). Past restocking efforts have led to several important lessons that will be taken into
account in this new program: site selection with approval from the local community is critical, linked with
a resolute commitment by local teams to guard the stocks; in order to sustain the interest of local stewards
restocking and establishment of local ocean nurseries has to be complemented with technology transfer
and training; lastly poaching and inadequate enforcement of local and national law related to endangered
species remains a persistent problem that still needs to be addressed (Gomez and Mingo-Licuanan 2006,
Lebata-Ramos et al. 2010). Ultimately, because it takes such a substantial infusion of capital to rear giant
clam species such as T. gigas to aquarium size, culture has not significantly reduced demand for wild
species for ornamental purposes; commercial trade in wild collected Tridacnids is ongoing throughout the
region. In order for culture to out-compete the wild trade the time and cost benefit has to improve and
cultured clams have to be more competitive in size and color with wild harvest specimens. Until then,
vulnerable coral-dwelling Tridacnids will continue to be harvested for the international ornamental trade. Table A – Quantity of Imports by Country of Origin (all Tridacna species) (Top 5 only: VU=Vanuatu, SB=Solomon Islands, TO=Tonga, MH=Marshall Islands, VN-Vietnam)
0
10000
20000
30000
40000
50000
60000
70000
80000
90000
2000 2001 2002 2003 2004 2005 2006 2007 2008 2009
VN
MH
TO
SB
VU

41
Table B – Quantity of Imports by Source (all Tridacna species) (W=Wild caught, C+F+D=captive bred+captive born+bred in captivity for commercial purposes)
Table C – Tridacna gigas – Quantity of Imports by Country of Origin (Top 5 only) (TO=Tonga, AU=Australia, SB=Solomon Islands, MH=Marshall Islands, FJ=Fiji,)
0
20000
40000
60000
80000
100000
120000
2000 2001 2002 2003 2004 2005 2006 2007 2008 2009
C+F+D
W
0
500
1000
1500
2000
2500
3000
3500
4000
2000 2001 2002 2003 2004 2005 2006 2007 2008 2009
TO
AU
SB
MH
FJ

42
Underwater Finery – Precious Black and Gold Corals
The phrase “precious corals” refers to species of corals used to produce jewelry and curios for home
décor. The most well-known and valuable precious corals are the red and pink corals of the Corallium
species. Some seven species of Corallium are traded internationally, with the most sought after being
Corallium rubrum (Tsounis et al. 2010). Corallium is harvested primarily from East and Southeast Asia
and the Mediterranean. In 2007, there was an effort to include red and pink corals under Appendix II of
CITES. However, there was political resistance to scientific findings of significant population declines,
despite scientific consensus, and the listing was not successful (Bruckner 2009).
Traded in smaller amounts are the black (primarily Antipathes spp.) and gold (Gerardia spp.) corals. The
two most commonly traded types of black coral are Antipathes grandis and A. griggi. Specific species of
Gerardia are extremely difficult to identify with any accuracy and are not listed in trade documents
(Tsounis et al. 2010). Black corals are listed in Appendix II of CITES. Unfortunately, the IUCN Red List
does not include assessments of any of these species. The U.S. is the largest documented consumer of
precious corals, with tens of millions of pieces imported since 2000 (Debenham 2008, Tsounis et al.
2010). According to LEMIS trade data, legal imports of black coral (Antipathes spp.) have averaged
roughly 50,000 pieces per year from 2000 through 2009.
Black corals are more valuable and heavily harvested than gold corals. Black corals are distributed
throughout the sub-tropical and tropical Pacific, and live at depths anywhere from 20-8,000 m, with the
greatest abundance usually found between 30-80 m (Bruckner et al. 2008). Typically, the largest
quantities of black coral have been harvested in the Philippines, exported primarily to Taiwan for
processing and manufacturing (Bruckner 2005, Tsounis et al. 2010). Black coral has also been harvested
in significant quantities in Hawaii. Until very recently it was believed that black and gold corals had
relatively short life spans and sufficiently rapid reproductive cycles for sustainable harvest and trade.
However, recent improvements in radiocarbon dating have proven this is not the case. In 2009, Roark et
al. published a study dating deep-sea gold and black (Leiopathes spp.) corals from the Hawaiian precious
coral fishery. Their results showed that Gerardia species live anywhere in the range of 300-2700 years,
and some Leiopathes species may live more than 4,000 years (Roark et al. 2009). Additionally, black
corals are characterized by delayed first reproduction and low survivorship and recruitment of larvae.
Several studies on black corals in Hawaii have revealed a decline in younger age classes, with indications
that there were considerable reductions in recruitment. NOAA reported a decrease in the biomass of black
coral in the commercially targeted Au’au Channel of at least 25% between 1976 and 2001 (Bruckner et
al. 2008). In addition to extreme longevity, and declines in abundance of harvestable colonies, the depth
of these coral ecosystems does not provide immunity against natural and anthropogenic changes in
surface ocean conditions, such as warming temperatures and increased ocean acidification due to climate
change (Roark et al. 2009).
Threats Deep-sea corals face multiple threats at once: increasing consumer demand and commercial harvest for
the jewelry trade, damage caused by deep-water fishing methods and human-induced shifts in the ocean
system. Meanwhile, these deep-sea corals can provide invaluable insights into past climate and
environmental change within the interior of the ocean, a huge area of the earth for which we have
virtually no other high-resolution paleoclimate records (Roarke et al. 2006). In 2008, a quota was put on
Hawaiian black coral harvests in the Au’au Channel, and a 5-year moratorium was put on the harvest of
gold corals (Federal Register 2008). However, this quota may not be sufficient to ensure sustainable
domestic harvest and trade of black coral, and five years is fleeting for gold corals that live hundreds to
thousands of years. Roark et al. (2009) argued that given the longevity and slow growth rates of deep-sea
43
corals maximum sustainable yield limits are grossly overestimated and “any future harvesting [should] be
considered in the context of a nonrenewable resource framework”.
Unfortunately, while there is increasing control and monitoring of domestic harvests of black and gold
corals, by far the majority is harvested in Asia, with limited policy prescriptions, and even less
enforcement of the policies that are in place. In Taiwan, it has been shown that illegal, unreported or
unregulated (IUU) coral trade far exceeds legal, permitted trade (Ming-Ho and Ching-Hsiewn 2010). The
trade of a specific genus or species is very difficult to track. Currently, there is no Customs Harmonized
System Code (HS Code) for any species of precious coral in the Southeast and East Asia region. The most
specific commodity codes differentiate between raw (unworked) or powder coral, and worked or finished
coral products. Hong Kong, mainland China, Japan and Taiwan all have different sets of commodity
codes, making direct comparisons of trade in this region virtually impossible (Wu and Takahashi 2009).
Ecosystem Function Black and gold corals are alternately described as “structure-forming”, “foundation species”, and
“ecosystem engineers” (Cerrano et al. 2010, Roark et al. 2009). These corals increase the complexity of
seafloor habitat and create critical habitat for fish and invertebrates, serving a similar ecological function
as their shallow water reef-building counterparts. Black coral colonies in particular have been found to
host commensal species that depend on these coral structures for their survival (Bruckner et al. 2008).
Their erect, branching structure provides a substrate for attachment by a range of species, shelter from
predators for small fishes, and sleeping perches for larger vertebrates.
In the deep-sea coral beds in Hawaiian waters, Gerardia and Leiopathes are two of the largest megafauna
invertebrates and support diverse communities of invertebrates and fish that, in turn, attract endemic and
highly endangered monk seals who forage for food among the coral branches. Roark et al. (2009)
observed “an increase in fish and invertebrate biomass and diversity within and adjacent to colonies of
Gerardia and Leiopathes”. Boland and Parish (2005) examined the ecological role of black coral and
found that the absence of black coral may impact fish assemblages. Several species of invertebrates have
been found only among antipatharians, some that populate dead skeletons, and others live branches
(Bruckner et al. 2008).
A study of an endemic species of gold coral (Gerardia savaglia) living in the “twilight zone” of the
Mediterranean (the disphotic zone, where only faint, filtered sunlight is received during the daytime)
found that the presence of these colonies “was associated with a significantly increased deposition of
bioavailable substrates and enhanced biodiversity, when compared with soft bottoms at the same depth
but without gold corals”. These corals serve as ecosystem engineers in that they can reduce current flow
velocity, increase fine particle sedimentation and reduce re-suspension, thus stabilizing soft substrates.
The authors (Cerrano et al. 2010) found that “organisms living in habitats characterized by the presence
of these ‘engineers’ can experience a sort of ‘buffer zone’ where environmental modifications occur
slower and within narrower ranges with respect to the surrounding ambient”. Unfortunately, most work
has focused on Hawaii and little is known about the state of black and gold corals in the Indo-Pacific
region, where the majority of commercial harvests occur. It is known that most black coral colonies have
been depleted at depths accessible by divers, and with increasing access to deep sea coral ecosystems
there is concern that these colonies will also come under increasing pressure (Bruckner et al. 2008).
Trends in Exports and Imports Taiwan and the Philippines began to export large quantities of black coral in the 1980s. Taiwan is the
world’s largest supplier of worked black coral, accounting for more than 90% of exports. In the past
Taiwan imported most of the raw coral from the Philippines (Bruckner et al. 2008, Tsounis et al. 2010).
The Philippines ultimately made it illegal to “gather, possess, send, or export ordinary, precious or semi-
precious corals” except for research use, but illegal smuggling of corals from Philippines reefs is still

44
considered common (Debenham 2008). It is unclear from available trade data where Taiwan now sources
its imports of unworked and raw coral (potentially because the sourcing may at times involve illegal
collection and trade). China is another important coral processing and manufacturing center. According to
Taiwan customs data Italy, Japan, the United States, and Vietnam are the primary export destinations for
worked and articles of coral (see Table D below), while imports to Taiwan of worked and articles of coral
come from Vietnam, Hong Kong, Japan, Myanmar, and mainland China (Wu and Takahashi 2009).
Table D. Taiwan coral exports – worked coral and articles of coral (Kg)
80%
6%
5%3% 3% 1%
1%
0%0%
Worked coral export
from Taiwan
Viet Nam
USA
Italy
Japan
Others
Spain
Cuba
Germany
Hong Kong
Viet Nam
USA
ItalyJapan
29%
28%
25%
10%
4%
2%
1%
1%
0%
Article coral export
from TaiwanItaly
Japan
USA
Hong Kong
Others
Spain
Germany
Cuba
Viet Nam
Japan
Italy
USA
Hong Kong
Taiwan worked and article coral customs data (2001-2008) – Source: Wu and Takahashi (2009)
Taiwan worked and articles of coral customs data (2001-2008) – Source: Wu and Takahashi (2009)

45
Italy is the primary manufacturing hub for pink and red Corallium corals. According to industry insiders
the Italian black market for coral is quite significant, potentially accounting for half of all trade (Tsounis
et al. 2010). Research and trade information suggests that Vietnam is an important partner for Taiwan’s
coral processing industry. This suggests that Italy and Vietnam’s roles in manufacturing and processing
are significant, while Japan and the U.S. are the primary end markets for precious coral products
(Bruckner et al. 2008, Wu and Takahashi 2009).
Judging from Corallium spp. import data, the trade of precious corals into the U.S. has been increasing in
recent years. In the years preceding the quota on black coral domestic harvests in Hawaii also increased
considerably. Black coral landings between 1999 and 2005 made up 58% of the total Hawaiian catch
since 1985. Additionally, spikes in demand were recorded in the early 2000s, with a 50% increase in sales
volume recorded in Hawaii (Tsounis et al. 2010). Retail prices for manufactured black coral jewelry can
range from around $35-300 for earrings, $50-750 for small pendants, to thousands and tens of thousands
of dollars for fine jewelry set in gold and paired with diamonds and other precious stones.
Illegal Trade Illegal harvest and trade of precious corals remains a significant problem. The scale of black-market trade
is of course very difficult to quantify. Since only 1-2% of international shipments are inspected it is likely
that significant amounts of illegally traded precious corals make their way across borders.
In 2010, a Taiwanese couple was convicted of conspiracy to smuggle protected black coral into the
United States from Asia. The couple pleaded guilty to selling nearly US$200,000 of coral to a jewelry
design and manufacturing company in the U.S. Virgin Islands. They admitted to falsely labeling
shipments over two years to conceal the coral from the U.S. Customs and Border Protection authorities
(Department of Justice 2010). In July of 2011, the U.S. Virgin Islands company, called GEM, was also
sentenced as part of the case in knowingly trading in the falsely-labeled black coral that had been shipped
into the U.S. in violation of the Endangered Species Act and the Lacey Act (Department of Justice 2011).
None of the shipments had the required CITES certificates, and each shipment was labeled “plastic of
craft work”. The company, GEM, was sentenced to pay a criminal fine of $1.8 million and an additional
$500,000 in community service payments for projects to study and protect black coral. They were also
ordered to forfeit black coral goods worth $2.17 million. The aggregate financial penalty of $4.47 million
makes this the largest fine for the illegal trade in coral, the largest non-seafood wildlife trafficking
financial penalty and the fourth largest for any United States case involving the illegal trade of wildlife.
GEM was also sentenced to three and a half years of probation and a 10-point compliance plan that
includes an auditing, tracking and inventory control program (DOJ 2011).
2002 2003 2004 2005 2006 2007 2008 %
Cuba 276 196 85 266 0 0 0 1%
Germany 109 227 192 155 74 116 85 1%
Spain 494 377 370 246 179 212 15 2%
Hong Kong 2,286 503 913 557 3,097 1,173 622 8%
Italy 3,640 8,326 3,995 2,348 3,599 3,428 1,199 24%
Japan 5,886 3,329 2,848 4,313 4,084 3,642 1,443 23%
USA 2,599 5,361 4,147 3,560 3,261 2,194 1,804 21%
Viet Nam 4,410 3,896 2,272 3,209 317 2,221 3,575 18%
Others 807 430 459 472 1,397 240 167 4%
TOTAL 20,507 22,645 15,281 15,126 16,008 13,226 8,910
Source: Wu and Takahashi 2009

46
Illegal harvesting of corals in Taiwanese waters, primarily Corallium spp., has been well documented. In
2007, an investigation by the Department of Fisheries Administration found that there were 30 times as
many illegal vessels in operation as legally operating vessels (three vessels with legitimate licenses versus
96 illegal vessels operating without licenses). This is particularly problematic as the illegal vessels
employ unselective, environmentally destructive fishing methods, such as trawl or seine nets anchored by
large rocks. In 2009, the government drafted a more stringent Management Regulation for the coral
fishing industry. The challenge is adequate government investment in monitoring and enforcement to
implement the new measures, given traditionally low-density fishery management. The Taiwan Coast
Guard only caught 17 vessels illegally harvesting coral between 2000 and 2007 (Ming-Ho and Ching-
Hsiewn 2010). It seems there are similar problems in the Philippines, as there are numerous indications
that this country is still significantly involved in precious coral harvest and trade.
The image below is a screen capture from “Wildlife Trade Tracker” This screen capture shows trade
flows of seized or abandoned shipments of Corallium secundum, highlighting the country of origin,
relative volumes and details of total amount of specimens seized between 2003-2009. China was the most
prevalent source country for illegal shipments to the U.S. of this red coral species, mainly used for
jewelry.
v
U.S. Seizures of Corallium secundum (source: TRAFFIC Wildlife Trade Tracker Mapping Tool, 2011)
In addition to illegal, large-scale commercial shipments of precious corals, there is also an illegal trade in
frequent, small volumes by individuals that annually amounts to significant total volumes of precious
corals. An example of this is the extensive trade in black coral jewelry sold to tourists in the Caribbean
that is then exported when the travelers and tourists bring their coral home. While this may be classed by
some countries as exempt under CITES as personal effects, other countries will seize these products if
they do not have CITES documentation for CITES listed species like black coral. In other cases, the precious corals may have been harvested and exported illegally under domestic laws of the country of

47
origin, or the products smuggled into the country of sale (as was the situation with the black coral
smuggling case detailed above in the U.S. Virgin Islands).
48
Conclusion
The global nature of the trade in coral reef species means that there is a strong correlation with market
drivers and the ‘push and pull’ effect of shifting economies, prices, and elasticity of demand. The
increased demand for sustainable products creates additional opportunities for alternative products or
captive-bred animals to meet the need, but currently, the overwhelming majority of coral reef species
collected for trade are taken from the wild. Whatever shifting realities may emerge, the analysis
conducted in this report has found that:
• At least 95% of all U.S. imports of coral reef associated species are wild sourced and the trade to
the U.S. continues to be driving wild harvest, despite some dip in demand during the economic
crisis years of 2008 and 2009.
• Imports of over 12 million live fish per year in 2008 and 2009 are indicators of that high demand, even if they are approximately one third lower in volume than the peak of 18 million live fish that
were imported in 2006. (But that dip in recent years may be temporary as demand rebounds and
economic growth resumes.)
• The massive growth in imports of coral species during the recession period may result from better
trade data transparency or it could be linked to a major fashion trend for coral jewelry that
evolved from around 2007 onwards.
From the trade analysis in this report it is clear that in the case of coral species, there is a significant
increase in trade to the U.S. in recent years, as fashion demand for precious coral jewelry has gone
through a boom period and the aquaria industry has seen a growing popularity for saltwater aquaria. The
combination of increasing demand, with declining wild populations, damaging extractive measures, and
high mortality rates in the supply chain is a hazardous mix for the health of coral reef ecosystems,
particularly when the impacts of climate change and ocean acidification are becoming more pronounced
in many areas. Burgeoning human populations in developing countries, particularly in coastal areas with
reefs, also means that the demand to make a living from the reef will not dissipate.
Local people in exporter countries sometimes have few options other than using their natural resources
that surround them, which increases the mounting pressures on coral reefs. In theory, if harvest,
management and trade in reef associated species is undertaken in a sustainable and equitable way there
are long term opportunities and benefits to both conserve reefs and meet people’s needs. Consumer
nations then, have a responsibility to ensure that reef associated species being imported are sourced
sustainably, legally and equitably and that they limit the opportunities for illegal and unsustainable supply
reaching their market. The need to establish successful quotas, effective monitoring, and the continued
implementation of industry standards to protect this shared and essential resource is an increasingly
important requirement, not only for the industries that utilize coral reef species, but for the lives that are
dependent on it. Consumer education and implementation of practices that reduce negative ecosystem
impacts can also lessen demand for fish or invertebrates caught unsustainably. For example, a more
environmentally-sensitive aquarium trade could provide the opportunity to educate the public about
environmental issues and increase understanding of what is often perceived as a hidden ecosystem
(Wabnitz et al. 2003).
All of this suggests that now is the time to harness the demand for coral reef wildlife to direct it towards
sustainable and alternative products before it expands again. With a role as the largest importer and
consumer of coral reef associated species, the U.S. has a responsibility to take appropriate action to
ensure that its negative impacts on coral reefs globally are minimized. It seems obvious that if the U.S. imposes measures to ensure sustainable sourcing of supply, then harvesters, exporters, and traders have to
respond accordingly or abandon exports to the U.S. With such a large market share, changes in demand

49
dynamics by the U.S. cannot be ignored. The markets in Europe and Asia are significant but may not be
large enough to consume the resulting excess supply of unsustainably-harvested species.
Coral reefs are undeniably important to ecosystems, providing shoreline protection, recreation and
tourism, sources of food, jobs, pets, ornaments and pharmaceuticals to millions of people. Their value is
estimated at approximately $375 billion each year (USCRTF). However, according to the World
Resources Institute’s 2011 Reefs at Risk Revisited report, more than 60% of all reefs are threatened due to
local sources of human activities, and when combined with thermal stresses, like rising ocean
temperatures, almost 75% of coral reefs are rated as threatened (Burke et al. 2011). Harvesting corals,
reef rock and coral reef fishes for the trade is also currently unsustainable and contributes to the continued
and significant deterioration of coral reef ecosystems (Bruckner 2008). A study of 300 reefs found that
species targeted for commercial interest were absent or only present in low numbers at a majority of the
reefs, signaling deleterious effects due to overharvesting (USCRTF). Given the growing evidence for the
decline of coral reefs, it would appear prudent for the U.S. to start developing standards to ensure trade is
sustainable without delay. The potential for the U.S. to play a globally catalytic role in securing a future
for coral reef species subject to trade is very real. Stepping up and taking responsibility now is vital
before it is too late. The following section provides recommendations to guide behaviors and actions that
are needed for the U.S. and other stakeholders to take that responsibility seriously.

50
Recommendations
The trade in coral reef wildlife for aquarium use, jewelry, and home decor is growing, in volume and
scope. There are approximately 45 countries participating in the trade, but new collection areas and
species are continually being discovered and exploited. Indonesia and the Philippines continue to be the
largest exporters of these animals, whereas the U.S. remains the world’s largest importer, putting it in a
unique position to reform the market. The following are recommendations to the U.S. government that
should be pursued in concert with other countries, industry, and civil society on key issues that require
intervention to address the management loopholes that currently plague the trade and jeopardize coral reef
wildlife. Many of these recommendation support suggestions previously outlined by the U.S. Coral Reef
Task Force. Those recommendations are provided in their entirety in Appendix II.
Recommendations to the U.S. Government:
• Legislation and Regulations – New U.S. legislation should be enacted in Congress to establish
federal import and export standards that would require that collection, handling, and transport
activities only occur for ornamental purposes, if, when, where, and as appropriate, as judged
against clear sustainability criteria. Legislation should include a rulemaking process that would
provide stakeholders, including the public, a voice in further defining allowable collection and
transportation activities as well as reporting requirements and should address other key issues,
consistent with standards provided in legislative language. The U.S. is the world’s largest
consumer of coral reef wildlife used for ornamental purposes, purchasing 60% or more of the
world’s supply. Requiring that all coral reef wildlife imported into or exported from the U.S. meet
high standards for sustainable collection, holding, and transport will create real incentives for
improvements in source countries and throughout the supply chain, thereby driving global reform
of current practices
• International Cooperation – To reform international trade of coral reef wildlife
comprehensively and to increase the effectiveness of policies adopted domestically, the U.S.
should work with major import markets as well as export/harvest nations. Specifically, to prevent
the diversion of unsustainable and illegal products, the U.S. should encourage and partner with
other import nations, such as the E.U., to develop joint mechanisms to close major markets to
illegal trade and unsustainably harvested wildlife and to harmonize standards for evaluating such
products.
Additionally, the U.S. should support the creation or improvement of in-country, coral reef
fisheries management plans that address ecological, social, and economic considerations. At a
more local level, the U.S. should work with partners to strengthen agency and community
capacity for effective and consistent enforcement of regulations or behaviors that reduce impacts
of fishing on coral reef ecosystems. U.S. demand for ornamental products has incentivized illegal
and destructive practices that hurt local reefs and economies. Voluntary efforts have been
laudable, but largely insufficient in a system with no accountability and significant profit
potential. Increased capacity and regulatory oversight in key harvest nations will substantially
improve the current situation and provide the necessary counterpart to increased import controls.
• Convention on the International Trade of Endangered Species (CITES) – As progress
continues toward new legislative authority and in addition to that authority, the U.S. government
should continue to support CITES and its initiatives to train CITES scientific authorities in source
countries to implement CITES and identify coral reef species that may require CITES listing. The
U.S. should also provide support for CITES non-detriment findings and capacity building, to

51
establish research, monitoring, and management measures and protocols for, CITES listed, coral
reef species.
However, there is recognition of the limitations of CITES, often because of political factors.
Because of their potential power and utility, CITES-based strategies should be incorporated in a
broader set of approaches to reform the ornamental trade. In terms of specific problems to date
and potential solutions, there is a recognition that despite the efforts of CITES to list some marine
ornamental fish species on Appendix II, only a handful of such species are listed under CITES.
Additionally, there are challenges for many CITES parties to implement non- detriment findings
where population data are lacking and resources and expertise are low, particularly for stony
corals that are listed on CITES Appendix II. It is vital that in situ management approaches look
at the ecosystem as a whole and do not deal in isolation with a few specific target species. Where
CITES is applicable, the effective use of CITES non-detriment findings, combined with holistic
management is necessary.
• Government Data – Although the trade in coral reef wildlife is tracked through federal import
and export records (LEMIS), this information, in its current form, lacks the level of detail
necessary for it to be used effectively, particularly for marine invertebrates and fish. The data’s
level of resolution is not refined enough to allow managers to quantify and assess the trade in
most coral reef species that are imported into the U.S. Resolving this will require reporting
taxonomic groupings involved in the trade at greater levels of specificity. This change would
allow the U.S. to improve its recordkeeping and data availability to empower the National
Oceanic Atmospheric Administration and Fish and Wildlife Service to assess trends in trade
volume, sources, species, and violations. Additionally, a new, system of harmonized tariff codes
for customs should be established internationally, including through U.S. support, to improve the
level of detail and increase transparency in the trade statistics related to species type and uses.
Recommendations to Marine Ornamental Industry:
• Supply Chain – Businesses should identify sustainable suppliers and establish Corporate Social
Responsibility policies in order to make the most responsible purchasing decisions, particularly in
the absence of regulatory import standards and potentially to go beyond those standards if
established. Professionals throughout the supply chain should be trained in suitable practices to
reduce mortality at every stage of the supply chain, thereby reducing collection pressure on coral
reefs. Some coral reef wildlife businesses already rely on shorter supply chains that both reduce
the time animals spend in transit and increase the accountability of source country suppliers.
• Certification – Although voluntary certification efforts could produce a set of industry best-
practices for sustainable sourcing, establishment of federal standards would significantly help to
reform harvest activities in exporting countries by creating a meaningful point of accountability
in the trade and by creating consistent standards for all U.S. import and export. However,
businesses play a key role in generating the necessary groundswell of interest and support for
setting standards to improve the industry and species and ecosystem sustainability. If willing
businesses were to demand sustainably harvested coral reef products in the near term and over
time, the health of coral reef ecosystems would improve as well as the variety of services and
economies that they support.
• Engaging Consumers and Promoting Sustainable Products – Businesses should promote
sustainable products and alternatives that can be used in place of species and products that are
damaging to coral reef ecosystems. For example, businesses can promote the benefits of captive-
bred and sustainably-sourced supply as premium products as a means to help the reef ecosystem
52
and to provide consumer confidence. The use of social media, industry forums, and media to raise
awareness among the industry and their consumers about the real world impacts of this trade –
including encouraging naming and shaming of countries, regions, suppliers, and traders involved
in damaging harvest and sourcing practices –could go a long way toward securing legally binding
and voluntary reforms. When the trade is improved, American retailers and consumers can feel
confident that their purchases are sustainable and, in the case of pets, healthy.
• Philanthropy – Businesses could set up an industry-based donation initiative, in which the
donations would flow into a relevant conservation fund such as the U.S. Coral Reef Conservation
Fund. This fund could be linked to donations made by consumers through retail outlets at point
of sale.
Recommendations to Civil Society:
• Conservation Community and Public Awareness – Broaden a coalition group of concerned
conservation and industry groups in the U.S. to link to civil society groups in source countries to
share information, provide mutual support, and develop global campaigns to protect reefs from
unsustainable harvest and trade. This could also include naming and shaming the worst offending
companies that are trading in species and products that are having the greatest negative impact on
coral reefs.
• Advocacy – Increase awareness and political will to encourage multi-sector initiatives and
resource allocation in support of the types of recommendations provided in this report including:
pressure governments in source countries and the U.S. to impose laws and regulations to prevent
illegal and unsustainable harvest and trade and damaging harvest practices, support governments
in developing appropriate new CITES Appendices listing proposals or amendments to existing
listings for selected taxa groups to improve trade transparency, and help initiate management
programs linked to CITES.
• Alternatives – Identify alternative income streams, positive economic incentives and
community-based programs to promote effective conservation measures linked to livelihoods
schemes.

53
APPENDIX I – Methods, Data Recording and Reporting
This appendix explains in more detail the methods employed in producing this report and the caveats
involving data sources and analysis.
The report primarily covers trade in coral reef species used for ornamental purposes. For the purposes of
this report, “ornamental” use includes living specimens used in aquaria and dead species used for home
decor, curio and jewelry. The report includes “live rock”: live rock is largely calcareous rock with micro
and macroscopic marine life attached to or living inside of it and, also traded for use in marine aquaria. It
can be challenging to identify the species attached to the rock, but it may be comprised of encrusting
organisms, such as coralline algae and sponges, macroalgae, clams, mussels, crabs and shrimps. Most
trade in live rock to the U.S. is documented in trade statistics by number of pieces of rock and not by
weight.
Due to the nature of the data available and the way in which the data are grouped (i.e. there is not a great
degree of resolution for the purpose of imports), it is almost impossible to know of all potential uses -
commercial, scientific, personal, etc. - of the traded coral reef species. The vast majority of the data by
both volume and frequency of imports, however, do relate to species traded for ornamental purposes.
It is important to note however, that the trade in coral reef species extends beyond the trade for
ornamental purposes, such as live reef fish trade for food markets. Coral reef ecosystems and the genetic
diversity within are also being used to develop medicines and other potentially beneficial chemical
compounds. Many species found in coral ecosystems are important sources of new pharmaceuticals being
developed to induce and ease labor, treat cancer, arthritis, asthma, ulcers, human bacterial infections,
heart disease viruses, and other diseases; as well as sources of nutritional supplements, enzymes, and
cosmetics (Burke 2002).
This report does not attempt to update global figures for international trade; rather it summarizes available
information to date on international trade of coral reef associated species from existing literature. Import
data for the United States was gathered from the U.S. Fish and Wildlife Service’s Law Enforcement
Management Information System (LEMIS) database.
Quantifying this trade, and monitoring and evaluating the extent, scale and frequency of the trade in
marine ornamental species is necessary to evaluate the sustainability of the harvest of those species, and
to detail the scope of U.S. involvement as the primary driver of that trade. However, any analysis of the
volume of the trade and the composition of the marine ornamental species in the trade is highly
challenging due to the limited details and poor resolution of the trade data being collected internationally.
This report attempts to tackle that challenge, to show trends and indicators in the trade, and to flag
significant concerns. In some cases identifying species specific challenges was not possible because the
existing official data does not always contain species specific detail.
Data Recording, Reporting, and CITES
The Global Marine Aquarium Database (GMAD) was created in 2000 by the United Nations
Environment Program’s World Conservation Monitoring Center (UNEP-WCMC), the Marine Aquarium
Council (MAC), and members of several aquarium trade associations in order to provide better and more
accurate trade data (Wabnitz et al. 2003). The GMAD and MAC have both now ceased operation.
GMAD contained voluntarily contributed data from wholesale exporters and importers that had been
combined and standardized into quantitative, species-specific information and made available to the
public through a website. Records were by species name, quantity, date, and origin/destination. However,

54
the data came from only “58 companies, approximately one-fifth the wholesalers in business, and four
government management authorities” (Wabnitz et al. 2003). Furthermore, because some importers trade
with exporters, the data could not be combined to produce trade totals because it would contain
duplications. Therefore, GMAD data “cannot be used to calculate net volumes of trade in any one species,
or between any pair of countries” (Wabnitz et al. 2003). It is best used as an “indicator of trends” and
allows for estimates based on quantitative rather than qualitative data for the first time with respect to fish
and invertebrates (Wabnitz et al. 2003).
The Convention on the International Trade of Endangered Species (CITES) is an international agreement
that aims to protect wildlife by ensuring that international trade is not detrimental to the survival of
species in the wild. Established in 1973, by 2011 CITES had 177 member countries called Parties.
Animal and plant species threatened by trade are listed under one of three appendices within CITES.
Appendix I includes species threatened with extinction which are or may be affected by trade:
international trade for primarily commercial purposes in listed species is not permitted. CITES Appendix
II includes species which may become threatened with extinction if trade controls are not in put place:
international trade is allowed by only when the scientific authority of the exporting party has determined
that the export will not cause a detriment to wild populations (known as the non-detriment findings), and
when the management authority has determined that the specimens were legally acquired and, in the case
of live animals, that they will be prepared and shipped so as to minimize injury, damage to health, or cruel
treatment. Appendix III includes species that are unilaterally listed by parties on that Appendix because
the parties seek international cooperation to control the trade in that species: international trade is
permitted without the exporting country making a non-detriment finding.
Regarding the CITES non-detriment finding, there is often a significant lack of data on the population
status for most marine species in trade and many countries do not have the scientific capacity to undertake
the process of a “non-detriment finding”. Despite this, many countries issue CITES export permits. Stony
and black corals are the few types of coral reef wildlife that are listed on CITES. Because of the difficulty
of identifying coral to the species level, CITES has allowed export permits to be at the genus level.
However, the problem is that the abundance and distribution of coral species varies immensely, and
therefore, the threat of over collection (and that of other impacts) on individual coral species varies just as
immensely. Hence, issuing CITES permits at the genus levels may drive certain species to extinction
through over collection and the identification of a species nearing extinction might not even be known
(Wabnitz et al., 2003)
Each CITES party is required to report trade in CITES listed species to the CITES Secretariat on an
annual basis. However, there are a number of problems in the way these data are reported. Coral trade
can be recorded as weight or number for instance. For corals, many countries will not report trade
statistics on the number of specimens exported (Wood, E. 2001). Collectors in Vanuatu, Tonga and
Solomon Islands are required by the CITES authorities to submit export records, documenting the number
of each species exported to maintain government compliance and keep their license (Green E. 2002).
Australia is unique in that collectors are required to register catch data, as opposed to export data.
Government records, which may cover non-CITES species as well as different datasets, have faults as
well. There are concerns about the accuracy of reporting, but in particular trade categories are
infrequently reported fully, and specimens were frequently combined (especially prior to the creation of
U.S. tariff codes), making it difficult to differentiate freshwater specimens from marine specimens, fish
from invertebrates, etc. With greater clarity required under changes to the US tariff codes there was a
distinction between freshwater and marine fish for aquaria trade for example.
Trade statistics available by weight, also include the weight of the water and packaging, potentially
leading to an overestimation of the number of animals involved; Furthermore, trade data obtained through
customs should be treated with caution, particularly in regard to exports, as some operators have been

55
known to understate quantities so as to reduce the amount of tax payable and keep annual shipments
within the individual allowable quota.

56
APPENDIX II – U.S. Coral Reef Task Force (USCRTF) 2010-15 International Goals and
Objectives
Goal 1: Work with regional initiatives to build MPA networks and strengthen local management
capacity to improve and maintain resilience of coral reef ecosystems and the human communities that
depend on them.
• Objective 1.1: Work with regionally-based social networks of MPA practitioners to undertake
capacity assessments that will form the basis of future Coral Reef Conservation Program (CRCP)
support.
• Objective 1.2: Develop and implement comprehensive long-term capacity building programs for
existing MPAs, based on capacity assessments to provide training, technical assistance, and
follow-up support specifically for:
o Management planning and effectiveness evaluations;
o Community engagement program development;
o Integrated biophysical and socioeconomic monitoring linked to site management goals,
including data analysis and interpretation;
o Use of climate change tools and crisis response planning; and
o Other topics as needed
• Objective 1.3: Increase local enforcement capacity to improve compliance with MPA regulations
and conservation-oriented customary practices.
• Objective 1.4: Support the development and sustainable finance tools and site implementation of
sustainable finance plans to ensure long-term support for conservation efforts.
• Objective 1.5: Use regionally appropriate biophysical and socioeconomic monitoring and
evaluation protocols to:
o Establish baselines and detect changes over time in an adaptive management framework;
and
o Identify priority sites for conservation and assess community support for designation of
new MPAs and MPA networks.
Goal 2: Develop and implement tools and practices to more effectively observe, predict, communicate,
and manage climate change impacts in priority international locations.
• Objective 2.1: Collaborate with global partners to broaden the international delivery of coral
bleaching prediction and warning tools and improve the science and technology for predicting
climate impacts on global coral reef ecosystems.
• Objective 2.2: Expand observing networks to identify and monitor priority coral reef areas that
are especially resilient or vulnerable to climate change.

57
• Objective 2.3: Develop international case studies on impacts of climate change and ocean
acidification in order to encourage global greenhouse gas reductions and to encourage greater
incorporation of climate change impacts on coral reefs into future global assessments.
• Objective 2.4: Build local capacity to test, implement and evaluate management strategies to
respond to climate change impacts.
Goal 3: Strengthen local and national capacity and policy frameworks to reduce impacts of fishing on
coral reef ecosystems.
• Objective 3.1: Provide support and technical assistance to strengthen fisheries policy, governance
and regulatory measures at national and regional levels to foster an ecosystem-based approach to
fisheries management.
• Objective 3.2: Facilitate local cooperative enforcement partnerships and socioeconomic
monitoring to address community concerns and to assess and improve compliance with
sustainable fishing regulations and customary practices.
• Objective 3.3: Assess the U.S. role in the international trade of coral reef-based ornamental, food
and curio species, evaluate U.S. and international legal mechanisms to assess trade impacts and
work with exporting countries to adopt sustainable and responsible harvesting measures.
Goal 4: Strengthen policy frameworks and institutional capacities to reduce impacts to coral reef
ecosystems from pollution due to land-based activities.
• Objective 4.1: Support national-level and regional initiatives to identify priority coral reef
areas threatened by pollutants and assess pollutant sources to those areas.
• Objective 4.2: Collaborate with U.S., regional and local partners to develop and implement
coastal and watershed management plans to reduce land-based pollution.
• Objective 4.3: Support national-level and regional initiatives to determine gaps in policy and
legislation preventing the effective management of land-based pollutants.
NOAA Coral Reef Conservation Program. 2009. NOAA Coral Reef Conservation Program International
Strategy 2010-2015. Silver Spring, MD: NOAA

58
References
Allen, G. & Donaldson, T. (2007). Pterapogon kauderni. In: IUCN 2010, IUCN Red List of Threatened
Species, Version 2010.4. www.iucnredlist.org ARKive (2008). “Giant clam – (Tridacna gigas)” ARKive Image of Life on Earth. Authenticated
(25/02/08) by Dr Rick Braley, Aquasearch Lab, Aquarium and Consultancies, Queensland,
Australia. http://www.arkive.org/giant-clam/tridacna-gigas/
ARKive. (2009). “Banggai cardinalfish (Pterapogon kauderni)” ARKive Images of Life on Earth.
Authenticated (13 April 2009) by Dr Alejandro Vagelli, Director of Science and Conservation,
New Jersey Academy for Aquatic Sciences. http://www.arkive.org/banggai-cardinalfish/pterapogon-
kauderni/
Blundell, A. (2010). “Banggai Cardinals – Pterapogon kauderni debates” Reef Addicts, 14 September
2010. http://www.reefaddicts.com/content.php/210-Banggai-Cardinals-Pterapogon-kauderni-debates
Boland, R. and Parrish, F. (2005). A Description of Fish Assemblages in the Black Coral Beds off
Lahaina, Maui, Hawai‘i. Pacific Science, 59 (3), pp. 411-420.
Bruckner, A. (2008) Sustainable Management Guidelines for Stony Coral Fisheries. Marine Ornamental
Species: Collection, Culture and Conservation.
Bruckner, A., De Angelis, P., Montgomery, T. (2008). Case Study for Black Coral From Hawaii. NDF
Workshop Case Studies, WG 9 – Aquatic Invertebrates, Case Study 1, Mexico 2008.
Bruno, J.F. & Selig, E.R. (2007). Regional decline of coral cover in the Indo-Pacific: Timing, extent, and
subregional comparisons. PLoS ONE, 2(8).
Burke, L., Reytar, K., Spalding, M., Perry, A. (2011). Reefs at Risk Revisited. World Resources Institute. http://pdf.wri.org/reefs_at_risk_revisited.pdf
Cerrano, C., Danovaro, R., Gambi, C., Pusceddu, A., Riva, A., Schiaparelli, S. (2010). Gold coral
(Savalia savaglia) and gorgonian forests enhance benthic biodiversity and ecosystem functioning
in the mesophotic zone. Biodiversity and Conservation, 19(1), pp. 153-167.
Cesar, H., Burke, L., Pet-Soede, L. (2003). The Economics of Worldwide Coral Reef Degradation. Cesar
Environmental Economics Consulting: 24.
CITES (2007). Consideration of Proposals for Amendment of Appendices I and II. Proposal 19.
Fourteenth meeting of the Conference of the Parties, The Hague. http://www.cites.org/eng/cop/14/prop/index.shtml
CITES. (2010). CoP15 Prop. 21. Consideration of Proposals for Amendment of Appendices I and II.
Proposal 21. Fifteenth meeting of the Conference of the Parties. The Hague. http://www.cites.org/eng/cop/15/prop/E-15-Prop-21.pdf
Costanza, R. et al. (1997). The value of the world’s ecosystem services and natural capital. Nature. Vol.
387. Pp. 253-260
Debenham, P. (2008). Coral in the Red – The State of Corals and Recommendations for Recovery. Too
Precious to Wear. SeaWeb, Washington DC, USA.
Department of Justice. (2010). “Taiwanese Couple Sentenced to Prison for Illegally Trading Protected
Black Coral” Office of Public Affairs, U.S. Department of Justice. 23 June 2010.
Department of Justice. (2011). “U.S. Virgin Islands Company Sentenced for Illegal Trade of Protected
Coral.” Office of Public Affairs, U.S. Department of Justice. 11 July 2011.

59
Donnelly, R.J., Davis, D.C. & Lam, M., (2000) Socio-economic and biological aspects of the live reef
food fish trade and its development in Solomon Islands. Discussion Paper No.1. Report to
Australian Centre for International Agricultural Research. ACIAR, Canberra. pp. 52 http://library.enaca.org/Grouper/E-Newsletter/Socio.pdf
Engler, M. & Parry-Jones, R. (2007). Opportunity or Threat?TRAFFIC International, Cambridge, UK.
Garcia, L.M., Hilomen-Garcia, G. (2009). Grow-out of juvenile seahorse Hippocampus kuda in
illuminated sea cages. Aquaculture Research, 40, pp. 211-217.
Giles, B., Truong, S.K., Do, H.H., Vincent, A. (2006). The catch and trade of seahorses in Vietnam.
Biodiversity and Conservation, 15, pp. 2497-2513.
Gladstone, W. (2009). “Conservation and Management of Tropical Coastal Ecosystems” In Ecological
Connectivity Among Tropical Coastal Ecosystems, pp. 565-605.
Göthel, H. (1992). (Ref. 358). Palomares, M.L.D. and D. Pauly. Editors. 2010. SeaLifeBase. http://sealifebase.org/Summary/speciesSummary.php?ID=42663&genusname=Corallium&speciesname=rubrum
Green, E. (2002) International Trade in Marine Aquarium Species: Using the Global Marine Aquarium
Database.
Grey, M., Blais, A., Vincent, A. (2005) Magnitude and trends of marine fish curio imports to the USA.
Oryx, Vol. 39(4), October, 2005. pp. 413-420.
Gomez, E. & Mingo-Licuanan, S. (2006). Achievements and lessons learnt in restocking giant clams in
the Philippines. Fisheries Research, 80, pp. 46-52.
Harrison, P. (2011) Sexual Reproduction of Scleractinian Corals. Coral Reefs: An Ecosystem in
Transition. Spring Science and Business, Media B.V. 2011
Hoegh-Guldberg, O. et al. (2009). The Coral Triangle and Climate Change: Ecosystems, People and
Societies at Risk. WWF Australia, Brisbane.
Koldewey, H. & Martin-Smith, K. (2010). A global review of seahorse aquaculture. Aquaculture, 302, pp.
131-152.
Lebata-Ramos, J.H. et al. (2010). Growth and survival of hatchery-bred giant clams (Tridacna gigas) in
an ocean nursery in Sagay Marine Reserve, Philippines. Aquaculture International, 18, pp. 19-33.
Lindsay, S., Ledua, E., Stanley, J. (2004). Regional Assessment of the Commercial Viability for Marine
Ornamental Aquaculture Within the Pacific Islands (Giant Clam, Hard & Soft Coral, Finfish,
Live Rock & Marine Shrimp). Secretary of the Pacific Community Aquaculture Technical
Papers, January 2004, p. 99.
Livengood, EJ. & Chapman, FA. (2011) The Ornamental Fish Trade: An Introduction with Perspectives
for Responsible Fish Ownership. University of Florida. IFAS Extension. FA 124. http://edis.ifas.ufl.edu/pdffiles/FA/FA12400.pdf
Lovell, ER. (2001). "Collection of Coral and Other Benthic Reef Organisms for the Marine Aquarium and
Curio Trade in Fiji." 1-82. Print.
Lunn, K. & Moreau, M. (2004). Unmonitored Trade in Marine Ornamental Fishes: the Case of
Indonesia’s Banggai Cardinalfish (Pterapogon kauderni). Coral Reefs, 23, pp. 344–351.
Ming-Ho, H. & Ching-Hsiewn, O. (2010). Precious coral fisheries management in Taiwan—Past, present
& future. Marine Policy, 34, pp. 1002-1009.
Mingoa-Licuanan, S. & Gomez, E. (2002). Giant Clam Conservation in Southeast Asia. Tropical Coasts,
9(2).

60
Miththapala, S. (2005). An introduction to the trade in wild species used for medicinal purposes. Pp. 76-
87 in Conserving Medicinal Species: securing a healthy future. IUCN: Ecosystems and
Livelihoods Group, Asia.
Monticini, P. (2010) The Ornamental Fish Trade – Production and Commerce of Ornamental Fish:
technical-managerial and legislative aspects. Globefish Research Program
Mumby, PJ. et al. (2006). Fishing, trophic cascades, and the process of grazing on coral reefs. Science
311: 98-101.
Okuzawa, K. et al. (2008). Stock Enhancement of Threatened Species in Southeast Asia. Reviews in
Fisheries Science, 16(1), pp. 394-402.
Olivier, K. (2001). The Ornamental Fish Market, p 91. Food and Agriculture Organization of the United
Nations, Rome, Italy.
Othman, A.S., Goh, G., Todd, P. (2010). The Distribution and Status of Giant Clams (Family
Tridacnidae) – A Short Review. The Raffles Bulletin of Zoology, 58(1), pp. 103-111.
Nijman, V. (2010). An overview of international wildlife trade from Southeast Asia. Biodiversity
Conservation, 19, pp. 1101-1114.
Paulay G. (1997). Diversity and distribution of reef organisms. Life and Death of Coral Reefs [ed. C
Birkeland], pp.298-353. Chapman and Hall, New York, USA
Pawar, H.B. et al. (2010). Comparative efficacy of four anesthetic agents in the yellow seahorse,
Hippocampus kuda. Aquaculture, Article in Press.
Perry, A., Lunn, K., Vincent, A. (2010). Fisheries, large-scale trade, and conservation of seahorses in
Malaysia and Thailand. Aquatic Conservation: Marine and Freshwater Ecosystems, 20, pp. 464-
475.
Project Seahorse 2003. Hippocampus kuda. In: IUCN 2010. IUCN Red List of Threatened Species.
Version 2010.4. <www.iucnredlist.org>. Downloaded on 21 December 2010.
Roark, E., Guilderson, T., Dunbar, R., Ingram, L. (2006). Radiocarbon-based ages and growth rates of
Hawaiian deep-sea corals. Mar Ecol Prog Ser, 327, pp. 1-14.
Roark, E., Guilderson, T., Dunbar, R., Fallon, S., Mucciarone, D. (2009). Extreme longevity in
proteinaceous deep-sea corals. PNAS, 106(13), pp. 5204-5208.
Rubec, PJ. (1987). The effects of sodium cyanide on coral reefs and marine fish in the Philippines.
Marine Fish Monthly 2: 7-47.
Salin, K.R., Yohannan, T.M., Mohanakumaran Nair, C. (2005). Fisheries and trade of seahorses,
Hippocampus spp., in southern India. Fisheries Management and Ecology, 12(4), pp. 269-273.
Sanders, J., Cribbs, J., Fienberg, H., Hulburd, G., Katz, L., Palumbi, S. (2008). The tip of the tail:
molecular identification of seahorses for sale in apothecary shops and curio stores in California.
Conservation Genetics, 9, pp. 65-71.
Scales, H. (2010). Advances in the ecology, biogeography and conservation of seahorses (genus
Hippocampus). Progress in Physical Geography, 34(4), pp. 443-458.
Tacio, H. (2008). “Coral Reefs: Medicine cabinets for the 21st century.” The Daily Guardian. 25
September 2008.
Tissot, B. & Hallacher, L. (1999). Impacts of Aquarium Collectors on Coral Reef Fishes in Kona, Hawaii.

61
Department of Land and Natural Resources, Division of Aquatic Resources, Honolulu, Hawaii,
USA.
Tissot, B. (1999). Adaptive management of aquarium fish collecting in Hawaii. Secretariat of the Pacific
Community Live Reef Fish Information Bulletin, 6, 16-19
Tissot, BN. et al. (2010). How U.S. ocean policy and market power can reform the coral reef wildlife
trade. Marine Policy (2010), doi:10.1016/j.marpol.2010.06.002
Tsounis, G., Rossi, S., Grigg, R., Santangelo, G., Bramanti, L., Gili, J.M. (2010). The Exploitation and
Conservation of Precious Corals. Oceanography and Marine Biology: An Annual Review, 48, pp.
161-212.
UNEP. (2001). UNEP-WCMC World Atlas of Coral Reefs Coral Reef Unit
U.S. Fish and Wildlife Service. (2008). Notice to the Wildlife Import/Export Community. April 8, 2008.
Washington DC, USA.
U.S. Fish and Wildlife Service. (2009). Office of Law Enforcement. Import/Export Key. November 2009.
Washington DC, USA.
Vagelli, A., Burford, M., Bernardi, G. (2008). Fine scale dispersal in Banggai Cardinalfish, Pterapogon
kauderni, a coral reef species lacking a pelagic larval phase. Marine Genomics, 1(3-4), pp. 129-
134.
Vagelli, A. (2008). The unfortunate journey of Pterapogon kauderni: A remarkable apogonid endangered
by the international ornamental fish trade, and its case in CITES. SPC Live Reef Fish Information
Bulletin #18, November 2008.
Wabnitz, C., Taylor, M., Green, E., Razak, T. (2003). From Ocean to Aquarium – The global trade in
marine ornamental species. UNEP-WCMC, Cambridge, UK.
Wells, S. (1996). Tridacna gigas. In: IUCN 2010. IUCN Red List of Threatened Species. Version 2010.4.
www.iucnredlist.org
Wood, E. (2001) Collection of Coral Reef Fish for Aquaria: Global Trade, Conservation Issues and
Management Strategies.
Wu, J. & Takahashi, S. (2009). “The Fishery and Trade of Corallium in East Asia” TRAFFIC East Asia.
In Bruckner, A. and Roberts, G. (editors) 2009. Proceedings of the First International Workshop
on Corallium Science, Management, and Trade. NOAA Technical Memorandum NMFS-OPR-43
and CRCP-8, Silver Spring, MD. pp. 153

62