: an investigation of the by frank joseph palermo,...
TRANSCRIPT

An investigation of the two-dimensional Coanda effect
Item Type text; Thesis-Reproduction (electronic)
Authors Palermo, Frank Joseph, 1931-
Publisher The University of Arizona.
Rights Copyright © is held by the author. Digital access to this materialis made possible by the University Libraries, University of Arizona.Further transmission, reproduction or presentation (such aspublic display or performance) of protected items is prohibitedexcept with permission of the author.
Download date 02/05/2018 14:17:43
Link to Item http://hdl.handle.net/10150/347509

: AN INVESTIGATION OF THE TWO-DIMENSIONAL "COANDA EFFECT"
byFrank Joseph Palermo, Jr.
A Thesis Submitted to the Faculty of theDEPARTMENT OF AEROSPACE ENGINEERING
In Partial Fulfillment of the Requirements For the Degree ofMASTER OF SCIENCE
In the Graduate CollegeTHE UNIVERSITY OF ARIZONA
1 9 6 5

STATEMENT BY AUTHOR
This thesis has been submitted in partial fulfillment of requirements for an advanced degree at the University of Arizona and is deposited in The University Library to be made available to borrowers under rules of the Library.
Brief quotations from this thesis are allowable without special permission, provided that accurate acknowledgement of source is made. Request for permission for extended quotation from or reproduction of this manuscript in whole or in part may be granted by the head of the major department or the Dean of the Graduate College when in his judgment the proposed use of the material is in the interest of scholarship. In all other instances, however, permission must be obtained from the author.
SIGNED
APPROVAL BY THESIS DIRECTOR This thesis has been approved on the date shown below
E. K. PARKS “ BiteProfessor of Mechanical Engineering
(Aerospace)

ACKNOWLEDGEMENT
Acknowledgement is made to the United States Army for the selection of the author for advanced schooling which made this study possible.
The professional assistance given by the author? s advisors Dr. Edwin K. Parks, Professor of Aerospace Engineering, is deeply appreciated. Dr. Parks8 optimism and positive attitude have been a constant source of encouragement .
Gratitude is expressed to Mr. Bernd Uhrmeister for his advice on problems encountered and to Mr. 0. B. O’Brien for his assistance in the construction of the test equipment.
Finally, thanks are expressed to Mrs. Meta Anderson for the typing of the script.
iii

table of contents
PageLIST OF ILLUSTRATIONS . . . . . . . . . . . . . . . viLIST OF SYMBOLS . . . . . . . . . . . . . . . . . . ¥111ABSTRACT . . . . . . . . . . . . . . . . . . o . . 3C3.CHAPTER
I INTRODUCTION 0 0 0 0 0 9 0 0 0 0 0 0 0 0
1.1 Ces eiral . . . o . . . . . . . . . . . 11.2 Historical Development . . . . . . . . 21.3 Review of the Literature . . . . . . . 91.4 Purpose of the Present Study . . . . . 26
II THEORETICAL DEVELOPMENT . . . . . . . . . . 282.1 General . . . . . . . . . . . . o . . . 282.2 Order of Magnitude Analysis . . . . . 282.3 Solutions Using Approximate Methods . 34
2=3.1 Jet Width Growth . . . . . . . 342 = 3 =2 The Velocity / 14*, as a Function
of 0 . 0 0 0 . . 0 . 0 O O '. 372.3=3 The Variation of l/e along the
Cylinder . . . . . . . . . . . 382.4 Discussion of the **Coanda Flow” Equa
tions 0 0 0 0 0 0 0 0 0 0 0 0 0 0 0 . 0 42III TEST APPARATUS AND DATA MEASURING EQUIPMENT 44
3.1 Test Apparatus . . . . . . . . . . . . 443.1.1 Air Supply . . . . . . . . . . 443.1.2 PIenum . . . . . . . . . . . . 463.1.3 Two-Dimensional Coanda Nozzle . 46

CHAPTER PageIII (Coat'd)
3«2 Data Measuring Equipment . „ , . . , . „ 483.2.1 Total Pressure Measurement . . . 483.2.2 Static Pressure Measurement . . . 493*2.3 Force Measuring Equipment . . . . 493.2.4 Plenum Pressure . . . . . . . . . 513.2.5 Manometers . . . . . . . . . . . 53
IV TEST PROCEDURE . . . . . . . . . . . . . . . 544.1 Statement of the Three Experiments . . . 544.2 Determining the Velocity Profile . . . 544.3 Determining the Surface Pressure . . . . 5o4.4 Determining the Lift and Drag . . . . . 57
V ANALYSIS OF DATA . . . . . . . . . . . . . . 595.1 Velocity of Profile . . . . . . . . . . 59
5.1.1 Analysis of Data . . . . . . . . 595.1.2 Discussion of Experimental Error 645.1.3 Comparison of Experimental with
Theoretical Results . . . . . . = 645.2 Surface Pressure . . . . . . . . . . . . 66
5.2.1 Analysis of Data . . . . . . . . 665=2.2 Discussion of Experimental Error 705.2.3 Comparison of Experiment with
Theory . . . . . . . . . . . . . 705.3 Force Measurement . . . . . . . . . . . 71
5.3«I Analysis of Data . . . . . . . . 715.3=2 Discussion of Experimental Error ?85=3=3 Comparison of Experiment with
Theory 79VI CONCLUSIONS AND RECOMMENDATIONS . . . . . . . . 82
6.1 Conclusions 826.2 Recommendation for Further Research . . 83REFERENCES 85

SYMBOLS
A Area (ft^)a Constant used in Equation (2,12)b Constant used in Equation (2,12)c Speed of sound (fps)
P " PCp = s 00 , coefficient of pressure pt - p„
D Drag force, as defined on page 50E ConstantF Force (lbs,)g Acceleration of gravity (ft/sec^)h Height of manometer readings (inch)k Ratio of specific heatsK ConstantL Lift force, as defined on page 50M Mach number (v/c)p Pressure (lbf/ft^)r Variable radius to a point in the jet streamR Radius of cylinder (2,25 in,)Re Reynolds number = f°
T Temperature (degrees Rankine)t Slot thickness (,1680 in,)
viii

ixU Average jet velocity at the throatV Velocity (ft/sec)\Te Jet velocity along the cylinderVe/K&t.L. Maximum local jet velocity (cross section maximum) ICi, Jet velocity radial to the cylinderVe* Non-dimensional velocity, \Te/iTe/nwfX
cT/ Thickness of jet stream, function of 0
y Specific weight Ibf/ft-Jl, Turning efficiency, as defined on page 710 Turn angle measured from the slot along the curved
surfacer - R
S '?i -
= ILz-R
lu Absolute viscosity z . .?®?)ft^
Jr/ Kinematic viscosity, ft^/secjO Density (slugs/ft^)7V Shear stress lbf/ft^
Subscriptse ExitH HorizontalL LocalP PlenumS Surfacet Total condition
X
d o Ambient¥ Vertical
Radial distance from the surface of the cylinder to the point of maximum tangential velocity,(See Fig. 2.1)
SuperscriptRefers to dimensionless quantities

ABSTRACT
An investigation was made of a two-dimensional jet ejected tangentially to a cylinder» This tangential ejection results in a clinging flow over the cylinder, known as the “Coanda Effect»w
Analytically, equations of motion for the BCoanda Flow1® were developed by using a modified von Karman Integral in conjunction with a Pohlhausen velocity profile.With these equations, the velocity can be found at any point in the flow. An expression for jet growth was developed from empirical data.
Experimentally, the velocity profile over the cylinder was found for a flow for which the Mach number at the nozzle exit was .18. The surface pressures were investigated over a range of pressure ratios (p^/p ) of 1.02 to 2.01. The forces exerted by the flow on the cylinder were determined at angles of turn of 90° and 180*.
Experiments conducted have shown that in the case where the flow was deflected 90°, the measured force was1.06 times as large as the force in the case of the undeflected flow| this indicated that some thrust augmentation can be achieved by the BCoanda Effect*® on a cylinder.

CHAPTER I
INTRODUCTION
1.1 GeneralA Rumanian engineer by the name of M. Henri Coanda
found that when fluid was ejected from a rectangular slot# to which one half of a divergent passage is attached# the fluid will cling to the passage. This phenomenon has been named the 8$Coanda Effect** in honor if its discoverer.
Coanda in his early work showed that flow can be deflected from its axial stream by a single flat plate and that subsequent turning of the jet stream up to 180® can be achieved by the connecting of several flat plates# each at an angle to the other. Furthermore# associated with the effect was an increase in the mass flow of air due to the entrainment of ambient air. Coanda concluded that these two factors together must produce an increase in the available jet thrust. There is a controversy in the literature as to the validity of this conclusion; this is discussed in section 1.2.
The basic phenomenon is shown in Figure 1.1. The first diagram depicts air issuing from a slot. The second diagram shows the slot fitted with one half of a divergent passage® The addition of this passage will cause the jet
1

ILLUSTRATIONS
Figure Page1.1 Basic Coanda Phenomenon o. 0 „ 31.2 Coanda Nozzle o o . o . o o o o . o o o o o 31&3 Coanda Slob o e . e o o o . o o o . o o o o 61 o Z|# Coanda Tiiflng o . o o o o o o o . o o o o o o 61.5 Sea Plane Float o . . . . . . . . . . . 0 . 71.6 Augmented Jet Engine . . . . . . . . . . . 71.7 Coanda Switching Nozzle . . . . . . . . . . 252.1 6iCoanda Flow18 Over a Cylinder . . . . . . . 292.2 Non-Dimensional Pohlhausen Velocity Profile 353.1 Basic Coanda Test Equipment . . . . . . . . 453.2 Cylinder Surface and Slot . . . . . . . . . 453=3 Potentiometer and X-Y Recorder . . . . . . ' 523.4 Vertical Manometer . . . . . . . . . . . . 525.1 Non-Dimensional Velocity Profile . . . . . 615=2 Graph of 12$ Jet Growth Thickness . . . . . 645=3 Comparison of Experimental and Theoretical
VelOClty o o o o o o o o o o o t i o o o o o 655=4 Pressure Distribution Over Cylinder Sur
face p — 90® O O O O O O O . 0 . 0 0 . 0 0 675.5 Pressure Distribution Over Cylinder Sur-
face, ^ 180® . . . . . . . . . . . . . . 68vi

t© deflect $, and ambient air to be entrained into the ejecting jet and subsequently: increase the mass flow as shown in the third diagram (Ref. 2).
Coanda showed the optimum angle of the first plate is 31°# and that if additional extensions are attached (28® for the second and decreasing by about 3° per stage) the discharging jet could be deflected 180®. In early experiments, Coanda attempted to utilize this effect in various practical ways such as augmentation of flow . through a nozzle. These devices are briefly discussed in the next section.
1.2 Historical DevelopmentAlthough Coanda was a Rumanian, in the 1930''s he
maintained a research laboratory in Paris, France, where he pursued this theory of the kinetic flow of fluids, which is called the $6Coanda Effect” (Ref. 22). The only practical application of this effect was made by the Usines Chasson, a motor car radiator manufacturer in France.This company studied the use of the basic Coanda Nozzle (Fig. 1.2, not to scale), in order to induce flow through a radiator with the idea of utilizing the exhaust gases as the working fluid. In their experiments, they constructed a nozzle with a 150 mm throat, which, when fitted with a .10 mm slot and using air as a working fluid at a pressure ratio of 1.5, induced a flow of 20 times that of

Figure5 0.6 Schlieren Photograph of fSCoanda Effect 9W
p^ f P l O O O O O O O O O O O O O O O
5«7 Schlieren Photograph of totioanda EffectP ^ fP o O ^ 1 o 8 9 ^ o o o o o . o o o d o d o o o
508 Turn Efficiency (72,) vs. Pressure Ratio atSB 00 VZ y V o o o o o o o o o o o o o o a o o o
5.9 Turn Efficiency (7l) vs. Pressure Ratio at .180 @ 0 0 0 0 0 0 0 0 0 0 0 0 0 0 0 0
5.10 Momentum Vector at(9 = 0®9 90°, 180° 9
PO*0 0 0 0 0 0 0 0 0 0 0 0 0 0 0,396
Pt5.I! Pressure Coefficient at 0 = 0®9 90®, 180®,
P ,50 0 0 0 0 0 0 0 0 0 0 0 0 6 6 0 0
Pt
Page
o 69
o 69
d 72
. 73
o 76
o 77

3
\,x\
Figure 1.1 Basic Coanda Phenomenon
SlotWorking fluid
Augmented air
-> Throat
Figure 1.2 Coanda Nozzle
AirOutlet

the working fluid. The article (Ref. 22) is not clear on the details of how such a nosale would operate or how the high ratio of induced flow was achieved. Coanda has experimented with a similar system to determine its feasibility as a scavenger for the exhaust of gases for combustion engines.
His next significant experiment was that of a rotary pump. This pump utilized his “Effect8* for pumping gases and fluids. The pumps were tested by the Conservatoire des Artes et Metiers and were reported to have produced a 99.8% vacuum at an efficiency of 98%. It is said that the pump could also be used as a compressor, but apparently little data had been gathered to determine its pumping efficiency. As Robinson (Ref. 22) explains, it is a rotary piston pump using water or some other fluid for pistons. A head of water is carried in the pump rotor, which is turned in the direction of flow. The rotor turns and the slugs of water trap the air which is being evacuated. The water and air are later separated.
Coanda also experimented with a “Coanda Slot81 at the nose of a streamlined body, for use as a means of propelling a body through water. Propulsion efficiencies (which were not defined in the article) of 8?87%to have been obtained with the arrangement as shown in Figure 1.3. Although the efficiency was not superior to a good propeller.

it has the definite advantage of not being subjected to cavitation at high speeds. This particular experiment led to the aerodynamically interesting one of the "Coanda Wing®51 By placing a "Coanda Slot" across the leading edge of a wing (Fig® 1®4)» Coanda found that he could control the boundary layer and substantially increase the lift coefficient of the wing and reduce its drag® A detailed study of the wing was made later by D® W. Young and D, Zonars (Ref® 32), who determined that, although the "Coanda Slot" did reduce the drag and increase the lift, other Methods of boundary layer control were better,Coanda also applied the "Coanda Slot" to a sea plane float (Fig, 1,5), He proposed to draw water from the stagnation point in front of the float and, using his pump, force it out through "Coanda Slots" around the float® By so doing he claims to accelerate the boundary layer and stagnation fluid in front of the body and so reduce its drag,
Coanda visualised a modification of his nozzle being used in conjunction with a jet engine (Fig® 1,6), According to Flight Lt, Sproule (Ref, 22):
"Coanda sees this device as a propulsion means for aircraft or boats, but the most interesting application would appear to be as a thrust augmentor. This would use a Coanda slot passing to the outside of the jet pipe for take Off and low speeds and a simple jet pipe for high speeds. This requires, of course, a variable

Figure 1.3 Coanda Slot
Figure 1.4 Coanda Wing

Coandaslot

iiozzle but would be much lighter and simpler than any other augment or proposed e18
The article was not clear on the details of how such a nozzle would operate nor how thrust augmentation could be achieved. Sproule1s statement was written in 1944 in a report by Sproule and Robinson to the Combined Intelligenc Objectives Sub-committee after Goanda was interrogated at a French prisoner of war camp. Little was done in the next 14 years on the nCoanda Effect.*8 However, with the advent of helicopters and the military requirement for VTOL (Vertical Take Off and Landing) and STOL (Short Take Off and Landing) aircraft, interest was again aroused in thrust deflectors and augmentors. Gates (Ref. 8) indicated that the efficiencies of power and thrust devices and the relative slowness of.the helicopter demanded that new and better lifting devices be developed. While working for the Hiller Aircraft Corporation, he attempted to ascertain if Coanda8 s claim for thrust augmentation had any validity. After experimentation. Gates was convinced that there was no thrust augmentation from *8Coanda Effect.98 '
Helicopters are rated as the most efficient hovering devices, whereas, direct lifting turbo-jets and rockets are rated as the least efficient in spite of the exceptionally low specific weight of the jets. These

9considerations led the Defense Department of the United States and other nations to search for ways to augment the static lift of a jet with such devices as ejectors* or by utilizing the possible thrust augmentation due to the tendency of flow to cling to a surface (i.e, * 88Coanda Effect”). Since 1958 practically all the effort in the investigation of ”Coanda Effect” has been to determine the ”Effect” analytically and experimentally and to find an application for the ”Effedtn as a lifting and/or thrust augmentation device<, The following summary of the literature will bear this out,
1.3 Review of the LiteratureIn 1948 Albert Metral and Frederic Zeimer of
France* under contract to the Ministers des Araees* Direction Technique and Industrielle de I1Aeronautique* Paris* France* published a paper on the ”Goanda Effect” (Ref. 16). In introducing the Coanda phenomenon* Metral first explained a series of experiments carried out by Col. Lafay on the Chilowsky effect in 1918. Chilowsky had the idea of ”decreasing the resistance of the air to projectiles by furnishing them in front with a sort of tip* which* through a circular opening* spits out transversely a sheet of fire.” Lafay replaced this sheet of burning gases with acetylene at ordinary temperature and thus was able to study the flow more closely. Lafay states* "The

10aerodynamic phenomenon to which I have attributed the Ghilowsky effect is quite general and results from the entrainment of air produced by any jet of compressed gases when it is emitted into the atmosphere.®* From this point Metral proceeded to describe Coanda*s experiments and patents with motorcycle silencers* Coanda decompressors for automobile engines* propeller decompressors for aircraft engines* and Coanda pumps.
The above experiments and uses of the 18Coanda Effect18 proved conclusively that flow ejected from a slot with a deflector on one side does adhere to the deflector. The amount of thrust augmentation* caused by the effect* was not conclusively established.
Luther J. Boyer* under the guidance of Dr. M,. J. Zucrow, in 1948 conducted an investigation of the "Coanda Effect" at Purdue University (Ref. 2). A two-dimensional model was used to study the effect of flap angle and length* orifice overhang and slot height on a two-dimensional jet ejected over the attached flap. It was concluded that the "Coanda Effect" may be used to effectively reduce the pressure in a slot through which a fluid is discharged into another fluid medium and to augment the mass flow rate of the jet. However* no tests were conducted to substantiate the flow augmentation conclusion.

11In April, 1947j, Alfred Voedisch, Jr®, under con
tract to the TJe S» Air Force, made an investigation ■ of the ^Goanda Effect81 (Ref, 2?), He reported that:
88The Goanda Phenomenon consists of the following individual effects I
1® An increase in the mass flow and velocity of a fluid issuing from the exit section of a rectangular or annular nozzle or slot by placing one side of the exit wall at an acute angle to the direction of the initial flow. The. configuration of the two walls forms an offset divergent nozzle, which produces a greater mass flow than a simple nozzle.
2. Deflection of the mass flow through an angle, by means of a series of surfaces at acute angles to each other. The deflection of a fluid by means of a smoothly curved wall is well known, and various simple and useful applications can be cited and experiments made to show this.By the use of Steps, such as the Goanda device,it is plausible that the total angle of deflection may be greater, since by the use of a sharp Corner, such as is formed by two of the surfaces, the mass flow is strongly accelerated and the slight separation causes a turbulence which produces an augmented mixing and a renewed boundary layer energy. It might be better to use a smoothly curved surface until jutt before separation would normally occur, then by means of a corner, renew the boundary layer energy, and allow a greater deflection.
3. Entrainment of additional air by dragging the stationary air along with the primary jet, providing an additional mass flow. It is well known that a jet of any fluid has the property at its surface to drag stationary fluid into motion by means of frictional forces. Compared to a free jet which can cause entrainment on all sides, the Goanda device, due to the required contact of one side of the jet with the wall, can entrain fluid along only one side.

The Goanda device has inherent energy lossess which are produced by the action of the device, as follows:
lo Loss due to friction along the series of surfaces while a change in direction of motion occurs.
2. Loss due to boundary layer energy renewal.These two losses will always be present and since a simple divergent nozzle will produce the
useful part of the Coanda Effect which is the increase in the velocity and mass flow of the primary stream, and the entrainment of the ambient air, these losses appear to limit the practical use of such a device. Only where it would be necessary to deflect a fluid jet through an angular displacement for application purposes to effi-* ciently utilize the energy of the jet, does it appear advantageous to use the Coanda Effect."
D. W. Young and D. Zonars conducted wind tunnel tests of the Coanda Wing and nozzle in 1950 at the Wright Patterson Air Force Base, Dayton, Ohio (Ref. 32). A Coanda wing was obtained from Henri Coanda for the experi ments. The effects on lift, drag, and pitching moment of the wing are given in the paper for a specified range of air speed, angle of attack, slot width, and quantity of air ejected. It was concluded that boundary layer con trol by use of the Coanda flow ejected from a slot in a wing (Fig. 1.4)* causes appreciable increase in maximum lift and reduction in the drag coefficient for all angles of attack. However, comparison of the data obtained in these tests with other referenced data on boundary layer control indicates that the Coanda method, as tested, is

13not as good as other means for increasing the maximum lift coefficient and decreasing the drag coefficient. It was also concluded that a nozzle, such as is shown in Figure 1,2, with an annular type slot ejecting pressurized air can be employed as an air pump or as a thrust augmentor, Entrainment of volumes of air between six and eight times the volume of working fluid was obtained. These values compared favorably with those predicted by the inventor before the tests were conducted,
H, B, Squire in March, 1950, made an analysis of experimental data on velocity and temperature distribution of jet flow and its effects on aircraft (Ref, 23), In the article, the ,$Coanda Effect" is mentioned as a phenomenon of a plane jet adhering to a curved surface. Since excessive nozzle heating is generally avoided in jet engines. Squire states that it is usually necessary to prevent jet adhesion at the engine exit.
In June, 1958, Uwe H, von Glahn studied the use of the "Coanda Effect" for obtaining jet deflection and lift with a single flat-plate deflection surface at HACA Lewis Flight Propulsion Laboratory (Ref, 28), Von Glahn concluded that properly designed Coanda nozzles, utilising a single flat-plate for deflecting the jet stream, yielded vertical lift of the same order of magnitude as that

14oaloulated for a flat-plate or a flap immersed in an air- stream at an angle of attack identical with the angle made by the Coanda deflecting plate:
nfhe practical use of a Coanda nozsle with a single flat-plate deflection surface appears to be limited to STOL rather than VTOL aircraft because of jet detachment from the deflection surface at large deflection angles„ The angle to which the jet stream can be deflected by a Coanda nozzle depends primarily on the nozzle height, plate length* and pressure ratio. In order to obtain a jet-stream deflection of the order of 90® for VT0L$> multiple flat-plate or curved plate configuration rather than a single flat plate configuration must be used,18
Von Glahn5 s concluding remark was that the aircraft should be designed for the unique characteristics of the effect rather than attempting to incorporate the device into an existing configuration, The study was primarily experimental and used pressure ratios varying from 1,31 to 3•
Jack G, McArdl® during the same period, June, 1958, at Lewis Flight Propulsion Laboratory, studied internal characteristics and performance of several jet deflectors at primary nozzle pressure ratios up to 3,0 (Ref» 15), Several model jet deflectors (devices which change the direction of resultant jet thrust) were tested in still air to determine the effects of designs available or their performance and operating characteristics. The deflectors (swivelled nozzles, auxiliary nozzles, and mechanical deflectors) were designed to be adaptable to convergent nozzle, plug-nozsle, and ejector turbo-jet exhaust

systems. In this publication* analytical expressions describing the performance of each type deflector are presented. Significant design variables are also presented. Although the "Coanda Effect" is not discussed specifically, the article provides background for the jet deflection problem.
During September, 1958, von Glahn conducted additional experiments on the "Coanda Effect" at Lewis Laboratories for NAGA (Ref. 29). This time he studied the use of the "Coanda Effect" for jet deflection and vertical lift with multiple flat-plates and curved plates. Von Glahn defined the vertical thrust divided by the measured undeflected thrust as the vertical jet turning efficiency,7^. He then defined the horizontal deflected thrust divided by the measured undeflected thrust as the horizontal jet turning efficiency, . These same turning efficiency definitions were used in the present study. The results of von Glahn’s study indicated that nozzles using multiple flat-plate or curved plate deflectors can achieve an h v of 88% and 91% respectively. These lift values are accompanied by an essentially zero axial thrust component. The optimum shape of the deflector was not determined. However, curved side plates were required to insure two-dimensional flow and thus delay jet stream detachment from the deflection plate.

I16
In October, 1958, M. F. Gates conducted an extensive study of the "Coanda Effect5® using two-dimensional and three-dimensional configurations for the Hiller Aircraft Corporation (Ref. 8). He concluded, as was mentioned above in paragraph 1.2, that thrust augmentation is not possible with an external ejector (defined as a device which incorporates clinging flow over a surface and the accompanying external mixing). However, he did confirm that it was an effective device for turning a jet stream. Performance data and surface pressure surveys were presented for both two- and three-dimensional configurations. This reference contained an excellent summary on the past work done on the "Coanda Effect.58
C. Bourque and B. G, Newman in August of I960 madea study of the re-attachment of a two-dimensional, incompressible turbulent jet ejected over an adjacent, inclined flat-plate (Ref. 17). They concluded that the jet separates from the boundaries at the slot lips and reattaches to the plate downstream. They stated that this phenomenon is associated with the lowering of the pressure between the jet and the plate.
In October, I960, M. Henri Coanda, under contractto the Air Force, made an analysis of thrust due.to the"Coanda Phenomenon58 (Ref. 5). He essentially used a "Coanda Nozzle" as shown in Figure 1.2 and examined the nozzle for

17thrust augmentation., Coanda claimed a ratio of 1.46 when comparing measured thrust to theoretical thrust (directly measured thrust/theoretical isentropic thrust, which Coanda defined as thrust coefficient) at a pressure ratiop - pt 09 — 1.5e The theoretical isentropic thrust does not Poo
consider entrainment of ambient air; therefore„ it would appear that this thrust amplification is due to the entrainment of the induced or augmented ambient air. Using these same definitions, Coanda also achieved a thrust coefficient of I.46 for a pressure ratio of .3• Coanda concluded that the results of the study are encouraging, but that to develop the theory of such a nozzle would require a special team well trained in aerodynamics and would require a fairly long time.
In January, 1961, at the Training Center for Experimental Aerodynamics in Belgium under United States Air Force Contract, L. H. G. Sterne made an "Analysis of Thrust Due to the Coanda Phenomenon" (Ref. 25). The tests were conducted with an'improved Coanda Nozzle of the type which Henry Coanda used in his experiments in I960. It is essentially of the same basic design as the nozzle shown in Figure 1.2. Sterne showed that for this type of nozzle he achieved a thrust amplification of 1.34 + 0.02. In this test the theoretical thrust developed by the working fluid

18is defined as the standard® The ratio of the sum of the thrust developed by the working fluid and the thrust developed by the induced flow to the standard thrust, as defined above, is what Sterne meant by nfluid amplification®(Ft * F -j_Q(jUGec =. Thrust*
FtB. G. Newman in 1961 studied the ®Coanda Effect®
around a cylinder and also with a jet adjacent to a flat- plate (Ref. 11). His analysis placed emphasis on the entrainment properties of the jet. The theory was based on conservation of momentum, and the existing theory for undeflected jets. The fluid is treated as incompressible with the surrounding fluid at rest. He established that entrainment is fundamental to the understanding of the "Coanda Effect® and that it accounts for the final separation of the flow in the case of a cylinder and the re-attachment of the flow to the wall in the case of the flat-plate.This particular article develops an equation for the pressure coefficient and then compares the semi-empirical theory developed to experiments conducted.
In August, 1961, at the Institute of Aerophysics (University of Toronto), A. B. Bailey, under the auspices of AVRO Aircraft Limited and the Defense Research Board of Canada studied the use of the "Coanda Effect" for the deflection of jet sheets over smoothly surved surfaces

19(Bef«, 1) e His primary interest was subsonic# choked# and unchoked jet sheets, Bailey conducted his experiments with a rectangular convergent nozzle with an exit height of 1/8 inch over quadrants of 2=0# 2,5# 3=0 and 4»0 inch radius. The nozzle was operated at pressure ratios from1,2 to 2,1, The quadrant was separated by a horizontal gap of 0,01 inches from the nozzle, Bailey defined vertical turning efficiencies as measured deflected force divided by undefleeted theoretical force. The theoretical force was computed by F = wherep was the densityof the ambient air and the velocity was determined from the standard nozzle tables by the ratio of Pe@ to pt ,The tests indicated that with the l/8 inch exit convergent nozzle# an optimum value of 92% can be obtained for the vertical turning efficiency. Further# the surface pressure distributions indicated the existence of regions of supersonic flow and their attendant shock symptoms in the case of choked flow and the existence of a region of separated flow at the upstream edge of the deflection surface, One characteristic of underexpanded straight jets# the existence of regions of expansion and compression at supercritical pressure ratios# also occurs in the curved jet sheets. These regions were manifested as fluctuations in the pressure distributions over the deflection surface.

20. Wo Bo Bo Roderick in September of 1961 at the Insti*
tute of Aerophysies at the University of Toronto extended Bailey is experiments t© include supersonic and underexpanded jet sheets (Ref. 20)* Three convergent-divergent - nozzles with nominal throat dimensions of 1/16 inch, 1/8 inch, and 1/4 inch were used at pressure ratios of 1*4 to 2.8. The deflection surface was formed by the combination of an initial 1/4 inch flat-plate followed by a quadrant of a circular cylinder of 4 inch radius. Side plates were used to insure two-dimensional flow. The test results showed that the turning of supersonic and underexpanded sheets by Coanda deflection surfaces can be accomplished as easily and effectively as that of sub-sonic or overchoked jet sheets. Roderick developed an equation for the prediction of pressure coefficients for a ^Coanda Flow51 over a circular deflection surface. This theoretical expression can be used to calculate pressure coefficients and compares well to Roderick6s experimental data.Roderick further stated that if compressibility effects are included in this theory, quantitative agreement between predicted and observed pressure coefficients is fair. He stated that the discrepancy seems to be the result of neglecting viscous effects in the deflected flow.
The ®Coanda Effect® at deflection surfaces detached ' from the jet nozzle was studied experimentally by

21Go Ko Korbacher at the Institute of Aerophysics, University of Toronto in January, 1962, (Ref„ 9)» Korbacher concluded that the “Coanda Effect*8 is not limited to attached deflection surfaces or to inclined single or multiple flat-plate surfaces» By using a jet thickness of 1/8 inch, the horizontally ejected sheets were found to jump horizontal and vertical gaps of more than 8 and up to 4 times the jet sheet thickness respectively. The turning efficiencies of up to 96$ for a 90® deflection of the jet sheet were appreciably higher than reported anywhere in the literature up to that time.
In December of 1962, Sheldon G. Levin and Francis Mo Manion under contract to Harry Diamond Laboratories of the Army National Materiel Command conducted experiments in fluid amplification studying the 88 Goan da Effect88 in terms of the jet attachment as a function of adjacent wall vertical offset and angle (Ref. 13). The experiments were conducted with both water and air jets at Mach = .5 equivalent . This study developed an analytical method, independent of the particular fluid, for predicting 'the attachment distance of jets to an offset wall.
M. F. Gates and L. A. Burdick conducted experiments under contract to the U. S. Army Transportation Research Command in 1962-1963 to determine and develop a more efficient thrust augmentation and deflection device for use in

22future a m y transportation systems than is currently available (Ref. 2). They used the f9Coanda Effect” plus that of ventilation. By "ventilation” is meant the result of a jet sheet following a curved surface located close to, but separated from, the jet by an induced stream of ambient air. When the jet stream is not separated from the surface by an induced stream, the phenomenon is simply the "Coanda Effect.” The report was directed toward obtaining basic flow field data and determining the feasibility of augmenting the thrust while deflecting the jet. The pressure ratio examined varied from 1 to 2. The results showed that thrust augmentation was found to be definitely possible by the ventilated flow deflection principle. One of the surfaces tested at the optimum ventilation produced a thrust augmentation of 6% (based on the primary jet thrust) while deflecting the jet 58° from its original direction. Without ventilation (jet adjacent to the surface) the jet was deflected 60® with a loss in thrust of 20%, Flow visualization studies were also conducted to aid in the understanding of the phenomenon. The study showed that thin jet ventilated clinging flow theory is adequate for the prediction of the surface pressures, but does not permit assessment of thrust augmentation possi- . bilities.

In 1963 under contract, Paul K„ Chang of Aero-I
physics Go. conducted a surrey of 31 available references of analyses and experiments of w0oanda Flow” (Ref. 4) -> The purpose of the survey was to better understand the mechanics of ”Coanda Flow” and its practical use as a means of fluid amplification. Since many of Mr. Changes references are already mentioned under the individual’s name, the following review of Mr. Chang’s work will attempt to avoid duplication. The first sub-heading is Inviscid Incompressible Coanda Flow. Voedisch’s analysis verified Coanda’s finding that increased mass rate of flow resulted from the jet which issued from a nozzle and flowed along an inclined wall. Voedisch also showed that stationary ambient air is entrained along the primary jet. Stratford, Lighthill, Metral, and Ten contributed in this area. For a Viscous Incompressible Coanda Flow. Newman, von Glahn, and Bourque are the primary contributors. However, Yen points out the analysis of viscous incompressible flow is too difficult to solve completely. The difference between separation of ordinary flow and detachment of this jet flow is pointed out. Chang states that no satisfactory direct analytical investigation has been made of compres- , sible ’’Coanda Flow” as of 1963. Yen and Metral have contributed in this area. In general, this particular paper

24is an excellent condensation of work which has been done on the wCoanda Effect*9 as of 1963.
Mr, Fekete in 1963 at McGill University made experiments with an incompressible wall jet flowing over the surface of a cylinder with the fluid in the jet being the same as that in still surroundings (Ref, 7), The results for the velocity and surface pressure distributions, the slot velocity, and the position of separation were presented, Fekete used a pressure ratio of 1,05 and, therefore, could assure essentially incompressible flow. Similarity of velocity profiles, over the major portion of the flow was confirmed and good agreement was found between the non-dimensional velocity profiles experimentally obtained and the theoretical prediction of Glauert for plane wall jets, Fekete found that reasonably good agreement was obtained when his experimental results were compared with Newman's (Ref, 11),
Triner, under the guidance of Dr, E, K, Parks, Professor of Aerospace Engineering at The University of Arizona, made an experimental investigation of the "Coanda Phenomenon89 (Ref. 26). The experiments were conducted at the United States Air Force Academy. Triner investigated surface pressures and turning efficiencies at pressure ratios of 1.04 to 1,30. With Bailey’s definition of turning efficiency (deflected force divided by undeflected theoretical force. Ref. 1), Triner obtained a turning

25efficiency of 89% for a flow of 90*. However, he obtained a turning efficiency of 97% for the same flow when 71/ was used. Triner concluded that it would be more advantageous to use the Tlx definition since one could obtain the amount of actual thrust emitting from the slot that is being turned.
Elsby in August, 1963, at the Air Force Institute of Technology, Wright-Patterson Air Force Base experimented with jet switching and attachment phenomena (Ref. 6). The nozzle which was used consisted of a convergent section with symmetrically offset divergent sidewalls mounted at the nozzle exit (Fig. 7).
f t
Figure 1.7 Coanda Switching Nozzle

The sidewall offset and wall divergence angle were made adjustable and the nozzle was operated at pressure ratios from 2 through 7«
The purpose of this experiment was to obtain information on the supersonic jet characteristics of this nozzle and to investigate the thrust vector control problem. Referring to Figure 7» the initial flow with the nozzle symmetry as shown will attach to both sides of the nozzle. If a secondary injection, Ms (injection mass flow rate), is injected perpendicular to the main flow, the flow can be deflected to the opposite side. The study presents extensive photographic coverage of the phenomenon for the range of pressure ratios examined. Definite conclusions are stated for the effect of pressure, sidewall setback, and divergence angle on the flow. Force measurements to determine the amount of vector control which could be obtained by the use of this nozzle were not ascertained.
1.4 Purpose of the Present StudyWith this background, a study was made of a jet
emanating from a slot adjacent to a cylinder. This investigation was divided into four main sub-headingsi
a) Development of velocity equations by approximate methods. These equations completely describe the flow over the cylinder as a

function of y and 0 » Where r is the radius of curvature of the deflection surface and 6?
is the angular location,b) Experimental determination of the velocity pro
file and the radial and tangential pressure gradient for a nCoanda Flow’8 over a 180® arc of a cylinder,
gj Measurement of the surface pressures on the cylinder for a flow of 90® and 180® for a range of pressure ratios from 1.02 to 2.00.The cylinder could be used for experiments at various turn angles. A wedge was soldered to the cylinder which in turn was mounted on an axle through its axis of symmetry. This configuration ensured flow separation at any arbitrarily selected turning angle between the exit (0®) and ,180® (for a detailed description of the cylinder, see section 3.1.3 and Figure 3*2).
d) Empirical determination of the vertical and horizontal force components resulting from a flow of 90® and 180® over the cylinder for a range of pressure ratios from 1.56 to 2.52.

CHAPTER II
. THEORETICAL DEVELOPMENT
2.1 GeneralThe lsCoanda Flow,n basically, is caused by a pres
sure difference across the jet sheet (Fig. 2,1). As was shown by the experiments described in Chapter V, the flow has a strong pressure gradient in the radial direction and a moderate pressure gradient in the direction of increasing 0. The speed of the flow over 180® of the cylinder is observed to decrease partially, whereas, the jet width is seen to increase. The predominant force acting to reduce the momentum of the flow is the shear at the cylinder wall. The equations governing this flow for a complete description are the energy, the Navier-Stoke1s, and • the continuity equations.
2.2 Order of Magnitude AnalysisFirst, the Navier-Stoke8s equations (Ref. 21, page
53) will be simplified by an order of magnitude analysis. These equations are then analyzed to see if solutions can be obtained. For this experimental work, a Mach number of approximately .2 has been selected. Since M = .2 is
28

29
180
e = 90
Throat
Figure 2.1 "Coanda Flow" Over a Cylinder

30substantially less than the regime of flow where compressibility is significant, (M >.3), the flow will be considered as essentially incompressible for this particular analysis.
The continuity equation and Navier-Stoke1s equations in cylindrical coordinates for an incompressible steady flow are:
(2.1)
, / Va j. / a 3- a 5 d e *
(2.2)
p ( ^ m , m m l x ^ > £ j ^ vr [ «P/t A 9 0
l M . j p f A a e , r { a a *
r A - J a- j — 4 . A 4 . y*' ylJ y?*8 J 9 -1
i tk ¥
(2.3)

31For the flow under consideration here, there are no
variations of the flow properties in the z direction, con
sequently gLf )= O and 1 / ^ - 0 and Equations (2.2) and
(2.3) become two-dimensional by the deletion of these terms. The z component of momentum could have been written out; however, as is pointed out, all the z components would be zero. The equations are non-dimensionalized by the following relationships:
where U is the average speed of the flow at the jet slot and cT'is the jet sheet thickness. Now by assuming <f<< 1, an order of magnitude for each term may be determined (Ref. 21). The continuity equation and the Navier-Stoke*s equations, after neglecting body force, are written in dimensionless form with the order of magnitude as follows:
i j vJ a *
o(i)
, Va * A *
s ( l )
+ LA * j T
c(‘) o(i)
(2.4)

32
=>A 4 a * J & A * 9 A * /fj, \ o) yZ-":
0(4) ofi) o(i) o ( 0 0(iJ) °(i)
f . j f : - ^(2.5)
o(i) o(i) o((f) o(/) of<f) d(;; cO)
,/;* + £ > ' < ^ ' 4 4 L ( 3 1 M4 A * A * a 0 A * & W 4
0 ( 6 ) 6 ^ 0(0 C(i) e(J) 0(1) <3(4;
1 is ! ? *A* JSL*
o(i) oz i '
tZdy(
J_y.*J J 61-1 jT (2.6)
0(i) »(') oO) o(J)]

33From the analysis of Equation (2.6), for viscous effects
Then by retaining only the largest order terms, the equa tions for a "Coanda Flow" over a cylinder reduce to:
These equations would completely describe the flow under the assumptions for which they were derived. Since Equations (2.7), (2.8), (2.9) are coupled non-linear partial differential equations, they would be very difficult to solve in closed form. Methods such as the Pohlhausen approximation and the use of a modified von Karman Integral equation may be shown to yield useful information about the flow phenomena.
1 oto be significant, it can be deduced that — = 0( <$ )Re
(2.7)
A *(2.8)
(2.9)

2,3 Solutions Usiius: Approximate MethodsFrom experimental data (presented in Chapter V ),
it was determined that the velocity profiles are geometrically similar (Fig. 2.2). The problem was attacked from the approach that if the following three statements could be analytically determined, the flow would be completely - described:
1) The jet growth must be determined as a function of Q . This growth must be known in order to determine i/a as a function of r and 0 .
2) A dimensionleas velocity expression, )/&*-
as a function of ^ — must be developed.
3) An equation for as a function of Q mustbe determined, so that given the average velocity at the slot exit, the maximum velocity over the cylinder can be found at any desired Q >
If the above three expressions can be determined, the flow can be completely described within the stated assumptions.
2.3<>1 Jet Width GrowthRealizing that the Ifh profile is similar,
the relative jet growth was desired as a function of 0 .The value of in the experimentally determined dimen- sionless velocity profile, where \f& is maximum (Fig. 2.2),
35
1.0
.4 .6 .8 1.02
l/,*, M .
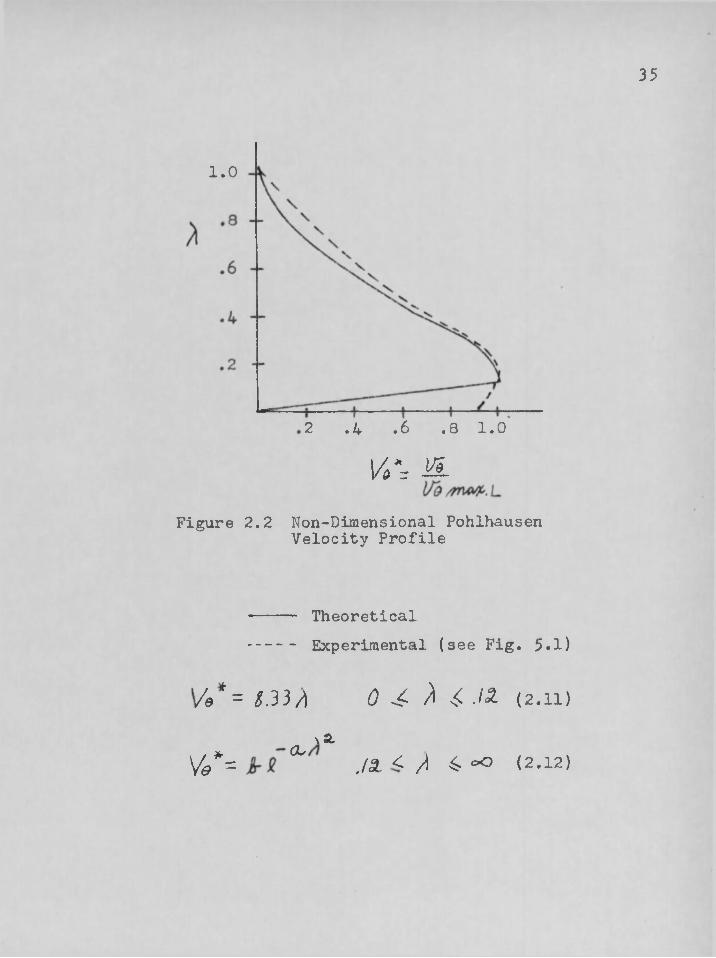
Figure 2.2 Non-Dimensional Pohlhausen Velocity Profile
Theoretical Experimental (see Fig. 5.1)
Ve* = £.33/) J ^ ^ ^ ./2 (2.11)nS.
V9*= ^ ./a <: /) 4 (*3 (2.12)

was found to be the most suitable jet growth parameter. This, corresponds to a cfZ of about 12$ of the local measured jet width and this jet thickness will be defined as</ # o
The jet sheet consists essentially of two regions 4 The inner region is analogous to the boundary layer on a flat-plate where cf varies as Zx” „ The outer region* which is analogous to a two-dimensional jet exhausting in still air, also has a width variation where it might be said that the outer jet width varies as Z X (Ref. 21). Hence, it was concluded that the proportionality of cf#. with \/X~ would be a justifiable relationship here. This deduction was confirmed by experimental measurements (section 5.1.3). The following equation was developed by fitting the normal boundary layer expression to the experimental growth curve.
= <2 ^ / 77^ l2,10)
This equation does not consider the initial jet thickness at the slot (this is somewhat analogous to the invalidity of solutions to flat-plate boundary layers in the vicinity of the plate leading edge).

372.3,2 The Velocity 14 as a Function of ?i .
In order to determine the rate of change of velocity in the radial direction, an equation for Ve* is required. Examining the velocity profile (Fig. 2.2), the following boundary conditions must be satisfied.
A = 0 <£'- 14#- 0
/ \ ~ ° o Ik*** |/e* = o
\ — ac> <9 14 = o^ o> A
Ideally, one function which would hold over the entirevelocity profile and obey the boundary conditions shouldbe used to represent the flow. This ideal representationwas not achieved. The non-dimensional profile for (4* asa function of was approximated with two separate parts.
| / &The curves were patched together at the point where V& is a maximum, i.e., == .12. The velocity for <f .12 wasapproximated by a linear function. The velocity for A > .12was represented by curve fitting a normal distribution typefunction to the empirical dimensionless profile. These velocity expressions are:
1 4 * = A - = F . 3 3 A ( 2 . 1 1 )
, /(&.

38
Ve*= I £~'a' ^ (2.12)
where b = 1.0620 a = 3«7298
Thus by the use of the appropriate equation^ l/p* can be found as a function of /) » Then using and Ifa/me#.
an expression for which will be developed in the next section# l / e as a function of r can be determined at any point in the jet stream.
2.3.3 The Variation of ZZe along the Cylinder
To completely describe the flow# it is also necessary to develop an expression for as a functiono f Q . As stated in section 2.3.1# this is the velocity in the jet at a thickness
To determine the variation of IT® over the cylinder# the momentum equation must be considered. The major momentum change will be caused by the viscous shear at the cylinder wall. The small affect on momentum by the slight pressure gradient will be neglected. This term wasdropped as a negligible term in the order of magnitude analysis of the Navier-Stoke*s equations and later experimental measurement justified this action. Analytically# the forces in the 0 direction are represented by saying

that the shear at the boundary is equal to the rate of decrease of momentum (von Kanaan Integral, Ref. 21).
■ - / A L rir&*dA RdQ
To
oO_ ( p l f e SLd A
* * 6 V(2.13)
Non-dimensionalizing the 1/& term by dividing by ifG/rrwfr.
Equation (2.13) becomes”
Ar:H
csOUg /Yflwt' (p d A
/»w.(2.13a)
<9/2<3 Oo/mdrf. ^ fy/mv.
- V ^ a d .J/ -

40Cancelling Vq /y%(i/p and introducing = A ~R d)i*~
the integrals in Equation (2e13b) can be evaluated<> Hence, Equation (2.13b) becomes:
Now Equation (2.10) will be substituted into the differential Equation (2.14)• .Equation (2.14) now becomes an ordinary differential equation and can be readily integrated. It should be noted that the expression in the brackets must be evaluated in the following manner:
_L XfO/ynA/ . ( DT R 4 /
(2.14)

41where \ / 1**" is given by Equation (2.11) and (2.12) * after
a substitution of variable, /) = /) /.12 is made. Theright hand term of Equation (2.15) must be evaluated using the error function. Equation (2.14) now becomes?
A-' d. V& *
f r oa o . a s ^ j p r d /)
o O
u d 9
F1, \#14 d A v (2.16)
After integration, this equation reduces to
_ J£l[Tg/rmf. j= i_9 i l<L 4 A
jf3 K3 Kb(2.17)
where,
K, = 3. 6 7 Y W (fa = ± r 3 z J_U 1 U

After evaluation of the constant of integration^ the expression becomes
Ue/nm. = i U @ * -h ( s . t i x w ~ (.713) (2.18)
It is of interest that Equation (2.18) shows to beindependent of the Reynolds number. • This fact has been noted by other investigators (Ref. 7)- This equation does not give good agreement for small values of G ( Q S l - 3 ° ) .
The constant of integration was determined by taking the mean value of the constants calculated by means of the empirical data for Q ranging from 1 to ^ radians. The equation holds quite well when compared to experimental data as will be shown in paragraph $.1.3*2,4 Discussion of the wCoanda Flow" Equations
With the equations developed in sections 2.3,1#2.3,2# and 2.3*3 the velocity can be described at any point in the flow. Given a two-dimensional “Coanda Flow*5 over a cylinder at a certain (/ # after evaluating the constant of integration# can be found between V bythe equation
( s . c u i r f t u - ( m 3 ) w (2.is)

The radial position of maximum velocity in the Coanda jet can be determined from Equation (2=10)o
4 = (2.10)
Finally9 Ifo as a function of r and 6 may be determined by using Equations (2.11), (2.12), and the definition of I/d*
as follows:
V e * - 8 ,3 3 /\ o / /) (2 o i l )
\<2-Y e* = ^ ,/oZ < A (2.11)
where b = 1.062 a ■=* 3»7298recalling that
i / » * Vei/& /m t f . L
where U o /m ^ .L is found by Equation (2.18).As a closing comment of this section, it must be
remembered that the Pohlhausen Profile for V&* as a function of A is an approximation. For determining l/e near the cylinder, the approximation error must be considered.

CHAPTER III
. TEST APPARATUS AND DATA MEASURING EQUIPMENT
3=1 Test ApparatusAn experimental Coanda test set-up was designed,
and constructed at The University of Arizona Aerospace Laboratory= The deflection angle of the cylinder (used as the deflector) was made variable. Holes were drilled in the cylinder surface in order to measure surface pressure.A total pressure and a static pressure rake were fabricated to measure pressure at any location in the jet stream. These rakes were adjustable and could traverse roughly 180° of the cylinder. A balance was made to measure horizontal and vertical forces on the cylinder. The details of the above equipment are given below. Pictures of the equipment are displayed in Figures 3.1 - 3.4.
Air was provided for the plenum by a Gardner- Denver compressor having a displacement of 142 cubic ft. per minute. The air was stored in a tank which could contain pressures at 150 psig. Air from the storage tank was supplied to the plenum by two pipes (Fig. 3.1) which
44
45
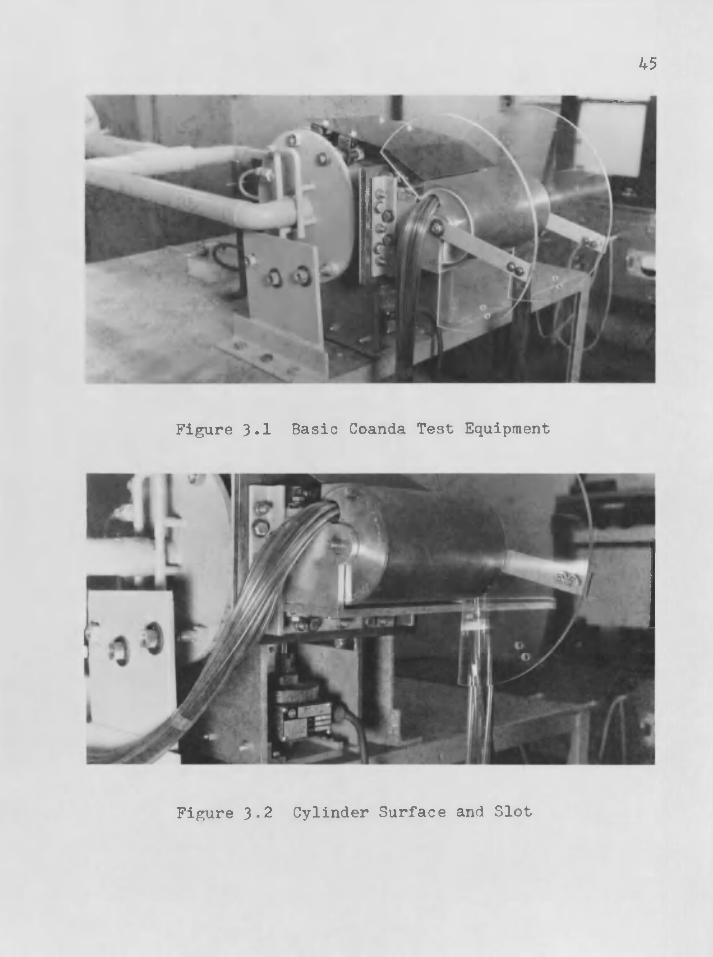
Figure 3.1 Basic Coanda Test Equipment
Figure 3.2 Cylinder Surface and Slot

• 46were sweated to a centered orifice of 1440 inches through each of the outside air-bearing pads (in Ref. 8S Lachmann discusses air bearings in detail). By this means, the air could exhaust from the pipe directly across the air- bearing gap directly into the plenum. The bearings provided a cushion of air (this air was supplied to the air- bearing pads from a separate supply at 20 psig) of 0.004 inch clearance between the rigidly fixed outside bearing pads and the inner pads which were welded to the plenum. This method successfully freed the plenum from any lateral forces due to the air entering it.
3.1.2 PlenumAn 11x7x4 inch plenum was fabricated from
5/l6 inch steel plate. It was designed to withstand a pressure of 150 psig. One end of the plenum was fitted with a flange which had an opening of 6-I/4 x 3-3/8 inches to which various nozzles could be attached (Fig. 3.1). The plenum was rigidly attached to the balance described in 3*2.3.
3.1.3 Two-Dimensional Coanda NozzleThe nozzle with which the experiment was
conducted consisted of a brass cylinder of 4*5 inches in diameter and 6.68 inches in length, aluminum side-plates and an aluminum bottom plate (Fig. 3*2). A slot was formed between the bottom of the cylinder and the aluminum bottom

• . 47plate which measured <>1680 Inch in height and 6.68 inches in width. The surface of the cylinder was highly polished to reduce the roughness of the metal. One-thirty-second of an inch diameter static pressure ports were made every five degrees near the 0*, 90®, and 180® locations on the cylinder. In between these angles, the pressure ports were placed at ten degree intervals. Each pressure port was laterally off-set 1/4 of an inch from the preceding one.to avoid a wake effect (Fig. 3.2).
A brass wedge was soldered to the cylinder so that the flow could be separated from the cylinder at that particular point. In addition, the cylinder was mounted on an axle so that the cylinder could be rotated, thereby placing the wedge at the desired flow separation angle.This allowed the same nozzle to be used in experiments at variable angles, i.e., 0®, 90®, 180®, or any other angle of interest less than 180® (Fig. 3=2). The backside (inside) of the nozzle when attached to the plenum formed part of one wall of the plenum. Finally, the nozzle was fitted with removable plexiglass side plates since the primary purpose of the study was to investigate two-dimensional flows (Fig. 3. D 0 Unfortunately, in designing the nozzle, at the 180® position the air was deflected into the flange as can be seen in Figure 3.1° This required a deflector to be attached to the fixed frame in order to

48deflect the flow more smoothly* The reason the deflector was attached to the fixed frame was to insure that the momentum impinging on the deflector would not influence the force readings,
3-2 Data Measuring EquipmentThe data desired from the experiment were surface
pressures (this was obtained from the static orifices on the cylinder)# total and static pressures in the jet stream, and the forces acting on the cylinder. These data were obtained by using the following pieces of equipment.
3*2.1 Total Pressure MeasurementA total pressure rake was fabricated using
brass tubing with an internal diameter of 0.020 inch and an external diameter of 0.040 inch. The rake was designed so the flow could be traversed simultaneously with eight parallel tubes. The centers of the tubes were spaced apart .23 inch horizontally and .0625 inch vertically. The geometry of the rake was such that if observed from the front when the lowest tube’s orifice was tangential to the surface of the cylinder, the remaining seven orifices spaced as stated above were in a line inclined at an angle of 20® from the surface of the cylinder. The rake was mounted on a yoke-like structure attached to the.cylinder axle and, therefore, could be placed at any desired angle

49on the outside of the cylinder surface between 0 &6 d < 150®* The rake could be raised from the surface of the cylinder to 2-1/2 inches above the cylinder by a single adjusting bolt, A vertical water manometer was used in conjunction with this rake. This arrangement allowed the total pressure to be obtained at any point in the jet stream. Prior to use, the rake was calibrated in a subsonic wind tunnel against a standard pitot tube to assure correct readings,
3.2.2 Static Pressure MeasurementA static pressure rake was fabricated using
brass tubing with an internal diameter of 0,015 inch and an external diameter of 0,030 inch. The orifices were placed 1/2 inch back from the front of the tube and placed in the same relative position as the total pressure rake (3,2,1,), This rake used the same variable angular and vertical adjustment as the total pressure rake. Surface pressures on the cylinder itself were obtained from the static ports as mentioned in section 3,1,3» With this arrangement, the static pressure could be measured at any spot on the surface and at any place in the stream by means of the variable rake.
3.2.3 Force Measuring EquipmentAs was previously mentioned, the air bear
ings were used to eliminate the lateral forces which might

50be caused by piping air into the plenum. The plenum was rigidly fixed to a balance so that all forces impressed on the nozzle (attached to the plenum) were transmitted to the balance. The balance was designed and constructed so that the resultant force acting on the cylinder surface would be resolved into vertical and horizontal components (here- after called lift and drag-force respectively). The lift force is defined as the force perpendicular to the jet stream as it ejects from the slot at the 0° position (at the slot the stream is horizontal). These definitions of lift and drag differ somewhat from the usual aerodynamic terminology. This lift force is measured as positive downward for this particular nozzle. The drag force is defined as the force parallel to the direction of the flow at the 0® position and is measured as positive in the direction opposite to the flow direction at the 0® position. The balance was made using aluminum plate and shim stock of spring steel so that the forces were successfully divided into lift and drag. These forces were measured by two Baldwin-Lima Hamilton SR-4 load cells. The drag load cell was of type U-l with a capacity of 0-500 lbs. The lift load cell was the type U-1B with a capacity of 0-50 lbs.The drag load cell output was recorded with a Leeds and Northrup Potentiometer and the lift load cell output was recorded on the X axis of a Model 135$ X-Y recorder, the

51Mosley-Autograph (Fig. 5=4). The calibrations were conducted by first obtaining a curve of output in millivolts against a dead weight input in pounds of force and then* at a no load condition* introducing a known resistance into one leg of the Wheatstone bridge of the load cell. Identifying the output produced by the resulting bridge unbalance with an equivalent amount of force* the output due to the resulting bridge unbalance is observed. Then the equivalent force is picked off from the output versus force curve. From then on* the known resistance will represent a known amount of force. This serves to check whether or not the calibration curve must be adjusted at other times. This system avoided complicated force calculations and formed an excellent method of recording experimental data.
3.2.4 Plenum PressureThe plenum pressure was taken as the total
pressure; during the test it was measured by three different methods. One method was merely attaching the pressure outlet to the vertical mercury manometer (Fig. 3.4)* The mercury manometer had a pressure locking device which could be actuated by a solenoid switch* thus locking the manometer readings at any desired time. The second and third methods used a 0-15 lb. Statham pressure transducer and a 0-250 Statham pressure transducer respectively. The0-15 lb. transducer was calibrated against a mercury

52
Figure 3.4 Vertical Manometer

53manometer using both the Leeds and Northrup Potentiometer and the Y direction of the Mosley Autograph, The 0-250 lb, transducer was calibrated against mercury at the lower pressures and against an Ashcroft Dead Weight Tester at the higher pressures using both the Leeds and Northrup Potentiometer and the Mosley Autograph, While conducting the test, it was found that, for readings simultaneous with the load cell read-outs, the electrical transducer must be used (because of the mercury manometer lag times). However, for plenum pressures, which were to be correlated to other manometer readings, the manometer attachment was used,
3,2.5 ManometersA vertical water manometer of twenty tubes
and a mercury manometer of twenty tubes (Fig. 3°4) were used. As mentioned in 3*2.4, the manometers were equipped with a locking device which could be actuated by a solenoid switch, thus locking the reading on the manometer at any given time. This device proved extremely useful for unsteady flows.

CHAPTER V?
TEST PROCEDURE
4«1 Statement of the Three ExperimentsEssentially three different experiments were con
ducted,, Each will be explained in this chapter and the results of each will be analyzed in the subsequent chapter. The first experiment was the determination of the velocity profile, the pressure gradient across the jet stream and the pressure gradient in the direction of increasing 9*
This first experiment was conducted at a Mach number of M = ,18 and, therefore, the flow was essentially incompressible, The second experiment was to measure the surface pressures on the cylinder at cylinder settings of 90® and 180®, The pressure ratios (p^/poo) varied from 1,02 to 2,01, The third experiment was determining the amount of thrust which was deflected by the Coanda cylinder at the 90® position and at the 180® position. This was done at pressure ratios of 1,02 to 2.$, The plexiglass side- plates were used on all tests to insure two-dimensionality,
4,2 Determining the Velocity ProfileThe velocity profile of the jet stream was deter
mined when the cylinder was set at 0 = 180® (where 0 = 0 ®54

55is defined as the setting of the wedge at the slot). The test was . conducted at M ** .18 ands therefore, the flow could be analyzed as incompressible. This particular Mach number was selected because steady flow could be achieved by allowing the compressor to run continuously. It was Important in this particular experiment to constantly check the plenum pressure, . This was done by the 0-15 lb. Statham pressure transducer and the Northrup Potentiometer in the 20 millivolt range after calibration. As a check on the steady pressure of the plenum, a static pressure port of the cylinder on the inside of the plenum was attached to a water manometer and its reading was recorded at each stage of the test. The readings never varied more than .1 of an inch of water. A' twenty-tube manometer was used throughout this test. After recording barometric pressure and temperature, the surface pressure on the 29 exposed cylinder orifices was measured. This had to be done in two increments due to the limited number of manometer tubes; however, each time an overlap in measurement was made and this overlap corresponded to the previous measurement within .1 inch of water. Next, using the total pressure rake (reference paragraph 3.2 1), the total pressure distribution was measured. The rake geometry allowed a jet flow of 7/16 inch to be transversed with the rake in one position. The total pressure

measurements were made at 0®$, 10®p 20®s 40®, 60®, 90®,105®, 120®, and 150® with the orifice of the first tube tangent to the surface. After these stations were measured the rake was then raised so that the number one tube was in the same relative vertical position as the number eight tube was previously. This procedure was repeated until the tubes gave no indication at each of the stations. Following this a traverse was made in a similar manner with the static pressure rake (reference paragraph 3*2.2). The geometry and the distances were such that the orifices of the static tubes were placed at approximately the same points as the orifices of the total tubes. The data Obtained from this experiment could be reduced to velocity profiles at the indicated stations, pressure gradient in , the radial direction, and pressure gradient along the surface of the cylinder.
4.3 Determining the Surface PressureSurface pressures were taken on the surface of the
cylinder when the cylinder was in the 90® and 180® positions. The surface pressure readings were taken at pressure ratios p^/poo of 1.02, 1.50, 1.59, 1.86,.and 2.01. At the. low pressure ratio of 1.02 the reading was taken with the water manometer and the plenum pressure was read with the Statham pressure transducer. The remaining pressure ratios were taken under an unsteady flow condition. To
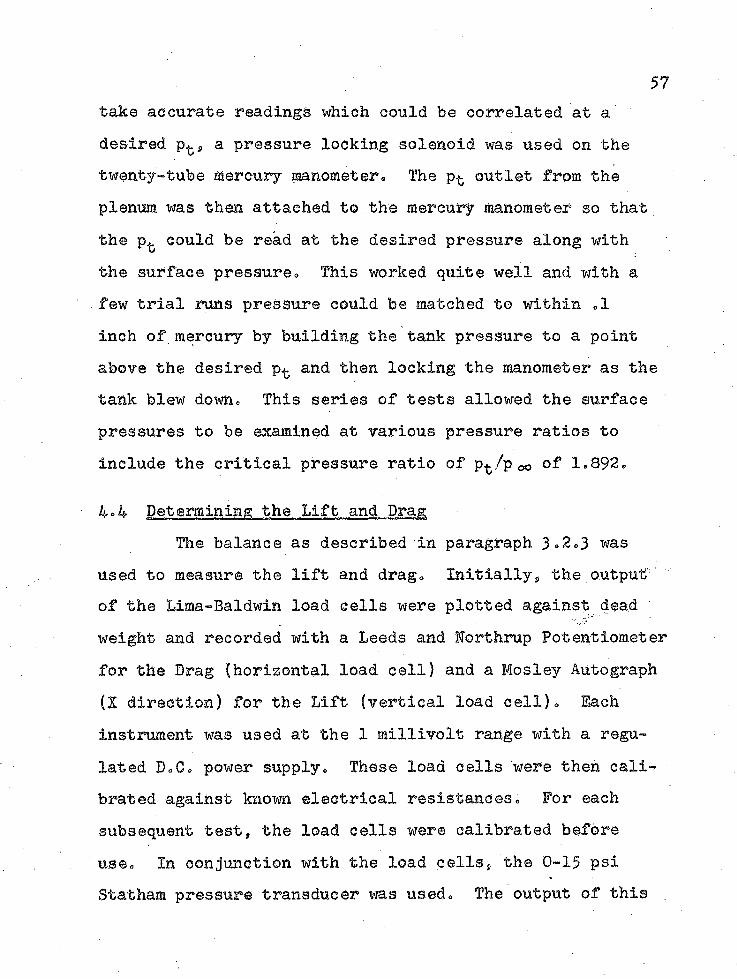
take accurate readings which could be correlated at a desired a pressure looking solenoid was used on the twenty-tube mercury manometer= The p^ outlet from the plenum was then attached to the mercury manometer so that the p. could be read at the desired pressure along with the surface pressureo This worked quite well and with a few trial runs pressure could be matched to within ,1 inch of mercury by building the tank pressure to a point above the desired p. and then locking the manometer as the tank blew down. This series of tests allowed the surface pressures to be examined at various pressure ratios to include the critical pressure ratio of p^/poo of 1.892.
4«4 Determining the Lift and DragThe balance as described in paragraph 3=2.3 was
used to measure the lift and drag. Initially, the output of the Lima-Baldwin load cells were plotted against dead weight and recorded with a Leeds and Horthrup Potentiometer for the Drag (horizontal load cell) and a Mosley Autograph (X direction) for the Lift (vertical load cell). Each instrument was used at the 1 millivolt range with a regulated D.C. power supply. These load cells were then calibrated against known electrical resistances. For each subsequent test, the load cells were calibrated before us®. Zn conjunction with the load cells, the 0-15 psi Statham pressure transducer was used. The output of this .

58instrument was plotted against inches of mercury and then calibrated on the Mosley Autograph (T direction). After the equipment was calibrated, five runs of p^/p oo &t le56, 1.67, 2.01, 2.27, and 2.52 were made at each of the following cylinder settings: 0®, 90®, 180®. During these runs,the air bearings were set to =005 clearance and were used at an air pressure of 20 psig. Again, since the flow was unsteady, the correlation of data was accomplished by using the maximum pressure and load cell readings from the electrical records. The pressure ratios were nominally set by allowing the compressor to run for a given number of seconds. However, to determine an accurate value of the pressure ratio, the record of pressure versus force was used.

CHAPTER ?
ANALYSIS OF DATA
5.1 Velocity Profile5.1.1 Analysis of Data
The data were obtained by the procedure outlined in paragraph 4.1. These data were taken at quasisteady flow conditions. The Mach number was .18 at the throat; as mentioned previously, the flow is essentially incompressible at this Mach number. The readings obtained at each station were total and static readings in.the stream and static readings on the cylinder. Bernoulli8s steady, inviseid, incompressible equation was assumed to hold at a point and from it the local velocity at any point was computed:
^ = A 1
where h^ and hg^ are the total and static manometer readings respectively, j Dhso is the density of w a t e r , i s the density of ambient air and ^ i s the gravitational constant (32.2 ft/sec2). On an average day in the laboratory during
59

January, 1965» this reduced to V - j(h^L ~ h$i.) jL .
This formula was used to reduce the measured pressures to velocitieso The jet width expanded from 3/l6 inch at the throats 0 - 0®, to approximately 2 inches at the (9 = 150s degree position. The fabricated rake could not be used at the 180° position because of physical interference; therefore, a thin-walled, total tube was used to determine if flow still existed at 180® on the cylinder at this low initial throat velocity. Flow did exist and this flow was verified by placing tufts on the fluid surface. Based on these two observations, the flow did not separate for 180® at this low Mach number. This fact was also verified by the existence of a static suction on the cylinder as can be seen from Figure 5,5. This non-separation for 180® agrees with the experiments of Newman (Ref. 11} and Fekete (Ref. 7) for 180® nCoanda Flow18 over a smooth cylinder. As a matter of additional interest, separation did not take place on the cylinder for the range of experimental pressure ratio p^/poo = 1.02 -+ 2,46 (as deduced from velocity profile, surface pressure, and force measurements)4 Examining the velocity profiles, they appeared to be similar; therefore, they were non-dimensionalized and plotted on Figure 5.1. Because of this similarity, the Pohlhausen

61
• 6 = 20° *d 6 aSIIo 9 - 60°
a 9 oOONII
f 9 = 105*
X 9 = 120*
0 .1 .2 .3 .4 .5 „ .6 .7 .8 .9 1.£/£ /Ttvd.L
Figure 5.1 Non-Dimensional Velocity Profile

i 62profile in Chapter II was developed<. Fekete obtained similar profiles on a cylinder at essentially the same throat Mach number up to 0 =* 200*,
5.1.2 Discussion of Experimental ErrorThe equipment error is believed to be + 1%
of full scale for the pressure transducer and + ,1 inch of water for the water manometer. At a V = 250 ft/sec, an actual compressibility error in the pitot tube is between1-2%. The assumption that the fluid is laminar at this particular Mach number probably introduces small error along a mean flow streamline. However, at the edge of flow where ambient air is either entrained or mixed, the flow is definitely turbulent. The turbulence appeared to be of such high frequency that the pressure tubes were able to measure the steady component of the flow within the desired manometer accuracy.
5.1.3 Comparison of Experimental with TheoreticalResultsFirstly, examining the throat experimentally
and assuming the throat static pressure as an average of p*, and ps (as previously mentioned, the static rake would not fit in the throat), the average throat velocity is 249 ft/sec. How, by using p /p ,-the Mach number and Tg can be found from isentropic tables, When comparing the speed

found in this fashion to the measured speed„ the ratio is 216 ft/sec divided by 249 ft/sec = Theoretical velocity divided by measured velocity which results in an error of 13%= If the pressure ratios are examined in the range of M = .18, and plotted against Mach number, an error in pressure ratio of 0.6$ is seen to cause a velocity error of 13$• Therefore, the error is within the pressure transducer’s tolerance of + 1$ error.
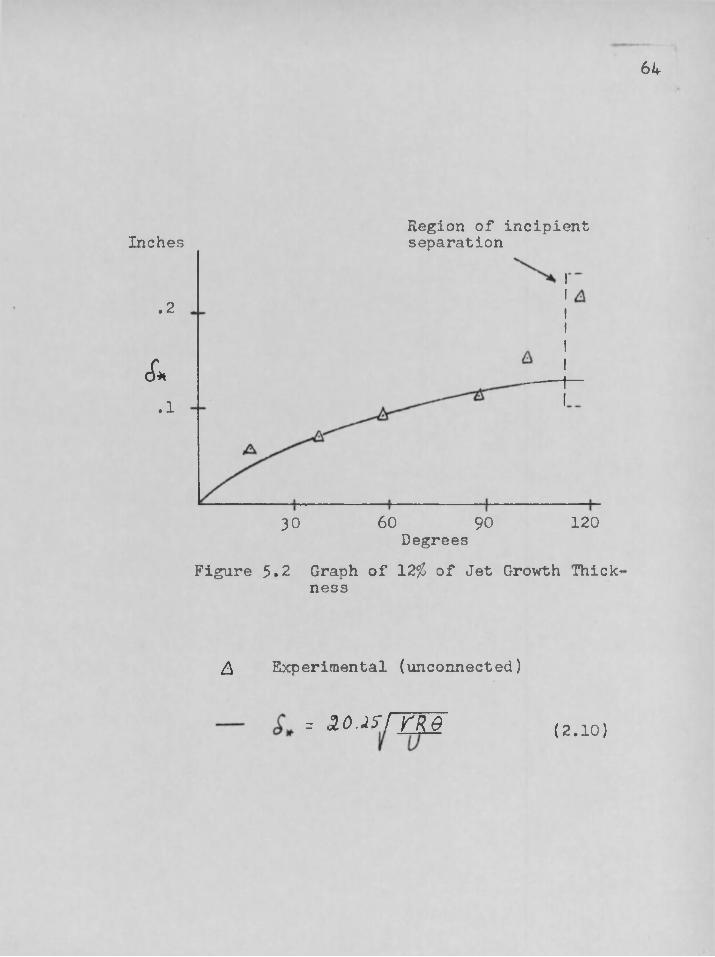
As mentioned in 2.3.1, the growth of the 12$ location of the jet width was found to be proportional to /X . The experimental curve was fitted by determining a propor-
tionality constant for and with this Equation
(2.10) was developed (Fig. 5.2). In Figure 5.2, the point at 120® is quite high since the flow at this point was approaching separation. Therefore, this point was not used in the determination of the proportionality constant. The Mach number used (M = .18) is probably very close to the Mach number at which the flow will separate on the cylinder.
Figure 5.3 compares the theoretical velocity of Equation (2.18) to the experimental velocity. Realising that the equation contains only the effects of decrease of momentum due to shear, it is a very good approximation of the flow velocity. The equation for this low Mach number
64
Inches
.2
cf*.1
Region of incipientseparation
60 1209030Degrees
Figure 5.2 Graph of 12% of Jet Growth Thickness
& Experimental (unconnected)
- - ao.isrvM (2.10)

65
300
200
100
50
160 20012080400 DegreesFigure 5.3 Comparison of Experimental and Theor
etical Velocity
A Experimental (unconnected)
~ fU 6 *-+(3.C7xi0Ok/- (2a8)

66even predicts separation at 180® which, experimentally, almost occurred on the cylinder. This equation does not give good agreement for 0 < 1 radian.
5.2 Surface Pressure
5.2.1 Analysis of DataThe surface pressure coefficients were found
to be negative, as one would expect. The experimental data are presented in the form of pressure coefficients plotted against distance from the slot (Figs. 5.4 and 5 = 5)» At the throat, the surface pressure coefficient is seen to be negative, becoming less negative as the pressure ratio is increased. Once the critical pressure ratio p^/poo = 1.892 was reached, the surface pressure coefficient at the throat became positive. To further study the phenomenon, Schlieren photographs were taken on either side of the critical pressure ratio (Figs. 5.6 and 5.7). At the lower pressure ratio, the flow appeared smooth and did not have severe density gradients (Fig. 5=7). Above the critical pressure ratio, a definite expansion and compression could be seen even though the nozzle was only slightly underexpanded (Fig. 5.6). This fact supports the analysis which Bailey (Ref. 1) made of the same phenomenon. Bailey deduced his analysis from a study made of highly underexpanded circular jets by Adamson and Nicholls, 1945. The pressure

Pt/P-o
0 = 1.02 A = 1.50 p ” 1.59 + = 1.86
-.2 4- ^ = 2.01
CPS o 0 ° ° O«»0± + 0 0 o o o G
" i ^
0 4- OA0+V
C3
+.1 _ _
+ .2 - -
H--------- 1--------- 1----1 2 3Surface Inches from Slot
Figure 5.4 Pressure Distribution over Cylinder. Surface,0 = 90

68
pt/p« O e 1.02 A ” 1.54q « 1.82f ” 1.89 ^ = 2.00
-.2 4-
Cps A O O
0
§ o G A ^0 0 0 Q Q O Q g o o O O q
-.1 ;;
©0 o 0
+.1 --
+ .2 --
1 2 3 4 5 (Surface Inches from Slot
Figure 5.5 Pressure Distribution over CylinderSurface, Q = 180

Figure 5.6 Schlieren Photograph of "Coanda Effect" Pt /Po»> 1-892
Figure 5.7 Schlieren Photograph of "Coanda Effect"< 1-892

70coefficients undulate to a certain degree. The fluctuations are probably, as suggested by tron Glahn (Ref, 29) and Bailey, due to a slight contraction and expansion of the jet. As an observation on the analysis of the surface pressure runs, the last two groups of plots, i*e,, at 4 inches and 4*5 inches (Fig, 5*4), are on the separation wedge (flat plate) soldered to the cylinder and, as would be expected, the pressure coefficient is approximately zero,
5*2*2 Discussion of Experimental ErrorThe experimental error in this test is esti
mated to be less than + =2 inches of mercury which approximates ,09 psig. This source of error is due to possible misreading of the manometer and mis-matching overlapping flows. The relative manometer positions for various pres-> sure ports were quite consistent except at the vicinity of the throat.
5*2,3 Comparison of Experiment with Theory When examining the current literature,
Newman (Ref, 17) developed an equation for the prediction of surface pressure coefficients. This equation was used by Fekete (Ref. 7) and was found to correspond well to his experiments. This is the only equation which has been developed for pressure coefficients. The equation is a

71rather involved empirical equation and was not cheeked in this studyo
On examining the plotted coefficients of pressure* the adverse pressure gradient in the increasing 0 direction can be observed* The experimental data* on which the pressure coefficients in Figure 5*5 are based* showed the pressure on the surface to vary from *046 psig at *8 inches from the nozzle exit along the surface to .034 psig at 4•08 inches * The variation of is thus quite small'andthis is consistent with the order of magnitude analysis made in paragraph 2.2 which allowed the term to be dropped as negligible.
5=3 Force Measurement
5*3.1 Analysis of DataThe force measurements were taken as a mat
ter of interest rather than for detailed analysis. They are presented as turning efficiencies {7x) plotted against pressure ratio* p^/p^ * in Figure 5«8 and 5.9. The turning efficiencies are defined as
Force (Vertical force measured at a certain 0 )v force^ (Measured at 0 = 0®T ~ '
Force^ (Horizontal force measured at a certain@)H porce^ (Measured at @ - 0®7™* " ' " ” *

72
1.0
.6 .4.5PoOPt
Figure 5.8 Turn Efficiency (71) vs Pressure Ratio at 9 = 90°
Fv (measured at 90°) ^ (measured at 90°)v F (measured at 0°) ' h p (measured at 0°)

73
1.0
n8
6
4
.2
0
PPt
Figure 5.9 Turn Efficiency (/z) vs Pressure Ratio at 0 = 180°
?2 = Fv (measured at 180°) ^ _ Fh (measured at 180°)v F (measured at 0°) ’ h p (measured at 0°)

These turning efficiencies were considered to be more meaningful than a comparison of measured force against a theoretical force<> The data were obtained through the test procedure explained in paragraph 4-3« The data indicate that the vertical turning efficiencies at 90° are almost 100%.It is easy to correlate these data with other publications for a 90° deflection. Von Glahn (Ref. 29) who used the same parameter and a similar type nozzle achieved a turning efficiency of 81%. Bailey (Ref. 1) used the ratio of a vertical measured fbrce to a force computed from a theoretical thrust equation (which is discussed in paragraph 5.3=3) and achieved 90% turning efficiency. Korbacher (Ref. 9) j, using the same equipment and parameter as Bailey at UTIA, claimed a turning efficiency of 96%. Triner (Ref. 26)9 using the same type nozzle as used in this study and Bailey’s theoretical parameters achieved a turning efficiency of 87%. However, when Triner compared his measured vertical thrust at <9 = 90® to measured thrust at 0 = 0°, he achieved efficiencies of 97%= W. E. B. Roderick (Ref.20), using a converging-diverging nozzle at UTIA with the same equipment as Bailey and Korbacher, achieved an efficiency of measured vertical force at 90° to measured horizontal force at 0® of 97%=
If Triner and Roderick would have determined their resultant force for a flow of 90® of turning, these two

75investigators would appear to have measured some thrust augmentation. The resultant force in this study for a flow of 90® was approximately 109% of the force at 0 — 0®. This result, coupled with the results of other studies, indicates that there is probably some thrust augmentation when a jet ejects adjacent to a cylinder. This thrust augmentation exists only in the (9 == 0® to 90° quadrant of- the cylinder and is probably achieved by entrainment of free air into the jet stream.
In further analyzing the primary forces involved in the "Coanda Flow,” it is best to look at the momentum vector first and then the pressure coefficients. From Figure 5.10 when the undeflected thrust is measured at 0= 0®, it is seen that the thrust has a slight vertical component. This was probably due to the wedge soldered on the cylinder as shown in Figure 5.10-a. The readings at0 = 0°, were used as the standard for computing 7l on Figures 5.8 and 5.9. Examination of Figure 5.10-b shows thejet diverges from its original stream thickness and isalso required to conform to the wedge at 90®. Therefore, in addition to a vertical force, there is a horizontal force. Looking at Figure 5.10-c, the jet is further widened by the nature of the flow and also deflected by the deflector which was added to the test equipment. These two reasons contribute to the fact that the turning

76
Momentum(a) Momentum at Q = 0°
(b) Momentum at # = 90°
Deflector
(c) Momentum at 0 = 180*
i---- — z:--- rMeasured force at ^ = 0°(scaled)
Measured force at (9 = 90°(scaled)
7 1Measured force at (9 = 180*(scaled)
Figure 5.10 Momentum Vector at 0 - 0°, 90*, 180*,= .396
P+-

77
C - 0
C_ at o
Total force at £ = 0°(scaled)
^ -0.1P0 = Total force
at <9 = 90°(scaled)
- 0.1
(c) Cn at 6 = 180°
Total force at 9 = 180* (scaled)
Figure 5.11 Pressure Coefficient at 0 = 0®, 90®, 180®,PoO ,Pt
.50

efficiencies are not as high at 180®e However, the primary force acting to reduce the momentum on a flow over 180® of the cylinder is the shear at the cylinder wall.
Before leaving the analysis, it would be meaningful to examine the forces in terms of pressure coefficients. Examining the flow at $ = 0° in Figure 5.11-a, the on the exposed part of the cylinder is essentially zero and the thrust measured is a result of the momentum of the exhausting air. At 90® in Figure 5«11-b, the Op on the part of the cylinder exposed to the flow is negative. The negative pressure coefficient is causing a downward force on the cylinder; however, the momentum is the dominant force. At 180® it can be seen (Fig, 5,11-c) that the resultant force will be as indicated. As an aside, the resultant force at the 90® position could be made perpendicular by turning the wedge a number of degrees further in the increasing Q direction,
5°3»2 Discussion of Experimental ErrorThe electrical equipment used is considered
to have an error of + 2. The load cells were checked against calibration before tests. The balance was checked against dead weight in the vertical and horizontal direction after a series of four thrust runs and read out the same as before the tests.

795.3*3 Comparison of Experiment with Theory
For the nozzle and plenum used in the experiment j, a correct analysis of the thrust at the 0 = 0° position would be similar to that of a rocket on a test stand® Therefore, the equation set forth by Zucrow (Ref. 34)
- j°JL ■+ (-fa - (5-1
would hold, where = f t -b/RTz o'* \/ji = Cjz /V-e .
On analyzing this equation in detail for the plenum and nozzle, a slight error can be predicted because of the imbalance of pressure on the interior of the plenum. Specifically, the flow on the bottom quadrant of the interior surface of the cylinder will cause a reduction of static pressure on this surface, thus leaving a slight imbalance on the interior. However, it is felt that this imbalance is an insignificant interior force and, therefore, will be neglected. The close results when comparing Zucrow9s equation to Bailey9s equation support this. It is interesting to compare Zucrow8 s equation with the equation Bailey uses for theoretical thrust, which is based on the following:

80
F
where o - and y <5-/ A U
when C & ~ Jt R ^
F - -f00 A & /? To* A! a"r % , (5-2),
I_ r i .k A!5-A K
Bailey then defined turning efficiencies as
<fr Fv / A fir
71 v- t r n r
The theoretical values of the thrust equations of Bailey, Equation (5-2), and Zucrow, Equation (5-1), were computed for two different pressure ratios and then compared against measured thrust at # ~ 0°. This was done for two thrust
runs and the error was averaged ) =
Erro r B a i l e y ?s equations averaged to 4-3% error and Zucrow''s equation averaged to 4-5% error. This would indicate that both equations are equally valid to the accuracy

81requiredo This analysis again points to the fact that the theoretical values are smaller than the measured values=As was the case in the pressure ratio of the velocity profile, this was probably due to the inaccuracy of the measurement of the pressure ratio.

CHAPTER VI
CONCLUSION
6.1 ConclusionThe velocity of the ?1Coanda Flow*® was found _to be
dependent on the viscous shear on the cylinder wall. Velocity equations were developed analytically which completely describe the flow in the 9 direction. An equation was determined experimentally which gives the radial position of maximum stream velocity at any cross section for 57«3°<
9 £ 180°.The surface pressure on the cylinder was found to
agree with other studies (Ref. 1, 7, 9, 26, 29). Experiments showed that the pressure coefficient in the throat is positive for pressure ratios greater than p^/p = 1.872.
The turning efficiencies were based on measured Lift and Drag at 0 = 90® and (9 = 180®. The 72„ at 0 - 90® was ^ 100$, the 7)H was ^ 40$. This indicates that there is probably some thrust amplification over the cylinder from (9 = 0° to 90®. This amplification rapidly drops off tending to a loss of thrust at 0 ~ 180®.
82

83There was no separation on the cylinder in the
range of pressure ratios (p^/%)<%, ) from 1.02 to 2.50.
6.2 Recommendation for Further ResearchThe tt Goan da Effect88 by a series of studies has been
established as an efficient flow turning device for thin jets. The majority of researchers in this field have been interested in the nCoanda Effect18 as a lift device for STOL or VTOL aircraft. As a further comment, "Three- Dimensional Coanda Effect" was being investigated concurrently with this study at The University of Arizona and is found to be quite ineffective since separation occurs at a pressure ratio of p^/p*, 58 1.78. If the feasibility of using the "Coanda Effect" for lift is to be established, the following research should be conducted in the prescribed order:
a) Determine the results for pressure ratios greater than p^/poo = 2.4, with a converging- diverging nozzle over a cylinder to ascertain whether or not thrust continues to increase. This would be an extension of Roderick8s study (Ref. 20).
b) Determine what pressure ratio finally causes separation over a two-dimensional cylinder while using a supersonic nozzle.

84c) Determine the maximum width o f a two-dimen
sional supersonic jet which can be efficiently deflected at high pressure ratios,
d) Determine whether or not a jet engine can be exhausted two-dimensionally (rectangular exit) and be deflected over at least a 90® quadrant and yet produce enough lift to safely raise an aircraft.
If the answers to the above questions are found to be affirmative, then probably the n Goan da Effect8® could be applied to a VTOL aircraft. For instance, a 5,000 lb. aircraft could be powered by three engines each weighing something less than 300 lbs. One engine could be placed on each wing near the fuselage. These two engines would exhaust two-dimensionally over a quadrant for take off or landing. The third engine (in the nose) would exhaust vertically and would be used only for take off and landing. In normal flight, the adjustable deflecting quadrant could be retracted into the fuselage. Whether such an aircraft would be as effective as current VTOL and STOL designs must be investigated; however, if a thick two-dimensional jet can be deflected, it is probably feasible.

REFERENCES
1. Baileys A. B. ’'Use of the Coanda Effect for the Deflection of Jet Sheets over Smoothly Curved Surfaces," UTIA Tech Notes No. 49, University of Toronto, Aug. 1961.
2. Boyer, L. J. "Preliminary Investigation and Evaluation of the Coanda Effect," Tech Rpt No. F-Tr-2207- ND ATI No. 26895, Aug. 1958.
3. Burdick, L. A., Jr., and Gates, M. F. "Coanda Effect Ventilated Clinged Flow Phenomenon as Result of Jet Sheet Following a Curved Surface," TRECOM TR-63-38 N 63-22915 23-15, Aug. 1963.
4. Chang, Paul K. "Survey of Coanda Flow," N 63-13389 08-11, Oct. 1962.
5. Coanda, H. "Analysis of Thrust Due to Coanda Phenomenon," Tech Rpt Contr. No. AF 61 -(052), Oct. I960.
6. Elsby, N. C. "Jet Switching Phenomenon in a Choked Flow Coanda-Effect Nozzle," Defense Documentation Center AD 419569, AFIT, Aug. 1963.
7. Fekete, G. I. "Coanda Flow of a Two-Dimensional Wall Jet on Outside of a Circular Cylinder," STAR N 64- 11091-02-11, Aug. 1963.
8. Gates, M. F. "Static Lift Characteristics of Jet Slots, a Clarifying Study of the External Ejector," Hiller Acft. Corp. Rpt No. ARD 213, AD 218849, Oct. 1958,
9. Korbacher, G. K. "The Coanda Effect at Deflection Surfaces Detached from the Jet Nozzle," Canadian Aeronautics and Space Journal, Vol. 8, No. 1, Jan. 1962.
10. Lachmann, G. V, "Boundary Layer and Flow Control,"The Deflection of Plane Jets by Adjacent Boundaries, Coanda Effect," Newman, B. G., Pergamon Press, 1961.
85

8611o Lachmann, G. V. "Boundary Layer and Flow Control/8
"Experimental Methods for Testing High Lift B.LoC. and Circulation Control Models/8 Williams, J., and Butler, S. F., Pergamon Press, 1961.
12. Llepmann, H. W., and Roshko, A. "Elements of Gas Dynamics," John Wiley and Sons, I960.
13. Levin, S. G., and Manion, F. M. "Jet Attachment as a Function of Adjacent Wall, Offset and Angle," STAR N 63-13624 08-11, Dec. 1962.
14. Margolis, D. P. "An Investigation of a Curved Mixing Layer," Pennsylvania State University AD 420990,Sept. 1963.
.15. McArdle, J. G. "Internal Characteristics and Performance of Several Jet Deflectors at Primary-Nozzle Ratios up to 3«0" NACA TN 4264# June 1958=
16. Metral, A., and Zerner, F. "The Coanda Effect,"Translation Series AEC-tr-3386, 1948.
17= Newman, B. G., and Bourque, C. "Reattachment of aTwo-Dimensional Incompressible Jet to an Adjacent Flat Plate," The Aeronautical Quarterly Review 7.XI. Aug. I960.
18. Pankhurst, R* C,, and Holder, D. W. "Wind Tunnel Technique," Sir Isaac Pitman and Sons, Ltd., 1952=
19. Peery, D. J. "Aircraft Structures," McGraw-Hill,1950.
20. Roderick, W. E. "Use of Coanda Effect for the Deflection of Jet Sheets over Smoothly Curved Surfaces," U.T.I.A. tn No. 51, University of Toronto, Sept. 1961.
21. Schlichting, H. "Boundary Layer Theory," McGraw- Hill, I960.
22. Sproule, R. S., and Robinson, S. T. "The Coanda Effect/8 ATI 60515, 1945 =
23. Squire, H. B. "Jet Flow and its Effects on Aircraft," Aircraft Engineering, March 1950.

8724® Sridha, K. RAn Experimental Investigation of the Flow
in and behind Two-Dimensional Jet Sheets Bounding aCavity,” UTIA Report No® 94, Aug® 1963®
25= Sterne, L® H. J® "Analysis of Thrust due to GoandaEffect,” Tech Rpt to ARDC, Jan. 1961®
26. friner, E. G® "An Experimental Investigation of theOoanda Phenomenon,” Master”s Thesis, The University of Arizona, 1963 =
27® Voedisch, A. "Analytical Investigation of the OoandaEffect,® Proj. No. FP - 188, Tn Rpt No. TR 3155 ND, April, 1947®
28. von Glahn, U. "Use of the Coanda Effect for Obtaining Jet Deflection and Lift with a Single Flat Plate Deflection Surface," NAGA TN 4272, June 1958.
29® von Glahn, U. "Use of the Coanda Effect for JetDeflection and Vertical Lift with Multiple-Flat-Plate and Curved-Plate Deflection Surfaces, NAGA TN 4377, Sept. 1958.
30® Yen, K. T. "An Investigation of the Coanda Effect for Supersonic Flows," Rensselaer Poly. Inst. TR AE 5405, AD 45023, March 1954®
31. Yen, K. T. "On the Laminar Mixing of a Two-Dimensional Compressible Jet," Rensselaer Poly. Inst® TR AE 5404, AD 40025, March 1954=
32. Young, D. W . a n d Zonars, D® "Wind Tunnel Tests of the Coanda Wing and Nozzle," Engineering Div. AMC AF Tech Rpt 6199, VI 3481, 1950.
33® Williams, J., and Butler, S. F. J. "Aerodynamical Aspects of Boundary Layer Control for High Lift at Low Speeds," NATO Advisory Group for Aeronautical Research and Development, Rpt 414, Jan. 1963®
34® Zucrow, M. J. "Aircraft and Missile Propulsion,"Vol. II John Wiley & Sons, 1958.