757138/fulltext02.pdf ... title
TRANSCRIPT

1
FACULTY OF ENGINEERINGAND SUSTAINABLE DEVELOPMENT
Temperature control in PID controller by Labview
Hongji Yu
June 2014
Bachelor’s Thesis in Electronics
Program: Electronics
Examiner: Jose ChiloSupervisor: Zain Ahmed KahnI

2
Acknowledgement
The author appreciates Zain Ahmed Kahn’s work very much for his enthusiastic and
professional supervision. Also, sincerely thanks to Niklas Rothpfeffer for giving me the
general description to the project topic with warm hearted suggestions.

3
Abstract
With the development and popularization of computer technology, digitizer is replacing
analog device gradually. The measurement and control technology plays an important role in
the process of production and scientific research. As the time going, the conventional
instruments are emerging shortages. It becomes necessary to improve conventional
instruments.
In this thesis, the conception of the virtual instrument and the merits of which against
conventional instrument will be introduced. The program system and the programming
environment of virtual instrument LabVIEW will be mentioned as well. Around the
anticipant target which the PC-based virtual instrument in this thesis is expected to achieve,
the design thoughts and the whole structure on which the virtual instrument was built are
described in details. Following these thoughts as principles, a temperature control system
will be designed.
Based on the virtual instrument (LabVIEW), the temperature control system will be designed
to realize the data of the temperature of the objects. The sample input signals were analyzed
and disposed to determine the size of the output signals by using the LabVIEW program, and
the output signals was transferred to the external temperature control circuit, so the PID
algorithm was used to achieve the control of a temperature control system.
Working on this thesis still needs more study. The program still needs further optimization
and improvement in practicability.

4
Keyword: virtual instrument; LabVIEW; temperature control; PID

5
Contents
1 Introduction ………………………………………………………………………………….7
1.1 Project Background ..................................................................................................... 7
1.2 Goal…………………………………………………………………………………...8
1.3 Outline………………………………………………………………………………..8
2 Theory……………………………………………………………………………................10
2.1 Data acquisition board (NI USB-6008)……………………………………………..10
2.2 LM35-D……………………………………………………………………………..10
2.3 Description of LabVIEW……………………………………………………………11
2.31 Front Panel……………………………………………………………………...11
2.32 Flowchart……………………………………………………………………….12
2.33 Icons and Connectors…………………………………………………………...12
2.4 Operation panels of LabVIEW………………………………………………………12
2.41 Tools Palette……………………………………………………………………12
2.42 Controls Palette…………………………………………………………………13
2.43 Functions Palette………………………………………………………………..14
2.5 PID Control…………………………………………………………………………..14
2.51 P-Control (Proportional Control)……………………………………………….16
2.52 I-Control (Integral Control)…………………………………………………….17
2.53 D-Control (Differential Control)………………………………………………..17
2.54 The PID Control………………………………………………………………...18
2.6 PID Modules in LabVIEW…………………………………………………………..19
3 Process and result…………………………………………………………………………...21
3.1 Connections.................................................................................................................21

6
3.2 Design…………………….………………………………………………………….23
3.21 Front panel design………………………………………………………………..23
3.22 Back panel design………………………………………………………………..24
3.23 Overall design……………………………………………………………………24
3.3 Running the program...................................................................................................25
3.4 Results………………………………………………………………………………..26
3.5 Chapter summary…………………………………………………………………….28
4 Conclusion…………………………………………………………………………………..29
References.................................................................................................................................31

7
1. Introduction
This chapter gives the background of virtual instruments, control system, the goal of this thesis
and the research questions. The content outline runs through this whole thesis and affects the
final results.
1.1 Project Background
With the continuous development of information science, the issues that need to be addressed
have become increasingly difficult, the requirements of control system have also been more
and more demanding. Besides, as the multiple analytic methods require convenient operability,
the traditional control system tends to be a bit powerless in implementing various functions.
The signal-processing circuit design of the traditional control system is rather complicated and
has difficulty in updating. Moreover, traditional instruments will have no way to upgrade or
update the calculating method when new calculating method or computing requirements are
raised, which will hinder the control improvement [1].
Based on the rapid development of microelectronic technology, computer technology,
software technology, network technology and modern measurement technology, a new kind of
advanced instrument--virtual instrument, has been a hot spot of current system research. As a
combination of various technologies and computer technology, virtual instrument has
opened up a new era of instrument technology. The basic idea of virtual instrument aims at
replacing the traditional electronic instrument and gradually replacing the traditional

8
instrument to implement some functions such as the collection, analysis, display and storage
of data [2].
According to the software development platform, virtual instrument perfectly integrates the
computer hardware resources and instrument hardware. It also combines the strong
data-processing capacity of computer, the measurements of instrument hardware and control
capacity. Furthermore, the display, storage and analytic processing of data can be
implemented through the software, and then the system control and the display of
measurement data can be achieved by the interactive graphical interfaces. In addition,
various functions are specified through using diagram modules. The adoption of IC
temperature sensors and virtual instrument facilitates establishing a temperature
measurement system. What’s more, the peripheral circuit is simple and can be easily realized,
which is conducive to hardware maintenance, function extension and software upgrading of
the system [3].
As LabVIEW is regarded as a language development platform, a temperature control system
will be designed in this thesis. Based on the serial communication between computer serial
port and the object, the real-time measurement and control of temperature can be attained [4].
1.2 Goal
The goal of this thesis is to build a PID controller to control the temperature signal from an
object. In order to achieve this goal, by using the data acquisition board to collect and analysis
the signal from the heat device, then build a fuzz PID controller in LabVIEW and find the
errors. After fix the errors by the system, the temperature signal could be controlled.
1.3 Outline

9
In chapter 2 we will write about the description of the hardware and software. The data
acquisition board (NI-USB6008) and the temperature sensor (LM35-D) will be presented.
Meanwhile, the software LabVIEW will be introduced. In the end of this chapter, the PID
control principle will be presented in details.
In chapter 3, we will design a LabVIEW-controlled NI-USB-6008 temperature acquisition
device which can accurately collect environment temperature. Write the program for the upper
computer using LabVIEW so that it can receive the temperature information data sent by the
lower computer and display the data on the screen. Write PID control system by using
LabVIEW so that relatively accurate control of temperature can be realized.
In the last chapter we will conclusion and discussion the result. The advantages of LabView
and PID controller will be presented.

10
2. Theory
This chapter mainly introduces the devices, the basic structure of LabVIEW system, and the
PID control system. Therefore, it provides the basic theory of this study for readers.
Next chapter will explain the whole process and test which based on these theory knowledge.
2.1 Data acquisition board (NI USB-6008)
NI USB – 6008 has a basic data acquisition function, its applications include simple data
record, a portable measurement and laboratory experiment of academic institutions. NI
USB-6008 provides the basic data acquisition function for simple data recording, portable
measurement and college laboratory experiments and so on. The price of this product is
suitable for students, but its powerful functions are more than enough to deal with the complex
measurement applications. Using NI USB - 6008 and its ready-to-use data recorder software
which is included, the basic measurement can be completed within a few minutes. Or in other
way, using LabVIEW or C language and included measurement service software
programming can customize measurement system [5].
2.2 LM35-D
Lm35-D is a kind of temperature sensor which made by NS company. It has high precision
and wide linear range. Therefore, compared with the Kelvin standard linear temperature
sensor.LM35 has more advantages, for the most important part, it does not need external
adjustment or trimming, the sensor allows the temperature between -55~150℃, could provides
the common room temperature precision of +/- 4℃. It has 3 pins, pin1 is connects to Vcc, pin2
is connects to the output, pin3 is connects to the ground. Shown as Figure 1

11
Figure1 Pins of the LM-D temperature sensor
2.3 Description of Labview
LabVIEW is an abbreviation for Laboratory Virtual Instrument Engineering Workbench
designed by Doctor James Truchard, Doctor Jeff Kodosky, founders of NI Company, and their
friend which names Jack McRiessen. It was first applied on the original Macintosh computer
in May, 1986, which even predated the graphic operating systemWindows launched by
Microsoft.
The program LabVIEW developed by NI Company consists of three major functional parts:
functional operation and graphic display of virtual instrument; design and edit of background
programs; selection and connection of subprograms [6]. They are realized by the following
three modules:
2.31 Front Panel
Front panel is a tremendously important part of virtual instrument. No matter the software
operations, input, output, or results. All of these depend on the virtual graphical interfaces of
the front panel, which make real interactions between computers and users possible.
2.32 Flowchart
Flowchart, which is the back panel of the program, realizes the function design of the software.
It includes control signal acquisition, overall architecture of the software, calculations and so
on. By editing the program of the back panel, the program icons of the back panel are
12
corresponding to the control program of the front panel. Only some built-in functions and
program frames are running in the background independently.
2.33 Icons and Connectors
If the program in LabVIEW is too complex, the master program will be modularized into
several subprograms to command different functions. The subprograms are named as
subordinate VI as well which are represented by icons that can be used by the master program
with connectors.
2.4 Operation Panels of LabVIEW
In order to make the operations of users more convenient, LabVIEW provides three different
sets of operating panels which appropriately classify different types of functional modules.
Users can conveniently choose any of the three in their own needs, which include:
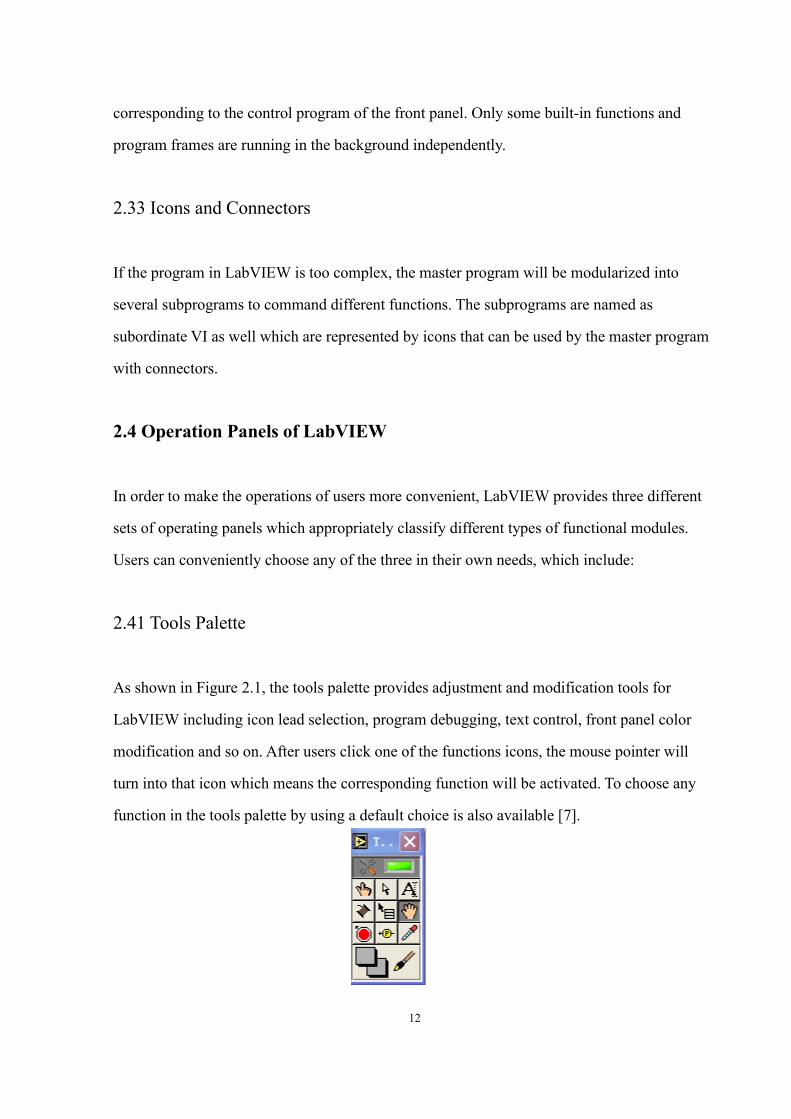
2.41 Tools Palette
As shown in Figure 2.1, the tools palette provides adjustment and modification tools for
LabVIEW including icon lead selection, program debugging, text control, front panel color
modification and so on. After users click one of the functions icons, the mouse pointer will
turn into that icon which means the corresponding function will be activated. To choose any
function in the tools palette by using a default choice is also available [7].

13
Figure 2.1 Tools Palette of LabVIEW
If the mouse pointer stops over the subprograms or the icons of the back panel, the
corresponding tooltip window will appear.
2.42 Controls Palette
As shown in Figure 2.2, the control palette consists of the following subordinate palettes.
Figure 2.2 Control Palette of LabVIEW
This palette mainly adds various virtual control switches and VIO to the front panel. Users can
not only add suitable virtual control icons according to different targets and accuracies of the
design programs, but also beautify interactive interfaces by using this palette.
2.43 Functions Palette
The functions palette is a tool to set up the flowchart program, as shown in Figure 2.3. Each
top-layer icon on the palette represents a subordinate palette. The functions palette includes all
important program function modules. It includes the basic operations module, signal

14
processing module and hardware interaction module. It is shown as Figure 2.3.
Figure 2.3 Functions Palette of LabVIEW
2.5 PID Control
A successful operations of automatic control system requires anti-jamming capability, stability
and ability to meet the given performance index. Since the physical structure and the working
process of the controlled object are constant, the output value of a given signal could not meet
the needs of system. Therefore, a controller needs to be included.
The controller and the controlled object will form a closed-loop system which helps the output
of the system meet the given performance index. In addition, the controller always utilizes
various kinds of control rules [8].
PID (Proportional Integral Derivative) control is a widely used control method. It has huge
advantage in the fields of control engineering. After a long period of engineering practiced, it
has developed a complete program of control methods and a typical structure [9].
PID controller has simple structure, excellent stability, reliable performance and convenient
adjustability. When the structure and the parameters of the controlled object cannot be

15
completely acquired or cannot manifest a clear mathematic model, PID control technology
becomes more useful. Because it was designed for the situation where users cannot thoroughly
learn about a system with a controlled object, or cannot obtain the system parameters by using
the effective measuring methods.
PID
Controller
Executing
Agency
Controlled
Object
Measuring
Devices
Excepted value Outpu
Feedback
Figure 2.4 the PID control system
PID, as its name implies, utilizes the proportion, the derivative and the integral to work out
controlled quantity based on the system errors. These three elements are mutually independent
and have respective functions. Users can choose any of the three based on the practical
situation.
The transfer function of a standard PID controller is generally written in the way:
sTsT
K
sKs
KKsG
di
p
dip
11
1
(1)
Where Kp is the proportional gain, Ki is the integral gain, Kd is the derivative gain, Ti is the
integral time constant and Td is the derivative time constant.
As a linear controller, it according to a given value r(t) and the actual output value y(t) to
control deviation e(t), the deviation in proportion, integral, and differential through linear
combination constitute control u(t), to control the controlled object. For the output of the
controller input relations is shown as:

16
dt
tdeTdtteT
teKtu d
t
ip
)(1
0
(2)
Where u(t) is the output of PID controller, e(t) is the input. Shown as Figure 2.5
Figure 2.5 theory of a PID controller in a feedback loop
To get a PID control, we have to learn about P control, I control and D control first. Then we
will combine these three controllers into PID controller.
2.51 P-Control (Proportional Control)
If the output of controller is only proportional to the error, that is, u(t)=Kpε(t), then a
proportional controller will be formed. It is thus obvious that a proportional controller is
actually a variable gain amplifier (VGA).By changing the proportional action factor (Kp), the
proportional controller can adjust the output. The P control is shown as Figure2.6

17
Figure 2.6 the Proportional Control
From the Figure 2.6 we can know that the P control is:
tKtu p (3)Although the proportional controller is sensitively responsive to the error, there is always a
steady-state error between the output and the value of expectation. The steady-state error can
only be eliminated by manual reset, which causes huge inconvenience in practical application.
Increasing Kp can increase the open-loop gain of the system, reducing the steady-state error
and increasing the rapidity of the system. Nevertheless, it is likely to cause not only the
stability of the system to deteriorate but also the oscillation of the system becoming more
frequently. In the other hand, decreasing the value of Kp will make the system action becomes
slowly, thus the corrective the problem which the system seldom uses P control alone [10].
2.52 I-Control (Integral Control)
Because the steady-state error needs resetting manually, people find that the steady-state error
can be eliminated by introducing an integral term. The output of the proportional controller is
in direct proportion to the error signal, that is tdtT
t
i0
1 .
And then the output of PI controller is:
tdtT
tKtut
ip
0
1 (4)
dttKtKdttTK
tKt
ip
t
i
pp
00
The integral term will integrate the error and increases over time. Thus, as long as there is an
error, the output will continue working. In this way, even if the error is very small, integral
term will keep increasing over time. Then, by increasing the output of the controller to make
the steady-state error reduced to zero if the further all the time, the way to eliminate the

18
steady-state error can be achieved. But the integral of time will inevitably affect the fast
dynamic performance of system. Sometimes, when a system adjusted overshoot, there will be
some situations, among which the worst even can cause a system breakdown [11].
2.53 D-Control (Differential Control)
Integral Control’s dynamic property is poor. However, a differential term can just make up for
this. The output of differential controller is in direct proportion to the differential of errorsignal, and then the output of PD Controller is:
tdtdTKtKt
dtdTtKtu dppdp
tdtdKtK dp
(5)
D-action (Differential action) reflects the change rate of error signal, so it is predictive to the
system control and can predicts the change trend of error. Thus it can produce advanced
control function. Even before the formation, the errors may have been eliminated by
differential action regulation. If the appropriate D-action time is selected, the overshoot and
the setting time of the system will be reduced, greatly improving the dynamic performance of
the system.
Differential control in practice is often used to offset the unstable trend produced by integral
control. Because its reaction is to change the rate of the error so that the differential control is
not often used alone but only plays a part in the dynamic process. What’s more, differential
control has amplification effect on noise jamming, so the differential term can become a

19
disadvantage to the anti-interference ability of the system [12].
2.54 The PID Control
PID control is namely the combination of proportional control, integral control and differential
control, thus integrating the advantages of such three kinds of controllers. In practical
application, there is no need to use all these three parts, but only proportional control unit is
indispensable. For the PID controller, the output is:
t
dpi
pp
t
di
p tdtdTKdtt
TK
tKtdtdTdtt
TtKtu
00
1
tdtdKdttKtK d
t
ip 0 (6)
Where Kp= Proportional gain, Ki= Integral gain, Kd = Derivative gain.
Finally we can get a complete PID control.
PID control actually means setting these three parameters, namely, Kp, Ti and Td, in order to
get applicable output value to control the system. The specific details on how to set them are
different based on different situations. Currently, PID is not only widely applied but also
rapidly developed. The intelligent controllers which can self-tune these three parameters have
been massively invented [13].
After the combination between PID and digital controllers such as computer, the design
method of digital PID has also emerged, whose specific principle still follows the traditional
ones.
2.6 PID Modules in LabVIEW
NI Company provides PID control toolkit used in LabVIEW, which can help engineers
quickly and efficiently build a digital PID controller by combining with the NI data acquisition
device, thus a complete system requires accurately and reliably. Installing LabVIEW PID

20
Control Tookit in NI CD Tookit software can generate the toolkit in LabVIEW which showns
as Figure 2.7
After installation, open a new VI, right click the program block diagram,choose “control
design and simulation” on the “function” panel , and the PID toolkit which consists of 10 VI
can be seen.
Figure 2.7 PID Toolkit
Using PID.vi can set up a simple PID controller. Keying in three parameter gains, namely,
process variable, set point into the input of vi, the output value then can be measured. Besides,
the vi can control the range of the output [14].
PID Advanced.vi is such a kind of vi designed for experts, which has been added some
advanced functions, such as setting set point range, manual control and linearity and so on.
PID Advanced.vi is designed for the PID system which needs to be self-toned. Having been
given several fundamental requirements, it has the function of self-toning then [15].

21
3. Process and results
The previous chapter 2 has recounted the historical characteristics and application prospects of
virtual instrument, the status quo and the development of signal processing system. This
chapter will concentrate on PID control principle. PID control algorithm is one of the most
sophisticated control rules so far and it has been widely applied in continuous control systems
[7].
3.1 Connections
Using USB cable to connect the port of data acquisition board, another side of the cable
connects to the port of PC. Connect the temperature sensor (which has been introduced in the
previous Figure1) to the data acquisition board (which shown as Figure3.1). Where the GND
of the temperature sensor is connects to the Port32 (ground) of the digital side on the data
acquisition. The +VS of the temperature sensor is connects to the Port31 of the data acquisition
where Port31 expresses input voltage (+5V). The Vout of the temperature sensor in connects
the Port17 where Port17 expresses the output. Then connect the temperature sensor to the heat
device. The port of data acquisition board is shown below:
Figure 3.1 port of the DAQ board

22
The overall hardware connections is shown as Figure 3.2
Figure 3.2 hardware connection
This kind of system is made up of computer, temperature measurement module NI USB-6008
and LabVIEW control system. By integrating the computer, powerful graphical programming
software and modularized hardware and by setting up flexible measurement and control
schemes based on computer, the system becomes one that can meet the requirements.
The system works like: using sensor NI USB-6008 to obtain the temperature signal; then using
the LabVIEW program operating on computer to analyze and process input data; finally using
computer to show the final results. Meanwhile, by using computer USB to sample the input
signals and using the PID control algorithm in LabVIEW, the value of system output signals
can be figured out. Then, by transmitting output signal through serial port to the external
temperature control circuit, the aim of controlling the temperature can thus be realized.
3.2 Design
In the previous parts, the design analysis of virtual instrument module and the establishment of
23
the virtual instrument have been briefly described. In this section, we will present the specific
process of the design which is mainly about the designing aspects of software. We have
designed the front panel and program chart of PID temperature control system. What’s more,
we have focused on the design of PID module program [16].
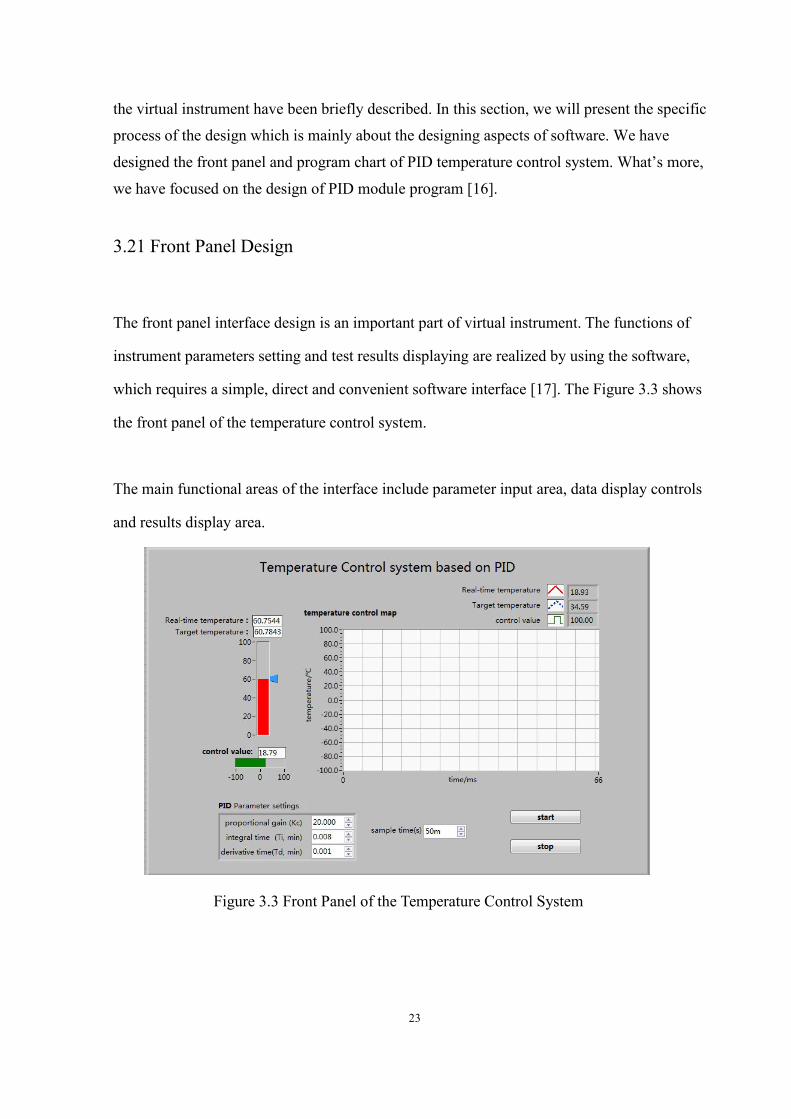
3.21 Front Panel Design
The front panel interface design is an important part of virtual instrument. The functions of
instrument parameters setting and test results displaying are realized by using the software,
which requires a simple, direct and convenient software interface [17]. The Figure 3.3 shows
the front panel of the temperature control system.
The main functional areas of the interface include parameter input area, data display controls
and results display area.
Figure 3.3 Front Panel of the Temperature Control System

24
3.22 Back panel design
The Figure 3.4 shows the chart of the back panel program.
Figure 3.4 Chart of the Temperature Control System
In the part, the process parameters and the PID parameter settings will be design. After that the
real-time temperature and the target temperature will be collect by the system which will pass
through the PID controller with the control value. Finally we can check how the program
running in the temperature control map
3.23 Overall Design
First of all, we have conducted the overall construction of the framework of the temperature
control program based on LabVIEW. In this module, we have conducted controlled
temperature signal simulation, added PID control program and achieved heating control
through which real-time temperatures change along with target temperatures. The response

25
time and the accuracy of temperature control can be adjusted through the adjustment of the
proportional element, the integral element and the derivative element, as shown in Figure 3.5
Figure 3.5 PID Parameters Settings
Then build the program chart in LabView by using the PID principle which has been
introduced in the previous chapter 2.5. The Figure 3.6 shows the program chart.
Figure 3.6 PID Control Program Chart
3.3 Running the program
26
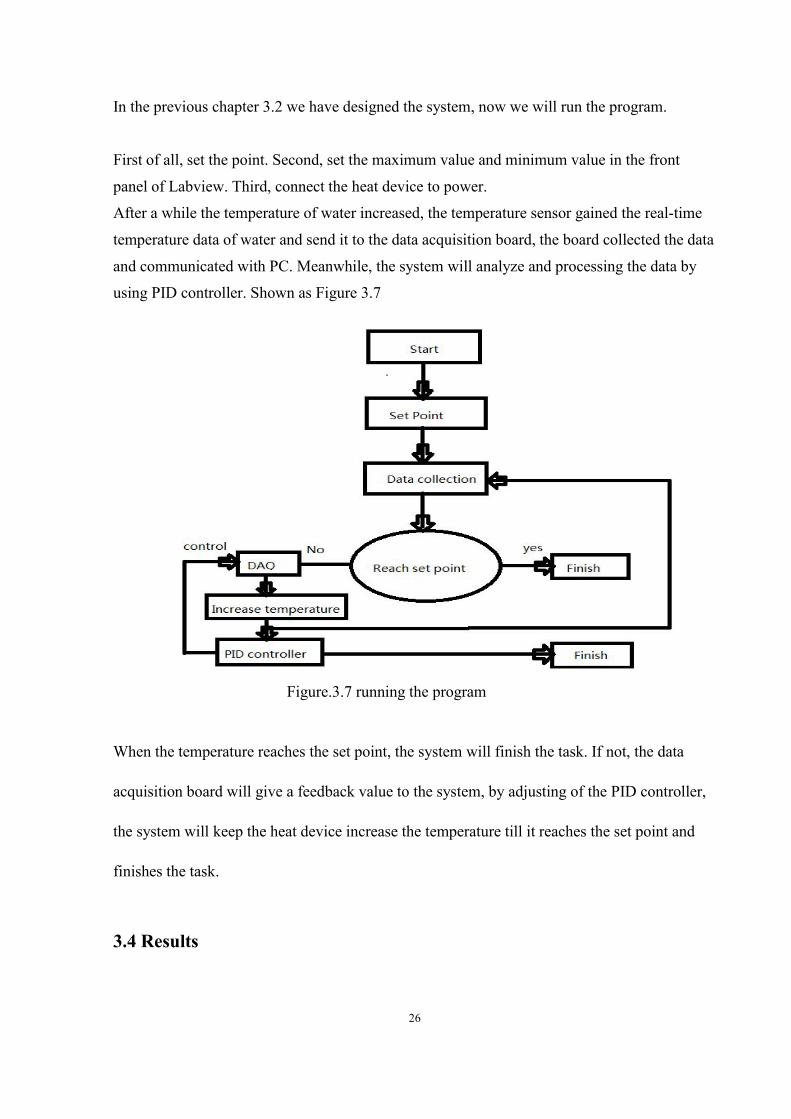
In the previous chapter 3.2 we have designed the system, now we will run the program.
First of all, set the point. Second, set the maximum value and minimum value in the front
panel of Labview. Third, connect the heat device to power.
After a while the temperature of water increased, the temperature sensor gained the real-time
temperature data of water and send it to the data acquisition board, the board collected the data
and communicated with PC. Meanwhile, the system will analyze and processing the data by
using PID controller. Shown as Figure 3.7
Figure.3.7 running the program
When the temperature reaches the set point, the system will finish the task. If not, the data
acquisition board will give a feedback value to the system, by adjusting of the PID controller,
the system will keep the heat device increase the temperature till it reaches the set point and
finishes the task.
3.4 Results

27
When we set the target temperature at 40℃, inputted the parameters and clicked the run button,
the system starts running. The temperature increased slowly. After a while, the temperature
reaches 40 degree. The results were as follows shown in Figure 3.8.
Figure 3.8 Temperature Control System Results at 40℃
After changing the target temperature, we can guess that the controlled temperature will make
timely adjustments. By testing the target temperatures at 60℃ and 80℃ to prove the system
will make timely adjustments. Figure 3.9 and Figure 3.10 show the results.
Changing the temperature to 60℃ which shown as Figure 3.9. The red curve expressed the
real-time temperature of the target. We can see that the curve increases stable, after a while,
when it reaches 60℃. The curve stopped increasing.

28
Figure 3.9 Temperature Control System Results at 60℃
Then change the temperature to 80℃ to test if the system will adjust by itself. Shown below:
Figure 3.10 Temperature Control System Results at 80℃
The result shows that when the red curve increased to 80℃, the system becomes stable and the

29
temperature stopped increasing. Then we can know the system will make timely adjustments.
With the well-running program and the results, we can control the temperature of target very
well by using the PID controller.
3.5 Chapter summary
This chapter describes the entire process of the realization of the software design and achieves
the design of a PID temperature control system. With some modifications, a temperature
control system suitable for different conditions can be established very quickly and easily. The
flexibility and scalability of virtual instruments will display exhaustively.

30
4. Conclusion
With virtual instrument being the platform and the shortcomings of traditional temperature
control system, this thesis combines graphical programming language LabVIEW and the basic
principles of PID to conduct temperature control. The virtual instrument technology inherits
the advantages of traditional instrument and avoids the shortcomings. Users can change and
redefine the functions of the instrument based on their own needs [18].
This thesis has achieved digital replacement of traditional instrument through the design of the
virtual instrument of the temperature control system and obtained some results. It turns out to
be that using technologically advanced virtual instrument technology to replace traditional
measuring and testing technology is not only feasible, but also better and more systemically
stable.
This thesis provides ideas for the development of similar instruments and paves the way for
the full digitalization of traditional instrument. Because the technology is an emerging
technology which involves novel theoretical knowledge and integrates multiple disciplines,
and my experience is rather limited, the program is in need of further improvements especially
in terms of software, which can expand the functions of the system through further
optimization of its algorithms [19].
In this thesis, the temperature control system is designed by Labview with Proportional
Integral Derivative (PID) controller. With the controller, the system controlled the temperature
successfully. In this case, the PID controller showed accurate in a system control as the result.
31
No matter P-controller, PI controller, PD controller, PID controller and so on, all the types
controllers designed in Labview will be very simple, because running a program in Labview
does not need any code since it follows the graphical coding. All the principle is shown as
graphical so that Labview is the simplest software to build control system.

32
References
[1] L.Wang, M.Tao, “Proficient in LabVIEW8.0 [M]”, Electronic Industry Press, Beijing,
Jan.2007
[2] J.Travis, J.Kring, “LabVIEW University Practical Tutorial (Third Edition) [M]”,
Electronic Industry Press, Beijing, June.2008.
[3] S.Wu, J.Cui, “AVR - GCC and AVR Microcontroller C language Development [M]”,
Beijing Aerospace Science Press, Beijing, 2004
[4] S.Du, “SCM C Language and Assembly Language Programming Practice [M]”,
Beijing University of Aeronautics and Astronautics Press, Beijing, 2008
[5] J.Zhang, T.Song, “AVR C Language Programming Examples”, Electronic Industry
Press, Beijing, 2009
[6] F.Zhu, P.Yang, “Introduction to C language programming in AVR Microcontroller and
Typical Examples”, Mechanical Industry Press, Beijing, 2009
[7] W.Shen, “Introduction to AVR microcontroller C language Development Guidance
[M]”, Tsinghua University Press, Beijing, 2003
[8] Q.Li, Z.Ren, “Virtual Instrument Summary and Modern Scientific Instruments”, April,
1999, pp.1 - 20.
[9] S.Qin, B.Tang, “Intelligent Control Principle and Implementation of Virtual
Instrument System”, September, 2004, Page59.
[10] Y.Dai, “Weak Signal Detection Method and Apparatus [M]”.National Defence
Industry Press, 1994.
[11] National Instruments Corporation, LabVIEW Express, Getting Started with
LabVIEW, April, 2003.
[12]L.Yang, H.Li, &Y.Zhao, “The LabVIEWAdvanced Programming”, Tsinghua

33
University Press, Beijing, 2003
[13] C.Liu, Z.Yuan, “Automatic Measurement Technology”, Mechanical Industry Press,
Beijing, 2008.
[14] J.Liu, H.Jia&H.Ding, “The Virtual Instrument LabVIEW Graphical Programming
Language Tutoria”, Xi’an Electronic Science Press, 2003
[15] M.Zhong, “Based on In-vehicle Network of Car Driving Recorder host module
Research and Design [D]”, Wuhan University of Technology, 2007
[16] Q.Gu, “Intelligent Controller Based on LabVIEWAutomatic Test System [J]”,
Microcomputer Information, Vol.23, pp.171-172, 2007
[17] Nuccio, Salvatore, Spataro&Ciro, “Assessment of virtual instruments measurement
uncertainty”, pp 39-46, March, 2001.
[18] Fortion, Giancarlo, Nigro&Libero, “Development of virtual data acquisition systems
based on multimedia internetworking”, pp.429-440, December, 1999.
[19] H.Lian, Y.Zhao, “Based on the Technology of LabVIEW Virtual Instrument System”,
pp. 21-23, 2001

34