2015...4 investments by the end of calendar 2015, total investments (cash, marketable securities,...
TRANSCRIPT

2015
1
Dear Shareholders of Biglari Holdings Inc.:
Biglari Holdings is unlike most public corporations in structure, scope, and style. I believe
we are duty bound to communicate clearly our operations, economic objectives, and managerial
philosophy in an effort to cement an alignment of expectations with all owners of our business. In
doing so, the ownership will comprehend our policies and methods of operation.
We have been building Biglari Holdings to be a mosaic of businesses, devoted to
acquisitions, thereby adding to a fine collection, an amalgam intended to produce a stream of
significant, strong, and secure cash flows. We fashioned a structure enabling maximum flexibility
concerning capital allocation — moving capital for efficacy — that has accounted for much of our
economic gain. We hold a significant structural advantage as a permanently capitalized vehicle with
cash-generating, controlled businesses distributing surplus cash to the parent company for
reallocation. The genesis of the current construction was inaugurated seven and one-half years ago,
when we took on a business at the edge of bankruptcy — Steak n Shake — which soon became the
launching pad for Biglari Holdings.
From 1934 through 2008 the cumulative pre-tax earnings of Steak n Shake were around $480
million. However, when we took over in August 2008, the company was in serious turmoil —
financially, operationally, and culturally — nearing extinction. The turnaround was exceedingly
difficult because of the company’s dire financial position and the country’s severe credit crisis. Steak
n Shake had been in violation of its debt covenants with lenders. However, we were able to obtain
waivers on the credit agreements. Yet ominously, the lenders reduced the amount of credit available
to the company, heightened interest rates, and tightened financial covenants. Against this backdrop,
Steak n Shake was experiencing double digit declines in customer traffic as well as suffering cash
losses of about $100,000 per day! In August 2008, to assess the amount of time we had left to turn
the business around, we stress tested what projected pre-tax losses would become if declines of 10%
in same-store sales continued in fiscal 2009. We braced ourselves…$57 million!
We started from an inauspicious base of $1.6 million in cash along with a business in
extremis, operating at significant losses. We repositioned, resuscitated, and rescued Steak n Shake in
very short order. The chain shifted from losing 11% in customer traffic in September 2008 to gaining
10% in December 2008, a remarkable 21 percentage point reversal. In contrast, during the same
period, most other restaurant chains in the industry were experiencing precipitous declines in
customer traffic. After turning our struggling company into a profitable enterprise, it formed the base
from which we have been constructing a dynamic, value-building enterprise, Biglari Holdings. We
began reallocating excess capital into superior but unrelated businesses and investments. In creating
Biglari Holdings from scratch, we formulated no master plan concerning businesses or industries we
would enter, but instead we pursued unusual, golden opportunities wherever and whenever they
arose. Over the last seven years Biglari Holdings’ cumulative pre-tax earnings (including profits
from investments) have totaled approximately $485 million. In other words, more money has been
earned in the last seven years by Biglari Holdings than during the preceding 75 years by Steak n
Shake.
The compression of 75 years of profits into one-tenth of the time represents a testament to the
virtues of creating a multifaceted holding company. It should be noted that I designed Biglari
Holdings to fit my skill set as an entrepreneur and investor. Each building block of the Biglari
2
Holdings’ architecture was guided by the economic objective of maximizing per-share intrinsic
value.1 Despite its advantages, we can further assert that our highly unusual system would not
necessarily make sense for other entrepreneurs.
Our structure provides us with a far more flexible instrument than do most other forms of
public corporations. By way of illustration, most corporations reinvest earnings within their industry,
whereas we postulate that just because we generate profits, for example, in our restaurant business, it
does not mean we are required to reinvest the money there. We send cash unneeded at the subsidiary
level to the parent company in order to increase our ownership in other businesses. Furthermore, we
are not limited to business ownership in its entirety. We venture into wider channels. Whereas our
preference is total business ownership, the stock market offers a wider selection of fractional
business ownership, in which we usually obtain more value than the price paid. The latitude in
surveying a wide investment universe, comparing one opportunity against another, has proven to be
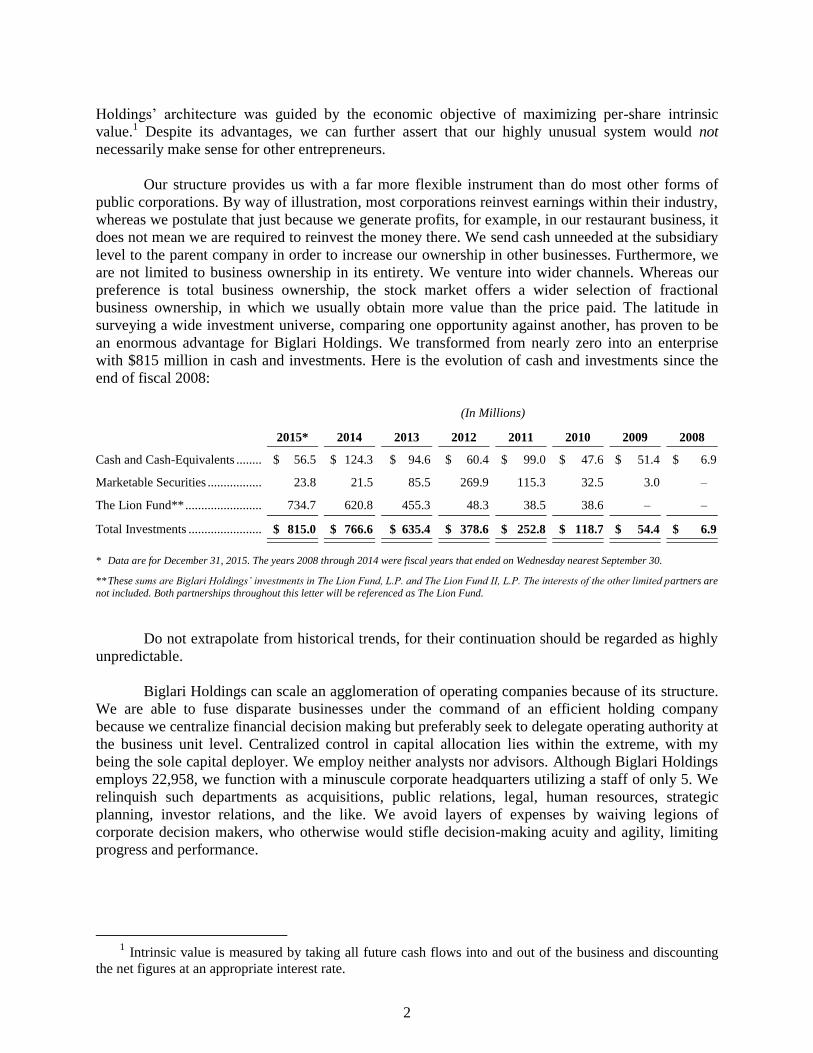
an enormous advantage for Biglari Holdings. We transformed from nearly zero into an enterprise
with $815 million in cash and investments. Here is the evolution of cash and investments since the
end of fiscal 2008:
(In Millions)
2015* 2014 2013
2012
2011
2010
2009
2008
Cash and Cash-Equivalents ........ $ 56.5 $ 124.3 $ 94.6 $ 60.4 $ 99.0 $ 47.6 $ 51.4 $ 6.9
Marketable Securities ................. 23.8 21.5 85.5 269.9 115.3 32.5 3.0 –
The Lion Fund** ........................ 734.7 620.8 455.3 48.3 38.5 38.6 – –
Total Investments ....................... $ 815.0 $ 766.6
$ 635.4 $ 378.6 $ 252.8 $ 118.7 $ 54.4 $ 6.9
* Data are for December 31, 2015. The years 2008 through 2014 were fiscal years that ended on Wednesday nearest September 30.
** These sums are Biglari Holdings’ investments in The Lion Fund, L.P. and The Lion Fund II, L.P. The interests of the other limited partners are
not included. Both partnerships throughout this letter will be referenced as The Lion Fund.
Do not extrapolate from historical trends, for their continuation should be regarded as highly
unpredictable.
Biglari Holdings can scale an agglomeration of operating companies because of its structure.
We are able to fuse disparate businesses under the command of an efficient holding company
because we centralize financial decision making but preferably seek to delegate operating authority at
the business unit level. Centralized control in capital allocation lies within the extreme, with my
being the sole capital deployer. We employ neither analysts nor advisors. Although Biglari Holdings
employs 22,958, we function with a minuscule corporate headquarters utilizing a staff of only 5. We
relinquish such departments as acquisitions, public relations, legal, human resources, strategic
planning, investor relations, and the like. We avoid layers of expenses by waiving legions of
corporate decision makers, who otherwise would stifle decision-making acuity and agility, limiting
progress and performance.
1 Intrinsic value is measured by taking all future cash flows into and out of the business and discounting
the net figures at an appropriate interest rate.
3
Henry Ford reportedly said, “You can’t build a reputation on what you are going to do.”
Evidence of our increasing reputational capital is our acquisition of First Guard Insurance Company,
which has demonstrated that we are a distinct type of buyer, one who values non-integration and
permanency. In stark contrast, strategic buyers will usually integrate the acquiree’s operations into
their own, and private equity firms, exit driven, will very likely weaken the acquiree’s balance sheet.
When sellers deeply care about their business and not exclusively about the price, we offer a superior
alternative. We view Biglari Holdings as a museum of businesses housing a collection of excellent
enterprises.
One extraordinary entrepreneur who favored our idiosyncrasies was Edmund B. Campbell,
III, founder of First Guard. Over the years Ed had been approached but had refused a number of
strategic and financial buyers because of his concern that such acquirors would be disruptive for the
business and its employees. But, alternatively, our concept had great appeal. After all, we are not
transient holders of businesses; rather, we offer a permanent residence for highly prized creations,
thereby allowing and desiring the seller to continue running their business with great autonomy. First
Guard is an ideal purchase — exceptionally well managed with uncommonly strong economics and
appropriately priced — representing the blueprint for future additions into our collection of
businesses.
When we purchased First Guard in March 2014, Ed received all cash for his 100% interest.
Still, he has continued to run his business for Biglari Holdings with a level of zeal as if his ownership
had never changed hands. This outcome is testimony to Ed’s character. He has no financial need to
remain involved with Biglari Holdings, but he remains motivated by the thrill of achievement. As I
will discuss later in the letter, the benefit of our ownership structure has allowed Ed and his team to
attain results that exceed previously superb performances.
We expect other gifted individuals to join Biglari Holdings’ family of companies. The
commitments we make to sellers — such as providing a permanent home for their businesses — will
endure. With my controlling position in the Biglari Holdings stock, we can promise sellers there will
be no change in control. Our proposition engenders advantages vis-à-vis acquisitive competitors
unable or unwilling to make the same pledges. As a corollary, there will be no spinoffs of holdings
such as First Guard. We are led by our own judgment and inclination, not by the unwise and
unwanted opinions of pundits.
Your company has been created on a solid foundation from which we continue to build a
powerful business. Our operating and capital deployment decisions are driven by their long-term
economic consequences, measured by advancement in per-share intrinsic value. The combination of
cash generated by operating subsidiaries along with my capital allocation work will stoke our
corporate performance, which according to our criterion must outdo our benchmark, the S&P 500
Index. Over the last seven years, namely, since present management has been in control, we believe
Biglari Holdings’ gain in per-share intrinsic value has far outstripped the S&P.
Phil Cooley, Vice Chairman of Biglari Holdings, and I evaluate Biglari Holdings’ economic
performance through a multiplicity of substantive dimensions. However, two components —
investments and operating businesses — are extremely critical in assessing the company’s progress.
We will present the dual segments as if Biglari Holdings were split into two parts.
4
Investments
By the end of calendar 2015, total investments (cash, marketable securities, and Biglari
Holdings’ investments in The Lion Fund) amounted to $815 million. From September 24, 2008
through December 31, 2015, Biglari Holdings’ investments have climbed by $808.1 million.
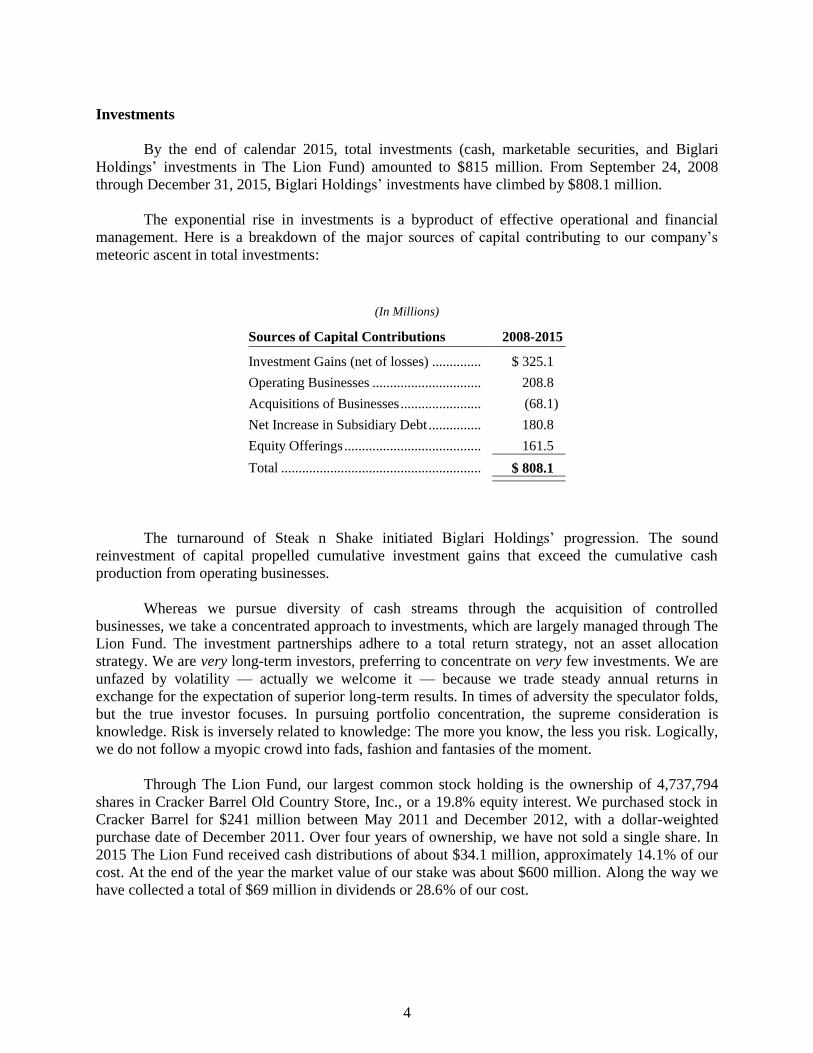
The exponential rise in investments is a byproduct of effective operational and financial
management. Here is a breakdown of the major sources of capital contributing to our company’s
meteoric ascent in total investments:
(In Millions)
Sources of Capital Contributions 2008-2015
Investment Gains (net of losses) ..............
$ 325.1
Operating Businesses ............................... 208.8
Acquisitions of Businesses ....................... (68.1)
Net Increase in Subsidiary Debt ............... 180.8
Equity Offerings ....................................... 161.5
Total ......................................................... $ 808.1
The turnaround of Steak n Shake initiated Biglari Holdings’ progression. The sound
reinvestment of capital propelled cumulative investment gains that exceed the cumulative cash
production from operating businesses.
Whereas we pursue diversity of cash streams through the acquisition of controlled
businesses, we take a concentrated approach to investments, which are largely managed through The
Lion Fund. The investment partnerships adhere to a total return strategy, not an asset allocation
strategy. We are very long-term investors, preferring to concentrate on very few investments. We are
unfazed by volatility — actually we welcome it — because we trade steady annual returns in
exchange for the expectation of superior long-term results. In times of adversity the speculator folds,
but the true investor focuses. In pursuing portfolio concentration, the supreme consideration is
knowledge. Risk is inversely related to knowledge: The more you know, the less you risk. Logically,
we do not follow a myopic crowd into fads, fashion and fantasies of the moment.
Through The Lion Fund, our largest common stock holding is the ownership of 4,737,794
shares in Cracker Barrel Old Country Store, Inc., or a 19.8% equity interest. We purchased stock in
Cracker Barrel for $241 million between May 2011 and December 2012, with a dollar-weighted
purchase date of December 2011. Over four years of ownership, we have not sold a single share. In
2015 The Lion Fund received cash distributions of about $34.1 million, approximately 14.1% of our
cost. At the end of the year the market value of our stake was about $600 million. Along the way we
have collected a total of $69 million in dividends or 28.6% of our cost.

5
Except for regulatory requirements, we will not share our thoughts, discuss our intentions, or
telegraph our investment ideas. We connect silence with strength, for a stealth approach benefits
shareholders. Our trade secrets are valuable; sharing them can diminish the value of our business by
enabling coattail riders to benefit at our shareholders’ expense. The Lion Fund is a private investment
partnership whose activities will and should remain private.
I started The Lion Fund in 2000 with a simple pay-for-performance arrangement, one
continuing to this day. As a limited partner, Biglari Holdings pays only a contingent fee — one-
quarter of the profits over 6% — to the general partner. The division of profits between limited
partners and the general partner is predicated on the limited partners first making money, before the
general partner shares in the excess. In other words, once Biglari Holdings earns a 6% return, it then
retains 75% of the profits.
Our incentive system differs from that of most investment managers, whose compensation is
tied to the level of assets under management. Regardless of whether an investor makes or loses
money, the investment manager is guaranteed significant income. A typical manager’s incentive is to
earn a return on his capital, rather than a return on his investors’ capital. In addition, a hedge fund
manager may charge both a large management fee, 2% of assets, plus a significant contingent
payment, 20% of profits — and usually absent a minimum hurdle rate. Our arrangement, in contrast,
espouses a genuine partnership ethos.
Biglari Holdings has a $734.7 million investment in The Lion Fund partnerships. The net
unrealized appreciation from the securities in the partnerships is $303.4 million. As is evident in
Biglari Holdings’ financial statements, we would owe taxes of $116 million if the partnerships
liquidated their holdings at year-end values. Therefore, Biglari Holdings’ investment in the
partnerships arrives before accounting for the deferred income taxes on unrealized gains. The
liability, we regard, is tantamount to an interest-free loan from the government for the company’s
benefit.
Operating Businesses
We have four major controlled businesses, each 100%-owned: Steak n Shake, Western
Sizzlin, First Guard, and Maxim. When we started with Steak n Shake in 2008, it became the engine
in Biglari Holdings’ machine, powering expansion into other businesses and investments. We will
continue to construct Biglari Holdings one acquisition at a time.
Because we are driven by intrinsic value, not by an income statement, in our view our
reported earnings do not properly represent a meaningful measure of our economic progress.
Nevertheless, as a first step in evaluating Biglari Holdings’ performance, the following table
delineates an unconventional breakdown of our earnings in a form Phil and I find more useful than
the conventional one in our consolidated statements.

6
(In 000’s)
2015 2014
Operating Earnings:
Steak n Shake ........................................................ $ 39,749 $ 27,205
Western Sizzlin ..................................................... 1,849 1,830
First Guard ........................................................... 3,529 2,367
Maxim .................................................................. (18,105) (21,479)
Corporate and Other ............................................. (13,158) (6,564)
Operating Earnings Before Interest and Taxes ......... 13,864 3,359
Interest Expense ........................................................ 11,939 11,930
Income Taxes ............................................................ (400) (3,180)
Net Operating Earnings ............................................ 2,325 (5,391)
The Lion Fund (net of taxes) .................................... (18,168) 106,296
Total Earnings .......................................................... $ (15,843) $ 100,905
Notes: The 2015 and 2014 data are presented for calendar years. The 2014 fiscal year has been restated as calendar for comparability. The company adopted a calendar year, switching from one ending on the Wednesday nearest September 30 to one
ending on December 31.
Our reported earnings are materially affected by the volatility in the carrying value of The
Lion Fund. We are indifferent about the variability in reported earnings triggered by the accounting
of the investment partnerships. We simply separate changes in the partnerships’ values from those in
operating businesses when we report Biglari Holdings’ earnings. In addition, Phil and I evaluate our
equity holdings within The Lion Fund based on their underlying operating results, not on their short-
term changes in market price. Over the long run, no better barometer of value creation exists than
gain in stock price. Intrinsic value and stock price often diverge — sometimes substantially and quite
lengthily — but in the long run they converge at approximately the same destination.
The net operating earnings of $2.3 million in 2015 versus a loss of $5.4 million in 2014
provide an incomplete assessment. During the last several years we have taken actions that reduce
profit but with the intention of maximizing the present value of future cash flows. Each operating
subsidiary is managed through the idea of producing cash returns to advance intrinsic value.
However, the subsidiaries are on differing stages of the business life cycle: We have been cash-
cowing Western for years, whereas Maxim requires our initially putting the milk into the cow. The
logical approach for shareholders to appraise Biglari Holdings is through reviewing the performance
of each operating subsidiary.
Restaurant Operations
Our restaurant operations consist of Steak n Shake and Western Sizzlin. The business models
of each differ, with Steak n Shake primarily operating restaurants, sporting a total of 561 locations, of
which 417 are company operated. Western, on the other hand, is mainly engaged in franchising
restaurants, with 70 units — all but 4 are franchisee run.
7
In 2015, Western sent Biglari Holdings $3.1 million of cash, a healthy improvement over
2014. The Western team did an outstanding job by wringing out more cash. Biglari Holdings
purchased Western in March 2010 for a net purchase price of $21.7 million. Since then, an aggregate
of $16.3 million has been paid to Biglari Holdings, through which we have redeployed the capital
into more gainful opportunities. Additionally, the Western acquisition arrived with marketable
securities of $2 million. The acquisition also included undeveloped real estate purchased in 2007 for
$3.8 million, which has more than doubled in value.
* * *
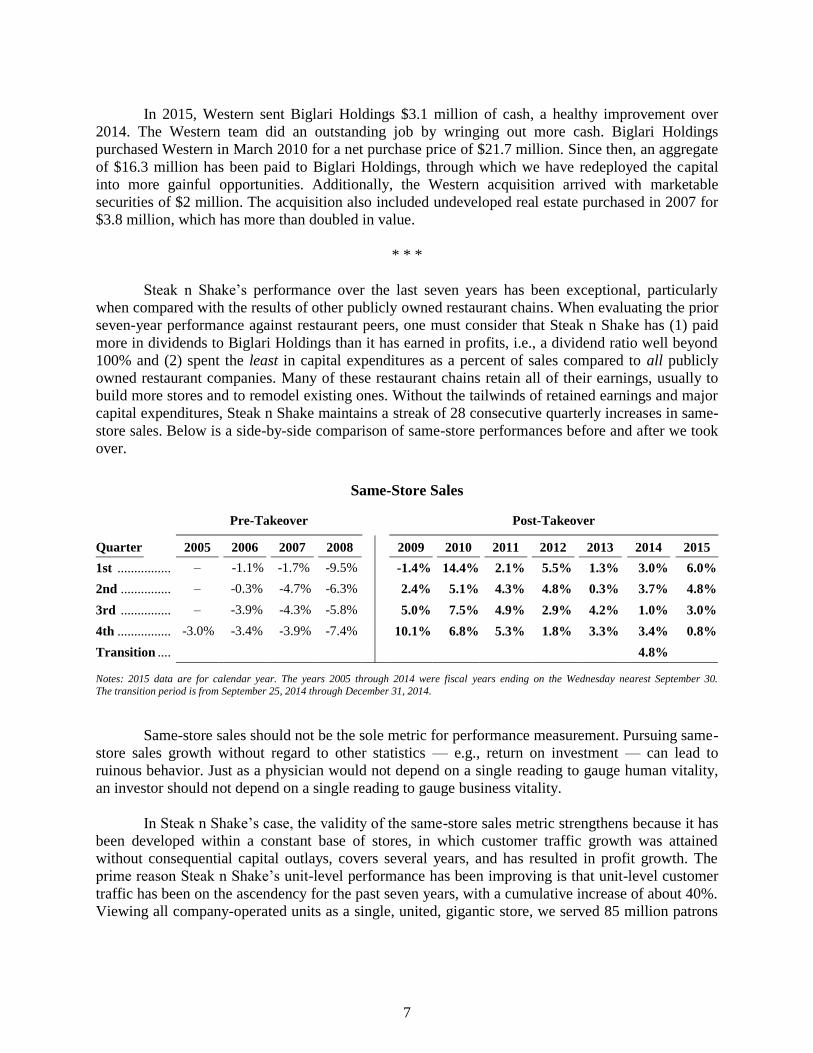
Steak n Shake’s performance over the last seven years has been exceptional, particularly
when compared with the results of other publicly owned restaurant chains. When evaluating the prior
seven-year performance against restaurant peers, one must consider that Steak n Shake has (1) paid
more in dividends to Biglari Holdings than it has earned in profits, i.e., a dividend ratio well beyond
100% and (2) spent the least in capital expenditures as a percent of sales compared to all publicly
owned restaurant companies. Many of these restaurant chains retain all of their earnings, usually to
build more stores and to remodel existing ones. Without the tailwinds of retained earnings and major
capital expenditures, Steak n Shake maintains a streak of 28 consecutive quarterly increases in same-
store sales. Below is a side-by-side comparison of same-store performances before and after we took
over.
Same-Store Sales
Pre-Takeover Post-Takeover
Quarter 2005 2006 2007 2008 2009 2010 2011 2012 2013 2014 2015
1st ................ – -1.1% -1.7% -9.5% -1.4% 14.4% 2.1% 5.5% 1.3% 3.0% 6.0%
2nd ............... – -0.3% -4.7% -6.3% 2.4% 5.1% 4.3% 4.8% 0.3% 3.7% 4.8%
3rd ............... – -3.9% -4.3% -5.8% 5.0% 7.5% 4.9% 2.9% 4.2% 1.0% 3.0%
4th ................ -3.0% -3.4% -3.9% -7.4% 10.1% 6.8% 5.3% 1.8% 3.3% 3.4% 0.8%
Transition .... 4.8%
Notes: 2015 data are for calendar year. The years 2005 through 2014 were fiscal years ending on the Wednesday nearest September 30.
The transition period is from September 25, 2014 through December 31, 2014.
Same-store sales should not be the sole metric for performance measurement. Pursuing same-
store sales growth without regard to other statistics — e.g., return on investment — can lead to
ruinous behavior. Just as a physician would not depend on a single reading to gauge human vitality,
an investor should not depend on a single reading to gauge business vitality.
In Steak n Shake’s case, the validity of the same-store sales metric strengthens because it has
been developed within a constant base of stores, in which customer traffic growth was attained
without consequential capital outlays, covers several years, and has resulted in profit growth. The
prime reason Steak n Shake’s unit-level performance has been improving is that unit-level customer
traffic has been on the ascendency for the past seven years, with a cumulative increase of about 40%.
Viewing all company-operated units as a single, united, gigantic store, we served 85 million patrons

8
in 2008, yet in 2015 we served 118 million customers. In other words, 33 million additional
customers (some of whom were repeats) went through the same four walls in 2015, compared to
those in 2008.
It is a truism that gaining more customers can be accomplished by opening more units — not
necessarily a managerial accomplishment. The limiting factor is capital. Mastery in the trade is
to profitably gain more customers through existing stores — and leveraging fixed restaurant-level
costs — an exceedingly more difficult but also a far more rewarding concept. The swing in the
pendulum from losses in 2008 to profits in subsequent years is attributable to our bolstering the
stores in our domain to become more productive.
Here is a review of Steak n Shake’s results since 2008:
(Dollars in 000’s)
Net Revenue
Operating
Earnings
Number of
Customers*
Number of
Company Stores
at Year-End
Operating
Earnings
Per Store
2008 ........................... $ 610,061 $ (30,754) 85,000,000 423 $ (72.7)
2009 (53 weeks) ......... 628,726 11,473 91,000,000 412 27.8
2010 ........................... 662,891 38,316 101,000,000 412 93.0
2011 ........................... 689,325 41,247 105,000,000 413 99.9
2012 ........................... 718,010 45,622 110,000,000 414 110.2
2013 ........................... 737,090 28,376 112,000,000 415 68.4
2014** ....................... 776,486 27,205 115,000,000 417 65.2
2015** ....................... 805,771 39,749 118,000,000 417 95.3
* Customer count is only for company-operated units.
** Data are for calendar years. The 2014 fiscal year has been restated as calendar for comparability. The years 2008 through 2013 were fiscal
years ending on the Wednesday nearest September 30.
Phil and I believe that in 2015 Steak n Shake’s intrinsic value increased moderately even
though its operating earnings augmented by 46%. Steak n Shake’s earnings before interest and taxes
were $39.7 million, up from $27.2 million in the preceding year. For years we voluntarily have been
trading near-term earnings to develop higher long-term cash flows. In 2015, we benefited from
declining commodity prices, and we began to be rewarded on our prior investments because (1)
aggressive spending to develop the franchising business leveled off and (2) years of strengthening
our long-term competitive position boosted profits. We expect the momentum to continue in 2016,
further advancing operating earnings. Notwithstanding, we will continue to allocate capital on the
expectation of creating consequential, greater dollar value for each dollar spent.
Sir Isaiah Berlin, in his book The Hedgehog and the Fox, quotes the great Greek poet
Archilochus, “The fox knows many things, but the hedgehog knows one big thing.” Steak n Shake
can be classified as pursuing a hedgehog strategy. We are disciplined not to diversify the menu but to
present a simple menu centered on burgers/fries and shakes/drinks that comprise nearly 80% of our
sales. Over the years we have eliminated a number of menu items, but have elevated quality and
variety around core products. After all, too much complexity undermines simplicity along with the
benefits of operational efficiencies. The underlying reasons patrons wanted Steak n Shake in the

9
1930s — savory steakburgers and hand-dipped milkshakes — have essentially remained unchanged.
Steak n Shake intends to lead and dominate the premium burger and milkshake segment of the
restaurant industry. Recalling that aphoristic parable, the winner in our business is the hedgehog. We
are quite certain the hedgehog, and even the fox, would enjoy our recently introduced Nutella
Milkshake.
We operate Steak n Shake on a basic principle: If we take care of our customers, our
customers will take care of us. Our formula is simple: Provide the highest quality burgers and shakes
at the lowest possible profit per customer from an ever-increasing number of customers. Our pricing
philosophy therefore is to widen not our profit margin but our value proposition. By minimizing
profit per customer, we gain loyalty in an industry where customer loyalty is exceedingly difficult to
attain. A higher number of patrons translates into higher aggregate profits in the long term.
Our discipline using tight expense controls, minutely weeding out waste, enables us to
achieve sustainable cost advantages. As we squeeze out costs, we pass most of the savings on to the
customer. To maintain our success, we must persist within a culture of thrift, quickly correcting
inefficiencies. Steak n Shake is a customer-focused organization — thanks to the relentless
dedication, indeed the passion, of our more than 22,000 associates.
The traditional side of the business, company-operated units, has produced torrents of cash.
In fact, over the last seven years Steak n Shake has distributed more than $330 million of capital to
Biglari Holdings, which has powered the parent company’s growth. Steak n Shake itself has an
ambitious plan to become global but without major requirements for fixed asset investments. To
achieve growth without major capital outlays we leverage the Steak n Shake brand to capitalize on a
franchise-based model, a noncapital-intensive strategy that generates high-return, annuity-like cash
flows. In the emerging side of the business, franchising, the necessity for major capital funding to
expand the brand is borne by third parties. We mainly collect royalties. Our fundamental idea is to
produce long-term cash flows yet concomitantly reduce operating risks.
Since 2010 we have invested substantial sums to build infrastructure and system-wide
standards for the franchising business. After five years of investments, we now have reached scale
and expect that for 2016 the franchising segment of our business will generate more cash than it
consumes. The franchise business had resembled a start-up, necessitating investments that advanced
intrinsic value but produced losses under conventional accounting. Because of the upfront costs,
public companies desiring to enlarge their near-term accounting earnings would not have followed
similar initiatives. We made the investments necessary to channel our growth. Now gradually we
expect to fill these rivers of ever-increasing cash.
Displayed below are the number of franchise units and the revenues derived from them:
(Dollars in 000’s)
Number of
Franchise Units
Franchise
Revenue
2010 .................................. 71 $ 4,205
2015 .................................. 144 13,783
Overall Gain 73 $ 9,578

10
Although Steak n Shake was founded in 1934 in Normal, Illinois, the first franchised unit
opened in 1939. From 1939 to 2010 Steak n Shake grew by an average of one franchised unit per
year. In 2010 we made franchising the cornerstone of our growth strategy. Over the last five years,
we have added more franchised units — 73 to be exact — than in the preceding 71 years.
Our prospects to enlarge both domestic and international franchising are better than ever. We
have designed and developed our concepts in a modular way, not possessing an inflexible format but
adapting to various venues. Because of the modularity of Steak n Shake’s design, we are now
growing in universities, casinos, airports, gas stations, shopping centers, and other arenas.
Internationally, we have two company-operated units along the Mediterranean Sea: one on
the island of Ibiza, Spain, and the other in Cannes, France. Both units are solidly profitable and have
served as successful, powerful counter-service-only models for prospective franchisees. We now
have a total of 10 units internationally, with the most recent openings in Italy: one in Verona and the
other in Milan.
First Guard Insurance Company
First Guard — a direct underwriter of commercial trucking insurance — is a low-cost
operator, one with extraordinary efficiency, engendering a sustainable competitive advantage. First
Guard was designed with an exceptional business model — no agent between the insurer and the
insured — whose architect Ed Campbell, III, year-in and year-out has achieved performance par
excellence in an industry not known for exceptional economics.
We purchased First Guard and its affiliated agency on March 19, 2014. Shown below are the
results presented for full years, as if we had owned the company throughout 2014 rather than from
the date of acquisition:
(Dollars in 000’s)
Net Written
Premium
Underwriting
Profit
Combined
Ratio*
2014 .............................. $ 10,757 $ 2,293 78.7
2015 .............................. 16,719 3,357 79.9
*The combined ratio represents losses incurred plus expenses as compared to revenue from premiums.A combined ratio beneath 100 percent denotes an underwriting profit whereas a ratio above 100 percent presents
a loss.
We have no volume goal, but we do maintain an underwriting profit objective.
Notwithstanding, in 2015 First Guard set a new volume record while generating excellent
underwriting earnings. One-year underwriting profitability of 79.9% is stellar, but the company’s 19-
year underwriting record of 79.1% is absolutely stunning. Profitable underwriting is an oft-stated
objective but not an oft-achieved objective. However, losses are alien to Ed and his team: First Guard
has achieved an underwriting profit every year since its founding in 1997. In 2015, First Guard
earned $3.5 million pre-tax, an increase of 35.3% over the prior year.

11
The parent company’s exceptional financial strength has been an operational asset for First
Guard. Biglari Holdings has the ability — deep capital strength — and the willingness to withstand
volatility so long as the decisions carry with it the prospects of higher long-term earnings. As a
consequence, we now retain most of our originated premium volume, whereas previously we were
ceding a significant portion of our business through quota-share contracts with our reinsurer.
First Guard is a brilliant gem of a company because its founder is a brilliant manager. Ed has
developed a team that is first rate: talented, seasoned and profit-minded. That, for sure, gives me the
confidence to expect First Guard to grow larger and more profitable under the Biglari Holdings’
aegis.
Maxim Inc.
We purchased a media business, Maxim — knowingly stepping into a maelstrom — with the
expectation of incurring substantial short-term losses, the bulk of which we view as investments. The
purchase of a troubled company with a core business, print publishing, in an industry with
deteriorating economics is not for the faint of heart. If the tides are too tough, the abilities of the
swimmer become irrelevant. With that in mind, we purchased Maxim for its brand, intending to
reposition it and transform its business model. The magazine developed the Maxim brand, an
underexploited franchise we are utilizing to build cash-generating businesses, especially licensing
royalties related to consumer products, services, and events.
To implement our underlying concept, substantial investments have been necessary, initially
to reposition Maxim as an inspirational and aspirational brand projecting style and sophistication. We
have vastly improved the quality of the Maxim brand, which has resulted in our appealing to a more
affluent audience. Maxim as a men’s luxury lifestyle brand is resonating.
Our operating philosophy is to view all expenses as variable. Thus, we have made radical
adjustments in operations, both in print and in digital, to reduce the fixed costs inherent in the
business. We have formed a talented team who think creatively and who are also cost-conscious.
Since our acquisition, the company has reported an aggregate pre-tax loss of $39 million.
Because of the tax efficiency emanating from the holding company — created by the significant
taxable income generated by our other subsidiaries — the after-tax impact has been approximately
$25 million. In last year’s annual report I stated: “Our expectation is for Maxim to become profitable
during 2016. Nevertheless, our pathway to profit, we anticipate, will be highly irregular.” Although
current trends are not to be envied, we believe Maxim will become profitable in late 2016. Do note
that our aim is not to create earnings, but to create wealth. Consequently, wealth would be created
only if the discounted value of future cash flows exceeds the cash outlay in the early years. We have
taken the risk on the belief that the probability for gain in value more than justifies the risk
of loss.
Shareholder Communications
My communications with shareholders are generally limited to the annual report and the
annual meeting. We do not provide earnings guidance, nor do we hold quarterly conference calls
because neither activity would be consistent with managing our entrepreneurial enterprise. On the
other hand, we wish to provide all shareholders simultaneously with the same information. One-on-
one meetings are neither productive nor practicable.
12
My aim in this report is to impart as much about our company as reasonable and necessary to
supply the information needed to arrive at your own estimate of the intrinsic value of the company.
Past Chairman’s Letters are also important in that they help you gain more knowledge of the
business. They can also assist in your evaluating our prior expectations against results. Because
Biglari Holdings has evolved over the years, it is quite different in its diversity of assets from its
former self. These letters can be easily accessed on our website, biglariholdings.com.
To keep abreast of the company, we will then issue press releases concerning 2016 quarterly
results after the market closes on May 6, August 5, and November 4. The 2016 annual report will be
posted on our website on Saturday, February 25, 2017.
Our annual meeting will be held at 1:00 pm on Thursday, April 7, 2016 in New York City at
the St. Regis Hotel. The meeting is just for our owners; thus, to attend, you must own shares and
show proof thereof. The bulk of the gathering is a question-and-answer session that usually lasts
about five hours, covering myriad topics on shareholders’ minds. Phil and I look forward to spending
the time in answering your questions. We find the annual meeting to be an effective channel to
communicate with you.
* * *
We readily acknowledge that the ethos and entrepreneurial style of Biglari Holdings are not
for everyone. In a world filled with hyper-orthodoxy, Biglari Holdings represents an oasis of
unconventionality. We follow our own individualistic ideas and ideals rather than find refuge in
superficial conventions and conformity. Consequently, we seek owners to join our journey who find
our policies agreeable and who intend to be invested for decades to come.
Sardar Biglari
Chairman of the Board
February 18, 2016

UNITED STATES
SECURITIES AND EXCHANGE COMMISSION
Washington, D.C. 20549
FORM 10-K ANNUAL REPORT PURSUANT TO SECTION 13 OR 15(d) OF THE SECURITIES EXCHANGE
ACT OF 1934
For the fiscal year ended December 31, 2015
or
TRANSITION REPORT PURSUANT TO SECTION 13 OR 15(d) OF THE SECURITIES EXCHANGE
ACT OF 1934
For the transition period from ____ to ____
Commission file number 0-8445
BIGLARI HOLDINGS INC. (Exact name of registrant as specified in its charter)
INDIANA 37-0684070
(State or other jurisdiction of incorporation) (I.R.S. Employer Identification No.)
17802 IH 10 West, Suite 400
San Antonio, Texas
78257 (Address of principal executive offices) (Zip Code)
(210) 344-3400 Registrant’s telephone number, including area code
Securities registered pursuant to Section 12(b) of the Act:
Title of each class Name of each exchange on which registered Common Stock, stated value $.50 per share New York Stock Exchange
Securities registered pursuant to Section 12(g) of the Act:
NONE
Indicate by check mark if the registrant is a well-known seasoned issuer, as defined in Rule 405 of the Securities Act. Yes No
Indicate by check mark if the registrant is not required to file reports pursuant to Section 13 or Section 15(d) of the Act.
Indicate by check mark whether the registrant (1) has filed all reports required to be filed by Section 13 or 15(d) of the Securities Exchange Act of 1934 during
the preceding 12 months (or for such shorter period that the registrant was required to file such reports), and (2) has been subject to such filing requirements for the past 90 days. Yes
Indicate by check mark whether the registrant has submitted electronically and posted on its corporate Website, if any, every Interactive Data File required to be
submitted and posted pursuant to Rule 405 of Regulation S-T (Section 232.405 of this chapter) during the preceding 12 months (or for such shorter period that the registrant was required to submit and post such files).Yes No
Indicate by check mark if disclosure of delinquent filers pursuant to Item 405 of Regulation S-K is not contained herein, and will not be contained, to the best of
registrant’s knowledge, in definitive proxy or information statements incorporated by reference in Part III of this Form 10-K or any amendment to this Form 10-
K.
Indicate by check mark whether the registrant is a large accelerated filer, an accelerated filer, a non-accelerated filer, or a smaller reporting company. See the
definitions of “large accelerated filer,” “accelerated filer,” and “smaller reporting company” in Rule 12b-2 of the Exchange Act. (Check one):
Large accelerated filer Accelerated filer Non-accelerated filer Smaller reporting company
Indicate by check mark whether the registrant is a shell company (as defined in Rule 12b-2 of the Exchange Act).Yes No
The aggregate market value of the voting and non-voting common stock held by non-affiliates of the registrant as of June 30, 2015 was approximately $686,120,384.
As of February 15, 2016, 2,066,864 shares of the registrant’s Common Stock were outstanding.
DOCUMENTS INCORPORATED BY REFERENCE
Portions of the Registrant’s definitive Proxy Statement to be filed for its 2016 Annual Meeting of Shareholders are incorporated by reference into Part III of this
Form 10-K.

Table of Contents
Page No.
Part I
Item 1. Business ........................................................................................................................................................... 1
Item 1A. Risk Factors .................................................................................................................................................... 4
Item 1B. Unresolved Staff Comments .......................................................................................................................... 9
Item 2. Properties ........................................................................................................................................................ 10
Item 3. Legal Proceedings ........................................................................................................................................... 11
Item 4. Mine Safety Disclosures .................................................................................................................................. 11
Part II
Item 5. Market for Registrant’s Common Equity, Related Stockholder Matters and Issuer Purchases of
Equity Securities .............................................................................................................................................
12
Item 6. Selected Financial Data .................................................................................................................................. 14
Item 7. Management’s Discussion and Analysis of Financial Condition and Results of Operations ................... 15
Item 7A. Quantitative and Qualitative Disclosures about Market Risk .................................................................... 30
Item 8. Financial Statements and Supplementary Data ........................................................................................... 31
Consolidated Statements of Earnings ............................................................................................................... 34
Consolidated Statements of Comprehensive Income ....................................................................................... 35
Consolidated Balance Sheets ............................................................................................................................ 36
Consolidated Statements of Cash Flows .......................................................................................................... 37
Consolidated Statements of Changes in Shareholders’ Equity ......................................................................... 38
Notes to Consolidated Financial Statements .................................................................................................... 39
Item 9. Changes in and Disagreements with Accountants on Accounting and Financial Disclosure .................. 70
Item 9A. Controls and Procedures ............................................................................................................................... 70
Item 9B. Other Information .......................................................................................................................................... 70
Part III
Item 10. Directors, Executive Officers and Corporate Governance ......................................................................... 71
Item 11. Executive Compensation ................................................................................................................................ 71
Item 12. Security Ownership of Certain Beneficial Owners and Management and Related Stockholder
Matters .........................................................................................................................................................
71
Item 13. Certain Relationships and Related Transactions, and Director Independence ........................................ 71
Item 14. Principal Accountant Fees and Services ....................................................................................................... 71
Part IV
Item 15. Exhibits and Financial Statement Schedules ............................................................................................... 72
Signatures ........................................................................................................................................................................... 73
Exhibit Index ...................................................................................................................................................................... 80
1
Part I
Item 1.
Business
Biglari Holdings Inc. is a holding company owning subsidiaries engaged in a number of diverse business activities, including
media, property and casualty insurance, and restaurants. The Company’s largest operating subsidiaries are involved in the
franchising and operating of restaurants. Biglari Holdings is founded and led by Sardar Biglari, Chairman and Chief Executive
Officer of Biglari Holdings and its major operating subsidiaries. The Company’s long-term objective is to maximize per-share
intrinsic value. All major operating, investment, and capital allocation decisions are made for the Company and its subsidiaries
by Mr. Biglari.
In 2014, the Company’s Board of Directors approved a change in the Company’s fiscal year-end moving from a 52 or 53 week
fiscal year ending on the last Wednesday in September to a calendar year ending on December 31 of each year. This form 10-K
includes an audited statement of earnings, statement of comprehensive income, statement of cash flows and statement of changes
in shareholders’ equity for the year ended December 31, 2015, transition period for September 25, 2014 to December 31, 2014
(the “2014 transition period”) and fiscal years ended September 24, 2014 and September 25, 2013, and an audited balance sheet
as of December 31, 2015 and 2014. Fiscal years 2014 and 2013 each contained 52 weeks. For comparative purposes, an
unaudited statement of earnings, statement of comprehensive income and statement of cash flows have been included for
September 26, 2013 to December 31, 2013 (the “2013 transition period”). The comparative transition period has not been
audited and is derived from the books and records of the Company. In the opinion of management, the comparative transition
period reflects all adjustments necessary to present the financial position and results of operations of the Company in accordance
with generally accepted accounting principles.
The Lion Fund II, L.P., a private investment partnership of which Mr. Biglari controls the general partner, purchased 24,000
shares of Biglari Holdings common stock from January 4, 2016 through February 3, 2016. As a result of these purchases, Mr.
Biglari’s beneficial ownership of the outstanding common stock is approximately 50.6%.
Restaurant Operations
The Company’s restaurant operations’ activities are conducted through two restaurant concepts operated by subsidiaries Steak n
Shake Inc. (“Steak n Shake”) and Western Sizzlin Corporation (“Western”). As of December 31, 2015, Steak n Shake operated
417 company-operated restaurants and 144 franchised units. Western operated 4 company-operated restaurants and 66 franchised
units.
Steak n Shake is engaged in the ownership, operation, and franchising of Steak n Shake restaurants. Founded in 1934 in Normal,
Illinois, Steak n Shake is a classic American brand serving premium burgers and milkshakes. Steak n Shake is headquartered in
Indianapolis, Indiana.
Western is engaged primarily in the franchising of restaurants. Founded in 1962 in Augusta, Georgia, Western offers signature
steak dishes as well as other classic American menu items. Western also operates other concepts, Great American Steak &
Buffet, and Wood Grill Buffet consisting of hot and cold food buffet style dining. Western is headquartered in Roanoke,
Virginia.
Operations
A typical restaurant’s management team consists of a general manager, a restaurant manager and other managers depending on
the operating complexity and sales volume of the restaurant. Each restaurant’s general manager has primary responsibility for the
day-to-day operations of his or her unit. Restaurant operations obtain food products and supplies from independent national
distributors. Purchases are centrally negotiated to ensure uniformity in product quality.
2
Franchising
Restaurant operations’ franchising program extends the brands to areas in which there are no current development plans for
Company stores. The expansion plans include seeking qualified new franchisees and expanding relationships with current
franchisees.
Restaurant operations typically seek franchisees with both the financial resources necessary to fund successful development and
significant experience in the restaurant/retail business. Both restaurant chains assist franchisees with the development and
ongoing operation of their restaurants. In addition, personnel assist franchisees with site selection, approve restaurant sites, and
provide prototype plans, construction support and specifications. Restaurant operations’ staff provides both on-site and off-site
instruction to franchised restaurant management and associates. Moreover, Steak n Shake franchised restaurants are required to
serve only approved menu items.
International
We have a corporate office in Monaco to support expansion of Steak n Shake in the Middle East and Europe. We have developed
an international organization with personnel in various functions to support international efforts. As of December 31, 2015 we
have two company-operated locations in Europe to promote the Steak n Shake brand to prospective franchisees. Similar to our
domestic franchise agreements, a typical international franchise development agreement provides the vehicle for payment of
development fees and franchise fees in addition to subsequent royalty fees based on the gross sales of each restaurant. As of
December 31, 2015 Steak n Shake operated eight franchise units in Europe and the Middle East.
Competition
The restaurant business is one of the most intensely competitive industries. As there are virtually no barriers to entry into the
restaurant business, competitors may include national, regional and local establishments. There may be established competitors
with financial and other resources that are greater than the Company’s restaurant operations capabilities. Restaurant businesses
compete on the basis of price, menu, food quality, location, personnel and customer service. The restaurant business is often
affected by changes in consumer tastes and by national, regional, and local economic conditions. The performance of individual
restaurants may be impacted by factors such as traffic patterns, demographic trends, severe weather conditions, and competing
restaurants. Additional factors that may adversely affect the restaurant industry include, but are not limited to, food and wage
inflation, safety, and food-borne illness.
Government regulations
The Company is subject to various global, federal, state and local laws affecting its restaurant operations. Each of the restaurants
must comply with licensing and regulation by a number of governmental authorities, which include health, sanitation, safety and
fire agencies in the jurisdiction in which the restaurant is located. In addition, each restaurant must comply with various laws
that regulate the franchisor/franchisee relationship, employment and pay practices and child labor laws. To date, none of the
Company’s restaurant operations have been materially adversely affected by such laws or been affected by any difficulty, delay
or failure to obtain required licenses or approvals.
Trademark and licenses
The name and reputation of Steak n Shake is a material asset and management protects it and other service marks through
appropriate registrations.

3
Insurance Business
Our insurance business is composed of First Guard Insurance Company and its agency, 1st Guard Corporation (collectively
“First Guard”), which we acquired on March 19, 2014. First Guard is a direct underwriter of commercial trucking insurance,
selling physical damage and nontrucking liability insurance to truckers. First Guard is headquartered in Venice, Florida.
First Guard competes for truck insurance with other companies. The trucking insurance business is highly competitive in the
areas of price and service. Vigorous competition is provided by large, well-capitalized companies and by small regional insurers.
First Guard’s insurance products are marketed primarily through direct response methods via the Internet or by telephone. First
Guard’s cost-efficient direct response marketing methods enable it to be a low-cost trucking insurer. First Guard uses its own
claim staff to manage claims. Seasonal variations in First Guard’s insurance business are not significant. However, extraordinary
weather conditions or other factors may have a significant effect upon the frequency or severity of claims.
The insurance business is stringently regulated by state insurance departments. First Guard operates under licenses issued by
various insurance authorities. Such supervision and regulation include matters relating to authorized lines of business, capital and
surplus requirements, licensing of insurers, investments, the filing of annual and other financial reports prepared on the basis of
Statutory Accounting Principles, the filing and form of actuarial reports, dividends, and a variety of other financial and non-
financial matters.
Media Business
Our media business is composed of Maxim. We acquired certain assets and liabilities of Maxim on February 27, 2014. Maxim’s
business lies principally in media and licensing. Maxim is headquartered in New York City, New York.
Publishing is a highly competitive business. The Company's magazines and related publishing products and services compete
with other mass media, including the Internet and many other leisure-time activities. Competition for advertising dollars is based
primarily on advertising rates, circulation levels, reader demographics, advertiser results, and sales team effectiveness.
Maxim products are marketed under various registered brand names, including, but not limited to, “MAXIM®” and “Maxim®”.
Investments
The Company and its subsidiaries have invested in The Lion Fund, L.P. and The Lion Fund II, L.P. (collectively, “the investment
partnerships”). The investment partnerships operate as private investment funds. As of December 31, 2015, the fair value of the
investments was $734.7 million. These investments are subject to a rolling five-year lock-up period under the terms of the
respective partnership agreements.
Employees The Company employs 22,958 persons.
Additional information with respect to Biglari Holdings’ businesses
Information related to our reportable segments may be found in Part II, Item 8 of this form 10-K.
Biglari Holdings maintains a website (www.biglariholdings.com) where its annual reports, press releases, interim shareholder
reports and links to its subsidiaries’ websites can be found. Biglari Holdings’ periodic reports filed with the Securities and
Exchange Commission (the “SEC”), which include form 10-K, form 10-Q, form 8-K and amendments thereto, may be accessed
by the public free of charge from the SEC and through Biglari Holdings’ website. In addition, corporate governance documents
such as Corporate Governance Guidelines, Code of Conduct, Governance, Compensation and Nominating Committee Charter
and Audit Committee Charter are posted on the Company’s website and are available without charge upon written request. The
Company’s website and the information contained therein or connected thereto are not intended to be incorporated into this
report on form 10-K.
4
Item 1A.
Risk Factors
Biglari Holdings and its subsidiaries (referred to herein as “we,” us,” “our,” or similar expressions) are subject to certain risks
and uncertainties in our business operations which are described below. The risks and uncertainties described below are not the
only risks we face. Additional risks and uncertainties not presently known or that are currently deemed immaterial may also
impair our business operations.
Risks relating to Biglari Holdings
We are dependent on our Chairman and CEO.
Our success depends on the services of Sardar Biglari, Chairman and Chief Executive Officer. All major operating, investment,
and capital allocation decisions are made for the Company and its subsidiaries by Mr. Biglari. If for any reason the services of
Mr. Biglari were to become unavailable, a material adverse effect on our business could occur. At that time, the Company may
owe significant amounts of money to Mr. Biglari pursuant to the terms of a license agreement. Taken as a whole, the liabilities
imposed by the license agreement connected to the loss of Mr. Biglari may materially impact the Company in an adverse
manner.
Sardar Biglari, our Chairman and CEO, exercises over 50% of the voting power of our outstanding shares of common stock,
enabling Mr. Biglari to exert control over matters requiring shareholder approval.
Sardar Biglari, Chairman and CEO, beneficially owns over 50% of our outstanding shares of common stock. Mr. Biglari thus has
the ability to control the outcome of matters submitted to our shareholders for approval, including the election of directors. In
addition, Mr. Biglari has the ability to control the management and affairs of the Company. This control position may conflict
with the interests of some or all of the Company’s other shareholders.
We may elect to be a controlled company.
Because Mr. Biglari beneficially owns more than 50% of the Company’s outstanding voting stock, we are considered a
“controlled company” pursuant to New York Stock Exchange rules. As a result, while we have not done so, we may elect not to
comply with the following corporate governance requirements of the New York Stock Exchange: (i) majority of independent
directors, (ii) fully independent nominating committee and (iii) fully independent compensation committee.
Our historical growth rate is not indicative of our future growth. When evaluating our historical growth and prospects for future growth, it is important to consider that while our business
philosophy has remained constant our mix of business has changed and will continue to change. Our dynamic business model
makes it difficult to assess our prospects for future growth. Restrictions on our access to capital described further below may
also adversely affect our ability to execute our plans for future growth.
Biglari Holdings’ access to capital is subject to restrictions that may adversely affect its ability to satisfy its cash requirements
or implement its growth strategy.
We are a holding company and are largely dependent upon dividends and other sources of funds from our subsidiaries in order to
meet our needs. Steak n Shake’s credit facility contains restrictions on its ability to pay dividends to Biglari Holdings. In
addition, the ability of our insurance subsidiaries to pay dividends to Biglari Holdings is regulated by state insurance laws, which
limit the amount of, and in certain circumstances may prohibit the payment of, cash dividends. Furthermore, as a result of our
substantial investments in The Lion Fund, L.P. and The Lion Fund II, L.P., investment partnerships controlled by Mr. Biglari,
our access to capital is restricted by the terms of their respective partnership agreements, as described more fully below. There is
also a high likelihood that we will make additional investments in these investment partnerships. Taken together, these
restrictions may result in our having insufficient funds to satisfy our cash requirements. As a result, we may need to look to
other sources of capital which may be more expensive or may not be available.
Competition.
Each of our operating businesses faces intense competitive pressure within the markets in which they operate. Competition may
arise domestically as well as internationally. While we manage our businesses with the objective of achieving long-term
sustainable growth by developing and strengthening competitive advantages, many factors, including market changes, may erode
or prevent the strengthening of competitive advantages. Accordingly, future operating results will depend to some degree on
whether our operating units are successful in protecting or enhancing their competitive advantages. If our operating businesses
are unsuccessful in these efforts, our periodic operating results may decline from current levels in the future. We also highlight
certain competitive risks in the sections below.
5
Unfavorable domestic and international economic, societal and political conditions could hurt our operating businesses. To the extent that the recovery from the economic recession continues to be slow or the economy worsens for a prolonged period
of time, one or more of our significant operations could be materially harmed. In addition, our restaurant operations depend on
having access to borrowed funds through the capital markets at reasonable rates. To the extent that access to credit is restricted or
the cost of funding increases, our business could be adversely affected.
Our operating businesses face a variety of risks associated with doing business in foreign markets. There is no assurance that our international operations will be profitable. Our international operations are subject to all of the
risks associated with our domestic operations, as well as a number of additional risks, varying substantially country by country.
These include, inter alia, international economic and political conditions, corruption, terrorism, social and ethnic unrest, foreign
currency fluctuations, differing cultures and consumer preferences. Our expansion into international markets could also create
risks to our brands.
In addition, we may become subject to foreign governmental regulations that impact the way we do business with our
international franchisees and vendors. These include antitrust and tax requirements, anti-boycott regulations, international trade
regulations, the USA Patriot Act, the Foreign Corrupt Practices Act, and applicable local law. Failure to comply with any such
legal requirements could subject us to monetary liabilities and other sanctions, which could harm our business and our financial
condition.
We may not be able to adequately protect our intellectual property, which could decrease the value of our brand and products. The success of our business depends on the continued ability to use the existing trademarks, service marks, and other
components of our brand to increase brand awareness and further develop branded products. While we take steps to protect our
intellectual property, our rights to our trademarks could be challenged by third parties or our use of these trademarks may result
in liability for trademark infringement, trademark dilution, or unfair competition, adversely affecting our profitability. We may
also become subject to these risks in the international markets in which we operate and in which we plan to expand. Any
impairment of our intellectual property or brands, including due to changes in U.S. or foreign intellectual property laws or the
absence of effective legal protections or enforcement measures, could adversely impact our business, financial condition and
results of operations.
Litigation could have a material adverse effect on our financial position, cash flows and results of operations. We are or may be from time to time a party to various legal actions, investigations and other proceedings brought by employees,
consumers, policyholders, suppliers, shareholders, government agencies or other third parties in connection with matters
pertaining to our business, including related to our investment activities. The outcome of such matters is often difficult to assess
or quantify and the cost to defend future proceedings may be significant. Even if a claim is unsuccessful or is not fully pursued,
the negative publicity surrounding any negative allegation regarding our Company, our business or our products could adversely
affect our reputation. While we believe that the ultimate outcome of routine legal proceedings individually and in the aggregate
will not have a material impact on our financial position, we cannot assure that an adverse outcome on, or reputational damage
from, any of these matters would not, in fact, materially impact our business and results of operations for the period when these
matters are completed or otherwise resolved.
Certain agreements with our Chairman and CEO may have an adverse effect on our financial position. We have entered into a license agreement with Sardar Biglari, Chairman and Chief Executive Officer, under which Mr. Biglari
has granted the Company an exclusive license to use his name when connected to the provision of certain products and services,
as well as a sublicense agreement with Steak n Shake that, inter alia, grants Steak n Shake the right to use the trademark “Steak n
Shake by Biglari.” In the event of a change of control of the Company or Mr. Biglari’s termination without cause or resignation
following specified occurrences, including (1) his removal as Chairman of the Board or Chief Executive Officer or (2) his no
longer maintaining sole capital allocation authority, Mr. Biglari would be entitled to receive revenue-based royalty payments
related to the usage of his name under the terms of the license agreement for a defined period of no less than five years.
Revenue-based royalties derived from Steak n Shake’s restaurants (including Company operated and franchised locations),
products and brands would be included in calculating these royalty payments, which would thus represent significant liability for
the Company. A change of control would also enable franchisees to terminate their franchise agreement with us. In addition, we
have an incentive agreement with Mr. Biglari, in which he is entitled to receive performance-based annual incentive payments
contingent on the growth of the Company’s adjusted book value in each fiscal year. In the event of a change in control or Mr.
Biglari’s termination without cause or resignation following specified occurrences, including (1) his removal as Chairman of the
Board or Chief Executive Officer or (2) his no longer maintaining sole capital allocation authority, Mr. Biglari would receive
specified payments thereunder. The combination of these provisions along with others referenced (e.g., contracts cancellable if
Mr. Biglari is no longer Chairman and Chief Executive Officer) all together could discourage a third party from pursuing a
change of control transaction involving us.
6
Risks Relating to Our Restaurant Operations
Our restaurant operations face intense competition from a wide range of industry participants.
The restaurant business is one of the most competitive industries. As there are virtually no barriers to entry into the restaurant
business, competitors may include national, regional and local establishments. There may be established competitors with
financial and other resources that are greater than the Company’s restaurant operations capabilities. Restaurant businesses
compete on the basis of price, menu, food quality, location, personnel and customer service. The restaurant business is often
affected by changes in consumer tastes and by national, regional, and local economic conditions. The performance of individual
restaurants may be impacted by factors such as traffic patterns, demographic trends, severe weather conditions, and competing
restaurants. Additional factors that may adversely affect the restaurant industry include, but are not limited to, food and wage
inflation, safety, and food-borne illness.
Changes in economic conditions may have an adverse impact on our restaurant operations.
Our restaurant operations are subject to normal economic cycles affecting the economy in general or the restaurant industry in
particular. The restaurant industry has been affected by economic factors, including the deterioration of global, national, regional
and local economic conditions, declines in employment levels, and shifts in consumer spending patterns. The disruptions
experienced in the global economy and volatility in the financial markets have reduced, and may continue to reduce, consumer
confidence in the economy, negatively affecting consumer restaurant spending, which could be harmful to our financial position
and results of operations. As a result, decreased cash flow generated from our business may adversely affect our financial
position and our ability to fund our operations. In addition, macroeconomic disruptions could adversely impact the availability of
financing for our franchisees’ expansions and operations.
Our cash flows and financial position could be negatively impacted if we are unable to comply with the restrictions and
covenants in Steak n Shake’s debt agreements. The Company’s subsidiaries currently maintain debt instruments, including Steak n Shake’s credit agreement, dated as of March
19, 2014, with the lenders party thereto. Covenants in the debt agreements impose operating and financial restrictions, including
requiring operating subsidiaries to maintain certain financial ratios and thereby restricting, among other things, their ability to
incur additional indebtedness and make distributions to the Company. Their failure to comply with these covenants and
restrictions could constitute an event of default that, if not cured or waived, could result, among other things, in the acceleration
of their indebtedness, which could negatively impact our operations and business and may also significantly affect our ability to
obtain additional or alternative financing. In such event, our cash flows may not be sufficient to fully repay this indebtedness and
we cannot assure you that we would be able to refinance or restructure this debt. In addition, the restrictions contained in these
debt instruments could adversely affect our ability to finance our operations, acquisitions or investments.
Steak n Shake’s ability to make payments on its credit facility and to fund operations depends on its ability to generate cash,
which is subject to general economic, financial, competitive, regulatory and other factors that are beyond our control. Steak n
Shake may not generate sufficient cash flow from operations to service this debt or to fund its other liquidity needs.
Fluctuations in commodity and energy prices and the availability of commodities, including beef, fried products, poultry, and
dairy, could affect our restaurant business. The cost, availability and quality of ingredients restaurant operations use to prepare their food is subject to a range of factors,
many of which are beyond their control. A significant component of our restaurant business’ costs is related to food
commodities, including beef, fried products, poultry, and dairy products, which can be subject to significant price fluctuations
due to seasonal shifts, climate conditions, industry demand, changes in international commodity markets, and other factors. If
there is a substantial increase in prices for these food commodities, our results of operations may be negatively affected. In
addition, our restaurants are dependent upon frequent deliveries of perishable food products that meet certain specifications.
Shortages or interruptions in the supply of perishable food products caused by unanticipated demand, problems in production or
distribution, disease or food-borne illnesses, inclement weather, or other conditions could adversely affect the availability,
quality, and cost of ingredients, which would likely lower revenues, damage our reputation, or otherwise harm our business.
7
Adverse weather conditions or losses due to casualties could negatively impact our operating performance. Property damage caused by casualties and natural disasters, instances of inclement weather, flooding, hurricanes, fire, and other
acts of nature can adversely impact sales in several ways. Many of Steak n Shake’s and Western’s restaurants are located in the
Midwest and Southeast portions of the United States. During the first and fourth quarters, restaurants in the Midwest may face
harsh winter weather conditions. During the third and fourth quarters, restaurants in the Southeast may experience hurricanes or
tropical storms. Our sales and operating results may be negatively affected by these harsh weather conditions, which could make
it more difficult for guests to visit our restaurants, necessitate the closure of restaurants for a period of time or costly repairs due
to physical damage, or lead to a shortage of employees resulting from unsafe road conditions or an evacuation of the general
population.
We are subject to health, employment, environmental, and other government regulations, and failure to comply with existing
or future government regulations could expose us to litigation or penalties, damage our reputation, and lower profits. We are subject to various global, federal, state, and local laws and regulations affecting our restaurant operations. Changes in
existing laws, rules and regulations applicable to us, or increased enforcement by governmental authorities, may require us to
incur additional costs and expenses necessary for compliance. If we fail to comply with any of these laws, we may be subject to
governmental action or litigation, and our reputation could be accordingly harmed. Injury to our reputation would, in turn, likely
reduce revenues and profits.
The development and construction of restaurants is subject to compliance with applicable zoning, land use, and environmental
regulations. Difficulties in obtaining, or failure to obtain, the required licenses or approvals could delay or prevent the
development of a new restaurant in a particular area.
In recent years, there has been an increased legislative, regulatory, and consumer focus on nutrition and advertising practices in
the food industry. As a result, restaurant operations may become subject to regulatory initiatives in the area of nutrition
disclosure or advertising, such as requirements to provide information about the nutritional content of our food products, which
could increase expenses. The operation of the Steak n Shake and Western franchise system is also subject to franchise laws and
regulations enacted by a number of states, and to rules promulgated by the U.S. Federal Trade Commission. Any future
legislation regulating franchise relationships may negatively affect our operations, particularly our relationship with franchisees.
Failure to comply with new or existing franchise laws and regulations in any jurisdiction or to obtain required government
approvals could result in a ban or temporary suspension on future franchise sales. Further national, state and local government
initiatives, such as mandatory health insurance coverage, “living wage” or other proposed increases in minimum wage rates
could adversely affect our business.
Risks Relating to Our Investment Activities
Our investment activities are conducted primarily through outside investment partnerships, The Lion Fund, L.P. and The
Lion Fund II, L.P. (collectively, the “investment partnerships”), which are controlled by Mr. Biglari. Our investment activities are conducted mainly through these outside investment partnerships. Under the terms of their
partnership agreements, each contribution made by the Company to the investment partnerships is subject to a five-year lock-up
period, and any distribution upon our withdrawal of funds will be paid out over a two-year period (and may be paid in-kind
rather than in cash, thus increasing the difficulty of liquidating these investments). As a result of these provisions and our
consequent inability to access this capital for a defined period, our capital invested in the investment partnerships may be subject
to an increased risk of loss of all or a significant portion of value, and we may become unable to meet our capital requirements.
There is a high likelihood that we will make additional investments in these investment partnerships in the future.
We also have a Shared Services Agreement with Biglari Capital Corp. (“Biglari Capital”), general partner of the investment
partnerships, pursuant to which we agreed to provide certain services to Biglari Capital (e.g., use of space at our corporate
headquarters) in exchange for a 6% hurdle rate for the Company and its subsidiaries (as compared to a 5% hurdle rate for all
other limited partners), above which Biglari Capital is entitled to receive an incentive reallocation in its capacity as general
partner of the investment partnerships. There can be no assurance that the benefit, if any, we may realize from this increased
hurdle rate will enable us to recoup our costs incurred in performing services for Biglari Capital under the Shared Services
Agreement.
The incentive allocation to which Mr. Biglari, as Chairman and Chief Executive Officer of Biglari Capital, general partner of the
investment partnerships, is entitled under the terms of the respective partnership agreements is equal to 25% of the net profits
allocated to the limited partners in excess of their applicable hurdle rate over the previous high-water mark.

8
Our investments are unusually concentrated and fair values are subject to a loss in value. Our investments are predominantly held through the investment partnerships, which generally invest in common stocks. These
investments are largely concentrated in the common stock of one investee, Cracker Barrel Old Country Store, Inc. A significant
decline in the major values of these investments may produce a large decrease in our consolidated shareholders’ equity and can
have a material adverse effect on our consolidated book value per share and earnings.
We are subject to the risk of possibly becoming an investment company under the Investment Company Act of 1940. Because we are a holding company and a significant portion of our assets may, from time to time, consist of investments in
entities in which we do not have a controlling interest, we run the risk of inadvertently becoming an investment company, which
would require us to register under the Investment Company Act of 1940, as amended (the “Investment Company Act”).
Registered investment companies are subject to extensive, restrictive and potentially adverse regulations relating to, among other
things, operating methods, management, capital structure, dividends and transactions with affiliates. Registered investment
companies are not permitted to operate their business in the manner in which we operate our business, nor are registered
investment companies permitted to have many of the relationships that we have with our affiliated companies.
To avoid becoming and registering as an investment company under the Investment Company Act, we monitor the value of our
investments and structure transactions accordingly. As a result, we may structure transactions in a less advantageous manner than
if we did not have Investment Company Act concerns, or we may avoid otherwise economically desirable transactions due to
those concerns. In addition, events beyond our control, including significant appreciation or depreciation in the market value of
certain of our publicly traded holdings or adverse developments with respect to our ownership of certain of our subsidiaries,
could result in our inadvertently becoming an investment company. If it were established that we were an investment company,
there would be a risk, among other material adverse consequences, that we could become subject to monetary penalties or
injunctive relief, or both, in an action brought by the Securities and Exchange Commission (the “SEC”), that we would be unable
to enforce contracts with third parties or that third parties could seek to obtain rescission of transactions with us undertaken
during the period it was established that we were an unregistered investment company.
Risks Relating to Our Insurance Business
Our success depends on our ability to underwrite risks accurately and to charge adequate rates to policyholders.
Our results of operations depend on our ability to underwrite and set rates accurately for risks assumed. A primary role of the
pricing function is to ensure that rates are adequate to generate sufficient premiums to pay losses, loss adjustment expenses, and
underwriting expenses, and earning a profit.
Our insurance business is vulnerable to significant catastrophic property loss, which could have an adverse effect on its
financial condition and results of operations.
Our insurance business faces a significant risk of loss in the ordinary course of its business for property damage resulting from
natural disasters, man-made catastrophes and other catastrophic events. These events typically increase the frequency and
severity of commercial property claims. Because catastrophic loss events are by their nature unpredictable, historical results of
operations may not be indicative of future results of operations, and the occurrence of claims from catastrophic events may result
in significant volatility in our insurance business’ financial condition and results of operations from period to period. We attempt
to manage our exposure to these events through reinsurance programs, although there is no assurance we will be successful in
doing so.
Inability to obtain reinsurance or to collect ceded losses and loss adjustment expenses could adversely affect our insurance
business’s ability to write new policies.
Our insurance business purchases reinsurance to help manage its exposure to risk. Under these ceded reinsurance arrangements,
another insurer assumes a specified portion of our exposure in exchange for a specified portion of policy premiums. The
availability, amount and cost of reinsurance depend on market conditions and may vary significantly. Thus, any decrease in the
amount of this reinsurance will increase the risk of loss. If our insurance business is unable to obtain sufficient reinsurance at a
cost it deems acceptable, it may be unwilling to bear the increased risk and may reduce the level of its underwriting
commitments.
Ceded reinsurance does not discharge our insurance business’ direct obligations under the policies it writes. Our insurance
business remains liable to policyholders even if it is unable to obtain recoveries under which it believes it is entitled to receive
under the reinsurance contracts. Losses may not be recovered from the reinsurers until claims are paid.
9
Our insurance business is subject to extensive existing state, local and foreign governmental regulations that restrict its
ability to do business and generate revenues.
Our insurance business is subject to regulation in the jurisdictions in which it operates. These regulations may relate to, among
other things, the types of business that can be written, the rates that can be charged for coverage, the level of capital and reserves
that must be maintained, and restrictions on the types and size of investments that can be placed. Regulations may also restrict
the timing and amount of dividend payments. Accordingly, existing or new regulations related to these or other matters or
regulatory actions imposing restrictions on our insurance business may adversely impact its results of operations.
Risks Relating to Our Media Business
Our media business faces significant competition from other magazine publishers and new forms of media, including digital
media, and as a result our media business may not be able to improve its operating results. Our media business competes principally with other magazine publishers. The proliferation of choices available to consumers for
information and entertainment has resulted in audience fragmentation and has negatively impacted overall consumer demand for
print magazines and intensified competition with other magazine publishers for share of print magazine readership. Our media
business also competes with digital publishers and other forms of media. This competition has intensified as a result of the
growing popularity of mobile devices and the shift in preference of some consumers from print media to digital media for the
delivery and consumption of content.
Our media business derives a significant percentage of its revenues from advertising. Competition among print magazine and
digital publishers for advertising is primarily based on the circulation and readership of magazines and the number of visitors to
websites, respectively, and the demographics of customers, advertising rates, plus the effectiveness of advertising sales teams.
The proliferation of new platforms available to advertisers, combined with continuing competition from print platforms, has
impacted both the amount of advertising our media business is able to sell as well as the rates advertisers are willing to pay. Our
media business’ ability to compete successfully for advertising also depends on its ability to prove the value of its advertising.
Our pursuit of licensing opportunities for the Maxim brand may prove to be unsuccessful.
The transformation of the business depends to a significant degree upon its ability to develop new licensing agreements to
expand the Maxim brand. However, these licensing efforts may be unsuccessful. We may be unable to secure favorable terms
for future licensing arrangements, which could lead to, among other things, disputes with licensing partners that hinder our
ability to grow the Maxim brand. Future licensing partners may also fail to honor their contractual obligations or take other
actions that can diminish the value of the Maxim brand. Disputes could also arise that prevent or delay our ability to collect
licensing revenues under these arrangements. If any of these developments occur or our licensing efforts are otherwise not
successful, the value and recognition of the Maxim brand, as well as the prospects of our media business, could be materially,
adversely affected.
Our media business is exposed to risks associated with weak economic conditions. Because magazines are generally discretionary purchases for consumers, circulation revenues are sensitive to general economic
conditions and economic cycles. Certain economic conditions such as general economic downturns, including periods of
increased inflation, unemployment levels, interest rates, gasoline and other energy prices, or declining consumer confidence, may
negatively impact consumer spending. Reduced consumer spending or a shift in consumer spending patterns away from
discretionary items will likely result in reduced demand for our media business’s magazines and may also require us to incur
increased operating expenses.
Item 1B.
Unresolved Staff Comments
None.

10
Item 2.
Properties
Restaurant Properties As of December 31, 2015, restaurant operations included 631 company-operated and franchised locations. Restaurant operations
own the land and building for 154 restaurants. The following table lists the locations of the restaurants, as of December 31,
2015.
Steak n Shake Western Sizzlin
Company-
operated Franchised
Company-
operated Franchised Total
Domestic:
Alabama .................................................................................. 2 7 — 6 15
Arizona ..................................................................................... 1 — — — 1
Arkansas ................................................................................... — 2 — 16 18
California ................................................................................. 1 2 — 2 5
Colorado ................................................................................... 2 2 — — 4
Florida ...................................................................................... 80 3 — — 83
Georgia ..................................................................................... 23 17 — 7 47
Illinois ...................................................................................... 63 7 — — 70
Indiana ...................................................................................... 68 3 — — 71
Iowa .......................................................................................... 3 — — — 3
Kansas ...................................................................................... — 6 — — 6
Kentucky .................................................................................. 14 4 — — 18
Louisiana ................................................................................. — 1 — 1 2
Maryland .................................................................................. — 1 — 2 3
Michigan .................................................................................. 19 — — — 19
Mississippi ................................................................................ — 2 — 2 4
Missouri .................................................................................... 39 24 — 1 64
Montana ................................................................................... — 1 — — 1
Nevada ..................................................................................... — 2 — — 2
New Jersey ............................................................................... — 1 — — 1
New York ................................................................................. 1 — — — 1
North Carolina .......................................................................... 6 7 — 8 21
Ohio .......................................................................................... 63 — — 1 64
Oklahoma ................................................................................. — 5 — 9 14
Pennsylvania............................................................................. 6 4 — — 10
South Carolina .......................................................................... 1 5 — 3 9
Tennessee ................................................................................. 9 11 — 4 24
Texas ........................................................................................ 14 10 — — 24
Utah ......................................................................................... — 1 — — 1
Virginia .................................................................................... — 6 3 4 13
West Virginia ........................................................................... — 2 1 — 3
International:
France ...................................................................................... 1 1 — — 2
Kuwait ..................................................................................... — 2 — — 2
Italy ......................................................................................... — 2 — — 2
Saudi Arabia ............................................................................ — 1 — — 1
Spain ........................................................................................ 1 2 — — 3
Total ........................................................................................ 417 144 4 66 631
11
Item 3.
Legal Proceedings
We are involved in various legal proceedings and have certain unresolved claims pending. We believe, based on examination of
these matters and experiences to date, that the ultimate liability, if any, in excess of amounts already provided in our consolidated
financial statements is not likely to have a material effect on our results of operations, financial position or cash flows.
In 2013 two shareholders of the Company filed derivative actions putatively on behalf of the Company against the members of
our Board of Directors in the United States District Courts for the Southern District of Indiana and the Western District of
Texas. The actions were consolidated in the Southern District of Indiana in 2014. On March 18, 2015, the United States District
Court for the Southern District of Indiana granted a motion to dismiss the derivative actions in favor of the Company. In
addition, the Court issued judgment on all counts in favor of the Company and its directors.
The two shareholders appealed the Southern District of Indiana Court’s March 18, 2015 decision. On February 17, 2016, the
United States Court of Appeals for the Seventh Circuit affirmed the decision of the district court dismissing, in their entirety, all
claims made against the Company and its Board of Directors.
Item 4.
Mine Safety Disclosures
Not applicable.
12
Part II
Item 5.
Market for Registrant’s Common Equity, Related Stockholder Matters and Issuer Purchases of Equity
Securities
Rights Offering
On September 12, 2014 and September 16, 2013, Biglari Holdings completed offerings of transferable subscription rights,
distributing one transferable subscription right (“Rights”) for each share of its common stock to shareholders. Every five Rights
entitled a shareholder to subscribe for one share of common stock at a price of $250.00 and $265.00, respectively. Shareholders
on the record date who fully exercised the Rights distributed to them were also entitled to subscribe for and purchase additional
shares of common stock not purchased by other Rights holders through their basic subscription privileges. The offerings were
oversubscribed and 344,261 and 286,767 new shares of common stock were issued, respectively. The Company received net
proceeds of $85.9 million and $75.6 million from the offerings, respectively. Including the issuance of the newly subscribed
shares the Company had 2,066,691 shares outstanding as of December 31, 2015.
Market Information Biglari Holdings’ common stock is listed for trading on the New York Stock Exchange (the “NYSE”), trading symbol: BH. The
following table sets forth the high and low sales prices per share, as reported on the NYSE List and adjusted for the 2014 and
2013 offerings of Rights during the periods indicated:
High Low
First Quarter....................................................................................................................................... 440.00$ 394.87$
Second Quarter................................................................................................................................... 425.79 344.99
Third Quarter...................................................................................................................................... 448.00 364.94
Fourth Quarter.................................................................................................................................... 385.96 325.82
2015
High Low
Transition Period................................................................................................................................ 399.51$ $ 320.95
2014
High Low
First quarter ....................................................................................................................................... 460.28$ $ 381.26
Second quarter ................................................................................................................................... 482.14 384.05
Third quarter ..................................................................................................................................... 430.82 378.03
Fourth quarter ................................................................................................................................... 415.97 338.88
Fiscal Year 2014
Shareholders
Biglari Holdings had 6,522 beneficial shareholders of its common stock at February 12, 2016.
Dividends
Biglari Holdings has not declared a cash dividend during 2015, the 2014 transition periods, or during fiscal years 2014 or 2013.
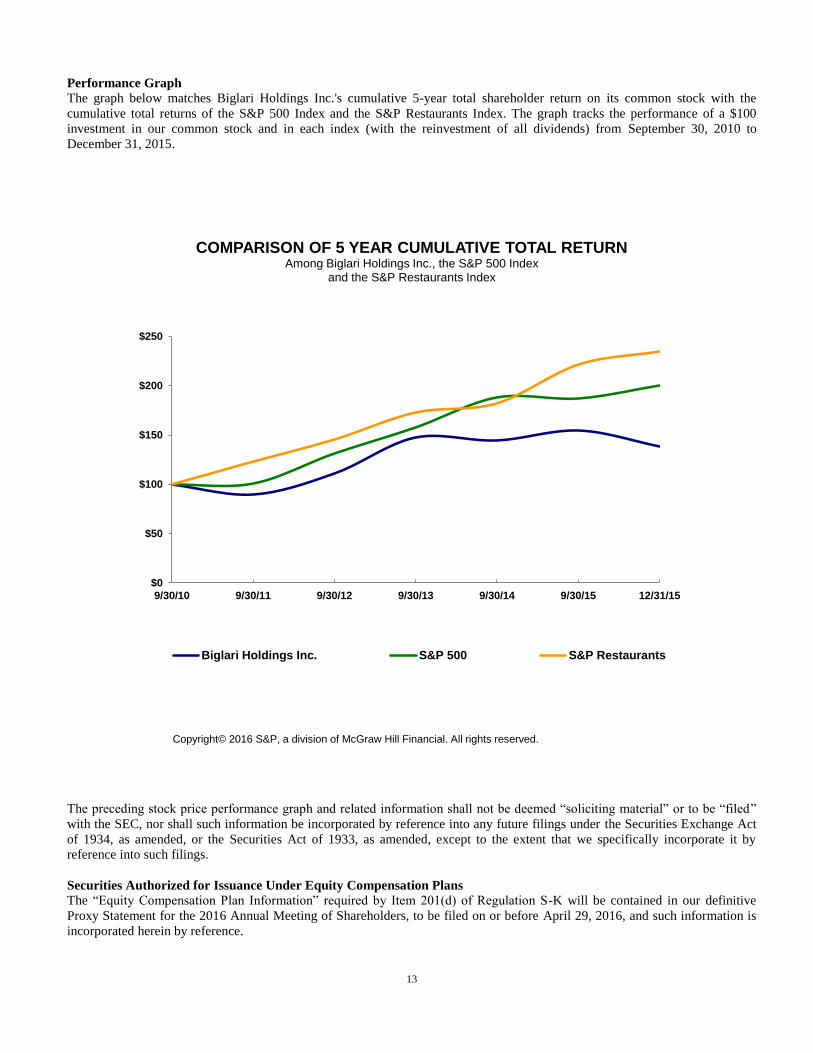
13
Performance Graph The graph below matches Biglari Holdings Inc.'s cumulative 5-year total shareholder return on its common stock with the
cumulative total returns of the S&P 500 Index and the S&P Restaurants Index. The graph tracks the performance of a $100
investment in our common stock and in each index (with the reinvestment of all dividends) from September 30, 2010 to
December 31, 2015.
The preceding stock price performance graph and related information shall not be deemed “soliciting material” or to be “filed”
with the SEC, nor shall such information be incorporated by reference into any future filings under the Securities Exchange Act
of 1934, as amended, or the Securities Act of 1933, as amended, except to the extent that we specifically incorporate it by
reference into such filings.
Securities Authorized for Issuance Under Equity Compensation Plans
The “Equity Compensation Plan Information” required by Item 201(d) of Regulation S-K will be contained in our definitive
Proxy Statement for the 2016 Annual Meeting of Shareholders, to be filed on or before April 29, 2016, and such information is
incorporated herein by reference.
$0
$50
$100
$150
$200
$250
9/30/10 9/30/11 9/30/12 9/30/13 9/30/14 9/30/15 12/31/15
COMPARISON OF 5 YEAR CUMULATIVE TOTAL RETURN
Among Biglari Holdings Inc., the S&P 500 Index and the S&P Restaurants Index
Biglari Holdings Inc. S&P 500 S&P Restaurants
Copyright© 2016 S&P, a division of McGraw Hill Financial. All rights reserved.

14
Item 6. Selected Financial Data
(dollars in thousands except per share data)
2015 2014 2013
Revenue:
Total revenues ....................................................................................................... 861,452$ 224,450$ 204,442$
Earnings:
Net (loss) earnings attributable to Biglari Holdings Inc. ....................................... (15,843)$ 91,050$ 18,949$
Basic (loss) earnings per share attributable to Biglari Holdings Inc. (1) ............... (10.18)$ 48.49$ 11.05$
Diluted (loss) earnings per share attributable to Biglari Holdings Inc. (1) ............ (10.18)$ 48.45$ 11.03$
Year-end data:
Total assets ........................................................................................................... 1,003,918$ 1,314,791$ 1,010,356$
Long-term notes payable and other borrowings ................................................... 298,950 312,595 199,601
Biglari Holdings Inc. shareholders’ equity ............................................................ 451,372$ 725,551$ 587,885$
Transition Period
(1) Earnings pe rshare of c ommon stoc k is base d on the we ighte d ave rage numbe r of share s outs tanding during the pe riod. For financ ial
re porting purpose s and for purpose s of c omputing the we ighte d ave rage c ommon share s outs tanding, the share s of Company stoc k
attributable to the unre late d limite d partne rs of the inve stme nt partne rships - base d on the ir proportional owne rship during the pe riod -
are c onside re d outs tanding share s .
Re ve n u e :
Tota l re ve nue s ................................................................................................. 793,811$ 755,822$ 740,207$ 709,200$
Ea rn in g s :
Ne t e a rnings a ttributa ble to Bigla ri Holdings Inc . ................................................ 28,804$ 140,271$ 21,593$ 34,565$
Ba s ic e a rnings pe r sha re a ttributa ble to Bigla ri Holdings Inc . (1) .......................... 16.85$ 90.89$ 13.92$ 22.35$
Dilute d e a rnings pe r sha re a ttributa ble to Bigla ri Holdings Inc . (1) ........................ 16.82$ 90.69$ 13.88$ 22.23$
Ye a r- e n d d a ta :
Tota l a sse ts ..................................................................................................... 1,174,732$ 988,543$ 773,787$ 672,860$
Long- te rm note s pa ya ble a nd othe r borrowings ................................................ 315,196 216,747 230,603 217,483
Bigla ri Holdings Inc . sha re holde rs’ e quity .......................................................... 638,717$ 564,589$ 349,125$ 279,678$
Fisc a l
2011(2)(3)
52 We e ks Ende d
Fisc a l
2012(2)(3)
Fisc a l
2014(2)(4)
Fisc a l
2013(2)(4)
(1) Earnings pe r share of c ommon stoc k is base d on the we ighte d ave rage numbe r of share s outs tanding during the ye ar. In fisc al ye ar
2014 and 2013 the Company c omple te d rights offe rings in whic h 344,261 and 286,767 ne w share s of c ommon stoc k we re issue d,
re spe c tive ly. The the ore tic al e arnings pe r share have be e n re troac tive ly re s tate d for all ye ars to give e ffe c t to the rights offe rings .
(2) Fisc al ye ars 2014, 2013, 2012, and 2011e nde d on S e pte mbe r24, 2014, S e pte mbe r 25, 2013, S e pte mbe r26, 2012, and S e pte mbe r28,
2011, re spe c tive ly.
(3) For financ ial re porting purpose s all c ommon share s of the Company he ld by the c onsolidate d affiliate d partne rships are re c orde d in
tre asury s toc k on the c onsolidate d balanc e she e t. Forpurpose s of c omputing the we ighte d ave rage c ommon share s outs tanding, the
share s of tre asury s toc k attributable to the unre late d limite d partne rs of the c onsolidate d affiliate d partne rships - base d on the ir
proportional owne rship during the pe riod - are c ons ide re d outs tanding share s .
(4) For financ ial re porting purpose s and for purpose s of c omputing the we ighte d ave rage c ommon share s outs tanding, the share s of
Company s toc k attributable to the unre late d limite d partne rs of the inve s tme nt partne rships - base d on the ir proportional owne rship
during the pe riod - are c ons ide re d outs tanding share s .
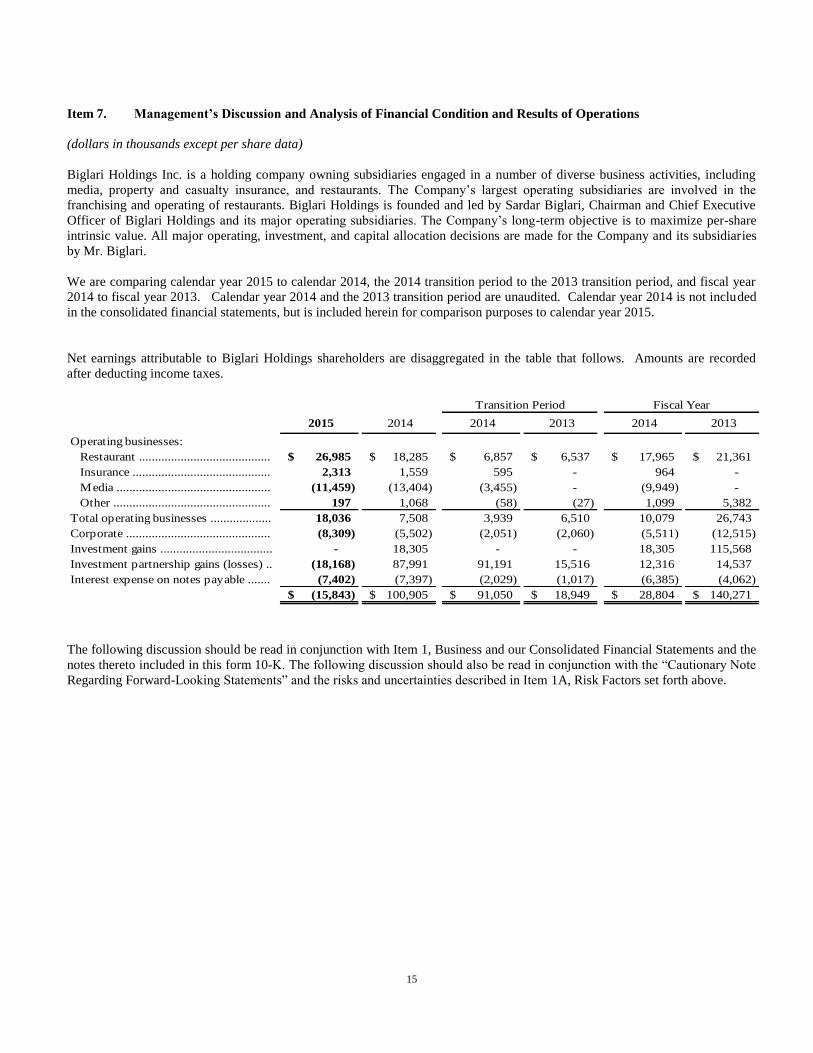
15
Item 7.
Management’s Discussion and Analysis of Financial Condition and Results of Operations
(dollars in thousands except per share data)
Biglari Holdings Inc. is a holding company owning subsidiaries engaged in a number of diverse business activities, including
media, property and casualty insurance, and restaurants. The Company’s largest operating subsidiaries are involved in the
franchising and operating of restaurants. Biglari Holdings is founded and led by Sardar Biglari, Chairman and Chief Executive
Officer of Biglari Holdings and its major operating subsidiaries. The Company’s long-term objective is to maximize per-share
intrinsic value. All major operating, investment, and capital allocation decisions are made for the Company and its subsidiaries
by Mr. Biglari.
We are comparing calendar year 2015 to calendar 2014, the 2014 transition period to the 2013 transition period, and fiscal year
2014 to fiscal year 2013. Calendar year 2014 and the 2013 transition period are unaudited. Calendar year 2014 is not included
in the consolidated financial statements, but is included herein for comparison purposes to calendar year 2015.
Net earnings attributable to Biglari Holdings shareholders are disaggregated in the table that follows. Amounts are recorded
after deducting income taxes.
2015 2014 2014 2013 2014 2013
Operating businesses:
Restaurant ......................................... 26,985$ 18,285$ 6,857$ 6,537$ 17,965$ 21,361$
Insurance ........................................... 2,313 1,559 595 - 964 -
Media ................................................ (11,459) (13,404) (3,455) - (9,949) -
Other ................................................. 197 1,068 (58) (27) 1,099 5,382
Total operating businesses ................... 18,036 7,508 3,939 6,510 10,079 26,743
Corporate ............................................. (8,309) (5,502) (2,051) (2,060) (5,511) (12,515)
Investment gains ................................... - 18,305 - - 18,305 115,568
Investment partnership gains (losses) .. (18,168) 87,991 91,191 15,516 12,316 14,537
Interest expense on notes payable ....... (7,402) (7,397) (2,029) (1,017) (6,385) (4,062)
(15,843)$ 100,905$ 91,050$ 18,949$ 28,804$ 140,271$
Transition Period Fiscal Year
The following discussion should be read in conjunction with Item 1, Business and our Consolidated Financial Statements and the
notes thereto included in this form 10-K. The following discussion should also be read in conjunction with the “Cautionary Note
Regarding Forward-Looking Statements” and the risks and uncertainties described in Item 1A, Risk Factors set forth above.

16
Restaurants
Our restaurant businesses, which include Steak n Shake and Western, comprise 631 company-operated and franchised
restaurants as of December 31, 2015.
Company-
operatedFranchised
Company-
operatedFranchised Total
Total stores as of September 25, 2013 ....................... 415 104 4 82 605
Net restaurants opened (closed) ................................. 1 20 - (11) 10
Total stores as of September 24, 2014 ....................... 416 124 4 71 615
Net restaurants opened (closed) ................................. 1 4 - (3) 2
Total stores as of December 31, 2014 ........................ 417 128 4 68 617
Net restaurants opened (closed) ................................. - 16 - (2) 14
Total stores as of December 31, 2015 ..................... 417 144 4 66 631
Steak n Shake Western Sizzlin
The term “same-store sales” refers to the sales of company-operated units open at least 18 months at the beginning of the current
period and have remained open through the end of the period. Same-store traffic measures the number of patrons who walk
through the same units.
Restaurant operations 2015 compared to 2014
Restaurant operations for 2015 and 2014 are summarized below.
2015 2014
Revenue
Net sales ............................................................................................... 799,660$ 769,738$
Franchise royalties and fees .................................................................. 16,428 15,931
Other revenue ....................................................................................... 3,650 3,692
Total revenue ........................................................................................... 819,738 789,361
Restaurant cost of sales
Cost of food .......................................................................................... 232,271 29.0% 232,224 30.2%
Restaurant operating costs ................................................................... 379,632 47.5% 363,669 47.2%
Rent ...................................................................................................... 17,384 2.2% 17,048 2.2%
Total cost of sales .................................................................................... 629,287 612,941
Selling, general and administrative
General and administrative ................................................................... 62,055 7.6% 65,022 8.2%
Marketing ............................................................................................. 46,050 5.6% 42,361 5.4%
Other expenses ..................................................................................... 7,590 0.9% 6,226 0.8%
Total selling, general and administrative 115,695 14.1% 113,609 14.4%
Depreciation and amortization ................................................................ 23,736 2.9% 24,091 3.1%
Interest on obligations under leases ......................................................... 9,422 9,685
Earnings before income taxes ................................................................... 41,598 29,035
Income tax expense .................................................................................. 14,613 10,750
Net earnings ............................................................................................. 26,985$ 18,285$
Cost of food, restaurant operating costs and rent expense are expressed as a percentage of net sales.
General and administrative, marketing, other expenses and depreciation and amortization are expressed as a percentage of total
revenue.
17
Net sales during 2015 were $799,660 representing an increase of $29,922 when compared to 2014. The increased performance of
our restaurant operations was largely driven by Steak n Shake’s same-store sales. Steak n Shake’s same-store sales during 2015
increased 3.6% whereas customer traffic increased by 1.8% during 2015.
Franchise royalties and fees increased 3.1% in 2015 as compared to those in 2014. Steak n Shake opened 22 franchise units and
closed six franchise units during 2015. The increases in 2015 are primarily attributable to the opening of new Steak n Shake
units. The percentage increase over 2014 was offset by forfeited area development fees realized in the first quarter of 2014.
Cost of food in 2015 was $232,271 or 29.0% of net sales, compared to $232,224 or 30.2% of net sales in 2014. The decrease as
a percent of sales during 2015 was primarily attributable to lower beef costs and change in menu mix.
Restaurant operating costs during 2015 were $379,632 or 47.5% of net sales, compared to $363,669 or 47.2% of net sales in
2014. The increased costs were mainly based on higher sales. Costs as a percent of sales increased principally due to higher
wages and benefits. Costs as a percent of sales during 2015 remained relatively constant compared to 2014.
Selling, general and administrative expenses during 2015 were $115,695 or 14.1% of total revenues. General and administrative
expenses decreased by $2,967 during 2015 primarily due to decreased personnel expenses. Marketing increased by $3,689 in
2015 compared to 2014 primarily related to commissions paid for third party gift card sales.
Interest on obligations under leases was $9,422 during 2015, versus $9,685 during 2014. The total obligations under leases
outstanding at December 31, 2015 were $95,965, compared to $104,561 at December 31, 2014.
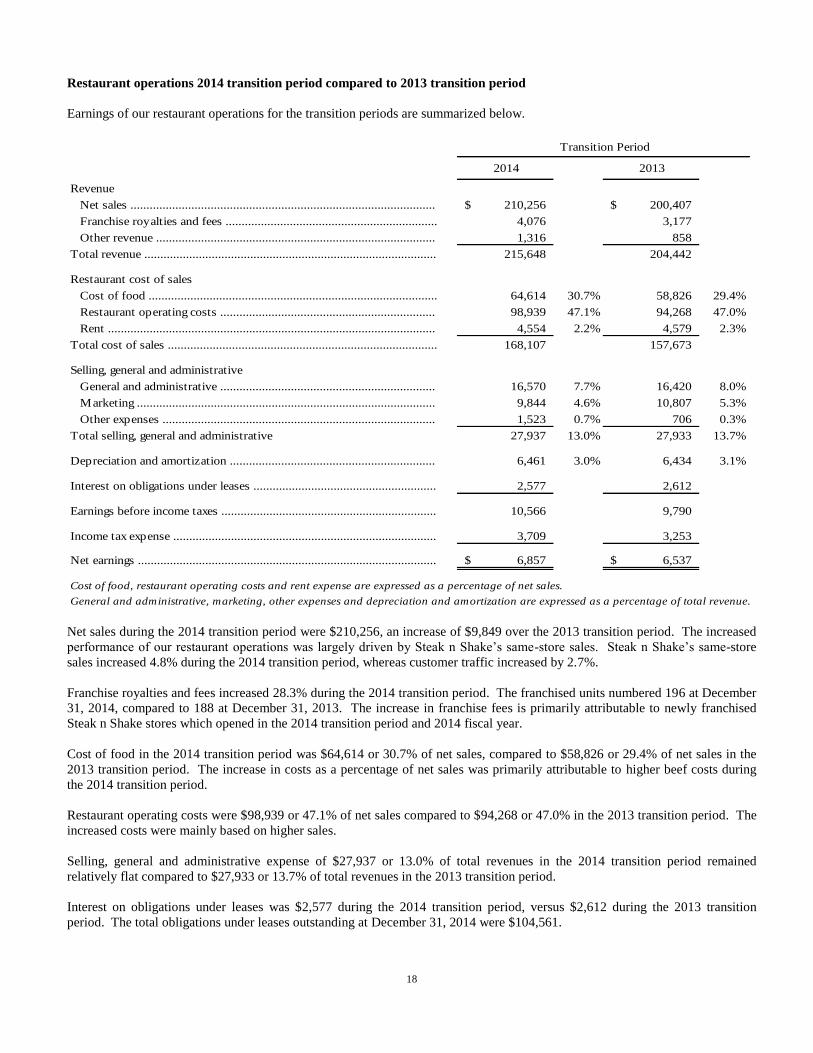
18
Restaurant operations 2014 transition period compared to 2013 transition period
Earnings of our restaurant operations for the transition periods are summarized below.
2014 2013
Revenue
Net sales ............................................................................................... 210,256$ 200,407$
Franchise royalties and fees .................................................................. 4,076 3,177
Other revenue ....................................................................................... 1,316 858
Total revenue ........................................................................................... 215,648 204,442
Restaurant cost of sales
Cost of food .......................................................................................... 64,614 30.7% 58,826 29.4%
Restaurant operating costs ................................................................... 98,939 47.1% 94,268 47.0%
Rent ...................................................................................................... 4,554 2.2% 4,579 2.3%
Total cost of sales .................................................................................... 168,107 157,673
Selling, general and administrative
General and administrative ................................................................... 16,570 7.7% 16,420 8.0%
Marketing ............................................................................................. 9,844 4.6% 10,807 5.3%
Other expenses ..................................................................................... 1,523 0.7% 706 0.3%
Total selling, general and administrative 27,937 13.0% 27,933 13.7%
Depreciation and amortization ................................................................ 6,461 3.0% 6,434 3.1%
Interest on obligations under leases ......................................................... 2,577 2,612
Earnings before income taxes ................................................................... 10,566 9,790
Income tax expense .................................................................................. 3,709 3,253
Net earnings ............................................................................................. 6,857$ 6,537$
Cost of food, restaurant operating costs and rent expense are expressed as a percentage of net sales.
General and administrative, marketing, other expenses and depreciation and amortization are expressed as a percentage of total revenue.
Transition Period
Net sales during the 2014 transition period were $210,256, an increase of $9,849 over the 2013 transition period. The increased
performance of our restaurant operations was largely driven by Steak n Shake’s same-store sales. Steak n Shake’s same-store
sales increased 4.8% during the 2014 transition period, whereas customer traffic increased by 2.7%.
Franchise royalties and fees increased 28.3% during the 2014 transition period. The franchised units numbered 196 at December
31, 2014, compared to 188 at December 31, 2013. The increase in franchise fees is primarily attributable to newly franchised
Steak n Shake stores which opened in the 2014 transition period and 2014 fiscal year.
Cost of food in the 2014 transition period was $64,614 or 30.7% of net sales, compared to $58,826 or 29.4% of net sales in the
2013 transition period. The increase in costs as a percentage of net sales was primarily attributable to higher beef costs during
the 2014 transition period.
Restaurant operating costs were $98,939 or 47.1% of net sales compared to $94,268 or 47.0% in the 2013 transition period. The
increased costs were mainly based on higher sales.
Selling, general and administrative expense of $27,937 or 13.0% of total revenues in the 2014 transition period remained
relatively flat compared to $27,933 or 13.7% of total revenues in the 2013 transition period.
Interest on obligations under leases was $2,577 during the 2014 transition period, versus $2,612 during the 2013 transition
period. The total obligations under leases outstanding at December 31, 2014 were $104,561.
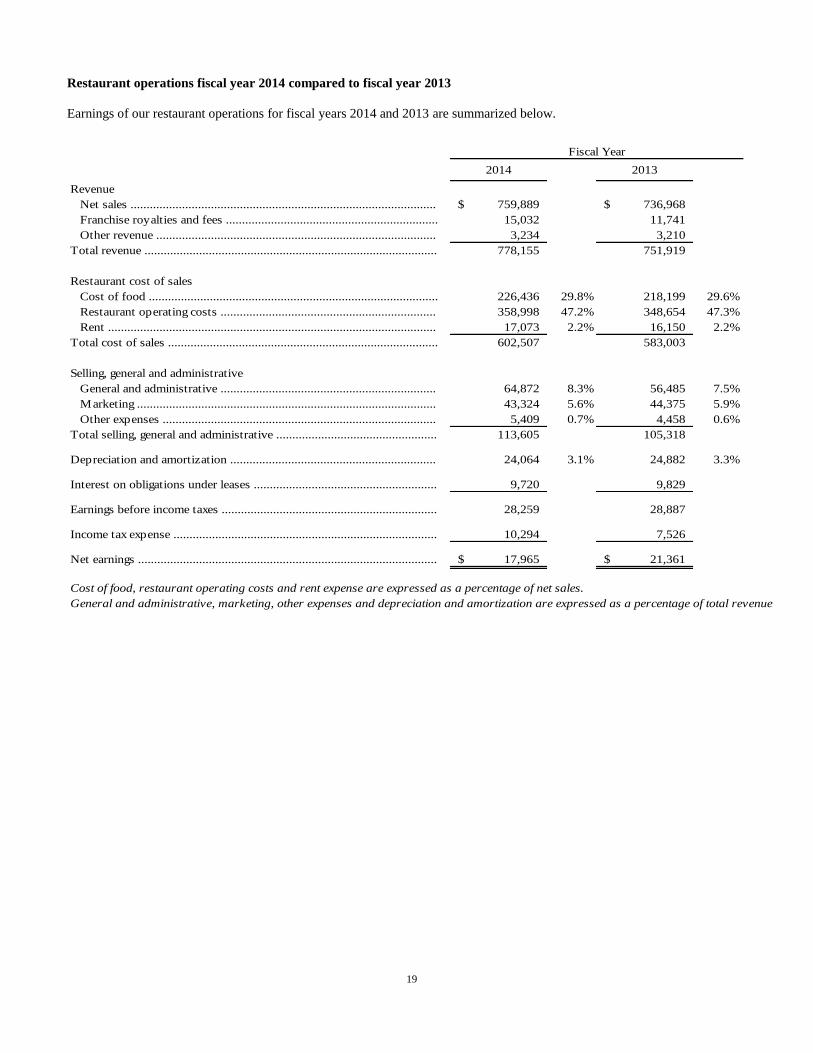
19
Restaurant operations fiscal year 2014 compared to fiscal year 2013
Earnings of our restaurant operations for fiscal years 2014 and 2013 are summarized below.
2014 2013
Revenue
Net sales ............................................................................................... 759,889$ 736,968$
Franchise royalties and fees .................................................................. 15,032 11,741
Other revenue ....................................................................................... 3,234 3,210
Total revenue ........................................................................................... 778,155 751,919
Restaurant cost of sales
Cost of food .......................................................................................... 226,436 29.8% 218,199 29.6%
Restaurant operating costs ................................................................... 358,998 47.2% 348,654 47.3%
Rent ...................................................................................................... 17,073 2.2% 16,150 2.2%
Total cost of sales .................................................................................... 602,507 583,003
Selling, general and administrative
General and administrative ................................................................... 64,872 8.3% 56,485 7.5%
Marketing ............................................................................................. 43,324 5.6% 44,375 5.9%
Other expenses ..................................................................................... 5,409 0.7% 4,458 0.6%
Total selling, general and administrative .................................................. 113,605 105,318
Depreciation and amortization ................................................................ 24,064 3.1% 24,882 3.3%
Interest on obligations under leases ......................................................... 9,720 9,829
Earnings before income taxes ................................................................... 28,259 28,887
Income tax expense .................................................................................. 10,294 7,526
Net earnings ............................................................................................. 17,965$ 21,361$
Cost of food, restaurant operating costs and rent expense are expressed as a percentage of net sales.
General and administrative, marketing, other expenses and depreciation and amortization are expressed as a percentage of total revenue.
Fiscal Year
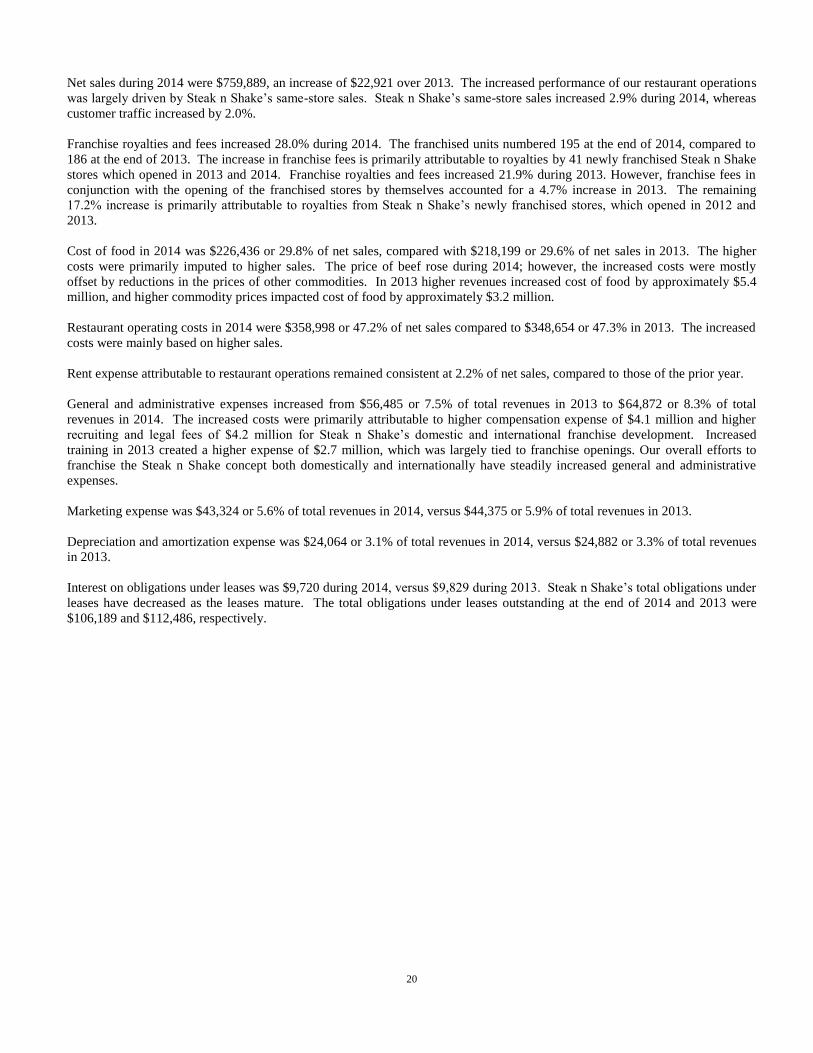
20
Net sales during 2014 were $759,889, an increase of $22,921 over 2013. The increased performance of our restaurant operations
was largely driven by Steak n Shake’s same-store sales. Steak n Shake’s same-store sales increased 2.9% during 2014, whereas
customer traffic increased by 2.0%.
Franchise royalties and fees increased 28.0% during 2014. The franchised units numbered 195 at the end of 2014, compared to
186 at the end of 2013. The increase in franchise fees is primarily attributable to royalties by 41 newly franchised Steak n Shake
stores which opened in 2013 and 2014. Franchise royalties and fees increased 21.9% during 2013. However, franchise fees in
conjunction with the opening of the franchised stores by themselves accounted for a 4.7% increase in 2013. The remaining
17.2% increase is primarily attributable to royalties from Steak n Shake’s newly franchised stores, which opened in 2012 and
2013.
Cost of food in 2014 was $226,436 or 29.8% of net sales, compared with $218,199 or 29.6% of net sales in 2013. The higher
costs were primarily imputed to higher sales. The price of beef rose during 2014; however, the increased costs were mostly
offset by reductions in the prices of other commodities. In 2013 higher revenues increased cost of food by approximately $5.4
million, and higher commodity prices impacted cost of food by approximately $3.2 million.
Restaurant operating costs in 2014 were $358,998 or 47.2% of net sales compared to $348,654 or 47.3% in 2013. The increased
costs were mainly based on higher sales.
Rent expense attributable to restaurant operations remained consistent at 2.2% of net sales, compared to those of the prior year.
General and administrative expenses increased from $56,485 or 7.5% of total revenues in 2013 to $64,872 or 8.3% of total
revenues in 2014. The increased costs were primarily attributable to higher compensation expense of $4.1 million and higher
recruiting and legal fees of $4.2 million for Steak n Shake’s domestic and international franchise development. Increased
training in 2013 created a higher expense of $2.7 million, which was largely tied to franchise openings. Our overall efforts to
franchise the Steak n Shake concept both domestically and internationally have steadily increased general and administrative
expenses.
Marketing expense was $43,324 or 5.6% of total revenues in 2014, versus $44,375 or 5.9% of total revenues in 2013.
Depreciation and amortization expense was $24,064 or 3.1% of total revenues in 2014, versus $24,882 or 3.3% of total revenues
in 2013.
Interest on obligations under leases was $9,720 during 2014, versus $9,829 during 2013. Steak n Shake’s total obligations under
leases have decreased as the leases mature. The total obligations under leases outstanding at the end of 2014 and 2013 were
$106,189 and $112,486, respectively.
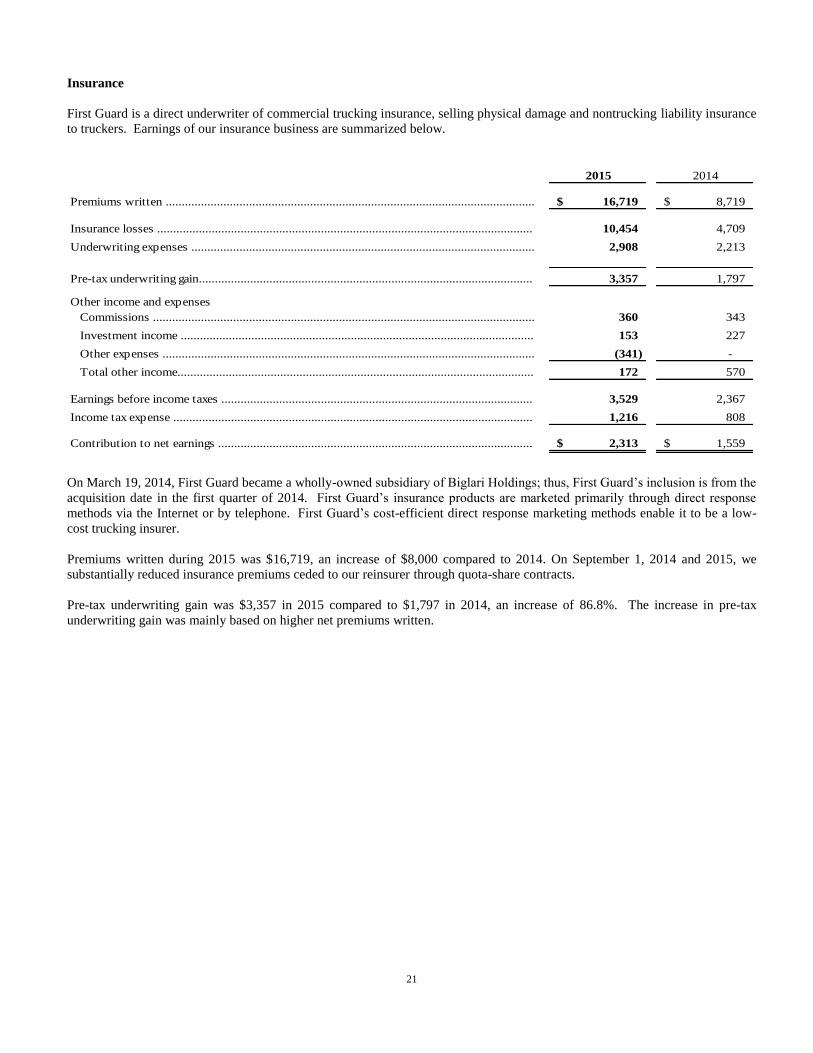
21
Insurance
First Guard is a direct underwriter of commercial trucking insurance, selling physical damage and nontrucking liability insurance
to truckers. Earnings of our insurance business are summarized below.
2015 2014
Premiums written ................................................................................................................... 16,719$ 8,719$
Insurance losses ..................................................................................................................... 10,454 4,709
Underwriting expenses ........................................................................................................... 2,908 2,213
Pre-tax underwriting gain........................................................................................................ 3,357 1,797
Other income and expenses
Commissions ....................................................................................................................... 360 343
Investment income .............................................................................................................. 153 227
Other expenses .................................................................................................................... (341) -
Total other income............................................................................................................... 172 570
Earnings before income taxes ................................................................................................. 3,529 2,367
Income tax expense ................................................................................................................ 1,216 808
Contribution to net earnings .................................................................................................. 2,313$ 1,559$
On March 19, 2014, First Guard became a wholly-owned subsidiary of Biglari Holdings; thus, First Guard’s inclusion is from the
acquisition date in the first quarter of 2014. First Guard’s insurance products are marketed primarily through direct response
methods via the Internet or by telephone. First Guard’s cost-efficient direct response marketing methods enable it to be a low-
cost trucking insurer.
Premiums written during 2015 was $16,719, an increase of $8,000 compared to 2014. On September 1, 2014 and 2015, we
substantially reduced insurance premiums ceded to our reinsurer through quota-share contracts.
Pre-tax underwriting gain was $3,357 in 2015 compared to $1,797 in 2014, an increase of 86.8%. The increase in pre-tax
underwriting gain was mainly based on higher net premiums written.

22
Media
Maxim’s business lies principally in media and licensing. Earnings of our media operations are summarized below.
2015 2014
Revenue .................................................................................................................................. 24,482$ 15,169$
Media cost of sales ................................................................................................................ 35,614 28,660
Selling, general and administrative expenses .......................................................................... 6,677 7,626
Depreciation and amortization................................................................................................ 296 362
Loss before income taxes ....................................................................................................... (18,105) (21,479)
Income tax benefit .................................................................................................................. (6,646) (8,075)
Contribution to net earnings .................................................................................................. (11,459)$ (13,404)$
On February 27, 2014, we acquired the assets of Maxim; thus, Maxim’s inclusion is from the acquisition date in the first quarter
of 2014.
We acquired Maxim with the idea of transforming the brand. We continue to make investments into the brand, many of which
are reflected in the reported expenses. We have been rebuilding Maxim’s media business, both in print and in digital, as well as
developing a licensing business. We have been making adjustments in operations to reduce dramatically the high fixed costs
inherent in the media business. The magazine developed the Maxim brand, a franchise we are utilizing to build cash-generating
businesses, namely licensing royalties related to consumer products, services, and events.
We have taken the risk on the belief that the probability for gain in value more than justifies the risk of loss.
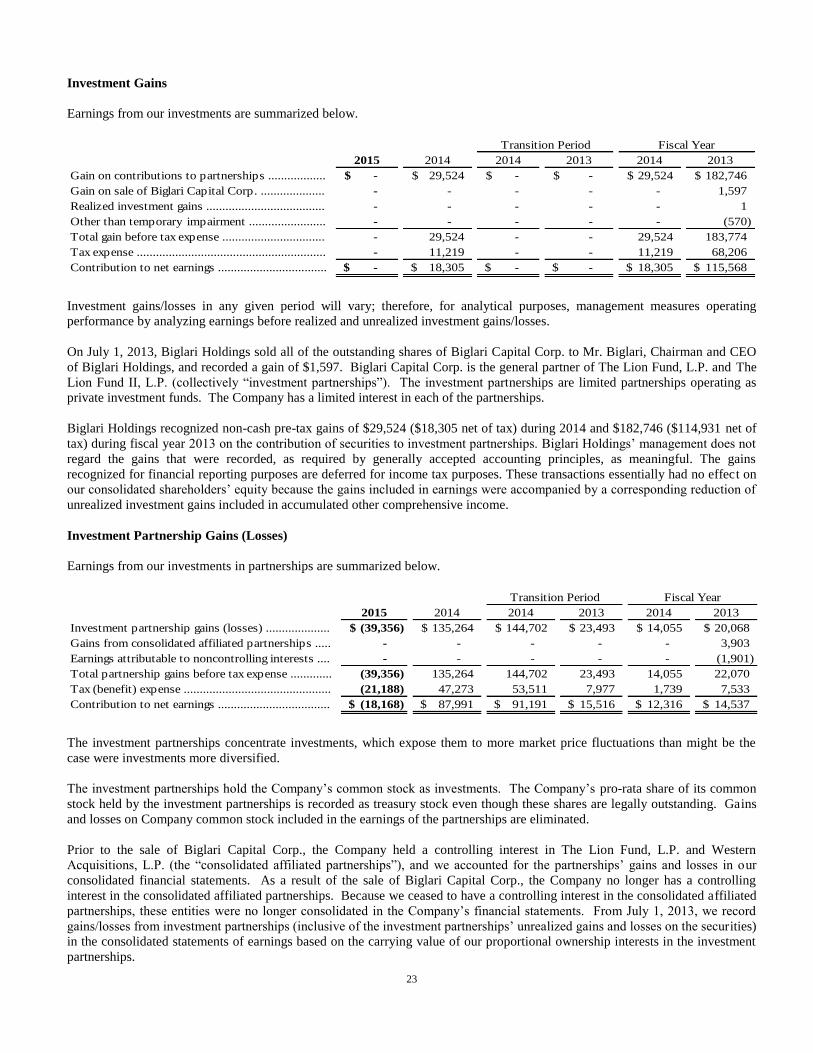
23
Investment Gains
Earnings from our investments are summarized below.
2015 2014 2014 2013 2014 2013
Gain on contributions to partnerships .................. -$ 29,524$ -$ -$ 29,524$ 182,746$
Gain on sale of Biglari Capital Corp. .................... - - - - - 1,597
Realized investment gains ..................................... - - - - - 1
Other than temporary impairment ........................ - - - - - (570)
Total gain before tax expense ................................ - 29,524 - - 29,524 183,774
Tax expense ........................................................... - 11,219 - - 11,219 68,206
Contribution to net earnings .................................. -$ 18,305$ -$ -$ 18,305$ 115,568$
Transition Period Fiscal Year
Investment gains/losses in any given period will vary; therefore, for analytical purposes, management measures operating
performance by analyzing earnings before realized and unrealized investment gains/losses.
On July 1, 2013, Biglari Holdings sold all of the outstanding shares of Biglari Capital Corp. to Mr. Biglari, Chairman and CEO
of Biglari Holdings, and recorded a gain of $1,597. Biglari Capital Corp. is the general partner of The Lion Fund, L.P. and The
Lion Fund II, L.P. (collectively “investment partnerships”). The investment partnerships are limited partnerships operating as
private investment funds. The Company has a limited interest in each of the partnerships.
Biglari Holdings recognized non-cash pre-tax gains of $29,524 ($18,305 net of tax) during 2014 and $182,746 ($114,931 net of
tax) during fiscal year 2013 on the contribution of securities to investment partnerships. Biglari Holdings’ management does not
regard the gains that were recorded, as required by generally accepted accounting principles, as meaningful. The gains
recognized for financial reporting purposes are deferred for income tax purposes. These transactions essentially had no effect on
our consolidated shareholders’ equity because the gains included in earnings were accompanied by a corresponding reduction of
unrealized investment gains included in accumulated other comprehensive income.
Investment Partnership Gains (Losses)
Earnings from our investments in partnerships are summarized below.
2015 2014 2014 2013 2014 2013
Investment partnership gains (losses) .................... (39,356)$ 135,264$ 144,702$ 23,493$ 14,055$ 20,068$
Gains from consolidated affiliated partnerships ..... - - - - - 3,903
Earnings attributable to noncontrolling interests .... - - - - - (1,901)
Total partnership gains before tax expense ............. (39,356) 135,264 144,702 23,493 14,055 22,070
Tax (benefit) expense .............................................. (21,188) 47,273 53,511 7,977 1,739 7,533
Contribution to net earnings ................................... (18,168)$ 87,991$ 91,191$ 15,516$ 12,316$ 14,537$
Transition Period Fiscal Year
The investment partnerships concentrate investments, which expose them to more market price fluctuations than might be the
case were investments more diversified.
The investment partnerships hold the Company’s common stock as investments. The Company’s pro-rata share of its common
stock held by the investment partnerships is recorded as treasury stock even though these shares are legally outstanding. Gains
and losses on Company common stock included in the earnings of the partnerships are eliminated.
Prior to the sale of Biglari Capital Corp., the Company held a controlling interest in The Lion Fund, L.P. and Western
Acquisitions, L.P. (the “consolidated affiliated partnerships”), and we accounted for the partnerships’ gains and losses in our
consolidated financial statements. As a result of the sale of Biglari Capital Corp., the Company no longer has a controlling
interest in the consolidated affiliated partnerships. Because we ceased to have a controlling interest in the consolidated affiliated
partnerships, these entities were no longer consolidated in the Company’s financial statements. From July 1, 2013, we record
gains/losses from investment partnerships (inclusive of the investment partnerships’ unrealized gains and losses on the securities)
in the consolidated statements of earnings based on the carrying value of our proportional ownership interests in the investment
partnerships.
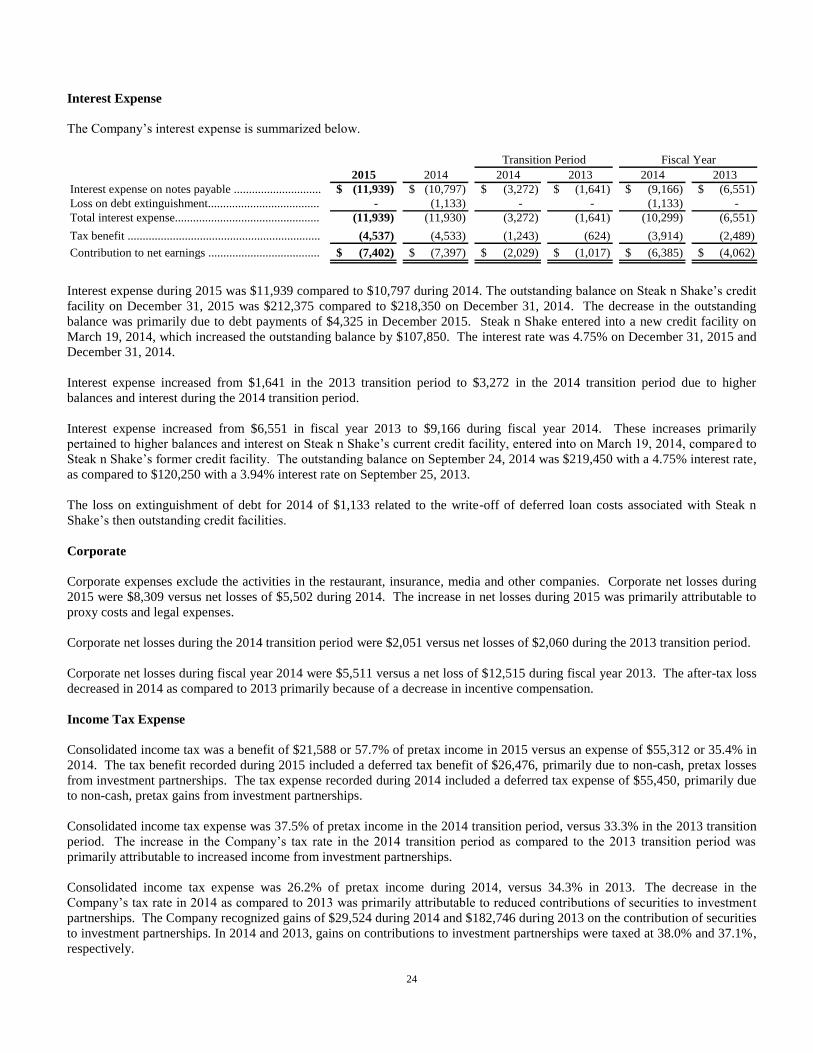
24
Interest Expense
The Company’s interest expense is summarized below.
2015 2014 2014 2013 2014 2013
Interest expense on notes payable ............................. (11,939)$ (10,797)$ (3,272)$ (1,641)$ (9,166)$ (6,551)$
Loss on debt extinguishment..................................... - (1,133) - - (1,133) -
Total interest expense................................................ (11,939) (11,930) (3,272) (1,641) (10,299) (6,551)
Tax benefit ................................................................ (4,537) (4,533) (1,243) (624) (3,914) (2,489)
Contribution to net earnings ..................................... (7,402)$ (7,397)$ (2,029)$ (1,017)$ (6,385)$ (4,062)$
Transition Period Fiscal Year
Interest expense during 2015 was $11,939 compared to $10,797 during 2014. The outstanding balance on Steak n Shake’s credit
facility on December 31, 2015 was $212,375 compared to $218,350 on December 31, 2014. The decrease in the outstanding
balance was primarily due to debt payments of $4,325 in December 2015. Steak n Shake entered into a new credit facility on
March 19, 2014, which increased the outstanding balance by $107,850. The interest rate was 4.75% on December 31, 2015 and
December 31, 2014.
Interest expense increased from $1,641 in the 2013 transition period to $3,272 in the 2014 transition period due to higher
balances and interest during the 2014 transition period.
Interest expense increased from $6,551 in fiscal year 2013 to $9,166 during fiscal year 2014. These increases primarily
pertained to higher balances and interest on Steak n Shake’s current credit facility, entered into on March 19, 2014, compared to
Steak n Shake’s former credit facility. The outstanding balance on September 24, 2014 was $219,450 with a 4.75% interest rate,
as compared to $120,250 with a 3.94% interest rate on September 25, 2013.
The loss on extinguishment of debt for 2014 of $1,133 related to the write-off of deferred loan costs associated with Steak n
Shake’s then outstanding credit facilities.
Corporate
Corporate expenses exclude the activities in the restaurant, insurance, media and other companies. Corporate net losses during
2015 were $8,309 versus net losses of $5,502 during 2014. The increase in net losses during 2015 was primarily attributable to
proxy costs and legal expenses.
Corporate net losses during the 2014 transition period were $2,051 versus net losses of $2,060 during the 2013 transition period.
Corporate net losses during fiscal year 2014 were $5,511 versus a net loss of $12,515 during fiscal year 2013. The after-tax loss
decreased in 2014 as compared to 2013 primarily because of a decrease in incentive compensation.
Income Tax Expense
Consolidated income tax was a benefit of $21,588 or 57.7% of pretax income in 2015 versus an expense of $55,312 or 35.4% in
2014. The tax benefit recorded during 2015 included a deferred tax benefit of $26,476, primarily due to non-cash, pretax losses
from investment partnerships. The tax expense recorded during 2014 included a deferred tax expense of $55,450, primarily due
to non-cash, pretax gains from investment partnerships.
Consolidated income tax expense was 37.5% of pretax income in the 2014 transition period, versus 33.3% in the 2013 transition
period. The increase in the Company’s tax rate in the 2014 transition period as compared to the 2013 transition period was
primarily attributable to increased income from investment partnerships.
Consolidated income tax expense was 26.2% of pretax income during 2014, versus 34.3% in 2013. The decrease in the
Company’s tax rate in 2014 as compared to 2013 was primarily attributable to reduced contributions of securities to investment
partnerships. The Company recognized gains of $29,524 during 2014 and $182,746 during 2013 on the contribution of securities
to investment partnerships. In 2014 and 2013, gains on contributions to investment partnerships were taxed at 38.0% and 37.1%,
respectively.
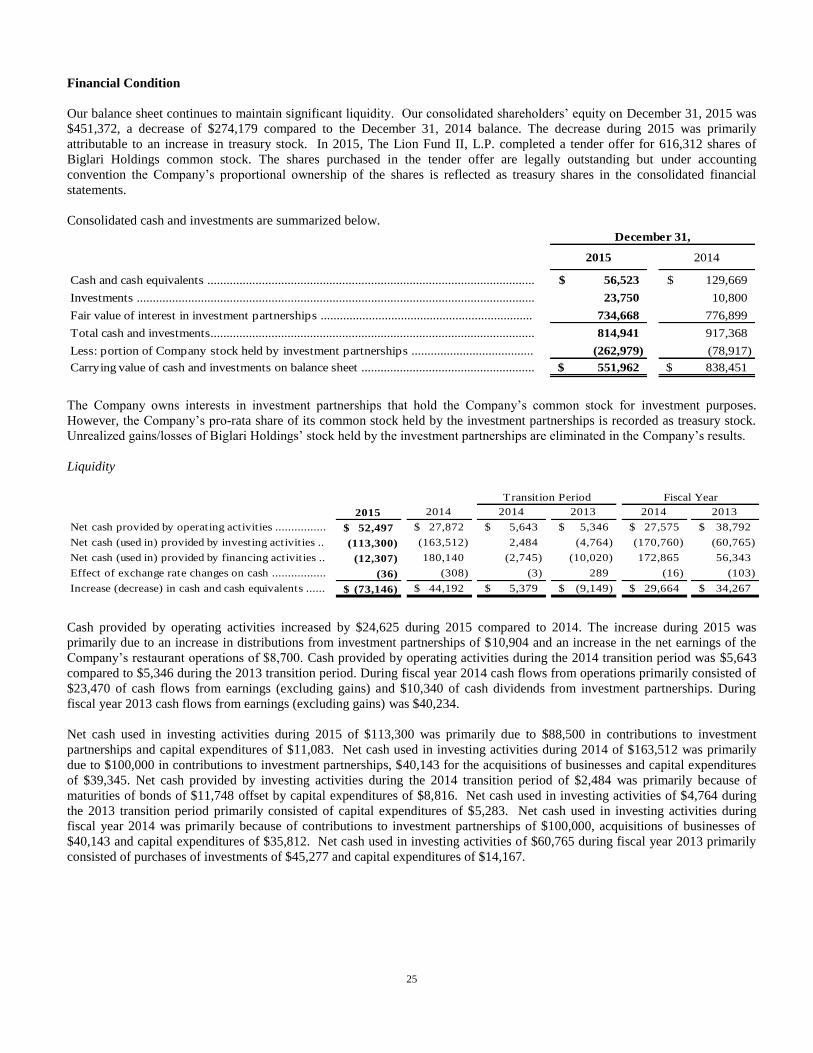
25
Financial Condition
Our balance sheet continues to maintain significant liquidity. Our consolidated shareholders’ equity on December 31, 2015 was
$451,372, a decrease of $274,179 compared to the December 31, 2014 balance. The decrease during 2015 was primarily
attributable to an increase in treasury stock. In 2015, The Lion Fund II, L.P. completed a tender offer for 616,312 shares of
Biglari Holdings common stock. The shares purchased in the tender offer are legally outstanding but under accounting
convention the Company’s proportional ownership of the shares is reflected as treasury shares in the consolidated financial
statements.
Consolidated cash and investments are summarized below.
2015 2014
Cash and cash equivalents ...................................................................................................... 56,523$ 129,669$
Investments ............................................................................................................................ 23,750 10,800
Fair value of interest in investment partnerships .................................................................. 734,668 776,899
Total cash and investments..................................................................................................... 814,941 917,368
Less: portion of Company stock held by investment partnerships ...................................... (262,979) (78,917)
Carrying value of cash and investments on balance sheet ...................................................... 551,962$ 838,451$
December 31,
The Company owns interests in investment partnerships that hold the Company’s common stock for investment purposes.
However, the Company’s pro-rata share of its common stock held by the investment partnerships is recorded as treasury stock.
Unrealized gains/losses of Biglari Holdings’ stock held by the investment partnerships are eliminated in the Company’s results.
Liquidity
2015 2014 2014 2013 2014 2013
Net cash provided by operating activities ................ 52,497$ 27,872$ 5,643$ 5,346$ 27,575$ 38,792$
Net cash (used in) provided by investing activities .. (113,300) (163,512) 2,484 (4,764) (170,760) (60,765)
Net cash (used in) provided by financing activities .. (12,307) 180,140 (2,745) (10,020) 172,865 56,343
Effect of exchange rate changes on cash ................. (36) (308) (3) 289 (16) (103)
Increase (decrease) in cash and cash equivalents ...... (73,146)$ 44,192$ 5,379$ (9,149)$ 29,664$ 34,267$
Transition Period Fiscal Year
Cash provided by operating activities increased by $24,625 during 2015 compared to 2014. The increase during 2015 was
primarily due to an increase in distributions from investment partnerships of $10,904 and an increase in the net earnings of the
Company’s restaurant operations of $8,700. Cash provided by operating activities during the 2014 transition period was $5,643
compared to $5,346 during the 2013 transition period. During fiscal year 2014 cash flows from operations primarily consisted of
$23,470 of cash flows from earnings (excluding gains) and $10,340 of cash dividends from investment partnerships. During
fiscal year 2013 cash flows from earnings (excluding gains) was $40,234.
Net cash used in investing activities during 2015 of $113,300 was primarily due to $88,500 in contributions to investment
partnerships and capital expenditures of $11,083. Net cash used in investing activities during 2014 of $163,512 was primarily
due to $100,000 in contributions to investment partnerships, $40,143 for the acquisitions of businesses and capital expenditures
of $39,345. Net cash provided by investing activities during the 2014 transition period of $2,484 was primarily because of
maturities of bonds of $11,748 offset by capital expenditures of $8,816. Net cash used in investing activities of $4,764 during
the 2013 transition period primarily consisted of capital expenditures of $5,283. Net cash used in investing activities during
fiscal year 2014 was primarily because of contributions to investment partnerships of $100,000, acquisitions of businesses of
$40,143 and capital expenditures of $35,812. Net cash used in investing activities of $60,765 during fiscal year 2013 primarily
consisted of purchases of investments of $45,277 and capital expenditures of $14,167.

26
During 2015 and the 2014 transition period we incurred debt payments of $12,529 and $2,748, respectively. During the 2013
transition period we incurred debt payments of $17,020 and received $7,000 from a revolving credit facility. During calendar
year 2014 and fiscal year 2014 we generated cash from financing activities which primarily resulted from an increase in Steak n
Shake borrowings of $101,411 and proceeds from an equity offering of $85,873. $50,000 of Steak n Shake’s increased
borrowings were used to pay a cash dividend to Biglari Holdings and the remaining loan proceeds will be used by Steak n Shake
for working capital and general corporate purposes. During fiscal year 2013 we generated $75,595 of cash from financing
activities from an equity offering.
We intend to meet the working capital needs of our operating subsidiaries principally through anticipated cash flows generated
from operations, cash on hand, existing credit facilities, and the sale of excess properties and investments. We continually review
available financing alternatives.
Steak n Shake Credit Facility
On March 19, 2014, Steak n Shake and its subsidiaries entered into a new credit agreement. This credit agreement provides for a
senior secured term loan facility in an aggregate principal amount of $220,000 and a senior secured revolving credit facility in an
aggregate principal amount of up to $30,000.
The term loan is scheduled to mature on March 19, 2021. It amortizes at an annual rate of 1.0% in equal quarterly installments,
beginning June 30, 2014, at 0.25% of the original principal amount of the term loan, subject to mandatory prepayments from
excess cash flow, asset sales and other events described in the credit agreement. The balance will be due at maturity. The
revolver will be available on a revolving basis until March 19, 2019.
Steak n Shake has the right to request an incremental term loan facility from participating lenders and/or eligible assignees at any
time, up to an aggregate total principal amount not to exceed $70,000 if certain customary conditions within the credit agreement
are met.
Borrowings bear interest at a rate per annum equal to a base rate or a Eurodollar rate (minimum of 1%) plus an applicable
margin. Interest on the term loan is based on a Eurodollar rate plus an applicable margin of 3.75% or on the prime rate plus an
applicable margin of 2.75%. Interest on loans under the revolver is based on a Eurodollar rate plus an applicable margin ranging
from 2.75% to 4.25% or on the prime rate plus an applicable margin ranging from 1.75% to 3.25%. The applicable margins on
revolver loans are contingent on Steak n Shake’s total leverage ratio. The revolver also carries a commitment fee ranging from
0.40% to 0.50% per annum, according to Steak n Shake’s total leverage ratio, on the unused portion of the revolver.
As of December 31, 2015, the interest rate on the term loan was 4.75%.
The credit agreement includes customary affirmative and negative covenants and events of default, as well as a financial
maintenance covenant, solely with respect to the revolver, relating to the maximum total leverage ratio. As of December 31,
2015, we were in compliance with all covenants. Steak n Shake’s credit facility contains restrictions on its ability to pay
dividends to Biglari Holdings.
Both the term loan and the revolver have been secured by first priority security interests on substantially all the assets of Steak n
Shake. Biglari Holdings is not a guarantor under the credit facility. Approximately $118,589 of the proceeds of the term loan
were used to repay all outstanding amounts under Steak n Shake’s former credit facility and to pay related fees and expenses,
$50,000 of such proceeds were used to pay a cash dividend to Biglari Holdings, and the remaining term loan proceeds of
approximately $51,411 are being used by Steak n Shake for working capital and general corporate purposes. At December 31,
2015, $212,375 was outstanding under the term loan, and no amount is outstanding under the revolver.
Steak n Shake had $10,188 in standby letters of credit outstanding as of December 31, 2015 and December 31, 2014.
Western Revolver
As of December 31, 2015, Western has $786 due June 13, 2016.
Interest Rate Swap
During 2013, Steak n Shake entered into an interest rate swap for a notional amount of $65,000, which terminated on September
30, 2015. During fiscal year 2011, Steak n Shake entered into an interest rate swap agreement for a notional amount of $20,000.
The notional amount decreases $1,000 quarterly through its maturity on February 15, 2016. The notional amount of the interest
rate swap was $1,000 on December 31, 2015.

27
Critical Accounting Policies Management’s discussion and analysis of financial condition and results of operations is based upon our consolidated financial
statements, which have been prepared in accordance with accounting principles generally accepted in the United States. Certain
accounting policies require management to make estimates and judgments concerning transactions that will be settled several
years in the future. Amounts recognized in our consolidated financial statements from such estimates are necessarily based on
numerous assumptions involving varying and potentially significant degrees of judgment and uncertainty. Accordingly, the
amounts currently reflected in our consolidated financial statements will likely increase or decrease in the future as additional
information becomes available.
We believe the following critical accounting policies represent our more significant judgments and estimates used in preparation
of our consolidated financial statements. Given the current composition of our business, we do not believe that any accounting
policies related to our insurance or media businesses were critical to the preparation of our consolidated financial statements as
of and for the year ended December 31, 2015.
Consolidation
The consolidated financial statements include the accounts of (i) Biglari Holdings Inc., (ii) the wholly-and majority-owned
subsidiaries of Biglari Holdings Inc. in which control can be exercised and (iii) limited partnership investment entities in which
we have a controlling interest as the general partner. In evaluating whether we have a controlling interest in entities in which we
would consolidate, we consider the following: (1) for voting interest entities, we consolidate those entities in which we own a
majority of the voting interests; and (2) for limited partnership entities, we consolidate those entities if we are the general partner
of such entities and for which no substantive removal rights exist. The analysis as to whether to consolidate an entity is subject
to a significant amount of judgment. Some of the criteria considered include the determination as to the degree of control over an
entity by its various equity holders and the design of the entity.
Before the sale of Biglari Capital and liquidation of Western Acquisitions, L.P., the Company consolidated its affiliated
partnerships in its consolidated financial statements, which included the accounts of (i) the Company, (ii) its wholly-owned
subsidiaries Biglari Capital, Steak n Shake, and Western, and (iii) The Lion Fund, L.P. and Western Acquisitions, L.P. (the
“consolidated affiliated partnerships”), in which the Company had a substantive controlling interest. As a result of the sale of
Biglari Capital and the related liquidation of Western Acquisitions, L.P., the Company has ceased to have a controlling interest
in the consolidated affiliated partnerships, which, accordingly, are no longer consolidated in the Company’s financial statements.
Beginning July 1, 2013, the consolidated financial statements only include the accounts of the Company and its wholly-owned
subsidiaries. All intercompany accounts and transactions are eliminated in consolidation.
Prior to July 1, 2013 the consolidated affiliated partnerships’ assets and liabilities were consolidated on the consolidated balance
sheet even though outside limited partners had majority ownership in the consolidated affiliated partnerships. The Company did
not guarantee any of the liabilities of its subsidiaries that were serving as general partners to these consolidated affiliated
partnerships.
Beginning July 1, 2013, our interests in the investment partnerships are accounted for as equity method investments because of
our retained limited partner interest in the investment partnerships. The Company records gains from investment partnerships
(inclusive of the investment partnerships’ unrealized gains and losses on their securities) in the consolidated statement of
earnings based on our proportional ownership interest in the investment partnerships.
Impairment of Long-lived Assets
We review company-operated restaurants for impairment on a restaurant-by-restaurant basis when events or circumstances
indicate a possible impairment. We test for impairment by comparing the carrying value of the asset to the undiscounted future
cash flows expected to be generated by the asset. If the total estimated future cash flows are less than the carrying amount of the
asset, the carrying value is written down to the estimated fair value, and a loss is recognized in earnings. The future cash flows
expected to be generated by an asset requires significant judgment regarding future performance of the asset, fair market value if
the asset were to be sold, and other financial and economic assumptions.
28
Insurance Reserves
We currently self-insure a significant portion of expected losses under our workers’ compensation, general liability, directors’
and officers’ liability, and auto liability insurance programs. For certain programs, we purchase reinsurance for individual and
aggregate claims that exceed predetermined limits. We record a liability for all unresolved claims and our estimates of incurred
but not reported (“IBNR”) claims at the anticipated cost to us. The liability estimate is based on information received from
insurance companies, combined with management’s judgments regarding frequency and severity of claims, claims development
history, and settlement practices. Significant judgment is required to estimate IBNR claims as parties have yet to assert a claim,
and therefore the degree to which injuries have been incurred and the related costs have not yet been determined. Additionally,
estimates about future costs involve significant judgment regarding legislation, case jurisdictions, and other matters.
We self-insure our group health insurance risk. We record a liability for our group health insurance for all applied claims and our
estimate of claims incurred but not yet reported. Our estimate is based on information received from our insurance company and
claims processing practices.
Our reserves for self-insured liabilities at December 31, 2015 and December 31, 2014 were $8,485 and $9,787, respectively.
Income Taxes
We record deferred tax assets or liabilities based on differences between financial reporting and tax basis of assets and liabilities
using currently enacted rates and laws that will be in effect when the differences are expected to reverse. We record deferred tax
assets to the extent we believe there will be sufficient future taxable income to utilize those assets prior to their expiration. To the
extent deferred tax assets would be unable to be utilized, we would record a valuation allowance against the unrealizable amount
and record that amount as a charge against earnings. Due to changing tax laws and state income tax rates, significant judgment is
required to estimate the effective tax rate expected to apply to tax differences that are expected to reverse in the future. We must
also make estimates about the sufficiency of taxable income in future periods to offset any deductions related to deferred tax
assets currently recorded. Based on 2015 results, a change of one percentage point in the annual effective tax rate would have an
impact of $374 on net earnings.
We recognize the tax benefit from an uncertain tax position only if it is more likely than not that the tax position will be
sustained on examination by the taxing authorities, based on the technical merits of the position. The tax benefits recognized in
the financial statements from such a position are measured based on the largest benefit that has a greater than 50% likelihood of
being realized upon ultimate resolution.
Goodwill and Other Intangible Assets
We are required to assess goodwill and any indefinite-lived intangible assets for impairment annually, or more frequently if
circumstances indicate impairment may have occurred. When evaluating goodwill for impairment, we may first perform a
qualitative assessment to determine whether it is more likely than not that a reporting unit is impaired. If we do not perform a
qualitative assessment, or if we determine that it is not more likely than not that the fair value of the reporting unit exceeds its
carrying amount, we test for potential impairment using a two-step approach. The first step is the estimation of fair value of each
reporting unit. If step one indicates that impairment potentially exists, the second step is performed to measure the amount of
impairment, if any. Goodwill impairment exists when the estimated fair value of goodwill is less than its carrying value. The
valuation methodology and underlying financial information included in our determination of fair value require significant
management judgments. We use both market and income approaches to derive fair value. The judgments in these two approaches
include, but are not limited to, comparable market multiples, long-term projections of future financial performance, and the
selection of appropriate discount rates used to determine the present value of future cash flows. Changes in such estimates or the
application of alternative assumptions could produce significantly different results.
Leases
Restaurant operations lease certain properties under operating leases. Many of these lease agreements contain rent holidays, rent
escalation clauses and/or contingent rent provisions. Rent expense is recognized on a straight-line basis over the expected lease
term, including cancelable option periods when failure to exercise such options would result in an economic penalty. We use a
time period for straight-line rent expense calculation that equals or exceeds the time period used for depreciation. In addition, the
rent commencement date of the lease term is the earlier of the date when they become legally obligated for the rent payments or
the date when they take access to the grounds for build out. Accounting for leases involves significant management judgment.
29
Effects of Governmental Regulations and Inflation Most restaurant operations employees are paid hourly rates related to minimum wage laws. Any increase in the legal minimum
wage would directly increase our operating costs. We are also subject to various laws related to zoning, land use, health and
safety standards, working conditions, and accessibility standards. Any changes in these laws that require improvements to our
restaurants would increase our operating costs.
Inflation in food, labor, fringe benefits, energy costs, transportation costs and other operating costs directly affect our operations.
The federal healthcare reform legislation that became law in March 2010 (known as the Patient Protection and Affordable Care
Act [“PPACA”]) mandates menu labeling of certain nutritional aspects of restaurant menu items such as caloric, sugar, sodium,
and fat content. Altering our recipes in response to such legislation could increase our costs and/or change the flavor profile of
our menu offerings which could have an adverse impact on our results of operations. Additionally, if our customers perceive our
menu items to contain unhealthy caloric, sugar, sodium, or fat content, our results of operations could be further adversely
affected.
Additionally, minimum employee health care coverage mandated by state or federal legislation, such as the PPACA, could
significantly increase our employee health benefit costs or require us to alter the benefits we provide to our employees. While we
are assessing the potential impact the PPACA will have on our business, certain of the mandates in the legislation are not yet
effective. If our employee health benefit costs increase, we cannot provide assurance that we will be able to offset these costs
through increased revenue or reductions in other costs, which could have an adverse effect on our results of operations and
financial condition.
Contractual Obligations
Our significant contractual obligations and commitments as of December 31, 2015 are shown in the following table.
Payments due by period
Contractual Obligations
Less
than
1 year 1 – 3
years 3 – 5
years More than
5 years Total
Long-term debt (1)
(2)
....................................................................... $ 13,982
$ 26,179 $ 25,908
$ 204,045 — $ 270,114
Capital leases and finance obligations (1)
........................................ 14,843 23,657 13,321 6,832 58,653
Operating leases (3)
......................................................................... 16,993 30,212 25,860 57,940 131,005
Purchase commitments (4)
............................................................... 4,973 2,623 — — 7,596
Other long-term liabilities (5)
........................................................... — — — 2,184 2,184
Total ................................................................................................ $ 50,791 $ 82,671 $ 65,089 $ 271,001 $ 469,552
(1) Includes principal and interest and assumes payoff of indebtedness at maturity date.
(2) Includes outstanding borrowings under Steak n Shake’s and Western’s credit facilities.
(3) Excludes amounts to be paid for contingent rents. Includes amounts to be paid for subleased properties.
(4) Includes agreements to purchase goods or services that are enforceable and legally binding on us and that specify all
significant terms. Excludes agreements that are cancelable without penalty. (5)
Includes liabilities for Non-Qualified Deferred Compensation Plan. Excludes our unrecognized tax benefits of $413 as of
December 31, 2015 because we cannot make a reliable estimate of the timing of cash payments.
Off-Balance Sheet Arrangements We have no off-balance sheet arrangements other than operating leases entered into in the normal course of business.
Recently Issued Accounting Pronouncements For detailed information regarding recently issued accounting pronouncements and the expected impact on our consolidated
financial statements, see Note 1, “Summary of Significant Accounting Policies” in the accompanying notes to consolidated
financial statements included in Part II, Item 8 of this report on form 10-K.
30
Cautionary Note Regarding Forward-Looking Statements
This report includes forward-looking statements within the meaning of the Private Securities Litigation Reform Act of 1995. In
general, forward-looking statements include estimates of future revenues, cash flows, capital expenditures, or other financial
items, and assumptions underlying any of the foregoing. Forward-looking statements reflect management’s current expectations
regarding future events and use words such as “anticipate,” “believe,” “expect,” “may,” and other similar terminology. A
forward-looking statement is neither a prediction nor a guarantee of future events or circumstances, and those future events or
circumstances may not occur. Investors should not place undue reliance on the forward-looking statements, which speak only as
of the date of this report. These forward-looking statements are all based on currently available operating, financial, and
competitive information and are subject to various risks and uncertainties. Our actual future results and trends may differ
materially depending on a variety of factors, many beyond our control, including, but not limited to, the risks and uncertainties
described in Item 1A, Risk Factors set forth above. We undertake no obligation to publicly update or revise them, except as may
be required by law.
Item 7A.
Quantitative and Qualitative Disclosures About Market Risk
The majority of our investments are conducted through investment partnerships which generally hold common stocks. We also
hold marketable securities directly. Through investments in the investment partnerships we hold a concentrated position in the
common stock of Cracker Barrel Old Country Store, Inc. A significant decline in the general stock market or in the prices of
major investments may produce a large net loss and decrease in our consolidated shareholders’ equity. Decreases in values of
equity investments can have a materially adverse effect on our earnings and on consolidated shareholders’ equity.
We prefer to hold equity investments for very long periods of time so we are not troubled by short-term price volatility with
respect to our investments. Our interests in the investment partnerships are committed on a rolling 5-year basis, and any
distributions upon our withdrawal of funds will be paid out over two years (and may be paid in kind rather than in cash). Market
prices for equity securities are subject to fluctuation. Consequently the amount realized in the subsequent sale of an investment
may significantly differ from the reported market value. A hypothetical 10% increase or decrease in the market price of our
investments would result in a respective increase or decrease in the fair market value of our investments of $75,842, along with a
corresponding change in shareholders’ equity of approximately 11%.
Borrowings on Steak n Shake’s credit facility bear interest at a rate per annum equal to a base rate or a Eurodollar rate (minimum
of 1%) plus an applicable margin. Interest on the term loan is based on a Eurodollar rate plus an applicable margin of 3.75% or
on the prime rate plus an applicable margin of 2.75%. Interest on loans under the revolver is based on a Eurodollar rate plus an
applicable margin ranging from 2.75% to 4.25% or on the prime rate plus an applicable margin ranging from 1.75% to 3.25%. At
December 31, 2015, a hypothetical 100 basis point increase in short-term interest rates would have an impact of approximately
$300 on our net earnings.
We have had minimal exposure to foreign currency exchange rate fluctuations in 2015, in the 2014 transition period and in fiscal
years 2014 and 2013.

31
Item 8.
Financial Statements and Supplementary Data
REPORT OF INDEPENDENT REGISTERED PUBLIC ACCOUNTING FIRM
To the Board of Directors and Shareholders of
Biglari Holdings Inc.
San Antonio, Texas
We have audited the accompanying consolidated balance sheets of Biglari Holdings Inc. and subsidiaries (the "Company") as
of December 31, 2015 and 2014, and the related consolidated statements of earnings, comprehensive income, changes in
shareholders' equity, and cash flows for the year ended December 31, 2015, for the period from September 25, 2014 to
December 31, 2014, and years ended September 24, 2014 and September 25, 2013. Our audits also included the financial
statement schedule listed in the Index at Item 15. These financial statements and financial statement schedule are the
responsibility of the Company's management. Our responsibility is to express an opinion on these financial statements and
financial statement schedule based on our audits.
We conducted our audits in accordance with the standards of the Public Company Accounting Oversight Board (United
States). Those standards require that we plan and perform the audit to obtain reasonable assurance about whether the financial
statements are free of material misstatement. An audit includes examining, on a test basis, evidence supporting the amounts
and disclosures in the financial statements. An audit also includes assessing the accounting principles used and significant
estimates made by management, as well as evaluating the overall financial statement presentation. We believe that our audits
provide a reasonable basis for our opinion.
In our opinion, such consolidated financial statements present fairly, in all material respects, the financial position of Biglari
Holdings Inc. and subsidiaries as of December 31, 2015 and 2014, and the results of their operations and their cash flows for
the year ended December 31, 2015, the period from September 25, 2014 to December 31, 2014, and the years ended
September 24, 2014 and September 25, 2013, in conformity with accounting principles generally accepted in the United
States of America. Also, in our opinion, such financial statement schedule, when considered in relation to the basic
consolidated financial statements taken as a whole, presents fairly, in all material respects, the information set forth therein.
As discussed in Note 5 to the consolidated financial statements, during the years ended December 31, 2015, September 24,
2014 and September 25, 2013, the Company contributed cash and securities with an aggregate value of $88.5 million, $174.4
million and $377.6 million, respectively to investment partnerships. The Company and its subsidiaries have invested in the
investment partnerships in the form of limited partner interests. These investments are subject to a rolling five-year lock up
period under the terms of the respective partnership agreements for the investment partnerships.
We have also audited, in accordance with the standards of the Public Company Accounting Oversight Board (United States),
the Company's internal control over financial reporting as of December 31, 2015, based on Internal Control – Integrated
Framework (2013) issued by the Committee of Sponsoring Organizations of the Treadway Commission and our report dated
February 20, 2016 expressed an unqualified opinion on the Company's internal control over financial reporting.
/s/ DELOITTE & TOUCHE LLP
Indianapolis, Indiana
February 20, 2016
32
REPORT OF INDEPENDENT REGISTERED PUBLIC ACCOUNTING FIRM
To the Board of Directors and Shareholders of
Biglari Holdings Inc.
San Antonio, Texas
We have audited the internal control of Biglari Holdings Inc. and subsidiaries (the "Company") as of December 31, 2015,
based on criteria established in Internal Control – Integrated Framework (2013) issued by the Committee of Sponsoring
Organizations of the Treadway Commission. The Company’s management is responsible for maintaining effective internal
control over financial reporting and for its assessment of the effectiveness of internal control over financial reporting,
included in the accompanying Management’s Report on Internal Control Over Financial Reporting. Our responsibility is to
express an opinion on the Company’s internal control over financial reporting based on our audit.
We conducted our audits in accordance with the standards of the Public Company Accounting Oversight Board (United
States). Those standards require that we plan and perform the audit to obtain reasonable assurance about whether effective
internal control over financial reporting was maintained in all material respects. Our audit included obtaining an
understanding of internal control over financial reporting, assessing the risk that a material weakness exists, testing and
evaluating the design and operating effectiveness of internal control based on the assessed risk, and performing such other
procedures as we considered necessary in the circumstances. We believe that our audit provides a reasonable basis for our
opinion.
A company’s internal control over financial reporting is a process designed by, or under the supervision of, the company’s
principal financial officers, or persons performing similar functions, and effected by the company’s board of directors,
management, and other personnel to provide reasonable assurance regarding the reliability of financial reporting and the
preparation of financial statements for external purposes in accordance with generally accepted accounting principles. A
company’s internal control over financial reporting includes those policies and procedures that (1) pertain to the maintenance
of records that, in reasonable detail, accurately and fairly reflect the transactions and dispositions of the assets of the
company; (2) provide reasonable assurance that transactions are recorded as necessary to permit preparation of financial
statements in accordance with generally accepted accounting principles, and that receipts and expenditures of the company
are being made only in accordance with authorizations of management and directors of the company; and (3) provide
reasonable assurance regarding prevention or timely detection of unauthorized acquisition, use, or disposition of the
company’s assets that could have a material effect on the financial statements.
Because of the inherent limitations of internal control over financial reporting, including the possibility of collusion or
improper management override of controls, material misstatements due to error or fraud may not be prevented or detected on
a timely basis. Also, projections of any evaluation of the effectiveness of the internal control over financial reporting to future
periods are subject to the risk that the controls may become inadequate because of changes in conditions, or that the degree of
compliance with the policies or procedures may deteriorate.
In our opinion, the Company maintained, in all material respects, effective internal control over financial reporting as of
December 31, 2015, based on the criteria established in Internal control – Integrated Framework (2013) issued by the
Committee of Sponsoring Organizations of the Treadway Commission.
We have also audited, in accordance with the standards of the Public Company Accounting Oversight Board (United States),
the consolidated financial statements and financial statement schedule as of and for the year ended December 31, 2015 of the
Company and our report dated February 20, 2016 expressed an unqualified opinion on those financial statements and
financial statement schedule and included an emphasis of matter paragraph relating to the contribution of cash and securities
to the investment partnerships.
/s/ DELOITTE & TOUCHE LLP
Indianapolis, Indiana
February 20, 2016

33
Management’s Report on Internal Control Over Financial Reporting
The management of Biglari Holdings Inc. is responsible for establishing and maintaining adequate internal control over financial
reporting as defined in Rule 13a-15(f) under the Securities Exchange Act of 1934. Pursuant to the rules and regulations of the
Securities and Exchange Commission, internal control over financial reporting is a process designed by, or under the supervision
of, the Company’s principal executive and principal financial officers, and effected by the board of directors, management and
other personnel, to provide assurance regarding the reliability of financial reporting and the preparation of financial statements
for external purposes in accordance with accounting principles generally accepted in the United States of America and includes
those policies and procedures that:
• Pertain to the maintenance of records that in reasonable detail accurately and fairly reflect the transactions
and dispositions of assets of the Company;
• Provide reasonable assurance that transactions are recorded as necessary to permit preparation of the
financial statements in accordance with accounting principles generally accepted in the United States of
America, and that receipts and expenditures of the Company are being made only in accordance with
authorizations of management and directors of the Company; and
• Provide reasonable assurance regarding prevention or timely detection of unauthorized acquisition, use or
disposition of the Company’s assets that could have a material effect on the financial statements.
Because of inherent limitations, a system of internal control over financial reporting may not prevent or detect misstatements.
Projections of any evaluation of effectiveness to future periods are subject to the risk that controls may become inadequate
because of changes in conditions, or that the degree of compliance with the policies or procedures may deteriorate.
Management has evaluated the effectiveness of its internal control over financial reporting as of December 31, 2015 based on the
criteria set forth in a report entitled Internal Control — Integrated Framework (2013), issued by the Committee of Sponsoring
Organizations of the Treadway Commission (COSO). Based on this evaluation, we have concluded that, as of December 31,
2015, our internal control over financial reporting is effective based on those criteria.
The Company’s independent registered public accounting firm, Deloitte & Touche LLP, has issued an audit report on the
Company’s internal control over financial reporting as of December 31, 2015 and its report is included herein.
/s/ Sardar Biglari /s/ Bruce Lewis
Sardar Biglari
Chairman and Chief Executive Officer
Bruce Lewis
Controller
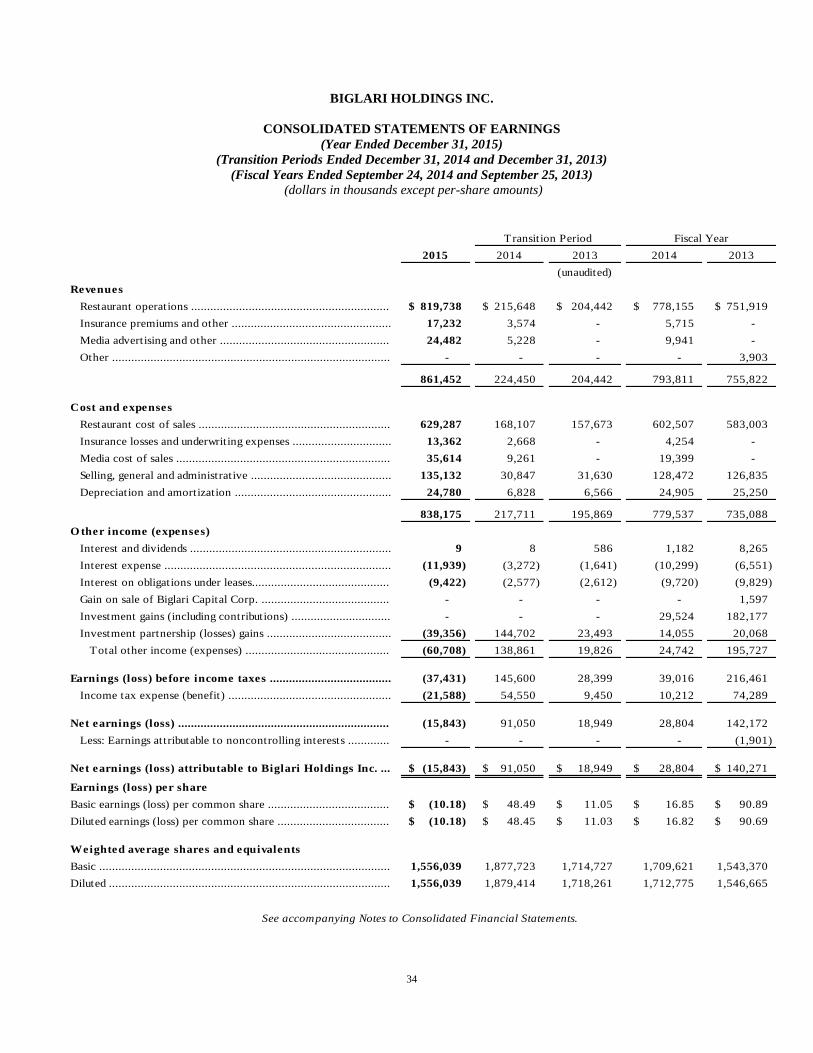
34
BIGLARI HOLDINGS INC.
CONSOLIDATED STATEMENTS OF EARNINGS
(Year Ended December 31, 2015)
(Transition Periods Ended December 31, 2014 and December 31, 2013)
(Fiscal Years Ended September 24, 2014 and September 25, 2013)
(dollars in thousands except per-share amounts)
2015 2014 2013 2014 2013
(unaudited)
Revenues
Restaurant operations .............................................................. 819,738$ 215,648$ 204,442$ 778,155$ 751,919$
Insurance premiums and other .................................................. 17,232 3,574 - 5,715 -
Media advertising and other ..................................................... 24,482 5,228 - 9,941 -
Other ....................................................................................... - - - - 3,903
861,452 224,450 204,442 793,811 755,822
Cost and expenses
Restaurant cost of sales ............................................................ 629,287 168,107 157,673 602,507 583,003
Insurance losses and underwriting expenses ............................... 13,362 2,668 - 4,254 -
Media cost of sales ................................................................... 35,614 9,261 - 19,399 -
Selling, general and administrative ............................................ 135,132 30,847 31,630 128,472 126,835
Depreciation and amortization ................................................. 24,780 6,828 6,566 24,905 25,250
838,175 217,711 195,869 779,537 735,088
O ther income (expenses)
Interest and dividends ............................................................... 9 8 586 1,182 8,265
Interest expense ....................................................................... (11,939) (3,272) (1,641) (10,299) (6,551)
Interest on obligations under leases........................................... (9,422) (2,577) (2,612) (9,720) (9,829)
Gain on sale of Biglari Capital Corp. ........................................ - - - - 1,597
Investment gains (including contributions) ............................... - - - 29,524 182,177
Investment partnership (losses) gains ....................................... (39,356) 144,702 23,493 14,055 20,068
Total other income (expenses) ............................................. (60,708) 138,861 19,826 24,742 195,727
Earnings (loss) before income taxes ...................................... (37,431) 145,600 28,399 39,016 216,461
Income tax expense (benefit) ................................................... (21,588) 54,550 9,450 10,212 74,289
Net earnings (loss) .................................................................. (15,843) 91,050 18,949 28,804 142,172
Less: Earnings attributable to noncontrolling interests ............. - - - - (1,901)
Net earnings (loss) attributable to Biglari Holdings Inc. ... (15,843)$ 91,050$ 18,949$ 28,804$ 140,271$
Earnings (loss) per share
Basic earnings (loss) per common share ...................................... (10.18)$ 48.49$ 11.05$ 16.85$ 90.89$
Diluted earnings (loss) per common share ................................... (10.18)$ 48.45$ 11.03$ 16.82$ 90.69$
Weighted average shares and equivalents
Basic ........................................................................................... 1,556,039 1,877,723 1,714,727 1,709,621 1,543,370
Diluted ........................................................................................ 1,556,039 1,879,414 1,718,261 1,712,775 1,546,665
Transition Period Fiscal Year
See accompanying Notes to Consolidated Financial Statements.
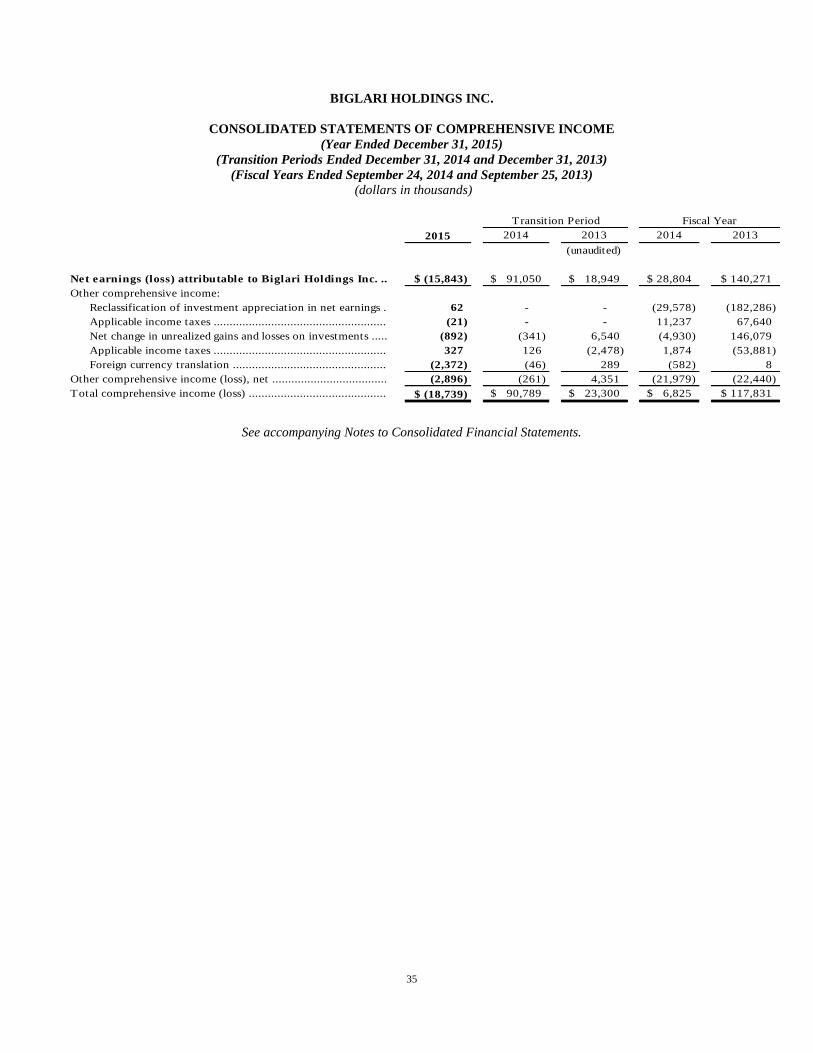
35
BIGLARI HOLDINGS INC.
CONSOLIDATED STATEMENTS OF COMPREHENSIVE INCOME
(Year Ended December 31, 2015)
(Transition Periods Ended December 31, 2014 and December 31, 2013)
(Fiscal Years Ended September 24, 2014 and September 25, 2013)
(dollars in thousands)
2015 2014 2013 2014 2013
(unaudited)
Net earnings (loss) attributable to Biglari Holdings Inc. .. (15,843)$ 91,050$ 18,949$ 28,804$ 140,271$
Other comprehensive income:
Reclassification of investment appreciation in net earnings . 62 - - (29,578) (182,286)
Applicable income taxes ...................................................... (21) - - 11,237 67,640
Net change in unrealized gains and losses on investments ..... (892) (341) 6,540 (4,930) 146,079
Applicable income taxes ...................................................... 327 126 (2,478) 1,874 (53,881)
Foreign currency translation ................................................ (2,372) (46) 289 (582) 8
Other comprehensive income (loss), net .................................... (2,896) (261) 4,351 (21,979) (22,440)
Total comprehensive income (loss) ........................................... (18,739)$ 90,789$ 23,300$ 6,825$ 117,831$
Transition Period Fiscal Year
See accompanying Notes to Consolidated Financial Statements.

36
BIGLARI HOLDINGS INC.
CONSOLIDATED BALANCE SHEETS
(dollars in thousands)
2015 2014
Assets
Current assets:
Cash and cash equivalents ................................................................................................... $ 56,523 $ 129,669
Investments ......................................................................................................................... 23,750 10,800
Receivables........................................................................................................................... 17,716 19,003
Inventories .......................................................................................................................... 7,593 7,255
Deferred taxes ..................................................................................................................... 13,263 12,019
Other current assets ............................................................................................................ 7,943 7,707
Total current assets ................................................................................................................ 126,788 186,453
Property and equipment ........................................................................................................ 332,324 353,875
Goodwill ................................................................................................................................ 40,022 40,164
Other intangible assets ........................................................................................................... 21,673 22,756
Investment partnerships ........................................................................................................ 471,689 697,982
Other assets ........................................................................................................................... 11,422 13,561
Total assets ........................................................................................................................... $ 1,003,918 $ 1,314,791
Liabilities and shareholders’ equity
Liabilities
Current liabilities:
Accounts payable ............................................................................................................... $ 34,649 $ 39,996
Accrued expenses ................................................................................................................ 74,429 65,476
Current portion of notes payable and other borrowings .................................................... 8,477 9,315
Total current liabilities ........................................................................................................... 117,555 114,787
Long-term notes payable and other borrowings .................................................................... 298,950 312,595
Deferred taxes ........................................................................................................................ 125,130 150,732
Other liabilities ....................................................................................................................... 10,911 11,126
Total liabilities .................................................................................................................... 552,546 589,240
Shareholders’ equity
Common stock - 2,066,691 and 2,065,586 shares outstanding ............................................. 1,071 1,071
Additional paid-in capital ...................................................................................................... 391,853 391,877
Retained earnings ................................................................................................................... 415,982 431,825
Accumulated other comprehensive loss ................................................................................. (3,679) (783)
Treasury stock, at cost .......................................................................................................... (353,855) (98,439)
Biglari Holdings Inc. shareholders’ equity ...................................................................... 451,372 725,551
Total liabilities and shareholders’ equity ........................................................................ $ 1,003,918 $ 1,314,791
December 31,
See accompanying Notes to Consolidated Financial Statements.
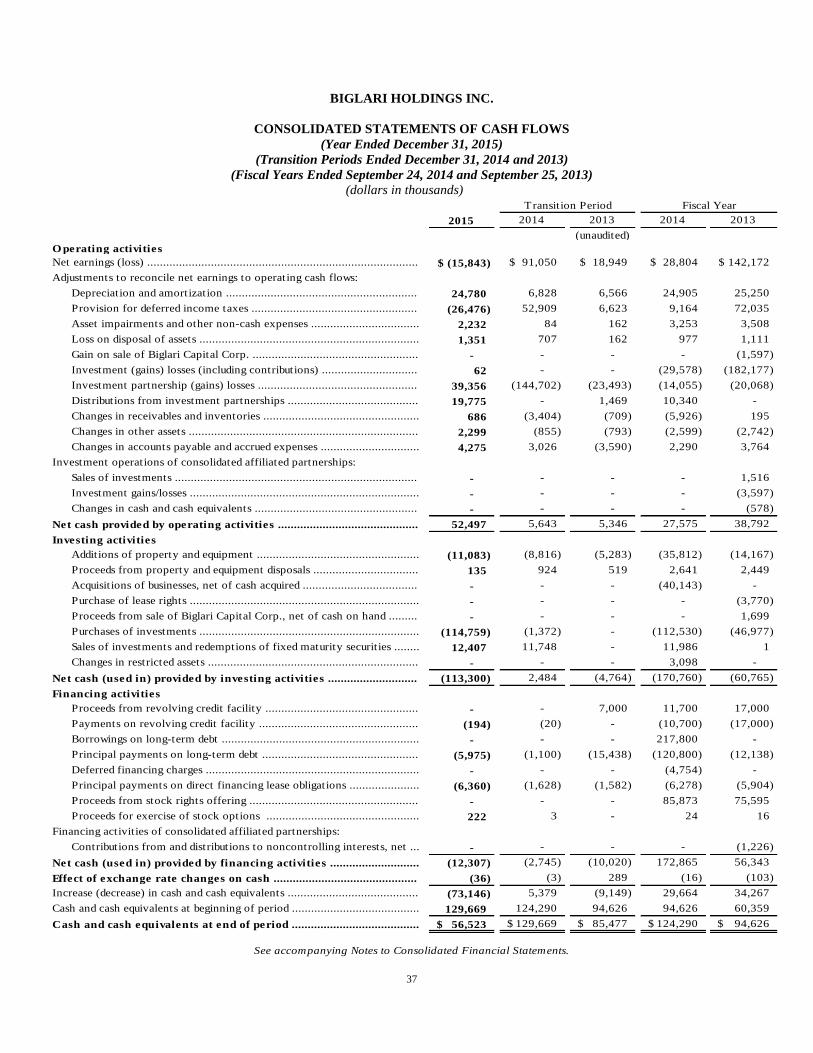
37
BIGLARI HOLDINGS INC.
CONSOLIDATED STATEMENTS OF CASH FLOWS
(Year Ended December 31, 2015)
(Transition Periods Ended December 31, 2014 and 2013)
(Fiscal Years Ended September 24, 2014 and September 25, 2013)
(dollars in thousands)
2015 2014 2013 2014 2013
(unaudited)
O perating activities
Net earnings (loss) ..................................................................................... (15,843)$ 91,050$ 18,949$ 28,804$ 142,172$
Adjustments to reconcile net earnings to operating cash flows:
Depreciation and amortization ............................................................ 24,780 6,828 6,566 24,905 25,250
Provision for deferred income taxes .................................................... (26,476) 52,909 6,623 9,164 72,035
Asset impairments and other non-cash expenses .................................. 2,232 84 162 3,253 3,508
Loss on disposal of assets ..................................................................... 1,351 707 162 977 1,111
Gain on sale of Biglari Capital Corp. .................................................... - - - - (1,597)
Investment (gains) losses (including contributions) .............................. 62 - - (29,578) (182,177)
Investment partnership (gains) losses .................................................. 39,356 (144,702) (23,493) (14,055) (20,068)
Distributions from investment partnerships ......................................... 19,775 - 1,469 10,340 -
Changes in receivables and inventories ................................................. 686 (3,404) (709) (5,926) 195
Changes in other assets ........................................................................ 2,299 (855) (793) (2,599) (2,742)
Changes in accounts payable and accrued expenses ............................... 4,275 3,026 (3,590) 2,290 3,764
Investment operations of consolidated affiliated partnerships:
Sales of investments ............................................................................ - - - - 1,516
Investment gains/losses ........................................................................ - - - - (3,597)
Changes in cash and cash equivalents ................................................... - - - - (578)
Net cash provided by operating activities ............................................ 52,497 5,643 5,346 27,575 38,792
Investing activities
Additions of property and equipment ................................................... (11,083) (8,816) (5,283) (35,812) (14,167)
Proceeds from property and equipment disposals ................................. 135 924 519 2,641 2,449
Acquisitions of businesses, net of cash acquired .................................... - - - (40,143) -
Purchase of lease rights ........................................................................ - - - - (3,770)
Proceeds from sale of Biglari Capital Corp., net of cash on hand ......... - - - - 1,699
Purchases of investments ..................................................................... (114,759) (1,372) - (112,530) (46,977)
Sales of investments and redemptions of fixed maturity securities ........ 12,407 11,748 - 11,986 1
Changes in restricted assets .................................................................. - - - 3,098 -
Net cash (used in) provided by investing activities ............................ (113,300) 2,484 (4,764) (170,760) (60,765)
Financing activities
Proceeds from revolving credit facility ................................................ - - 7,000 11,700 17,000
Payments on revolving credit facility .................................................. (194) (20) - (10,700) (17,000)
Borrowings on long-term debt .............................................................. - - - 217,800 -
Principal payments on long-term debt ................................................. (5,975) (1,100) (15,438) (120,800) (12,138)
Deferred financing charges ................................................................... - - - (4,754) -
Principal payments on direct financing lease obligations ...................... (6,360) (1,628) (1,582) (6,278) (5,904)
Proceeds from stock rights offering ..................................................... - - - 85,873 75,595
Proceeds for exercise of stock options ................................................ 222 3 - 24 16
Financing activities of consolidated affiliated partnerships:
Contributions from and distributions to noncontrolling interests, net ... - - - - (1,226)
Net cash (used in) provided by financing activities ............................ (12,307) (2,745) (10,020) 172,865 56,343
Effect of exchange rate changes on cash ............................................. (36) (3) 289 (16) (103)
Increase (decrease) in cash and cash equivalents ......................................... (73,146) 5,379 (9,149) 29,664 34,267
Cash and cash equivalents at beginning of period ........................................ 129,669 124,290 94,626 94,626 60,359
Cash and cash equivalents at end of period ........................................ 56,523$ 129,669$ 85,477$ 124,290$ 94,626$
Transition Period Fiscal Year
See accompanying Notes to Consolidated Financial Statements.

38
BIGLARI HOLDINGS INC.
CONSOLIDATED STATEMENTS OF CHANGES IN SHAREHOLDERS’ EQUITY
(Year Ended December 31, 2015)
(Transition Period Ended December 31, 2014)
(Fiscal Years Ended September 24, 2014 and September 25, 2013)
(dollars in thousands)
Common
Stock
Additional
Paid-In
Capital
Retained
Earnings
Accumulated
O ther
Comprehensive
Income (Loss)
Treasury
Stock Total
Balance at September 26, 2012 ..................... 756$ 143,035$ 251,983$ 43,897$ (90,546)$ 349,125$
Net earnings .................................................. 140,271 140,271
Other comprehensive loss, net ...................... (22,440) (22,440)
Deconsolidation of affiliated partnerships ..... 12,224 25,640 37,864
Adjustment to treasury stock for
holdings in investment partnerships ........... (11,033) (11,033)
Issuance of stock for rights offering .............. 143 119,367 (43,915) 75,595
Exercise of stock options .............................. (6) 23 17
Adjustment of redeemable noncontrolling
interest to maximum redemption value ...... (4,810) (4,810)
Balance at September 25, 2013 ..................... 899$ 269,810$ 348,339$ 21,457$ (75,916)$ 564,589$
Net earnings .................................................. 28,804 28,804
Other comprehensive loss, net ...................... (21,979) (21,979)
Adjustment to treasury stock for
holdings in investment partnerships ........... (18,594) (18,594)
Issuance of stock for rights offering .............. 172 122,069 (36,368) 85,873
Exercise of stock options .............................. (1) 25 24
Balance at September 24, 2014 ..................... 1,071$ 391,878$ 340,775$ (522)$ (94,485)$ 638,717$
Net earnings .................................................. 91,050 91,050
Other comprehensive loss, net ...................... (261) (261)
Adjustment to treasury stock for
holdings in investment partnerships ........... (3,958) (3,958)
Exercise of stock options .............................. (1) 4 3
Balance at December 31, 2014 ...................... 1,071$ 391,877$ 431,825$ (783)$ (98,439)$ 725,551$
Net loss ....................................................... (15,843) (15,843)
O ther comprehensive loss, net ................ (2,896) (2,896)
Adjustment to treasury stock for
holdings in investment partnerships ... (255,662) (255,662)
Exercise of stock options ........................... (24) 246 222
Balance at December 31, 2015 ................. 1,071$ 391,853$ 415,982$ (3,679)$ (353,855)$ 451,372$
See accompanying Notes to Consolidated Financial Statements.
BIGLARI HOLDINGS INC.
NOTES TO CONSOLIDATED FINANCIAL STATEMENTS
(Year Ended December 31, 2015)
(Transition Periods Ended December 31, 2014 and 2013)
(Fiscal Years Ended September 24, 2014 and September 25, 2013)
(dollars in thousands, except share and per-share data)
39
Note 1. Summary of Significant Accounting Policies
Description of Business Biglari Holdings Inc. is a holding company owning subsidiaries engaged in a number of diverse business activities, including
media, property and casualty insurance, and restaurants. The Company’s largest operating subsidiaries are involved in the
franchising and operating of restaurants. Biglari Holdings is founded and led by Sardar Biglari, Chairman and Chief Executive
Officer of Biglari Holdings and its major operating subsidiaries. The Company’s long-term objective is to maximize per-share
intrinsic value. All major operating, investment, and capital allocation decisions are made for the Company and its subsidiaries
by Mr. Biglari.
Principles of Consolidation The consolidated financial statements include the accounts of the Company and its wholly-owned subsidiaries including Steak n
Shake, Inc. (“Steak n Shake”) and Western Sizzlin Corporation (“Western”). The consolidated financial statements also include
the accounts of Maxim Inc. (“Maxim”) and First Guard Insurance Company and its agency, 1st Guard Corporation (collectively
“First Guard”) from the dates of their respective acquisitions during 2014. In addition to consolidating wholly-owned entities we
consolidate entities if we have a controlling interest in the general partner. Intercompany accounts and transactions have been
eliminated in consolidation.
Prior to July 2013, the consolidated financial statements included the accounts of the Company, its wholly-owned subsidiaries
(including Biglari Capital Corp. [“Biglari Capital”]), and investment related limited partnerships The Lion Fund, L.P. and
Western Acquisitions, L.P. (collectively the “consolidated affiliated partnerships”), in which we had a controlling interest.
In July 2013 the Company liquidated the partners’ interest in Western Acquisitions, L.P. by distributing assets of the partnership
to the partners and Biglari Holdings sold all of the outstanding shares of Biglari Capital to Mr. Biglari. Biglari Capital is the
general partner of The Lion Fund, L.P. and The Lion Fund II, L.P. (collectively the “investment partnerships"), which are limited
partnerships that operate as private investment funds.
As a result of the sale of Biglari Capital and the related liquidation of Western Acquisitions, L.P. the Company ceased to have a
controlling interest in Biglari Capital and the consolidated affiliated partnerships. Accordingly, Biglari Capital and the
consolidated affiliated partnerships are no longer consolidated in the Company’s consolidated financial statements.
Fiscal Year In 2014, the Company’s Board of Directors approved a change in the Company’s fiscal year-end moving from the last
Wednesday in September to December 31 of each year. This form 10-K includes an audited statement of earnings, statement of
comprehensive income, statement of cash flows and statement of shareholders’ equity for the year ended December 31, 2015,
transition period for September 25, 2014 to December 31, 2014 (“the “2014 transition period”) and fiscal years ended September
24, 2014 and September 25, 2013, and an audited balance sheet as of December 31, 2015 and 2014. Fiscal years 2014 and 2013
each contained 52 weeks. For comparative purposes, an unaudited statement of earnings, statement of comprehensive income
and statement of cash flows have been included for September 26, 2013 to December 31, 2013 (the “2013 transition period”).
The comparative transition period has not been audited and is derived from the books and records of the Company. In the
opinion of management, the comparative transition period reflects all adjustments necessary to present the financial position and
results of operations in accordance with accounting principles generally accepted in the United States (“GAAP”).
Purchases of Equity Securities
On April 20, 2015, The Lion Fund, L.P. completed a Rule 10b5-1 Trading Plan purchasing 62,000 shares of the Company’s
common stock from December 18, 2014 through April 20, 2015. On July 1, 2015, The Lion Fund II, L.P. completed a tender
offer for common stock of Biglari Holdings purchasing 616,312 shares of the Company’s common stock. On December 17,
2015, The Lion Fund II, L.P. initiated a Rule 10b5-1 Trading Plan thereby purchasing 24,000 shares of the Company’s common
stock from January 4, 2016 through February 3, 2016. As of February 3, 2016, Mr. Biglari’s beneficial ownership of the
outstanding common stock was approximately 50.6%.
BIGLARI HOLDINGS INC.
NOTES TO CONSOLIDATED FINANCIAL STATEMENTS
(Year Ended December 31, 2015)
(Transition Periods Ended December 31, 2014 and 2013)
(Fiscal Years Ended September 24, 2014 and September 25, 2013)
(dollars in thousands, except share and per-share data)
40
Note 1. Summary of Significant Accounting Policies (continued)
Business Acquisitions On February 27, 2014 the Company acquired certain assets and liabilities of Maxim. Maxim is a brand management company
whose business lies in media, both in print and in digital, and in licensing of products and services. On March 19, 2014, the
Company acquired the stock of First Guard, a direct underwriter of commercial trucking insurance, selling physical damage and
nontrucking liability insurance to truckers. These acquisitions were not material, individually or in aggregate, to the Company.
The fair value of the assets and liabilities acquired — other than investments, goodwill and intangibles — was not material.
Cash and Cash Equivalents Cash equivalents primarily consist of U.S. Government securities and money market accounts, all of which have original
maturities of three months or less. Cash equivalents are carried at fair value.
Investments Our investments consist of available-for-sale securities and held-to-maturity securities. Available-for-sale securities are carried at
fair value with net unrealized gains or losses reported as a component of accumulated other comprehensive income in
shareholders’ equity. Held-to-maturity securities are carried at amortized cost, reflecting the ability and intent to hold the
securities to maturity. Realized gains and losses on disposals of investments are determined by specific identification of cost of
investments sold and are included in investment gains/losses, a component of other income.
Investment Partnerships
Our interests in the investment partnerships are accounted as equity method investments because of our retained limited partner
interests. The Company records investment partnership gains (inclusive of the investment partnerships’ unrealized gains and
losses on their securities) as a component of other income based on our proportional ownership interest in the partnerships.
The investment partnerships are for purposes of GAAP, investment companies under the AICPA Audit and Accounting Guide
Investment Companies. For periods prior to July 1, 2013, the Company retained the specialized accounting for the consolidated
affiliated partnerships, pursuant to Financial Accounting Standards Board (“FASB”) Accounting Standards Codification
(“ASC”) Topic 946-810-45.
Concentration of Equity Price Risk
The majority of our investments are conducted through investment partnerships which generally hold common stocks. We also
hold marketable securities directly. Through the investment partnerships we hold a concentrated position in the common stock of
Cracker Barrel Old Country Store, Inc. A significant decline in the general stock market or in the prices of major investments
may have a materially adverse effect on our earnings and on consolidated shareholders’ equity.
Receivables Our accounts receivable balance consists primarily of franchisee, customer, and other receivables. We carry our accounts
receivable at cost less an allowance for doubtful accounts, which is based on a history of past write-offs and collections and
current credit conditions. Allowance for doubtful accounts was $2,378 at December 31, 2015 and $1,608 at December 31, 2014.
Amounts charged to expense and deductions from the allowance totaled $1,426 and $662 in 2015. Amounts charged to expense
and deductions from the allowance in the 2014 and 2013 transition periods and in fiscal years 2014 and 2013 were insignificant.
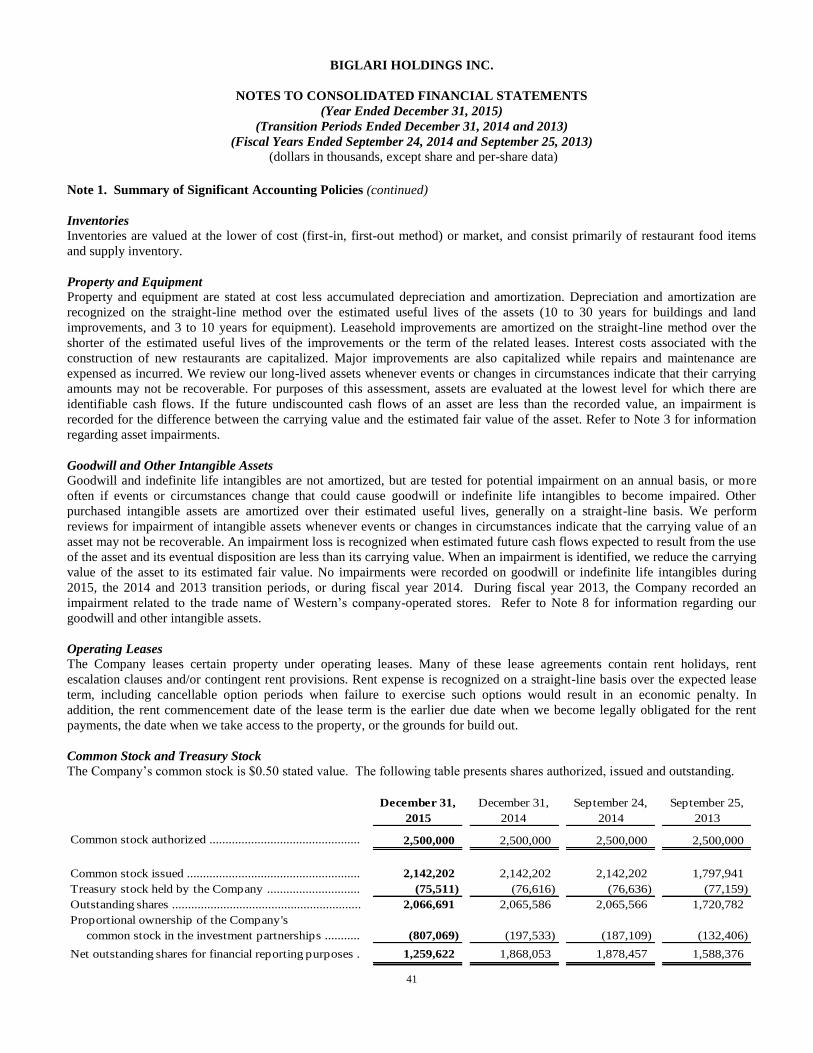
BIGLARI HOLDINGS INC.
NOTES TO CONSOLIDATED FINANCIAL STATEMENTS
(Year Ended December 31, 2015)
(Transition Periods Ended December 31, 2014 and 2013)
(Fiscal Years Ended September 24, 2014 and September 25, 2013)
(dollars in thousands, except share and per-share data)
41
Note 1. Summary of Significant Accounting Policies (continued)
Inventories Inventories are valued at the lower of cost (first-in, first-out method) or market, and consist primarily of restaurant food items
and supply inventory.
Property and Equipment Property and equipment are stated at cost less accumulated depreciation and amortization. Depreciation and amortization are
recognized on the straight-line method over the estimated useful lives of the assets (10 to 30 years for buildings and land
improvements, and 3 to 10 years for equipment). Leasehold improvements are amortized on the straight-line method over the
shorter of the estimated useful lives of the improvements or the term of the related leases. Interest costs associated with the
construction of new restaurants are capitalized. Major improvements are also capitalized while repairs and maintenance are
expensed as incurred. We review our long-lived assets whenever events or changes in circumstances indicate that their carrying
amounts may not be recoverable. For purposes of this assessment, assets are evaluated at the lowest level for which there are
identifiable cash flows. If the future undiscounted cash flows of an asset are less than the recorded value, an impairment is
recorded for the difference between the carrying value and the estimated fair value of the asset. Refer to Note 3 for information
regarding asset impairments.
Goodwill and Other Intangible Assets Goodwill and indefinite life intangibles are not amortized, but are tested for potential impairment on an annual basis, or more
often if events or circumstances change that could cause goodwill or indefinite life intangibles to become impaired. Other
purchased intangible assets are amortized over their estimated useful lives, generally on a straight-line basis. We perform
reviews for impairment of intangible assets whenever events or changes in circumstances indicate that the carrying value of an
asset may not be recoverable. An impairment loss is recognized when estimated future cash flows expected to result from the use
of the asset and its eventual disposition are less than its carrying value. When an impairment is identified, we reduce the carrying
value of the asset to its estimated fair value. No impairments were recorded on goodwill or indefinite life intangibles during
2015, the 2014 and 2013 transition periods, or during fiscal year 2014. During fiscal year 2013, the Company recorded an
impairment related to the trade name of Western’s company-operated stores. Refer to Note 8 for information regarding our
goodwill and other intangible assets.
Operating Leases The Company leases certain property under operating leases. Many of these lease agreements contain rent holidays, rent
escalation clauses and/or contingent rent provisions. Rent expense is recognized on a straight-line basis over the expected lease
term, including cancellable option periods when failure to exercise such options would result in an economic penalty. In
addition, the rent commencement date of the lease term is the earlier due date when we become legally obligated for the rent
payments, the date when we take access to the property, or the grounds for build out.
Common Stock and Treasury Stock
The Company’s common stock is $0.50 stated value. The following table presents shares authorized, issued and outstanding.
December 31,
2015
December 31,
2014
September 24,
2014
September 25,
2013
Common stock authorized ............................................... 2,500,000 2,500,000 2,500,000 2,500,000
Common stock issued ...................................................... 2,142,202 2,142,202 2,142,202 1,797,941
Treasury stock held by the Company ............................. (75,511) (76,616) (76,636) (77,159)
Outstanding shares ........................................................... 2,066,691 2,065,586 2,065,566 1,720,782
Proportional ownership of the Company's
common stock in the investment partnerships ........... (807,069) (197,533) (187,109) (132,406)
Net outstanding shares for financial reporting purposes . 1,259,622 1,868,053 1,878,457 1,588,376
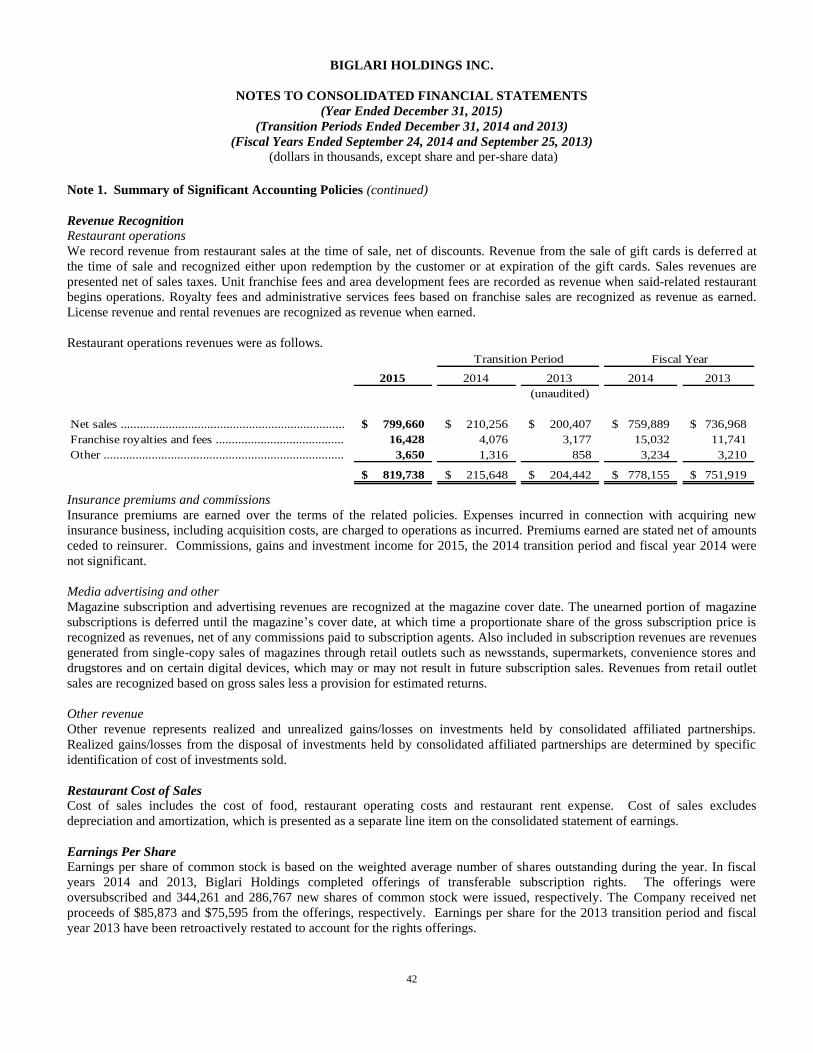
BIGLARI HOLDINGS INC.
NOTES TO CONSOLIDATED FINANCIAL STATEMENTS
(Year Ended December 31, 2015)
(Transition Periods Ended December 31, 2014 and 2013)
(Fiscal Years Ended September 24, 2014 and September 25, 2013)
(dollars in thousands, except share and per-share data)
42
Note 1. Summary of Significant Accounting Policies (continued)
Revenue Recognition
Restaurant operations
We record revenue from restaurant sales at the time of sale, net of discounts. Revenue from the sale of gift cards is deferred at
the time of sale and recognized either upon redemption by the customer or at expiration of the gift cards. Sales revenues are
presented net of sales taxes. Unit franchise fees and area development fees are recorded as revenue when said-related restaurant
begins operations. Royalty fees and administrative services fees based on franchise sales are recognized as revenue as earned.
License revenue and rental revenues are recognized as revenue when earned.
Restaurant operations revenues were as follows.
2015 2014 2013 2014 2013
(unaudited)
Net sales ...................................................................... 799,660$ 210,256$ 200,407$ 759,889$ 736,968$
Franchise royalties and fees ........................................ 16,428 4,076 3,177 15,032 11,741
Other ........................................................................... 3,650 1,316 858 3,234 3,210
819,738$ 215,648$ 204,442$ 778,155$ 751,919$
Transition Period Fiscal Year
Insurance premiums and commissions
Insurance premiums are earned over the terms of the related policies. Expenses incurred in connection with acquiring new
insurance business, including acquisition costs, are charged to operations as incurred. Premiums earned are stated net of amounts
ceded to reinsurer. Commissions, gains and investment income for 2015, the 2014 transition period and fiscal year 2014 were
not significant.
Media advertising and other
Magazine subscription and advertising revenues are recognized at the magazine cover date. The unearned portion of magazine
subscriptions is deferred until the magazine’s cover date, at which time a proportionate share of the gross subscription price is
recognized as revenues, net of any commissions paid to subscription agents. Also included in subscription revenues are revenues
generated from single-copy sales of magazines through retail outlets such as newsstands, supermarkets, convenience stores and
drugstores and on certain digital devices, which may or may not result in future subscription sales. Revenues from retail outlet
sales are recognized based on gross sales less a provision for estimated returns.
Other revenue
Other revenue represents realized and unrealized gains/losses on investments held by consolidated affiliated partnerships.
Realized gains/losses from the disposal of investments held by consolidated affiliated partnerships are determined by specific
identification of cost of investments sold.
Restaurant Cost of Sales
Cost of sales includes the cost of food, restaurant operating costs and restaurant rent expense. Cost of sales excludes
depreciation and amortization, which is presented as a separate line item on the consolidated statement of earnings.
Earnings Per Share Earnings per share of common stock is based on the weighted average number of shares outstanding during the year. In fiscal
years 2014 and 2013, Biglari Holdings completed offerings of transferable subscription rights. The offerings were
oversubscribed and 344,261 and 286,767 new shares of common stock were issued, respectively. The Company received net
proceeds of $85,873 and $75,595 from the offerings, respectively. Earnings per share for the 2013 transition period and fiscal
year 2013 have been retroactively restated to account for the rights offerings.
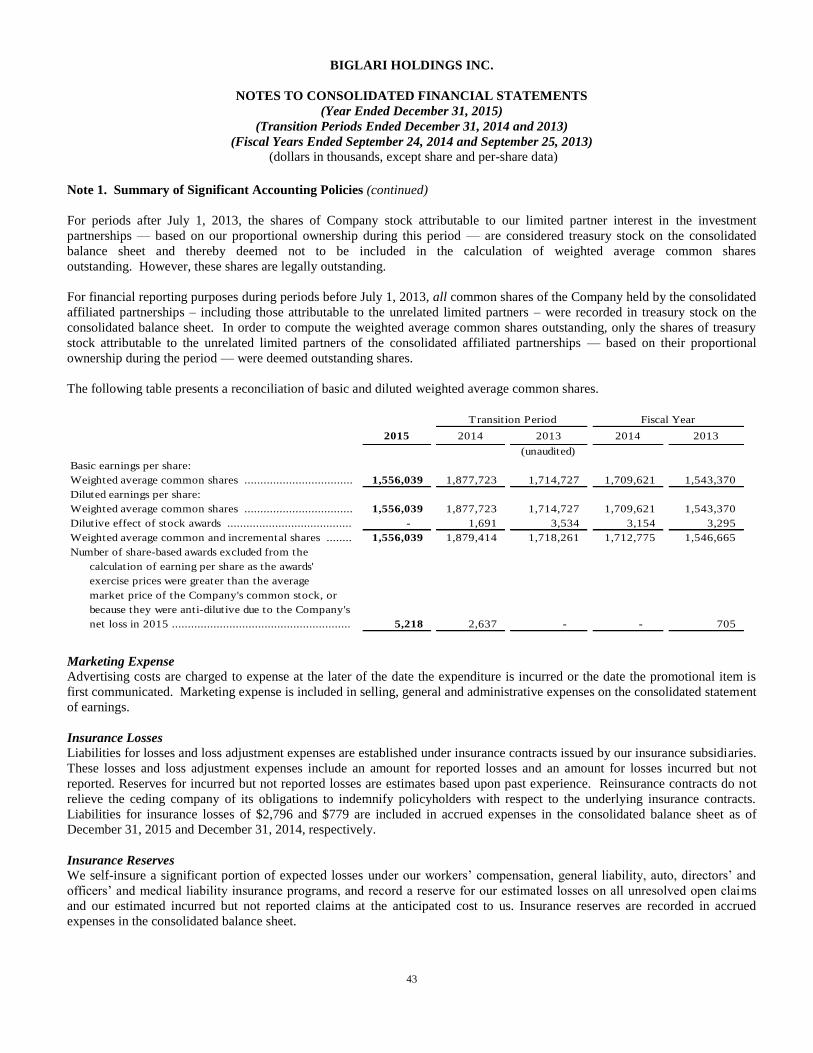
BIGLARI HOLDINGS INC.
NOTES TO CONSOLIDATED FINANCIAL STATEMENTS
(Year Ended December 31, 2015)
(Transition Periods Ended December 31, 2014 and 2013)
(Fiscal Years Ended September 24, 2014 and September 25, 2013)
(dollars in thousands, except share and per-share data)
43
Note 1. Summary of Significant Accounting Policies (continued)
For periods after July 1, 2013, the shares of Company stock attributable to our limited partner interest in the investment
partnerships — based on our proportional ownership during this period — are considered treasury stock on the consolidated
balance sheet and thereby deemed not to be included in the calculation of weighted average common shares
outstanding. However, these shares are legally outstanding.
For financial reporting purposes during periods before July 1, 2013, all common shares of the Company held by the consolidated
affiliated partnerships – including those attributable to the unrelated limited partners – were recorded in treasury stock on the
consolidated balance sheet. In order to compute the weighted average common shares outstanding, only the shares of treasury
stock attributable to the unrelated limited partners of the consolidated affiliated partnerships — based on their proportional
ownership during the period — were deemed outstanding shares.
The following table presents a reconciliation of basic and diluted weighted average common shares.
2015 2014 2013 2014 2013
(unaudited)
Basic earnings per share:
Weighted average common shares .................................. 1,556,039 1,877,723 1,714,727 1,709,621 1,543,370
Diluted earnings per share:
Weighted average common shares .................................. 1,556,039 1,877,723 1,714,727 1,709,621 1,543,370
Dilutive effect of stock awards ....................................... - 1,691 3,534 3,154 3,295
Weighted average common and incremental shares ........ 1,556,039 1,879,414 1,718,261 1,712,775 1,546,665
Number of share-based awards excluded from the
calculation of earning per share as the awards'
exercise prices were greater than the average
market price of the Company's common stock, or
because they were anti-dilutive due to the Company's
net loss in 2015 ........................................................ 5,218 2,637 - - 705
Transition Period Fiscal Year
Marketing Expense Advertising costs are charged to expense at the later of the date the expenditure is incurred or the date the promotional item is
first communicated. Marketing expense is included in selling, general and administrative expenses on the consolidated statement
of earnings.
Insurance Losses
Liabilities for losses and loss adjustment expenses are established under insurance contracts issued by our insurance subsidiaries.
These losses and loss adjustment expenses include an amount for reported losses and an amount for losses incurred but not
reported. Reserves for incurred but not reported losses are estimates based upon past experience. Reinsurance contracts do not
relieve the ceding company of its obligations to indemnify policyholders with respect to the underlying insurance contracts.
Liabilities for insurance losses of $2,796 and $779 are included in accrued expenses in the consolidated balance sheet as of
December 31, 2015 and December 31, 2014, respectively.
Insurance Reserves We self-insure a significant portion of expected losses under our workers’ compensation, general liability, auto, directors’ and
officers’ and medical liability insurance programs, and record a reserve for our estimated losses on all unresolved open claims
and our estimated incurred but not reported claims at the anticipated cost to us. Insurance reserves are recorded in accrued
expenses in the consolidated balance sheet.
BIGLARI HOLDINGS INC.
NOTES TO CONSOLIDATED FINANCIAL STATEMENTS
(Year Ended December 31, 2015)
(Transition Periods Ended December 31, 2014 and 2013)
(Fiscal Years Ended September 24, 2014 and September 25, 2013)
(dollars in thousands, except share and per-share data)
44
Note 1. Summary of Significant Accounting Policies (continued)
Savings Plans Several of our subsidiaries also sponsor deferred compensation and defined contribution retirement plans, such as 401(k) or
profit sharing plans. Employee contributions to the plans are subject to regulatory limitations and the specific plan provisions.
Some of the plans allow for discretionary contributions as determined by management. Employer contributions expensed with
respect to these plans were not material.
Use of Estimates Preparation of the consolidated financial statements in accordance with GAAP requires management to make estimates and
assumptions that affect the amounts reported in the consolidated financial statements and accompanying notes. Actual results
could differ from the estimates.
New Accounting Standards
In November 2015, the FASB issued Accounting Standards Update (“ASU”) 2015-17, Balance Sheet Classification of Deferred
Taxes. The new guidance requires that all deferred tax assets and liabilities, along with any related valuation allowance, be
classified as noncurrent deferred tax asset or liability. The amendments in this update are effective for financial statements issued
for fiscal years beginning after December 15, 2016, and interim periods within those fiscal years. Early application is permitted.
The Company does not believe the adoption of ASU 2015-17 will have a material effect on its consolidated financial statements.
In April 2015, the FASB issued ASU 2015-03, Interest—Imputation of Interest (Subtopic 835-30): Simplifying the Presentation
of Debt Issuance Costs. The update requires debt issuance costs related to a recognized debt liability to be presented in the
balance sheet as a direct deduction from the carrying amount of that debt liability, consistent with debt discounts. The
recognition and measurement guidance for debt issuance costs are not affected by the amendments in this update. The
amendments are effective for financial statements issued for fiscal years beginning after December 15, 2015, and interim periods
within those fiscal years. The Company does not believe the adoption of ASU 2015-03 will have a material effect on its
consolidated financial statements.
In February 2015, the FASB issued ASU 2015-02, Amendments to the Consolidations Analysis. The amendments in this update
provide guidance under GAAP about limited partnerships, which will be variable interest entities, unless the limited partners
have either substantive kick-out rights or participation rights. It also changes the effect that fees paid to a decision maker or
service provider have on consolidation analysis and amends how variable interests held by related parties affect the consolidation
conclusion. The amendments in this update are effective for the annual periods, and interim periods within those annual periods,
beginning after December 15, 2015. Early application is permitted. We are evaluating the effect this guidance will have on our
consolidated financial statements and related disclosures.
In August 2014, the FASB issued ASU 2014-15, Presentation of Financial Statements-Going Concern. The amendments in this
update provide guidance in GAAP about management's responsibility to evaluate whether there is substantial doubt about an
entity's ability to continue as a going concern and to provide related footnote disclosures. In doing so, the amendments should
reduce diversity in the timing and content of footnote disclosures. The amendments in this update are effective for the annual
periods ending after December 15, 2016, and for annual periods and interim periods thereafter. Early application is permitted.
The Company is evaluating the effect, if any, on its consolidated financial statements.
BIGLARI HOLDINGS INC.
NOTES TO CONSOLIDATED FINANCIAL STATEMENTS
(Year Ended December 31, 2015)
(Transition Periods Ended December 31, 2014 and 2013)
(Fiscal Years Ended September 24, 2014 and September 25, 2013)
(dollars in thousands, except share and per-share data)
45
Note 1. Summary of Significant Accounting Policies (continued)
In May 2014, FASB issued ASU 2014-09, Revenue from Contracts with Customers (Topic 606), and in August 2015 issued ASU
No. 2015-14, which amended ASU No. 2014-09 as to its effective date. This update, as amended, provides a comprehensive new
revenue recognition model that requires a company to recognize revenue to depict the transfer of goods or services to a customer
at an amount that reflects the consideration it expects to receive in exchange for those goods or services. The guidance also
requires additional disclosure about the nature, amount, timing and uncertainty of revenue and cash flows arising from customer
contracts. The update allows companies to use either a full retrospective or a modified retrospective approach upon adoption and
is effective for annual periods beginning after December 15, 2017 and interim periods therein, which will require us to adopt
these provisions in the first quarter of 2018. Early adoption is permitted. We are evaluating which transition approach to use and
the effect this guidance will have on our consolidated financial statements and related disclosures.
In April 2014, the FASB issued ASU 2014-08, Reporting of Discontinued Operations and Disclosures of Disposals of
Components of an Entity. ASU 2014-08 provides a narrower definition of discontinued operations than under existing GAAP.
ASU 2014-08 requires that only disposals of components of an entity (or groups of components) that represent a strategic shift
that have or will have a major effect on the reporting entity’s operations are reported in the financial statements as discontinued
operations. ASU 2014-08 also provides guidance on the financial statement presentations and disclosures of discontinued
operations. ASU 2014-08 is effective prospectively for disposals (or classifications of held-for-sale) of components of an entity
that occur in annual or interim periods beginning after December 15, 2014. The adoption of ASU 2014-08 did not have a
material effect on the Company’s consolidated financial statements.
Note 2. Divestitures
In July 2013, Biglari Holdings sold all of the outstanding shares of Biglari Capital to Mr. Biglari for $1,700. The Company
recorded a gain on the sale of $1,597. Biglari Capital is the general partner of the investment partnerships. The Company also
liquidated the partners’ interests in Western Acquisitions, L.P. by distributing assets of the partnership to the partners.
Note 3. Impairment and Restaurant Closings
During 2015, Steak n Shake recorded an asset impairment of $51 in selling, general and administrative expenses. No asset
impairment charges were recorded during the 2014 transition period. During the 2013 transition period Steak n Shake recorded
an asset impairment of $41. Steak n Shake recorded asset impairment during fiscal years 2014 and 2013 of $1,433 and $1,666,
respectively, in selling, general and administrative expenses. Western recorded restaurant closing costs of $72 during the fiscal
year 2013 in selling, general and administrative expenses. Steak n Shake did not close any company-operated restaurants in
2015, transition period 2014 or in fiscal year 2013. Steak n Shake closed two company-operated restaurants and sold two
company-operated restaurants in fiscal year 2014. Western did not close any company-operated restaurants in 2015 or in
transition period 2014. Western closed one company-operated restaurant in each of fiscal years 2014 and 2013.

BIGLARI HOLDINGS INC.
NOTES TO CONSOLIDATED FINANCIAL STATEMENTS
(Year Ended December 31, 2015)
(Transition Periods Ended December 31, 2014 and 2013)
(Fiscal Years Ended September 24, 2014 and September 25, 2013)
(dollars in thousands, except share and per-share data)
46
Note 4. Investments
Investments consisted of the following.
2015 2014
Cost ................................................................................................................................................... 24,842$ 11,056$
Gross unrealized gains ....................................................................................................................... 10 11
Gross unrealized losses ..................................................................................................................... (1,102) (267)
Fair value ........................................................................................................................................... 23,750$ 10,800$
December 31,
Investment gains/losses are recognized when investments are sold (as determined on a specific identification basis) or as
otherwise required by GAAP. The timing of realized gains and losses from sales can have a material effect on periodic earnings.
However, such realized gains or losses usually have little, if any, impact on total shareholders’ equity because the investments
are carried at fair value with any unrealized gains/losses included as a component of accumulated other comprehensive income in
shareholders’ equity. We believe that realized investment gains/losses are often meaningless in terms of understanding reported
results. Short-term investment gains/losses have caused and may continue to cause significant volatility in our results.
Investment gains were as follows.
2014 2013
Gain on contributions to investment partnerships ................................................................................... 29,524$ 182,746$
Gross realized gains on sales .................................................................................................................... - 1
Other than temporary impairment ........................................................................................................... - (570)
Investment gains (including contributions) ............................................................................................... 29,524$ 182,177$
Fiscal Year
The Company did not recognize any investment gains during 2015 or during the 2014 and 2013 transition periods.
The Company recognized a pre-tax gain of $29,524 ($18,305 net of tax) on a contribution of $74,418 in securities and $182,746
($114,931 net of tax) on a contribution of $375,936 in securities to the investment partnerships during fiscal years 2014 and
2013, respectively. The gains had a material accounting effect on the Company’s fiscal years 2014 and 2013 earnings.
However, these gains had no impact on total shareholders’ equity because the investments were carried at fair value prior to the
contribution, with the unrealized gains included as a component of accumulated other comprehensive income.
In connection with the acquisition of First Guard during fiscal year 2014, we acquired $15,043 of investments.
Note 5. Investment Partnerships
Beginning July 1, 2013, as a result of the sale of Biglari Capital the Company reports on the limited partnership interests in
investment partnerships under the equity method of accounting. We record our proportional share of equity in the investment
partnerships but exclude Company common stock held by said partnerships. The Company’s pro-rata share of its common stock
held by the investment partnerships is recorded as treasury stock even though they are legally outstanding. The Company
records gains/losses from investment partnerships (inclusive of the investment partnerships’ unrealized gains and losses on their
securities) in the consolidated statements of earnings based on our carrying value of these partnerships. The fair value is
calculated net of the general partner’s accrued incentive fees. Gains and losses on Company common stock included in the
earnings of these partnerships are eliminated because they are recorded as treasury stock.
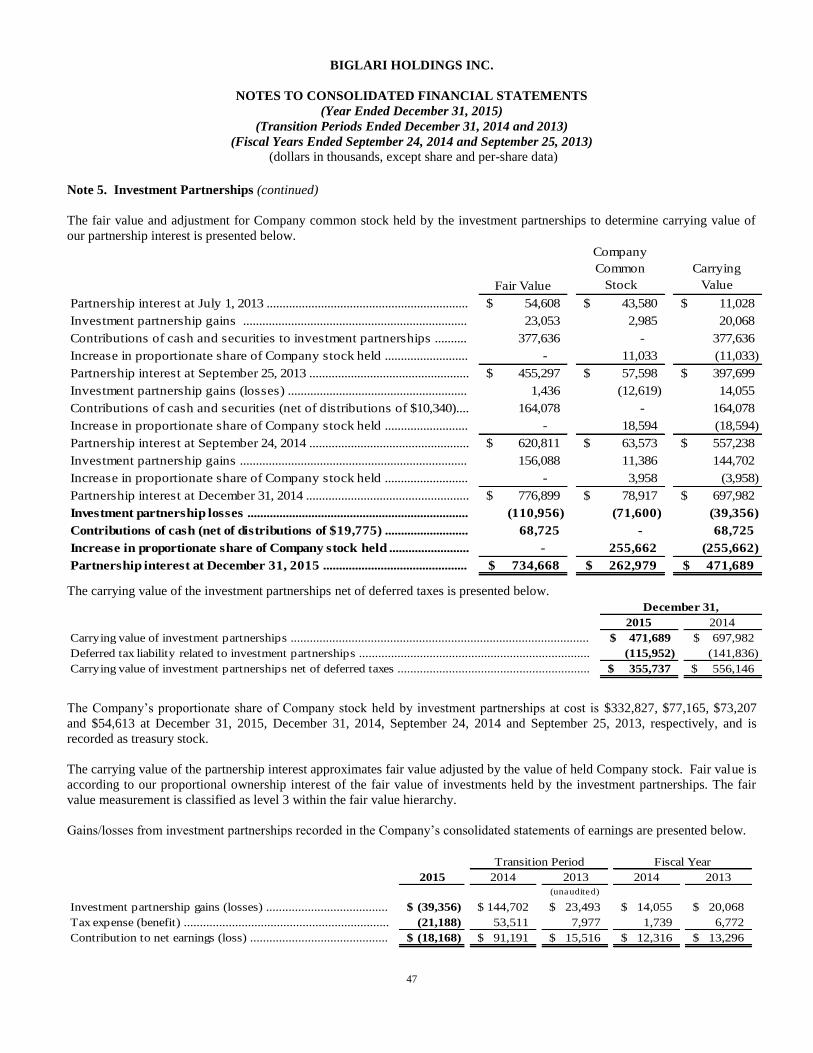
BIGLARI HOLDINGS INC.
NOTES TO CONSOLIDATED FINANCIAL STATEMENTS
(Year Ended December 31, 2015)
(Transition Periods Ended December 31, 2014 and 2013)
(Fiscal Years Ended September 24, 2014 and September 25, 2013)
(dollars in thousands, except share and per-share data)
47
Note 5. Investment Partnerships (continued)
The fair value and adjustment for Company common stock held by the investment partnerships to determine carrying value of
our partnership interest is presented below.
Fair Value
Company
Common
Stock
Carrying
Value
Partnership interest at July 1, 2013 ............................................................... 54,608$ 43,580$ 11,028$
Investment partnership gains ...................................................................... 23,053 2,985 20,068
Contributions of cash and securities to investment partnerships .......... 377,636 - 377,636
Increase in proportionate share of Company stock held .......................... - 11,033 (11,033)
Partnership interest at September 25, 2013 .................................................. 455,297$ 57,598$ 397,699$
Investment partnership gains (losses) ........................................................ 1,436 (12,619) 14,055
Contributions of cash and securities (net of distributions of $10,340).... 164,078 - 164,078
Increase in proportionate share of Company stock held .......................... - 18,594 (18,594)
Partnership interest at September 24, 2014 .................................................. 620,811$ 63,573$ 557,238$
Investment partnership gains ....................................................................... 156,088 11,386 144,702
Increase in proportionate share of Company stock held .......................... - 3,958 (3,958)
Partnership interest at December 31, 2014 ................................................... 776,899$ 78,917$ 697,982$
Investment partnership losses ..................................................................... (110,956) (71,600) (39,356)
Contributions of cash (net of distributions of $19,775) .......................... 68,725 - 68,725
Increase in proportionate share of Company stock held ......................... - 255,662 (255,662)
Partnership interest at December 31, 2015 ............................................. 734,668$ 262,979$ 471,689$
The carrying value of the investment partnerships net of deferred taxes is presented below.
2015 2014
Carrying value of investment partnerships ............................................................................................. 471,689$ 697,982$
Deferred tax liability related to investment partnerships ........................................................................ (115,952) (141,836)
Carrying value of investment partnerships net of deferred taxes ............................................................ 355,737$ 556,146$
December 31,
The Company’s proportionate share of Company stock held by investment partnerships at cost is $332,827, $77,165, $73,207
and $54,613 at December 31, 2015, December 31, 2014, September 24, 2014 and September 25, 2013, respectively, and is
recorded as treasury stock.
The carrying value of the partnership interest approximates fair value adjusted by the value of held Company stock. Fair value is
according to our proportional ownership interest of the fair value of investments held by the investment partnerships. The fair
value measurement is classified as level 3 within the fair value hierarchy.
Gains/losses from investment partnerships recorded in the Company’s consolidated statements of earnings are presented below.
2015 2014 2013 2014 2013
(unaudited)
Investment partnership gains (losses) ...................................... (39,356)$ 144,702$ 23,493$ 14,055$ 20,068$
Tax expense (benefit) ................................................................ (21,188) 53,511 7,977 1,739 6,772
Contribution to net earnings (loss) ........................................... (18,168)$ 91,191$ 15,516$ 12,316$ 13,296$
Transition Period Fiscal Year
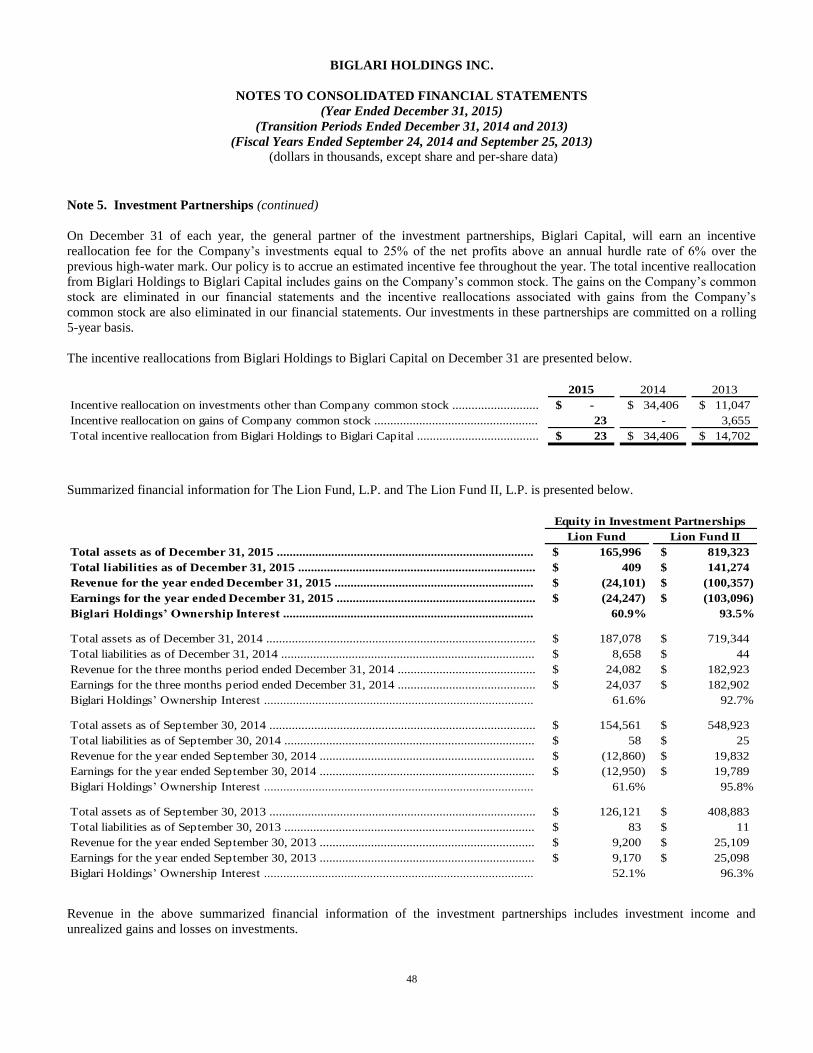
BIGLARI HOLDINGS INC.
NOTES TO CONSOLIDATED FINANCIAL STATEMENTS
(Year Ended December 31, 2015)
(Transition Periods Ended December 31, 2014 and 2013)
(Fiscal Years Ended September 24, 2014 and September 25, 2013)
(dollars in thousands, except share and per-share data)
48
Note 5. Investment Partnerships (continued)
On December 31 of each year, the general partner of the investment partnerships, Biglari Capital, will earn an incentive
reallocation fee for the Company’s investments equal to 25% of the net profits above an annual hurdle rate of 6% over the
previous high-water mark. Our policy is to accrue an estimated incentive fee throughout the year. The total incentive reallocation
from Biglari Holdings to Biglari Capital includes gains on the Company’s common stock. The gains on the Company’s common
stock are eliminated in our financial statements and the incentive reallocations associated with gains from the Company’s
common stock are also eliminated in our financial statements. Our investments in these partnerships are committed on a rolling
5-year basis.
The incentive reallocations from Biglari Holdings to Biglari Capital on December 31 are presented below.
2015 2014 2013
Incentive reallocation on investments other than Company common stock ........................... -$ 34,406$ 11,047$
Incentive reallocation on gains of Company common stock ................................................... 23 - 3,655
Total incentive reallocation from Biglari Holdings to Biglari Capital ...................................... 23$ 34,406$ 14,702$
Summarized financial information for The Lion Fund, L.P. and The Lion Fund II, L.P. is presented below.
Lion Fund Lion Fund II
Total assets as of December 31, 2015 ................................................................................ 165,996$ 819,323$
Total liabilities as of December 31, 2015 .......................................................................... 409$ 141,274$
Revenue for the year ended December 31, 2015 .............................................................. (24,101)$ (100,357)$
Earnings for the year ended December 31, 2015 .............................................................. (24,247)$ (103,096)$
Biglari Holdings’ Ownership Interest .............................................................................. 60.9% 93.5%
Total assets as of December 31, 2014 .................................................................................... 187,078$ 719,344$
Total liabilities as of December 31, 2014 ............................................................................... 8,658$ 44$
Revenue for the three months period ended December 31, 2014 ........................................... 24,082$ 182,923$
Earnings for the three months period ended December 31, 2014 ........................................... 24,037$ 182,902$
Biglari Holdings’ Ownership Interest .................................................................................... 61.6% 92.7%
Total assets as of September 30, 2014 ................................................................................... 154,561$ 548,923$
Total liabilities as of September 30, 2014 .............................................................................. 58$ 25$
Revenue for the year ended September 30, 2014 ................................................................... (12,860)$ 19,832$
Earnings for the year ended September 30, 2014 ................................................................... (12,950)$ 19,789$
Biglari Holdings’ Ownership Interest .................................................................................... 61.6% 95.8%
Total assets as of September 30, 2013 ................................................................................... 126,121$ 408,883$
Total liabilities as of September 30, 2013 .............................................................................. 83$ 11$
Revenue for the year ended September 30, 2013 ................................................................... 9,200$ 25,109$
Earnings for the year ended September 30, 2013 ................................................................... 9,170$ 25,098$
Biglari Holdings’ Ownership Interest .................................................................................... 52.1% 96.3%
Equity in Investment Partnerships
Revenue in the above summarized financial information of the investment partnerships includes investment income and
unrealized gains and losses on investments.
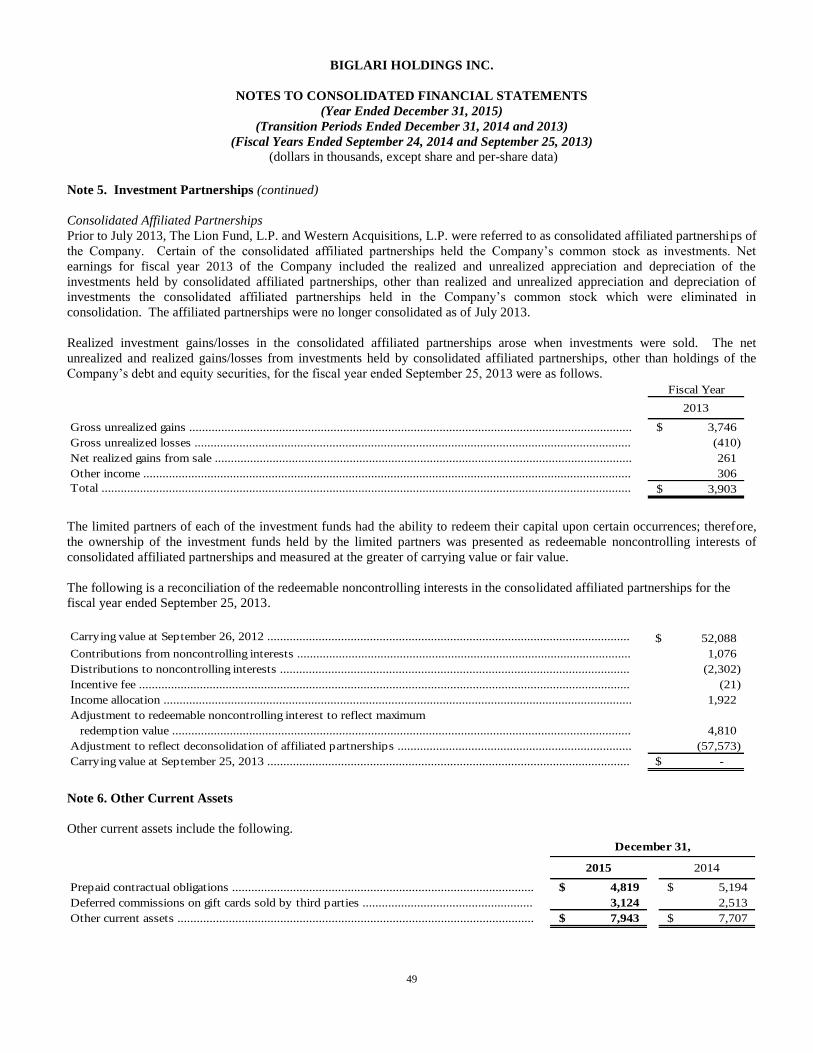
BIGLARI HOLDINGS INC.
NOTES TO CONSOLIDATED FINANCIAL STATEMENTS
(Year Ended December 31, 2015)
(Transition Periods Ended December 31, 2014 and 2013)
(Fiscal Years Ended September 24, 2014 and September 25, 2013)
(dollars in thousands, except share and per-share data)
49
Note 5. Investment Partnerships (continued)
Consolidated Affiliated Partnerships
Prior to July 2013, The Lion Fund, L.P. and Western Acquisitions, L.P. were referred to as consolidated affiliated partnerships of
the Company. Certain of the consolidated affiliated partnerships held the Company’s common stock as investments. Net
earnings for fiscal year 2013 of the Company included the realized and unrealized appreciation and depreciation of the
investments held by consolidated affiliated partnerships, other than realized and unrealized appreciation and depreciation of
investments the consolidated affiliated partnerships held in the Company’s common stock which were eliminated in
consolidation. The affiliated partnerships were no longer consolidated as of July 2013.
Realized investment gains/losses in the consolidated affiliated partnerships arose when investments were sold. The net
unrealized and realized gains/losses from investments held by consolidated affiliated partnerships, other than holdings of the
Company’s debt and equity securities, for the fiscal year ended September 25, 2013 were as follows.
Fiscal Year
2013
Gross unrealized gains .......................................................................................................................................... 3,746$
Gross unrealized losses ........................................................................................................................................ (410)
Net realized gains from sale .................................................................................................................................. 261
Other income ........................................................................................................................................................ 306
Total ..................................................................................................................................................................... 3,903$
The limited partners of each of the investment funds had the ability to redeem their capital upon certain occurrences; therefore,
the ownership of the investment funds held by the limited partners was presented as redeemable noncontrolling interests of
consolidated affiliated partnerships and measured at the greater of carrying value or fair value.
The following is a reconciliation of the redeemable noncontrolling interests in the consolidated affiliated partnerships for the
fiscal year ended September 25, 2013.
Carrying value at September 26, 2012 ................................................................................................................. 52,088$
Contributions from noncontrolling interests ........................................................................................................ 1,076
Distributions to noncontrolling interests ............................................................................................................. (2,302)
Incentive fee ......................................................................................................................................................... (21)
Income allocation .................................................................................................................................................. 1,922
Adjustment to redeemable noncontrolling interest to reflect maximum
redemption value ............................................................................................................................................... 4,810
Adjustment to reflect deconsolidation of affiliated partnerships ......................................................................... (57,573)
Carrying value at September 25, 2013 ................................................................................................................. -$
Note 6. Other Current Assets
Other current assets include the following.
2015 2014
Prepaid contractual obligations .............................................................................................. 4,819$ 5,194$
Deferred commissions on gift cards sold by third parties ..................................................... 3,124 2,513
Other current assets ............................................................................................................... 7,943$ 7,707$
December 31,
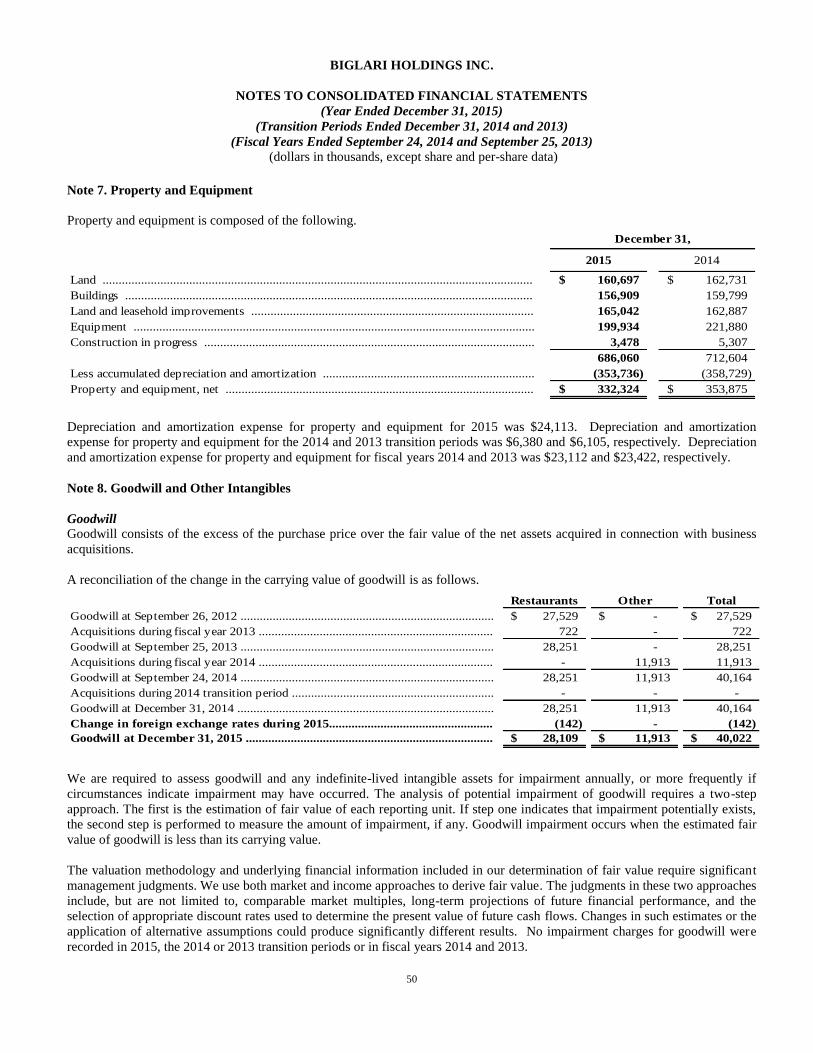
BIGLARI HOLDINGS INC.
NOTES TO CONSOLIDATED FINANCIAL STATEMENTS
(Year Ended December 31, 2015)
(Transition Periods Ended December 31, 2014 and 2013)
(Fiscal Years Ended September 24, 2014 and September 25, 2013)
(dollars in thousands, except share and per-share data)
50
Note 7. Property and Equipment
Property and equipment is composed of the following.
2015 2014
Land ...................................................................................................................................... 160,697$ 162,731$
Buildings ............................................................................................................................... 156,909 159,799
Land and leasehold improvements ........................................................................................ 165,042 162,887
Equipment ............................................................................................................................. 199,934 221,880
Construction in progress ....................................................................................................... 3,478 5,307
686,060 712,604
Less accumulated depreciation and amortization .................................................................. (353,736) (358,729)
Property and equipment, net ................................................................................................ 332,324$ 353,875$
December 31,
Depreciation and amortization expense for property and equipment for 2015 was $24,113. Depreciation and amortization
expense for property and equipment for the 2014 and 2013 transition periods was $6,380 and $6,105, respectively. Depreciation
and amortization expense for property and equipment for fiscal years 2014 and 2013 was $23,112 and $23,422, respectively.
Note 8. Goodwill and Other Intangibles
Goodwill Goodwill consists of the excess of the purchase price over the fair value of the net assets acquired in connection with business
acquisitions.
A reconciliation of the change in the carrying value of goodwill is as follows.
Restaurants Other Total
Goodwill at September 26, 2012 ............................................................................... 27,529$ -$ 27,529$
Acquisitions during fiscal year 2013 ......................................................................... 722 - 722
Goodwill at September 25, 2013 ............................................................................... 28,251 - 28,251
Acquisitions during fiscal year 2014 ......................................................................... - 11,913 11,913
Goodwill at September 24, 2014 ............................................................................... 28,251 11,913 40,164
Acquisitions during 2014 transition period ............................................................... - - -
Goodwill at December 31, 2014 ................................................................................ 28,251 11,913 40,164
Change in foreign exchange rates during 2015................................................... (142) - (142)
Goodwill at December 31, 2015 ............................................................................. 28,109$ 11,913$ 40,022$
We are required to assess goodwill and any indefinite-lived intangible assets for impairment annually, or more frequently if
circumstances indicate impairment may have occurred. The analysis of potential impairment of goodwill requires a two-step
approach. The first is the estimation of fair value of each reporting unit. If step one indicates that impairment potentially exists,
the second step is performed to measure the amount of impairment, if any. Goodwill impairment occurs when the estimated fair
value of goodwill is less than its carrying value.
The valuation methodology and underlying financial information included in our determination of fair value require significant
management judgments. We use both market and income approaches to derive fair value. The judgments in these two approaches
include, but are not limited to, comparable market multiples, long-term projections of future financial performance, and the
selection of appropriate discount rates used to determine the present value of future cash flows. Changes in such estimates or the
application of alternative assumptions could produce significantly different results. No impairment charges for goodwill were
recorded in 2015, the 2014 or 2013 transition periods or in fiscal years 2014 and 2013.

BIGLARI HOLDINGS INC.
NOTES TO CONSOLIDATED FINANCIAL STATEMENTS
(Year Ended December 31, 2015)
(Transition Periods Ended December 31, 2014 and 2013)
(Fiscal Years Ended September 24, 2014 and September 25, 2013)
(dollars in thousands, except share and per-share data)
51
Note 8. Goodwill and Other Intangibles (continued)
Other Intangibles Other intangibles are composed of the following.
Gross
carrying
amount
Accumulated
amortization Total
Gross
carrying
amount
Accumulated
amortization Total
Franchise agreement ............................ 5,310$ (3,054)$ 2,256$ 5,310$ (2,523)$ 2,787$
Right to operate ................................... - - - 1,480 (1,480) -
Other ................................................... 810 (667) 143 810 (624) 186
Total .................................................... 6,120 (3,721) 2,399 7,600 (4,627) 2,973
Intangible assets with indefinite lives:
Trade names ........................................ 15,876 - 15,876 15,876 - 15,876
Other assets with indefinite lives......... 3,398 - 3,398 3,907 - 3,907
Total intangible assets ........................ 25,394$ (3,721)$ 21,673$ 27,383$ (4,627)$ 22,756$
2015 2014
December 31,
Intangible assets subject to amortization consist of franchise agreements connected with the purchase of Western as well as rights
to favorable leases related to prior acquisitions. These intangible assets are being amortized over their estimated weighted
average of useful lives ranging from eight to twelve years.
Amortization expense for 2015 was $574. Amortization expense for the 2014 and 2013 transition periods was $151 and $169,
respectively. Amortization expense for fiscal years 2014 and 2013 was $690. Total annual amortization expense for each of the
next five years will approximate $507.
The Company acquired Maxim and First Guard during fiscal year 2014 and lease rights during fiscal year 2013. As a result of
the acquisitions during fiscal year 2014, $15,876 of the purchase prices were allocated to intangible assets with indefinite lives.
Intangible assets with indefinite lives consist of trade names, franchise rights as well as lease rights. During fiscal year 2013, the
Company recorded an impairment loss for an intangible asset of $1,244 in selling, general and administrative. This number
represents the trade name of Western’s company-operated stores, which we decided not to use any longer. The calculation of
fair value for the trade name was determined primarily by using a discounted cash flow analysis.
Note 9. Other Assets
Other assets primarily include non-qualified plan investments, the non-current portion of capitalized loan acquisition costs,
restricted cash and bonds and the non-current portion of prepaid rent.

BIGLARI HOLDINGS INC.
NOTES TO CONSOLIDATED FINANCIAL STATEMENTS
(Year Ended December 31, 2015)
(Transition Periods Ended December 31, 2014 and 2013)
(Fiscal Years Ended September 24, 2014 and September 25, 2013)
(dollars in thousands, except share and per-share data)
52
Note 10. Accrued Expenses
Accrued expenses include the following.
2015 2014
Salaries, wages, and vacation ................................................................................................... 13,584$ 11,409$
Taxes payable .......................................................................................................................... 12,413 13,298
Gift card liability ..................................................................................................................... 22,358 16,068
Deferred revenue ..................................................................................................................... 8,514 7,934
Workers' compensation and other self-insurance accruals ...................................................... 8,485 9,787
Other ....................................................................................................................................... 9,075 6,980
Accrued expenses .................................................................................................................... 74,429$ 65,476$
December 31,
Note 11. Other Liabilities
Other liabilities include the following.
2015 2014
Deferred rent expense ............................................................................................................ 6,658$ 6,450$
Other ..................................................................................................................................... 4,253 4,676
Other liabilities ...................................................................................................................... 10,911$ 11,126$
December 31,
Note 12. Income Taxes
The components of the provision for income taxes consist of the following.
2015 2014 2013 2014 2013
(unaudited)
Current:
Federal .......................................................... 2,866$ 752$ 2,352$ 571$ 506$
State ............................................................. 2,022 889 475 477 1,748
Deferred ......................................................... (26,476) 52,909 6,623 9,164 72,035
Total income taxes ....................................... (21,588)$ 54,550$ 9,450$ 10,212$ 74,289$
Reconciliation of effective income tax:
Tax at U.S. statutory rates (35%) ................. (13,100)$ 50,960$ 9,940$ 13,656$ 75,762$
State income taxes, net of federal benefit ...... (1,973) 4,186 840 1,369 5,043
Federal income tax credits ............................. (4,837) (995) (960) (4,298) (4,249)
Tax attributed to noncontrolling interests ..... - - - - (666)
Dividends received deduction ......................... (6,142) (341) (880) (3,650) (2,647)
Valuation allowance ....................................... 919 499 180 985 -
Foreign tax rate differences............................. 3,180 606 371 1,993 -
Other ............................................................ 365 (365) (41) 157 1,046
Total income taxes ....................................... (21,588)$ 54,550$ 9,450$ 10,212$ 74,289$
Transition Period Fiscal Year

BIGLARI HOLDINGS INC.
NOTES TO CONSOLIDATED FINANCIAL STATEMENTS
(Year Ended December 31, 2015)
(Transition Periods Ended December 31, 2014 and 2013)
(Fiscal Years Ended September 24, 2014 and September 25, 2013)
(dollars in thousands, except share and per-share data)
53
Note 12. Income Taxes (continued)
Income taxes paid during 2015 was $2,063. Income taxes paid for the 2014 transition period was $22. Income taxes paid totaled
$4,829 in fiscal year 2014 and $1,518 in fiscal year 2013. Income tax refunds totaled $16 in 2015, $17 in fiscal year 2014 and
$52 in fiscal year 2013.
As of December 31, 2015, we had approximately $413 of unrecognized tax benefits, including approximately $35 of interest and
penalties, which are included in other long-term liabilities in the consolidated balance sheet. As of December 31, 2014, we had
approximately $453 of unrecognized tax benefits, including approximately $66 of interest and penalties, which are included in
other long-term liabilities in the consolidated balance sheet. We recognized approximately $20 and $6 in potential interest and
penalties associated with uncertain tax positions during 2015 and the 2014 transition period, respectively. Our continuing
practice is to recognize interest expense and penalties related to income tax matters in income tax expense. The unrecognized tax
benefits of $413 would impact the effective income tax rate if recognized.
The following table summarizes the Company’s unrecognized tax benefits, excluding interest and penalties.
September 26, 2012 ................................................................................................................................................ 746$
Gross increases – current period tax positions ....................................................................................................... 25
Gross decreases – prior period tax positions .......................................................................................................... (6)
Lapse of statute of limitations ................................................................................................................................ (62)
September 25, 2013 ................................................................................................................................................ 703
Gross increases – current period tax positions ....................................................................................................... 37
Gross decreases – prior period tax positions .......................................................................................................... (1)
Lapse of statute of limitations ................................................................................................................................ (356)
September 24, 2014 ................................................................................................................................................ 383
Gross increases – current period tax positions ....................................................................................................... 4
Gross decreases – prior period tax positions .......................................................................................................... -
Lapse of statute of limitations ................................................................................................................................ -
December 31, 2014 ................................................................................................................................................. 387
Gross increases – current period tax positions ................................................................................................. 179
Gross increases – prior period tax positions ..................................................................................................... 15
Gross decreases – prior period tax positions ..................................................................................................... (6)
Lapse of statute of limitations ............................................................................................................................ (197)
December 31, 2015 ................................................................................................................................................ 378$
We file income tax returns which are periodically audited by various foreign, federal, state, and local jurisdictions. With few
exceptions, we are no longer subject to federal, state, and local tax examinations for fiscal years prior to 2012. We believe we
have certain state income tax exposures related to fiscal years 2011 through 2014. Because of the expiration of the various state
statutes of limitations for these fiscal years, it is possible that the total amount of unrecognized tax benefits will decrease by
approximately $148 within 12 months.
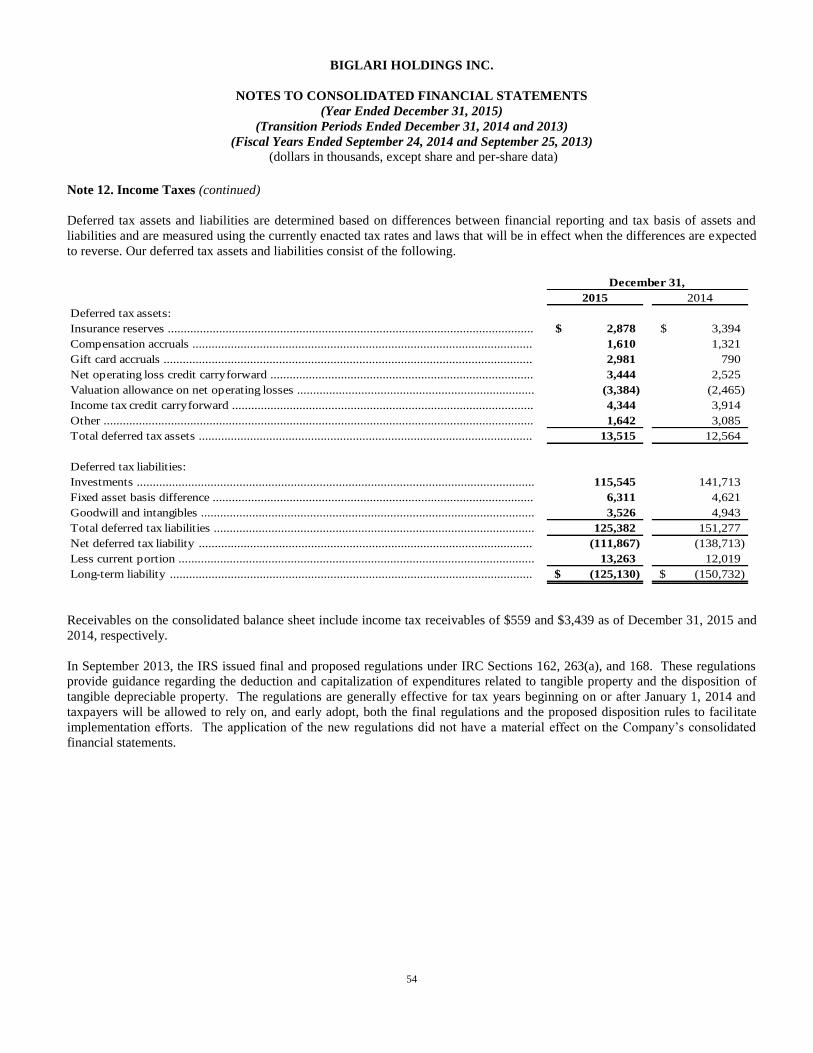
BIGLARI HOLDINGS INC.
NOTES TO CONSOLIDATED FINANCIAL STATEMENTS
(Year Ended December 31, 2015)
(Transition Periods Ended December 31, 2014 and 2013)
(Fiscal Years Ended September 24, 2014 and September 25, 2013)
(dollars in thousands, except share and per-share data)
54
Note 12. Income Taxes (continued)
Deferred tax assets and liabilities are determined based on differences between financial reporting and tax basis of assets and
liabilities and are measured using the currently enacted tax rates and laws that will be in effect when the differences are expected
to reverse. Our deferred tax assets and liabilities consist of the following.
2015 2014
Deferred tax assets:
Insurance reserves .................................................................................................................. 2,878$ 3,394$
Compensation accruals .......................................................................................................... 1,610 1,321
Gift card accruals ................................................................................................................... 2,981 790
Net operating loss credit carryforward .................................................................................. 3,444 2,525
Valuation allowance on net operating losses .......................................................................... (3,384) (2,465)
Income tax credit carryforward .............................................................................................. 4,344 3,914
Other ...................................................................................................................................... 1,642 3,085
Total deferred tax assets ........................................................................................................ 13,515 12,564
Deferred tax liabilities:
Investments ............................................................................................................................ 115,545 141,713
Fixed asset basis difference .................................................................................................... 6,311 4,621
Goodwill and intangibles ........................................................................................................ 3,526 4,943
Total deferred tax liabilities .................................................................................................... 125,382 151,277
Net deferred tax liability ........................................................................................................ (111,867) (138,713)
Less current portion ............................................................................................................... 13,263 12,019
Long-term liability ................................................................................................................. (125,130)$ (150,732)$
December 31,
Receivables on the consolidated balance sheet include income tax receivables of $559 and $3,439 as of December 31, 2015 and
2014, respectively.
In September 2013, the IRS issued final and proposed regulations under IRC Sections 162, 263(a), and 168. These regulations
provide guidance regarding the deduction and capitalization of expenditures related to tangible property and the disposition of
tangible depreciable property. The regulations are generally effective for tax years beginning on or after January 1, 2014 and
taxpayers will be allowed to rely on, and early adopt, both the final regulations and the proposed disposition rules to facilitate
implementation efforts. The application of the new regulations did not have a material effect on the Company’s consolidated
financial statements.

BIGLARI HOLDINGS INC.
NOTES TO CONSOLIDATED FINANCIAL STATEMENTS
(Year Ended December 31, 2015)
(Transition Periods Ended December 31, 2014 and 2013)
(Fiscal Years Ended September 24, 2014 and September 25, 2013)
(dollars in thousands, except share and per-share data)
55
Note 13. Notes Payable and Other Borrowings
Notes payable and other borrowings include the following.
2015 2014
Notes payable ........................................................................................................................ 2,200$ 2,200$
Unamortized original issue discount ...................................................................................... (296) (287)
Obligations under leases ......................................................................................................... 5,787 6,422
Western revolver .................................................................................................................... 786 980
Total current portion of notes payable and other borrowings ............................................... 8,477$ 9,315$
Notes payable ........................................................................................................................ 210,175$ 216,150$
Unamortized original issue discount ...................................................................................... (1,403) (1,694)
Obligations under leases ......................................................................................................... 90,178 98,139
Total long-term notes payable and other borrowings............................................................. 298,950$ 312,595$
December 31,
Steak n Shake Credit Facility On March 19, 2014, Steak n Shake and its subsidiaries entered into a new credit agreement. This credit agreement provides for a
senior secured term loan facility in an aggregate principal amount of $220,000 and a senior secured revolving credit facility in an
aggregate principal amount of up to $30,000.
The term loan is scheduled to mature on March 19, 2021. It amortizes at an annual rate of 1.0% in equal quarterly installments,
beginning June 30, 2014, at 0.25% of the original principal amount of the term loan, subject to mandatory prepayments from
excess cash flow, asset sales and other events described in the credit agreement. The balance will be due at maturity. The
revolver will be available on a revolving basis until March 19, 2019.
Steak n Shake has the right to request an incremental term loan facility from participating lenders and/or eligible assignees at any
time, up to an aggregate total principal amount not to exceed $70,000 if certain customary conditions within the credit agreement
are met.
Borrowings bear interest at a rate per annum equal to a base rate or a Eurodollar rate (minimum of 1%) plus an applicable
margin. Interest on the term loan is based on a Eurodollar rate plus an applicable margin of 3.75% or on the prime rate plus an
applicable margin of 2.75%. Interest on loans under the revolver is based on a Eurodollar rate plus an applicable margin ranging
from 2.75% to 4.25% or on the prime rate plus an applicable margin ranging from 1.75% to 3.25%. The applicable margins on
revolver loans are contingent on Steak n Shake’s total leverage ratio. The revolver also carries a commitment fee ranging from
0.40% to 0.50% per annum, according to Steak n Shake’s total leverage ratio, on the unused portion of the revolver.
The interest rate on the term loan was 4.75% on December 31, 2015.
The credit agreement includes customary affirmative and negative covenants and events of default, as well as a financial
maintenance covenant, solely with respect to the revolver, relating to the maximum total leverage ratio. Steak n Shake’s credit
facility contains restrictions on its ability to pay dividends to Biglari Holdings.
Both the term loan and the revolver have been secured by first priority security interests in substantially all the assets of Steak n
Shake. Biglari Holdings is not a guarantor under the credit facility. Approximately $118,589 of the proceeds of the term loan
were used to repay all outstanding amounts under Steak n Shake’s former credit facility and to pay related fees and expenses,
$50,000 of such proceeds were used to pay a cash dividend to Biglari Holdings, and the remaining term loan proceeds of
approximately $51,411 are being used by Steak n Shake for working capital and general corporate purposes. As of December
31, 2015, $212,375 was outstanding under the term loan, and no amount was outstanding under the revolver.

BIGLARI HOLDINGS INC.
NOTES TO CONSOLIDATED FINANCIAL STATEMENTS
(Year Ended December 31, 2015)
(Transition Periods Ended December 31, 2014 and 2013)
(Fiscal Years Ended September 24, 2014 and September 25, 2013)
(dollars in thousands, except share and per-share data)
56
Note 13. Notes Payable and Other Borrowings (continued)
We recorded losses of $1,133 in interest expense for the extinguishment of debt for fiscal year 2014 related to the write-off of
deferred loan costs associated with former credit facilities. We capitalized $4,754 in debt issuance costs in fiscal year 2014.
We had $10,188 in standby letters of credit outstanding as of December 31, 2015 and December 31, 2014.
Western Revolver
As of December 31, 2015, Western has $786 due June 13, 2016.
Interest Rate Swap
During fiscal year 2013, Steak n Shake entered into an interest rate swap for a notional amount of $65,000 which matured on
September 30, 2015. During fiscal year 2011, Steak n Shake entered into an interest rate swap agreement which matures on
February 15, 2016. The notional amount of the interest rate swap was $1,000 with a fair value of $2 on December 31, 2015.
The carrying amounts for debt reported in the consolidated balance sheet did not differ materially from their fair values at
December 31, 2015 and December 31, 2014. The fair value was determined to be a Level 3 fair value measurement.
Expected principal payments for notes payable and Western’s revolver as of December 31, 2015, are as follows.
2016 ..................... $ 2,986
2017 ..................... 2,200
2018 ..................... 2,200
2019 ..................... 2,200
2020 ..................... 2,200
2021 ..................... 201,375
Total ..................... $ 213,161
Interest No interest was capitalized in connection with financing additions to property and equipment during 2015 and the 2014 and 2013
transition periods. Interest paid on debt amounted to $10,186 for 2015, $2,841 for the 2014 transition period and $1,956 for the
2013 transition period. Interest paid on obligations under leases was $9,422, $2,577, and $2,612 for 2015, the 2014 transition
period, and the 2013 transition period, respectively. No interest was capitalized in connection with financing additions to
property and equipment during fiscal years 2014 and 2013. Interest paid on debt amounted to $8,158 in fiscal year 2014 and
$4,950 in fiscal year 2013. Interest paid on obligations under leases was $9,720 and $9,829 in fiscal years 2014 and 2013,
respectively.

BIGLARI HOLDINGS INC.
NOTES TO CONSOLIDATED FINANCIAL STATEMENTS
(Year Ended December 31, 2015)
(Transition Periods Ended December 31, 2014 and 2013)
(Fiscal Years Ended September 24, 2014 and September 25, 2013)
(dollars in thousands, except share and per-share data)
57
Note 14. Leased Assets and Lease Commitments
We lease certain physical facilities under non-cancelable lease agreements. These leases require the payment of real estate taxes,
insurance and maintenance costs. Certain leased facilities, which are no longer operated but are subleased to third parties or
franchisees, are classified below as non-operating properties. Minimum future rental payments for non-operating properties have
not been reduced by minimum sublease rentals of $10,863 related to operating leases receivable under non-cancelable subleases.
The property and equipment cost related to finance obligations and capital leases as of December 31, 2015 is as follows: $69,919
buildings, $59,678 land, $28,157 land and leasehold improvements, $2,312 equipment and $72,474 accumulated depreciation.
On December 31, 2015, obligations under non-cancelable finance obligations, capital leases, and operating leases (excluding real
estate taxes, insurance and maintenance costs) require the following minimum future rental payments.
Operating Leases
Year
Finance
Obligations
Capital
Leases Total
Operating
Property
Non-Operating
Property
2016 ......................................................................................................... $ 14,449 $ 394 $ 14,843 $ 16,323 $ 670
2017 ......................................................................................................... 12,633 320 12,953 14,686 753
2018 ......................................................................................................... 10,638 66 10,704 13,912 861
2019 ......................................................................................................... 8,516 — 8,516 12,554 898
2020 ......................................................................................................... 4,805 — 4,805 11,439 969
After 2020 ............................................................................................... 6,832 — 6,832 50,986 6,954
Total minimum future rental payments ................................................... 57,873 780 58,653 $ 119,900 $ 11,105
Less amount representing interest ........................................................... 34,327 50 34,377
Total principal obligations under leases .................................................. 23,546 730 24,276
Less current portion ................................................................................. 5,426 361 5,787
Non-current principal obligations under leases ....................................... 18,120 369 18,489
Residual value at end of lease term ......................................................... 71,689 — 71,689
Obligations under leases .......................................................................... $ 89,809 $ 369 $ 90,178
Rent expense is presented below.
2015 2014 2013 2014 2013
(unaudited)
Minimum rent ................................................ 18,476$ 5,069$ 4,706$ 18,322$ 17,097$
Contingent rent.............................................. 2,022 356 295 1,549 1,356
Rent expense.................................................. 20,498$ 5,425$ 5,001$ 19,871$ 18,453$
Transition Period Fiscal Year
Non-cancellable finance obligations were created when the Company, under prior management, entered into certain build-to-suit
or sale leaseback arrangements. As a result of continuing involvement in the underlying leases (generally due to right of
substitution or purchase option provisions of the leases), the Company accounts for the leases as financings.

BIGLARI HOLDINGS INC.
NOTES TO CONSOLIDATED FINANCIAL STATEMENTS
(Year Ended December 31, 2015)
(Transition Periods Ended December 31, 2014 and 2013)
(Fiscal Years Ended September 24, 2014 and September 25, 2013)
(dollars in thousands, except share and per-share data)
58
Note 15. Related Party Transactions
On July 1, 2013, Biglari Holdings entered into the following agreements with Mr. Biglari, its Chairman and Chief Executive
Officer: (i) a Stock Purchase Agreement for the sale of Biglari Capital to Mr. Biglari; (ii) a Shared Services Agreement with
Biglari Capital, and (iii) a First Amendment to the Amended and Restated Incentive Bonus Agreement, dated September 28,
2010, with Mr. Biglari (the “Incentive Agreement Amendment”). The transactions contemplated thereby were unanimously
approved by the independent Governance, Compensation and Nominating Committee of the Board of Directors of the Company
(the “Committee”), which retained separate counsel, tax/accounting advisors, an independent compensation consultant, and a
financial advisor to assist the Committee in the structuring, evaluation, and negotiation of such transactions.
Stock Purchase Agreement
Pursuant to the Stock Purchase Agreement, Biglari Holdings sold all the shares of Biglari Capital to Mr. Biglari for a purchase
price of $1,700 in cash (the “Biglari Capital Transaction”) and recorded a gain of $1,597. Prior to the execution and delivery of
the Stock Purchase Agreement, Biglari Capital distributed to the Company substantially all of Biglari Capital’s partnership
interests in The Lion Fund, L.P. (including, without limitation, Biglari Capital’s adjusted capital balance in its capacity as
general partner of The Lion Fund, L.P., which totaled $5,721). Biglari Capital thus retained solely a general partner interest in
each of The Lion Fund, L.P. and The Lion Fund II, L.P. at the time of the Biglari Capital Transaction.
Shared Services Agreement
Connected with the Biglari Capital Transaction, Biglari Holdings and Biglari Capital entered into the Shared Services Agreement
pursuant to which Biglari Holdings provides certain services to Biglari Capital in exchange for a 6% hurdle rate for Biglari
Holdings and its subsidiaries (as compared to a 5% hurdle rate for all other limited partners) in order to determine the incentive
reallocation to Biglari Capital, as general partner of The Lion Fund, L.P. and The Lion Fund II, L.P., under their respective
partnership agreements. The incentive reallocation to Biglari Capital is equal to 25% of the net profits allocated to the limited
partners in excess of their applicable hurdle rate over the previous high-water mark. The Shared Services Agreement runs for an
initial five-year term, and automatically renews for successive five-year periods, unless terminated by either party effective at the
end of the initial or the renewed term, as applicable. The term of the Shared Services Agreement coincides with the lock-up
period for the Company’s investments in The Lion Fund, L.P. and The Lion Fund II, L.P. under their respective partnership
agreements. During 2015, the 2014 transition period and fiscal years 2014 and 2013, the Company provided services for Biglari
Capital under the Shared Services Agreement costing an aggregate of $4,425, $44, $1,590 and $101, respectively.
Investments in The Lion Fund, L.P. and The Lion Fund II, L.P.
During 2015 the Company contributed cash of $88,500. During fiscal years 2014 and 2013, the Company contributed cash and
securities it owned with an aggregate value of $174,418 and $377,636, respectively, in exchange for limited partner interests in
The Lion Fund, L.P. and The Lion Fund II, L.P. As of December 31, 2015, the Company’s investments in The Lion Fund, L.P.
and The Lion Fund II, L.P. had a fair value of $734,668.
As the general partner of the investment partnerships, Biglari Capital on December 31 of each year will earn an incentive
reallocation fee for the Company’s investments equal to 25% of the net profits above an annual hurdle rate of 6%. Our policy is
to accrue an estimated incentive fee throughout the year. For calendar year 2015, the incentive reallocation from Biglari
Holdings to Biglari Capital was $23, all of which was associated with gains on the Company’s common stock. Based on Biglari
Holdings’ $166,168 of earnings from the investment partnerships for calendar year 2014, the total incentive reallocation from
Biglari Holdings to Biglari Capital was $34,406. Based on Biglari Holdings’ $74,526 of earnings from the investment
partnerships for calendar year 2013, the total incentive reallocation from Biglari Holdings to Biglari Capital was $14,702,
including $3,655 associated with gains on the Company’s common stock. Gains on the Company’s common stock are eliminated
in our financial statements. As of September 25, 2013, the Company accrued $5,033 for the incentive fee for Biglari Capital. No
amount was accrued as of September 24, 2014 because net profits for the calendar year to date did not exceed the hurdle.

BIGLARI HOLDINGS INC.
NOTES TO CONSOLIDATED FINANCIAL STATEMENTS
(Year Ended December 31, 2015)
(Transition Periods Ended December 31, 2014 and 2013)
(Fiscal Years Ended September 24, 2014 and September 25, 2013)
(dollars in thousands, except share and per-share data)
59
Note 15. Related Party Transactions (continued)
Incentive Agreement Amendment
Also in connection with the Biglari Capital Transaction, Biglari Holdings and Mr. Biglari entered into the Incentive Agreement
Amendment which amends the Amended and Restated Incentive Bonus Agreement with Mr. Biglari to reflect and give effect to
the Biglari Capital Transaction, which excludes earnings by the investment partnerships from the calculation of Mr. Biglari’s
incentive bonus.
License Agreement
On January 11, 2013, the Company entered into a Trademark License Agreement (the “License Agreement”) with Mr. Biglari.
The License Agreement was unanimously approved by the Committee. In addition, the license under the License Agreement is
provided on a royalty-free basis in the absence of specified extraordinary events described below. Accordingly, the Company
and its subsidiaries have paid no royalties to Mr. Biglari under the License Agreement since its inception.
Under the License Agreement, Mr. Biglari granted to the Company an exclusive license to use the Biglari and Biglari Holdings
names (the “Licensed Marks”) in association with various products and services (collectively the “Products and Services”). Upon
(a) the expiration of twenty years from the date of the License Agreement (subject to extension as provided in the License
Agreement), (b) Mr. Biglari’s death, (c) the termination of Mr. Biglari’s employment by the Company for Cause (as defined in
the License Agreement), or (d) Mr. Biglari’s resignation from his employment with the Company absent an Involuntary
Termination Event (as defined in the License Agreement), the Licensed Marks for the Products and Services will transfer from
Mr. Biglari to the Company, without any compensation, if the Company is continuing to use the Licensed Marks in the ordinary
course of its business. Otherwise, the rights will revert to Mr. Biglari.
If (i) a Change of Control (as defined in the License Agreement) of the Company; (ii) the termination of Mr. Biglari’s
employment by the Company without Cause; or (iii) Mr. Biglari’s resignation from his employment with the Company due to an
Involuntary Termination Event (each, a “Triggering Event”) were to occur, Mr. Biglari would be entitled to receive a 2.5%
royalty on “Revenues” with respect to the “Royalty Period.” The royalty payment to Mr. Biglari would not apply to all revenues
received by Biglari Holdings and its subsidiaries nor would it apply retrospectively (i.e., to revenues received with respect to the
period prior to the Triggering Event). The royalty would apply to revenues recorded by the Company on an accrual basis under
GAAP, solely with respect to the defined period of time after the Triggering Event equal to the Royalty Period, from a covered
Product, Service or business that (1) has used the Biglari Holdings or Biglari name at any time during the term of the License
Agreement, whether prior to or after a Triggering Event, or (2) the Company has specifically identified, prior to a Triggering
Event, will use the name Biglari or Biglari Holdings.
“Revenues” means all revenues received, on an accrual basis under GAAP, by the Company, its subsidiaries and affiliates from
the following: (1) all Products and Services covered by the License Agreement bearing or associated with the names Biglari and
Biglari Holdings at any time (whether prior to or after a Triggering Event). This category would include, without limitation, the
use of Biglari or Biglari Holdings in the public name of a business providing any covered Product or Service; and (2) all covered
Products, Services and businesses that the Company has specifically identified, prior to a Triggering Event, will bear, use or be
associated with the name Biglari or Biglari Holdings.
The Committee unanimously approved the association of the Biglari name and mark with all of Steak n Shake’s restaurants
(including Company operated and franchised locations), products and brands. On May 14, 2013, the Company, Steak n Shake,
LLC and Steak n Shake Enterprises, Inc. entered into a Trademark Sublicense Agreement in connection therewith. Accordingly,
revenues received by the Company, its subsidiaries and affiliates from Steak n Shake’s restaurants, products and brands would
come within the definition of Revenues for purposes of the License Agreement.
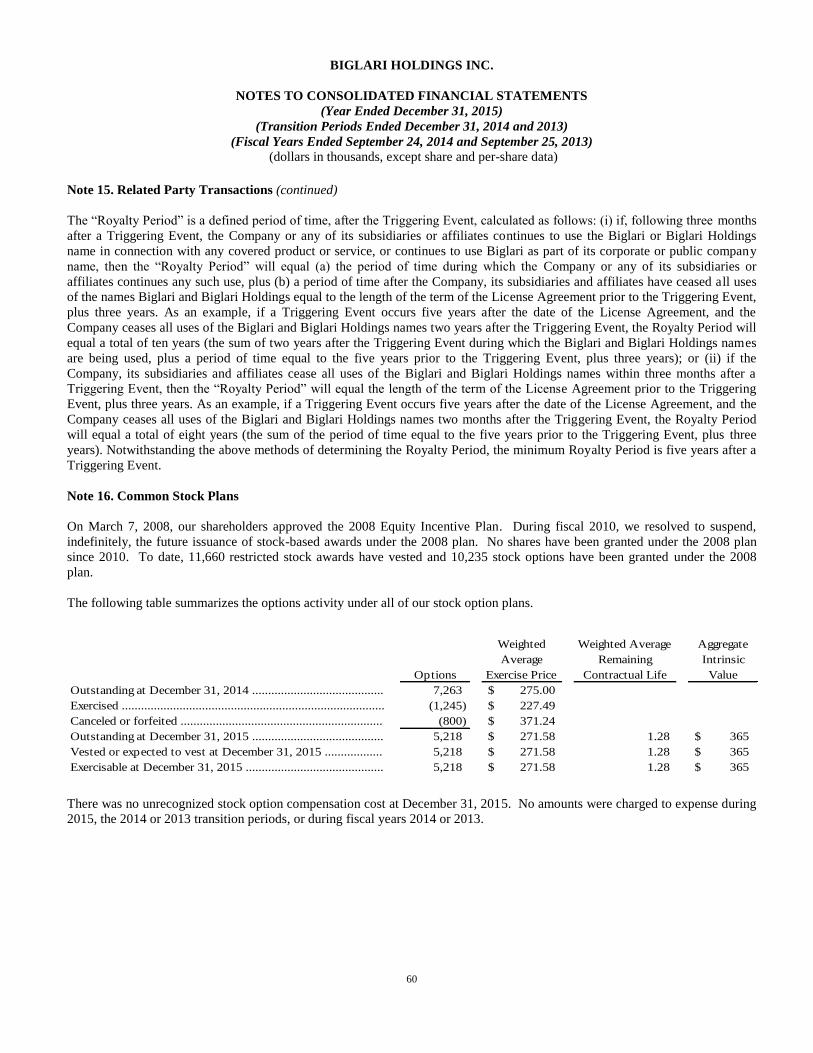
BIGLARI HOLDINGS INC.
NOTES TO CONSOLIDATED FINANCIAL STATEMENTS
(Year Ended December 31, 2015)
(Transition Periods Ended December 31, 2014 and 2013)
(Fiscal Years Ended September 24, 2014 and September 25, 2013)
(dollars in thousands, except share and per-share data)
60
Note 15. Related Party Transactions (continued)
The “Royalty Period” is a defined period of time, after the Triggering Event, calculated as follows: (i) if, following three months
after a Triggering Event, the Company or any of its subsidiaries or affiliates continues to use the Biglari or Biglari Holdings
name in connection with any covered product or service, or continues to use Biglari as part of its corporate or public company
name, then the “Royalty Period” will equal (a) the period of time during which the Company or any of its subsidiaries or
affiliates continues any such use, plus (b) a period of time after the Company, its subsidiaries and affiliates have ceased all uses
of the names Biglari and Biglari Holdings equal to the length of the term of the License Agreement prior to the Triggering Event,
plus three years. As an example, if a Triggering Event occurs five years after the date of the License Agreement, and the
Company ceases all uses of the Biglari and Biglari Holdings names two years after the Triggering Event, the Royalty Period will
equal a total of ten years (the sum of two years after the Triggering Event during which the Biglari and Biglari Holdings names
are being used, plus a period of time equal to the five years prior to the Triggering Event, plus three years); or (ii) if the
Company, its subsidiaries and affiliates cease all uses of the Biglari and Biglari Holdings names within three months after a
Triggering Event, then the “Royalty Period” will equal the length of the term of the License Agreement prior to the Triggering
Event, plus three years. As an example, if a Triggering Event occurs five years after the date of the License Agreement, and the
Company ceases all uses of the Biglari and Biglari Holdings names two months after the Triggering Event, the Royalty Period
will equal a total of eight years (the sum of the period of time equal to the five years prior to the Triggering Event, plus three
years). Notwithstanding the above methods of determining the Royalty Period, the minimum Royalty Period is five years after a
Triggering Event.
Note 16. Common Stock Plans
On March 7, 2008, our shareholders approved the 2008 Equity Incentive Plan. During fiscal 2010, we resolved to suspend,
indefinitely, the future issuance of stock-based awards under the 2008 plan. No shares have been granted under the 2008 plan
since 2010. To date, 11,660 restricted stock awards have vested and 10,235 stock options have been granted under the 2008
plan.
The following table summarizes the options activity under all of our stock option plans.
Options
Weighted
Average
Exercise Price
Weighted Average
Remaining
Contractual Life
Aggregate
Intrinsic
Value
Outstanding at December 31, 2014 ......................................... 7,263 $ 275.00
Exercised .................................................................................. (1,245) $ 227.49
Canceled or forfeited ............................................................... (800) $ 371.24
Outstanding at December 31, 2015 ......................................... 5,218 $ 271.58 1.28 $ 365
Vested or expected to vest at December 31, 2015 .................. 5,218 $ 271.58 1.28 $ 365
Exercisable at December 31, 2015 ........................................... 5,218 $ 271.58 1.28 $ 365
There was no unrecognized stock option compensation cost at December 31, 2015. No amounts were charged to expense during
2015, the 2014 or 2013 transition periods, or during fiscal years 2014 or 2013.

BIGLARI HOLDINGS INC.
NOTES TO CONSOLIDATED FINANCIAL STATEMENTS
(Year Ended December 31, 2015)
(Transition Periods Ended December 31, 2014 and 2013)
(Fiscal Years Ended September 24, 2014 and September 25, 2013)
(dollars in thousands, except share and per-share data)
61
Note 17. Commitments and Contingencies
We are involved in various legal proceedings and have certain unresolved claims pending. We believe, based on examination of
these matters and experiences to date, that the ultimate liability, if any, in excess of amounts already provided in our consolidated
financial statements is not likely to have a material effect on our results of operations, financial position or cash flows.
In 2013 two shareholders of the Company filed derivative actions putatively on behalf of the Company against the members of
our Board of Directors in the United States District Courts for the Southern District of Indiana and the Western District of
Texas. The actions were consolidated in the Southern District of Indiana in 2014. On March 18, 2015, the United States District
Court for the Southern District of Indiana granted a motion to dismiss the derivative actions in favor of the Company. In
addition, the Court issued judgment on all counts in favor of the Company and its directors.
The two shareholders appealed the Southern District of Indiana Court’s March 18, 2015 decision. On February 17, 2016, the
United States Court of Appeals for the Seventh Circuit affirmed the decision of the district court dismissing, in their entirety, all
claims made against the Company and its Board of Directors.
Note 18. Fair Value of Financial Assets and Liabilities
The fair values of substantially all of our financial instruments were measured using market or income approaches. Considerable
judgment may be required in interpreting market data used to develop the estimates of fair value. Accordingly, the fair values
presented are not necessarily indicative of the amounts that could be realized in an actual current market exchange. The use of
alternative market assumptions and/or estimation methodologies may have a material effect on the estimated fair value. The
hierarchy for measuring fair value consists of Levels 1 through 3, which are described below.
Level 1 – Inputs represent unadjusted quoted prices for identical assets or liabilities exchanged in active markets.
Level 2 – Inputs include directly or indirectly observable inputs (other than Level 1 inputs) such as quoted prices for
similar assets or liabilities exchanged in active or inactive markets; quoted prices for identical assets or liabilities
exchanged in inactive markets; other inputs that may be considered in fair value determinations of the assets or
liabilities, such as interest rates and yield curves, volatilities, prepayment speeds, loss severities, credit risks and default
rates; and inputs that are derived principally from or corroborated by observable market data by correlation or other
means. Pricing evaluations generally reflect discounted expected future cash flows, which incorporate yield curves for
instruments with similar characteristics, such as credit ratings, estimated durations and yields for other instruments of
the issuer or entities in the same industry sector.
Level 3 – Inputs include unobservable inputs used in the measurement of assets and liabilities. Management is required
to use its own assumptions regarding unobservable inputs because there is little, if any, market activity in the assets or
liabilities and we may be unable to corroborate the related observable inputs. Unobservable inputs require management
to make certain projections and assumptions about the information that would be used by market participants in pricing
assets or liabilities.

BIGLARI HOLDINGS INC.
NOTES TO CONSOLIDATED FINANCIAL STATEMENTS
(Year Ended December 31, 2015)
(Transition Periods Ended December 31, 2014 and 2013)
(Fiscal Years Ended September 24, 2014 and September 25, 2013)
(dollars in thousands, except share and per-share data)
62
Note 18. Fair Value of Financial Assets and Liabilities (continued)
The following methods and assumptions were used to determine the fair value of each class of the following assets and liabilities
recorded at fair value in the consolidated balance sheet:
Cash equivalents: Cash equivalents primarily consist of money market funds which are classified within Level 1 of the fair value
hierarchy.
Equity securities: The Company’s investments in equity securities are classified within Level 1 of the fair value hierarchy.
Bonds: The Company’s investments in bonds are classified within Level 2 of the fair value hierarchy.
Non-qualified deferred compensation plan investments: The assets of the non-qualified plan are set up in a rabbi trust. They
represent mutual funds and are classified within Level 1 of the fair value hierarchy.
Interest rate swaps: Interest rate swaps are marked to market each reporting period and are classified within Level 2 of the fair
value hierarchy.
As of December 31, 2015 and December 31, 2014 the fair values of financial assets and liabilities were as follows.
Level 1 Level 2 Level 3 Total Level 1 Level 2 Level 3 Total
Assets
Cash equivalents ........................... 700$ -$ -$ 700$ 11,227$ -$ -$ 11,227$
Equity securities:
Insurance ................................... 5,046 - - 5,046 5,781 - - 5,781
Bonds............................................ - 21,304 - 21,304 - 7,644 - 7,644
Non-qualified deferred
compensation plan investments.. 2,203 - - 2,203 1,958 - - 1,958
Total assets at fair value ............... 7,949$ 21,304$ -$ 29,253$ 18,966$ 7,644$ -$ 26,610$
Liabilities
Interest rate swaps ........................ -$ 2$ -$ 2$ -$ 175$ -$ 175$
Total liabilities at fair value .......... -$ 2$ -$ 2$ -$ 175$ -$ 175$
2015 2014
December 31,
There were no changes in our valuation techniques used to measure fair values on a recurring basis.
The Company recorded an impairment to long-lived assets of $51 during 2015. The Company did not record any impairment
during the 2014 transition period. The Company recorded an impairment of $41 during the 2013 transition period. During fiscal
years 2014 and 2013, the Company recorded impairments on long-lived assets of $1,433 and $1,666, respectively. The fair value
of the long-lived assets was determined based on Level 2 inputs using quoted prices for similar properties and quoted prices for
the properties from brokers. The fair value of the assets impaired was not material for any of the applicable periods.
During fiscal year 2013, the Company recorded impairment on intangible assets of $1,244. The fair value was determined based
on a discounted cash flow analysis which is a level 3 measurement. The fair value of the trade name was not material at
impairment.

BIGLARI HOLDINGS INC.
NOTES TO CONSOLIDATED FINANCIAL STATEMENTS
(Year Ended December 31, 2015)
(Transition Periods Ended December 31, 2014 and 2013)
(Fiscal Years Ended September 24, 2014 and September 25, 2013)
(dollars in thousands, except share and per-share data)
63
Note 19. Accumulated Other Comprehensive Income
Changes in the balances of each component of accumulated other comprehensive income (loss), net of tax, were as follows.
Foreign
Currency
Translation
Adjustments
Investment
Gain
Accumulated
O ther
Comprehensive
Loss
Foreign
Currency
Translation
Adjustments
Investment
Gain
Accumulated
Other
Comprehensive
Loss
Beginning Balance .......................... (620)$ (163)$ (783)$ (574)$ 52$ (522)$
Other comprehensive loss before
reclassifications ........................... (2,372) (565) (2,937) (46) (215) (261)
Reclassification to (earnings) loss ... - 41 41 - - -
Ending Balance .............................. (2,992)$ (687)$ (3,679)$ (620)$ (163)$ (783)$
Foreign
Currency
Translation
Adjustments
Investment
Gain
Accumulated
Other
Comprehensive
Income (Loss)
Foreign
Currency
Translation
Adjustments
Investment
Gain
Accumulated
Other
Comprehensive
Income (Loss)
Beginning Balance .......................... 8$ 21,449$ 21,457$ -$ 43,897$ 43,897$
Other comprehensive income (loss)
before reclassifications ................ (582) (3,056) (3,638) 8 92,198 92,206
Reclassification to (earnings) loss ... - (18,341) (18,341) - (114,646) (114,646)
Ending Balance .............................. (574)$ 52$ (522)$ 8$ 21,449$ 21,457$
2015 Transition Period 2014
Fiscal Year 2014 Fiscal Year 2013
The following reclassifications were made from accumulated other comprehensive income to the consolidated statement of
earnings.
Reclassifications from
Accumulated Other
Comprehensive Income 2015
Transition
Period
2014
Affected Line Item in the
Consolidated Statement of Earnings
Investment loss -$ -$ Investment gains (including contributions)
(62) - Insurance premiums and other
(21) - Income tax expense (benefit)
(41)$ -$ Net of tax
Reclassifications from
Accumulated Other
Comprehensive Income
Fiscal
Year
2014
Fiscal
Year
2013
Affected Line Item in the
Consolidated Statement of Earnings
Investment gain 29,524$ 182,286$ Investment gains (including contributions)
54 - Insurance premiums and other
11,237 67,640 Income tax expense (benefit)
18,341$ 114,646$ Net of tax
BIGLARI HOLDINGS INC.
NOTES TO CONSOLIDATED FINANCIAL STATEMENTS
(Year Ended December 31, 2015)
(Transition Periods Ended December 31, 2014 and 2013)
(Fiscal Years Ended September 24, 2014 and September 25, 2013)
(dollars in thousands, except share and per-share data)
64
Note 20. Business Segment Reporting
Our reportable business segments are organized in a manner that reflects how management views those business activities.
Certain businesses have been grouped together for segment reporting based upon operations even though those business units are
operated under separate management.
Our restaurant operations includes Steak n Shake and Western. As a result of the acquisitions of Maxim and First Guard, the
Company reports segment information for these businesses. Prior to 2015, other business activities not specifically identified
with reportable business segments were presented in corporate. Beginning in 2015, such other business activities are presented in
other within total operating businesses. Prior periods have been reclassified to conform to the current year presentation. We
report our earnings from investment partnerships separate from corporate.
We assess and measure segment operating results based on segment earnings as disclosed below. Segment earnings from
operations are not necessarily indicative of cash available to fund cash requirements, nor are they synonymous with cash flow
from operations.
The tabular information that follows shows data of our reportable segments reconciled to amounts reflected in the consolidated
financial statements.
A disaggregation of select data from our consolidated statements of earnings for 2015, transition periods 2014 and 2013, and
fiscal years 2014 and 2013 is presented in the tables that follow.
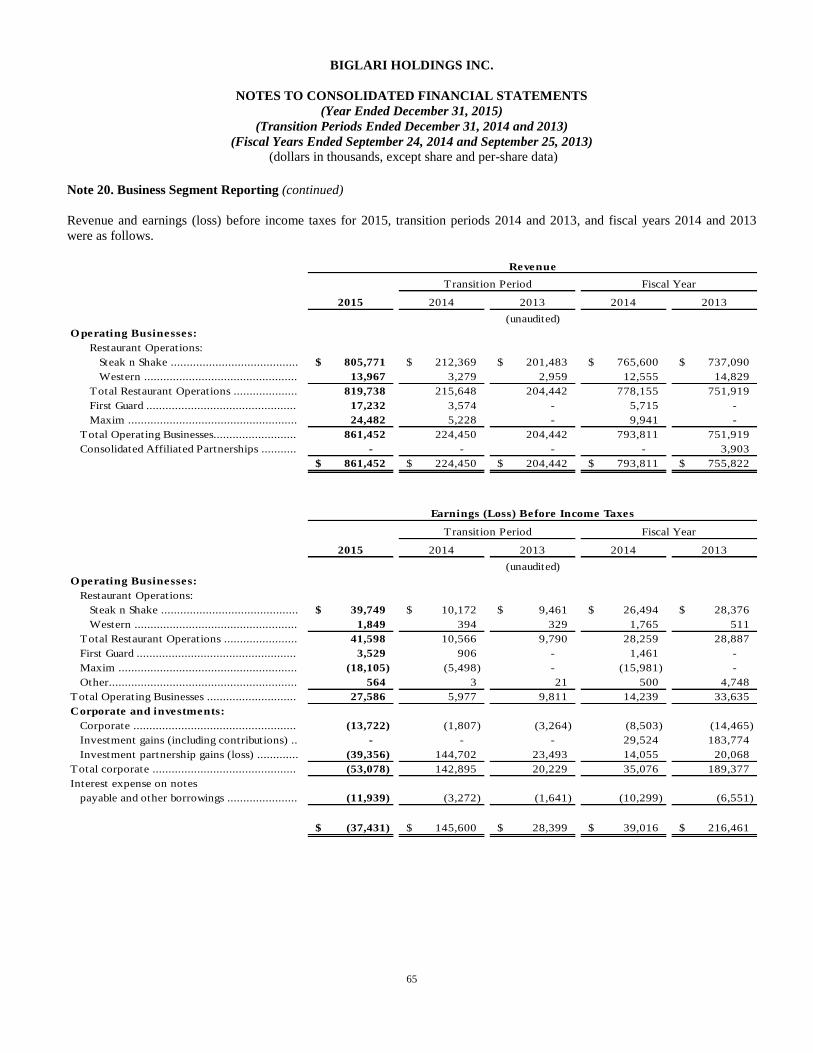
BIGLARI HOLDINGS INC.
NOTES TO CONSOLIDATED FINANCIAL STATEMENTS
(Year Ended December 31, 2015)
(Transition Periods Ended December 31, 2014 and 2013)
(Fiscal Years Ended September 24, 2014 and September 25, 2013)
(dollars in thousands, except share and per-share data)
65
Note 20. Business Segment Reporting (continued)
Revenue and earnings (loss) before income taxes for 2015, transition periods 2014 and 2013, and fiscal years 2014 and 2013
were as follows.
2015 2014 2013 2014 2013
(unaudited)
O perating Businesses:
Restaurant Operations:
Steak n Shake ........................................ 805,771$ 212,369$ 201,483$ 765,600$ 737,090$
Western ................................................ 13,967 3,279 2,959 12,555 14,829
Total Restaurant Operations .................... 819,738 215,648 204,442 778,155 751,919
First Guard ............................................... 17,232 3,574 - 5,715 -
Maxim ..................................................... 24,482 5,228 - 9,941 -
Total Operating Businesses.......................... 861,452 224,450 204,442 793,811 751,919
Consolidated Affiliated Partnerships ........... - - - - 3,903
861,452$ 224,450$ 204,442$ 793,811$ 755,822$
2015 2014 2013 2014 2013
(unaudited)
O perating Businesses:
Restaurant Operations:
Steak n Shake ........................................... 39,749$ 10,172$ 9,461$ 26,494$ 28,376$
Western ................................................... 1,849 394 329 1,765 511
Total Restaurant Operations ....................... 41,598 10,566 9,790 28,259 28,887
First Guard .................................................. 3,529 906 - 1,461 -
Maxim ........................................................ (18,105) (5,498) - (15,981) -
Other........................................................... 564 3 21 500 4,748
Total Operating Businesses ............................ 27,586 5,977 9,811 14,239 33,635
Corporate and investments:
Corporate ................................................... (13,722) (1,807) (3,264) (8,503) (14,465)
Investment gains (including contributions) .. - - - 29,524 183,774
Investment partnership gains (loss) ............. (39,356) 144,702 23,493 14,055 20,068
Total corporate ............................................. (53,078) 142,895 20,229 35,076 189,377
Interest expense on notes
payable and other borrowings ...................... (11,939) (3,272) (1,641) (10,299) (6,551)
(37,431)$ 145,600$ 28,399$ 39,016$ 216,461$
Transition Period
Transition Period
Revenue
Fiscal Year
Earnings (Loss) Before Income Taxes
Fiscal Year

BIGLARI HOLDINGS INC.
NOTES TO CONSOLIDATED FINANCIAL STATEMENTS
(Year Ended December 31, 2015)
(Transition Periods Ended December 31, 2014 and 2013)
(Fiscal Years Ended September 24, 2014 and September 25, 2013)
(dollars in thousands, except share and per-share data)
66
Note 20. Business Segment Reporting (continued)
A disaggregation of our consolidated capital expenditure and depreciation and amortization captions for 2015, transition periods
2014 and 2013, and fiscal years 2014 and 2013 is presented in the tables that follow.
2015 2014 2013 2014 2013
(unaudited)
O perating Businesses:
Restaurant Operations:
Steak n Shake ........................................... 8,434$ 8,733$ 4,997$ 25,398$ 6,337$
Western ................................................... 43 - 11 1,113 64
Total Restaurant Operations ....................... 8,477 8,733 5,008 26,511 6,401
First Guard .................................................. 102 10 - - -
Maxim ........................................................ 16 57 - 312 -
Other........................................................... 2,486 7 275 6,840 6,235
Total Operating Businesses ............................ 11,081 8,807 5,283 33,663 12,636
Corporate ................................................... 2 9 - 2,149 1,531
Consolidated results ........................................ 11,083$ 8,816$ 5,283$ 35,812$ 14,167$
2015 2014 2013 2014 2013
(unaudited)
O perating Businesses:
Restaurant Operations:
Steak n Shake ........................................... 23,045$ 6,289$ 6,274$ 23,402$ 24,230$
Western ................................................... 691 172 160 662 693
Total Restaurant Operations ....................... 23,736 6,461 6,434 24,064 24,923
First Guard .................................................. 36 30 - 38 -
Maxim ........................................................ 296 151 - 211 -
Other........................................................... 412 116 34 279 -
Total Operating Businesses ............................ 24,480 6,758 6,468 24,592 24,923
Corporate ................................................... 300 70 98 313 327
Consolidated results ........................................ 24,780$ 6,828$ 6,566$ 24,905$ 25,250$
Transition Period Fiscal Year
Capital Expenditures
Transition Period Fiscal Year
Depreciation and Amortization
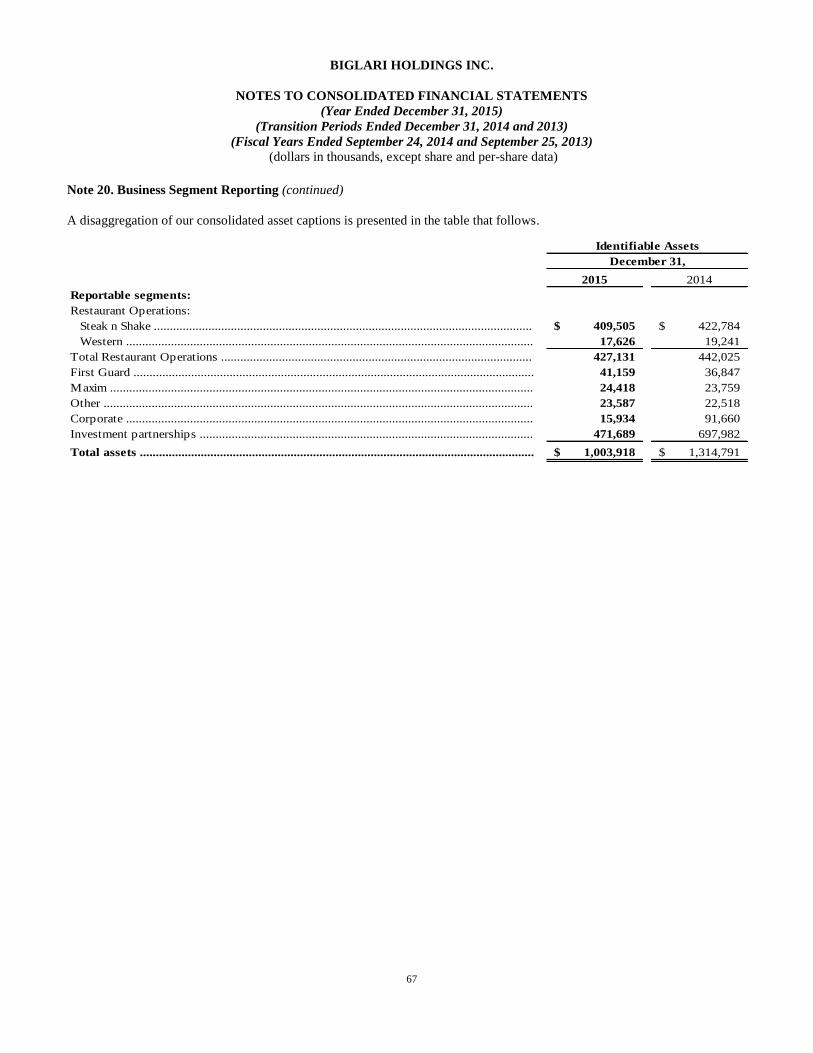
BIGLARI HOLDINGS INC.
NOTES TO CONSOLIDATED FINANCIAL STATEMENTS
(Year Ended December 31, 2015)
(Transition Periods Ended December 31, 2014 and 2013)
(Fiscal Years Ended September 24, 2014 and September 25, 2013)
(dollars in thousands, except share and per-share data)
67
Note 20. Business Segment Reporting (continued)
A disaggregation of our consolidated asset captions is presented in the table that follows.
2015 2014
Reportable segments:
Restaurant Operations:
Steak n Shake ...................................................................................................................... 409,505$ 422,784$
Western ............................................................................................................................... 17,626 19,241
Total Restaurant Operations ................................................................................................. 427,131 442,025
First Guard ............................................................................................................................. 41,159 36,847
Maxim .................................................................................................................................... 24,418 23,759
Other ...................................................................................................................................... 23,587 22,518
Corporate ............................................................................................................................... 15,934 91,660
Investment partnerships ........................................................................................................ 471,689 697,982
Total assets ........................................................................................................................... 1,003,918$ 1,314,791$
Identifiable Assets
December 31,

BIGLARI HOLDINGS INC.
NOTES TO CONSOLIDATED FINANCIAL STATEMENTS
(Year Ended December 31, 2015)
(Transition Periods Ended December 31, 2014 and 2013)
(Fiscal Years Ended September 24, 2014 and September 25, 2013)
(dollars in thousands, except share and per-share data)
68
Note 21. Quarterly Financial Data (Unaudited)
1st
Quarter 2nd
Quarter 3rd
Quarter (3)
4th
Quarter (3)
205,828$ 221,956$ 218,443$ 215,225$
38,686 51,208 46,791 46,199
206,144 213,172 209,493 209,366
17,173 (2,177) 9,050 (61,477)
9,983 26 9,298 (35,150)
5.36$ 0.01$ 7.36$ (27.88)$
5.36$ 0.01$ 7.35$ (27.88)$
172,339$ 234,574$ 193,229$ 193,669$
38,377 52,191 39,724 37,359
167,843 224,753 190,429 196,512
24,864 (12,263) 13,367 13,048
16,491 (5,803) 9,594 8,522
9.62$ (3.39)$ 5.67$ 4.96$
9.60$ (3.39)$ 5.66$ 4.95$
166,511$ 225,210$ 184,602$ 179,499$
37,613 50,189 43,476 41,541
159,181 220,606 178,137 177,164
5,930 1,420 169,834 39,277
4,562 2,180 106,704 26,825
2.94$ 1.41$ 69.08$ 17.46$
2.94$ 1.40$ 68.92$ 17.43$
(1)
(2)
(3)
(4)
(5)
For the year ended December 31, 2015
Total revenues ...............................................................................
Diluted earnings (loss) per common share (4) ..........................
Gross profit (2) ..............................................................................
Costs and expenses .......................................................................
Earnings (loss) before income taxes ...........................................
Net earnings (loss) attributable to Biglari Holdings Inc. (5) ...
Basic earnings (loss) per common share (4) ..............................
Costs and expenses .........................................................................
For the year ended September 24, 2014 (52 weeks) (1)
Total revenues .................................................................................
Gross profit (2) ...............................................................................
Costs and expenses .........................................................................
Earnings (loss) before income taxes .................................................
Net earnings (loss) attributable to Biglari Holdings Inc. (5) ............
Basic earnings (loss) per common share (4) ....................................
Diluted earnings (loss) per common share (4) .................................
For the year ended September 25, 2013 (52 weeks) (1)
Total revenues .................................................................................
Gross profit (2) ...............................................................................
We recorded pre-tax gain on contribution to investment partnerships of $29,524 during the third quarter of 2014, $162,869 during
the third quarter of 2013 and $19,877 during the fourth quarter of 2013.
Earnings per share of common stock is based on the weighted average number of shares outstanding during the year. In fiscal year
2014 and 2013 the Company completed rights offerings in which 344,261 and 286,767 new shares of common stock were issued,
respectively. Earnings per share have been retroactively restated to give effect to the rights offerings.
Net earnings attributable to Biglari Holdings Inc. includes investment partnership losses of $39,356 ($18,168 net of tax) in 2015 and
investment partnership gains of $14,055 ($12,316 net of tax) in 2014 and $20,068 ($13,296 net of tax) in 2013.
Earnings before income taxes ...........................................................
Net earnings attributable to Biglari Holdings Inc. (5) ......................
Basic earnings per common share (4) ..............................................
Diluted earnings per common share (4) ...........................................
Our former fiscal year includes quarters consisting of 12, 16, 12 and 12 weeks, respectively.
We define gross profit as net revenue less restaurant cost of sales, media cost of sales, and insurance losses and underwriting
expenses, which excludes depreciation and amortization.
The investment partnerships concentrate investments, which expose them to more market price fluctuations than might be the
case were investments more diversified.
BIGLARI HOLDINGS INC.
NOTES TO CONSOLIDATED FINANCIAL STATEMENTS
(Year Ended December 31, 2015)
(Transition Periods Ended December 31, 2014 and 2013)
(Fiscal Years Ended September 24, 2014 and September 25, 2013)
(dollars in thousands, except share and per-share data)
69
Note 22. Supplemental Disclosures of Cash Flow Information
During 2015, we had no new capital lease obligations or lease retirements, and had $537 of capital expenditures in accounts
payable at December 31, 2015. During the 2014 transition period, we had no new capital lease obligations or lease retirements,
and had $981 of capital expenditures in accounts payable at December 31, 2014. During the 2013 transition period, we had no
new capital lease obligations and had $409 of capital expenditures in accounts payable at December 31, 2013. During fiscal year
2014, we had no new capital lease obligations or lease retirements, and had $2,269 of capital expenditures in accounts payable at
year-end. During fiscal year 2013, we had four new capital lease obligations of $2,311 and had $1,043 of capital expenditures in
accounts payable at year-end.

70
Item 9.
Changes in and Disagreements with Accountants on Accounting and Financial Disclosure
Not applicable.
Item 9A.
Controls and Procedures
Based on an evaluation of our disclosure controls and procedures (as defined in Exchange Act Rules 13a-15(e) and 15d-15(e)),
our Chief Executive Officer and Controller have concluded that our disclosure controls and procedures were effective as of
December 31, 2015.
There have been no changes in our internal control over financial reporting that occurred during the quarter ended December 31,
2015 that have materially affected, or that are reasonably likely to materially affect, our internal control over financial reporting.
Item 9B.
Other Information
None.

71
Part III
Item 10. Directors, Executive Officers and Corporate Governance
The information required by this Item will be contained in the Company’s definitive proxy statement for its 2016 Annual
Meeting of Shareholders’, to be filed on or before April 29, 2016, and such information is incorporated herein by reference.
Item 11.
Executive Compensation
The information required by this Item will be contained in the Company’s definitive proxy statement for its 2016 Annual
Meeting of Shareholders’, to be filed on or before April 29, 2016, and such information is incorporated herein by reference.
Item 12.
Security Ownership of Certain Beneficial Owners and Management and Related Stockholder
Matters
The information required by this Item will be contained in the Company’s definitive proxy statement for its 2016 Annual
Meeting of Shareholders’, to be filed on or before April 29, 2016, and such information is incorporated herein by reference.
Item 13.
Certain Relationships and Related Transactions, and Director Independence
The information required by this Item will be contained in the Company’s definitive proxy statement for its 2016 Annual
Meeting of Shareholders’, to be filed on or before April 29, 2016, and such information is incorporated herein by reference.
Item 14.
Principal Accountant Fees and Services
The information required by this Item will be contained in the Company’s definitive proxy statement for its 2016 Annual
Meeting of Shareholders’, to be filed on or before April 29, 2016, and such information is incorporated herein by reference.

72
Part IV
Item 15.
Exhibits and Financial Statement Schedules
(a) 1. Financial Statements
The following Consolidated Financial Statements, as well as the Reports of Independent Registered Public Accounting Firm, are
included in Part II, Item 8 of this report:
PAGE
Reports of Independent Registered Public Accounting Firm ............................................................................................ 31-32
Management’s Report on Internal Control over Financial Reporting ............................................................................... 33
Consolidated Statements of Earnings ................................................................................................................................ 34
Consolidated Statements of Comprehensive Income ........................................................................................................ 35
Consolidated Balance Sheets ............................................................................................................................................ 36
Consolidated Statements of Cash Flows ........................................................................................................................... 37
Consolidated Statements of Changes in Shareholders’ Equity .......................................................................................... 38
Notes to Consolidated Financial Statements ..................................................................................................................... 39
2. Financial Statement Schedule
Schedule I—Parent Company
Condensed Balance Sheets ................................................................................................................................................. 74
Condensed Statements of Earnings ................................................................................................................................... 75
Condensed Statements of Comprehensive Income ........................................................................................................... 75
Condensed Statements of Cash Flows ............................................................................................................................... 76
Notes to Condensed Parent Company Financial Statements ............................................................................................. 77
Other schedules have been omitted for the reason that they are not required, are not applicable, or the required
information is set forth in the financial statements or notes thereto.
(b) Exhibits
See the “Exhibit Index” at page 80.
73
SIGNATURES
Pursuant to the requirements of Section 13 or 15(d) of the Securities Exchange Act of 1934, the registrant has duly caused this
report to be signed on its behalf by the undersigned, thereunto duly authorized, on February 20, 2016.
BIGLARI HOLDINGS INC.
By:
/s/ BRUCE LEWIS
Bruce Lewis
Controller
Pursuant to the requirements of the Securities Exchange Act of 1934, this report has been signed below by the following persons
on behalf of the registrant and in the capacities indicated, on February 20, 2016.
Signature Title
/s/ SARDAR BIGLARI Chief Executive Officer and Chairman of the Board (Principal Executive Officer)
Sardar Biglari
/s/ BRUCE LEWIS Controller (Principal Financial and Accounting Officer)
Bruce Lewis
/s/ PHILIP COOLEY Director
Philip Cooley
/s/ DR. RUTH J. PERSON Director
Dr. Ruth J. Person
/s/ KENNETH R. COOPER Director
Kenneth R. Cooper
/s/ WILLIAM L. JOHNSON Director
William L. Johnson
/s/ JAMES P. MASTRIAN Director
James P. Mastrian
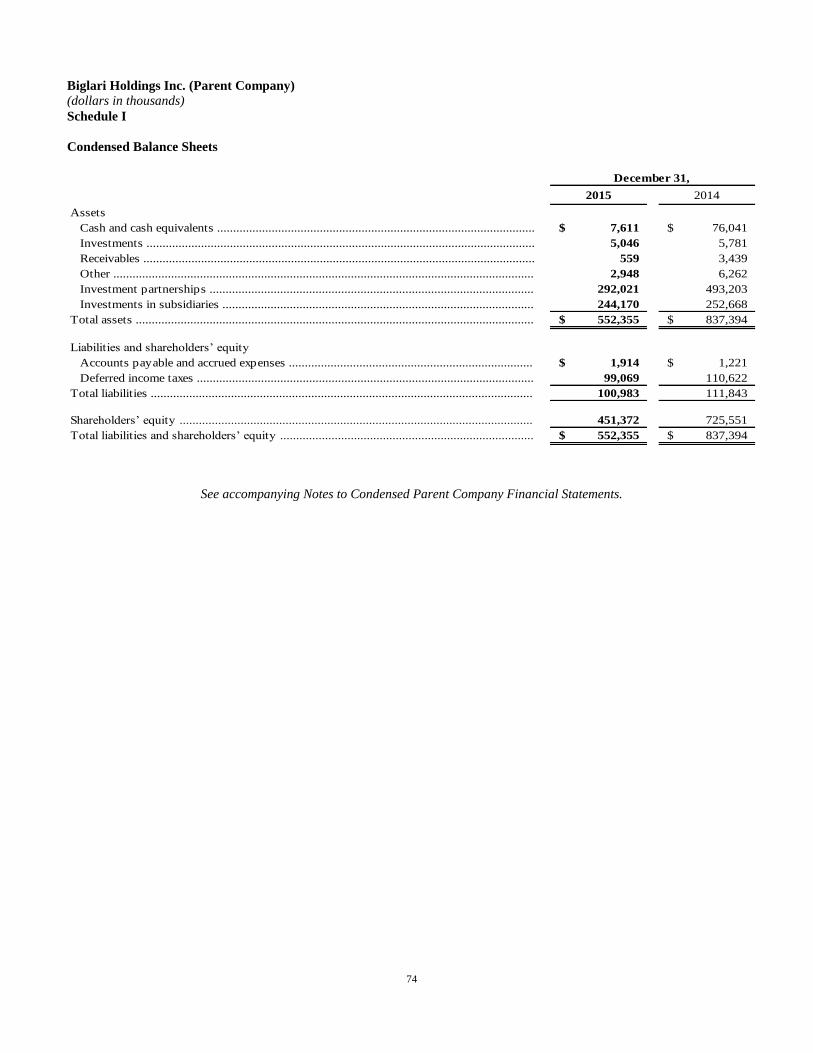
74
Biglari Holdings Inc. (Parent Company)
(dollars in thousands)
Schedule I
Condensed Balance Sheets
2015 2014
Assets
Cash and cash equivalents ................................................................................................... 7,611$ 76,041$
Investments ......................................................................................................................... 5,046 5,781
Receivables .......................................................................................................................... 559 3,439
Other ................................................................................................................................... 2,948 6,262
Investment partnerships ..................................................................................................... 292,021 493,203
Investments in subsidiaries ................................................................................................. 244,170 252,668
Total assets ............................................................................................................................ 552,355$ 837,394$
Liabilities and shareholders’ equity
Accounts payable and accrued expenses ............................................................................ 1,914$ 1,221$
Deferred income taxes ......................................................................................................... 99,069 110,622
Total liabilities ....................................................................................................................... 100,983 111,843
Shareholders’ equity .............................................................................................................. 451,372 725,551
Total liabilities and shareholders’ equity ............................................................................... 552,355$ 837,394$
December 31,
See accompanying Notes to Condensed Parent Company Financial Statements.
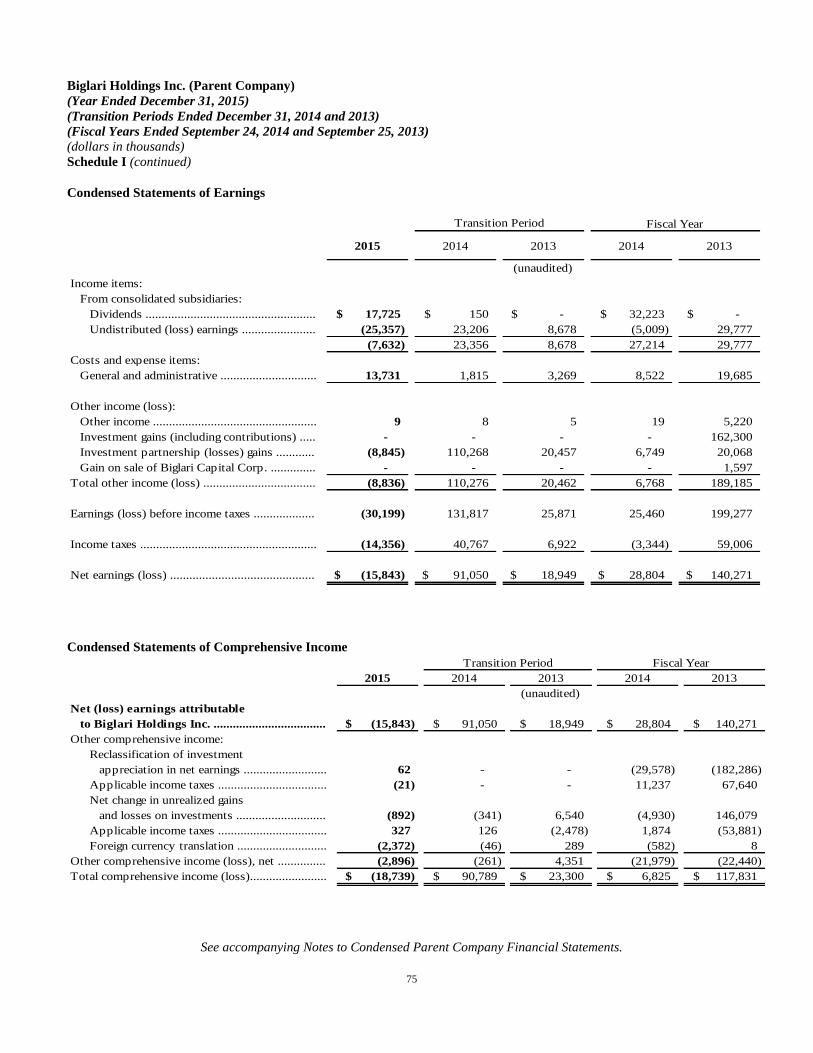
75
Biglari Holdings Inc. (Parent Company)
(Year Ended December 31, 2015)
(Transition Periods Ended December 31, 2014 and 2013)
(Fiscal Years Ended September 24, 2014 and September 25, 2013)
(dollars in thousands)
Schedule I (continued)
Condensed Statements of Earnings
2015 2014 2013 2014 2013
(unaudited)
Income items:
From consolidated subsidiaries:
Dividends ..................................................... 17,725$ 150$ -$ 32,223$ -$
Undistributed (loss) earnings ....................... (25,357) 23,206 8,678 (5,009) 29,777
(7,632) 23,356 8,678 27,214 29,777
Costs and expense items:
General and administrative .............................. 13,731 1,815 3,269 8,522 19,685
Other income (loss):
Other income ................................................... 9 8 5 19 5,220
Investment gains (including contributions) ..... - - - - 162,300
Investment partnership (losses) gains ............ (8,845) 110,268 20,457 6,749 20,068
Gain on sale of Biglari Capital Corp. .............. - - - - 1,597
Total other income (loss) ................................... (8,836) 110,276 20,462 6,768 189,185
Earnings (loss) before income taxes ................... (30,199) 131,817 25,871 25,460 199,277
Income taxes ....................................................... (14,356) 40,767 6,922 (3,344) 59,006
Net earnings (loss) ............................................. (15,843)$ 91,050$ 18,949$ 28,804$ 140,271$
Transition Period Fiscal Year
Condensed Statements of Comprehensive Income
2015 2014 2013 2014 2013
(unaudited)
Net (loss) earnings attributable
to Biglari Holdings Inc. ................................... (15,843)$ 91,050$ 18,949$ 28,804$ 140,271$
Other comprehensive income:
Reclassification of investment
appreciation in net earnings .......................... 62 - - (29,578) (182,286)
Applicable income taxes .................................. (21) - - 11,237 67,640
Net change in unrealized gains
and losses on investments ............................ (892) (341) 6,540 (4,930) 146,079
Applicable income taxes .................................. 327 126 (2,478) 1,874 (53,881)
Foreign currency translation ............................ (2,372) (46) 289 (582) 8
Other comprehensive income (loss), net ............... (2,896) (261) 4,351 (21,979) (22,440)
Total comprehensive income (loss)........................ (18,739)$ 90,789$ 23,300$ 6,825$ 117,831$
Transition Period Fiscal Year
See accompanying Notes to Condensed Parent Company Financial Statements.

76
Biglari Holdings Inc. (Parent Company)
(Year Ended December 31, 2015)
(Transition Periods Ended December 31, 2014 and 2013)
(Fiscal Years Ended September 24, 2014 and September 25, 2013)
(dollars in thousands)
Schedule I (continued)
Condensed Statements of Cash Flows
2015 2014 2013 2014 2013
(unaudited)
Operating activities
Net earnings (loss) .......................................................................... (15,843)$ 91,050$ 18,949$ 28,804$ 140,271$
Adjustments to reconcile net earnings to net cash:
Excess distributed earnings of subsidiaries ............................... - - - 20,341 -
Undistributed (earnings) loss of subsidiaries ............................ 25,357 (23,206) (8,678) 5,009 (29,777)
Provision for deferred income taxes .......................................... (9,861) 40,523 8,142 (1,886) 56,396
Gain on sale of Biglari Capital Corp. ........................................ - - - - (1,597)
Investment gains (including contributions) ............................... - - - - (162,300)
Investment partnership (gains) losses ......................................
8,845 (110,268) (20,457) (6,749) (20,068)
Distributions from investment partnerships ............................ 15,175 - - 7,776 -
Changes in accounts payable and accrued expenses ................. 693 (185) 689 (10,554) 785
Changes in receivables and other .............................................. 4,774 952 (723) (4,016) 3,410
Net cash provided by (used in) operating activities .................. 29,140 (1,134) (2,078) 38,725 (12,880)
Investing activities
Investments in and advances to/from subsidiaries, net ................... (19,290) (5,172) (2,348) (13,318) 30,000
Additions of property and equipment ........................................... (2) - - (1,096) (1,106)
Acquisitions of businesses, net of cash acquired ............................ - - - (40,143) -
Proceeds from sale of Biglari Capital Corp, net of cash on hand ... - - - - 1,699
Purchases of investments ............................................................... (78,500) - - (60,000) (46,977)
Sales of investments ....................................................................... - - - - 1
Net cash used in investing activities .......................................... (97,792) (5,172) (2,348) (114,557) (16,383)
Financing activities
Proceeds from stock rights offering ................................................ - - - 85,873 75,595
Proceeds from exercise of stock options ........................................ 222 3 - 24 16
Net cash provided by financing activities .................................. 222 3 - 85,897 75,611
Increase (decrease) in cash and cash equivalents ............................ (68,430) (6,303) (4,426) 10,065 46,348
Cash and cash equivalents at beginning of period ........................... 76,041 82,344 72,279 72,279 25,931
Cash and cash equivalents at end of period .............................. 7,611$ 76,041$ 67,853$ 82,344$ 72,279$
Transition Period Fiscal Year
See accompanying Notes to Condensed Parent Company Financial Statements.

77
Notes to Condensed Parent Company Financial Statements
Biglari Holdings Inc. (Parent Company)
(Year Ended December 31, 2015)
(Transition Periods Ended December 31, 2014 and 2013)
(Fiscal Years Ended September 24, 2014 and September 25, 2013)
(dollars in thousands)
Note 1. Basis of Presentation
Biglari Holdings Inc.’s (the “Company”) condensed financial information has been derived from the consolidated financial
statements and should be read in conjunction with the consolidated financial statements included in this report on form 10-K.
Prior to July 2013, the consolidated financial statements included the accounts of the Company, its wholly-owned subsidiaries
(including Biglari Capital Corp. (“Biglari Capital”)), and investment related limited partnerships The Lion Fund, L.P. and
Western Acquisitions, L.P. (collectively the “consolidated affiliated partnerships”), in which we had a controlling interest.
In July 2013 the Company liquidated the partners’ interest in Western Acquisitions, L.P. by distributing assets of the partnership
to the partners and Biglari Holdings sold all of the outstanding shares of Biglari Capital to Mr. Biglari. Biglari Capital is the
general partner of The Lion Fund, L.P. and The Lion Fund II, L.P. (collectively the “investment partnerships"), which are limited
partnerships that operate as private investment funds.
As a result of the sale of Biglari Capital and the related liquidation of Western Acquisitions, L.P. the Company ceased to have a
controlling interest in Biglari Capital and the consolidated affiliated partnerships. Accordingly, Biglari Capital and the
consolidated affiliated partnerships are no longer consolidated in the Company’s financial statements.
During 2015, the Company contributed cash in exchange for limited partner interests in the investment partnerships. During
fiscal years 2014 and 2013, the Company contributed cash and securities in exchange for limited partner interests in the
investment partnerships. Prior to the contributions of securities to the investment partnerships the Company accounted for the
securities as available-for-sale securities with unrealized gains and losses recorded as a component of shareholders’ equity in the
condensed balance sheet. Our interests in the investment partnerships are accounted for as equity method investments due to our
retained limited partner interest. The Company records earnings from investment partnerships in the condensed statement of
earnings based on our proportional ownership interest in the investment partnerships’ total earnings.
Our investments consist of available-for-sale securities and are carried at fair value with net unrealized gains or losses reported
as a component of accumulated other comprehensive income in shareholders’ equity. Realized gains and losses on disposals of
investments are determined by specific identification of cost of investments sold and are included in realized investment
gains/losses, a component of investment gains.
In each of fiscal years 2014 and 2013, Biglari Holdings completed an offering of transferable subscription rights. The offerings
were oversubscribed and 344,261 and 286,767, respectively, new shares of common stock were issued. The Company received
net proceeds of $85,873 and $75,595 from the offerings, respectively.

78
Notes to Condensed Parent Company Financial Statements
Biglari Holdings Inc. (Parent Company)
(Year ended December 31, 2015)
(Transition Periods ended December 31, 2014 and 2013)
(Fiscal Years ended September 24, 2014 and September 25, 2013)
(dollars in thousands)
Note 2. Subsidiary Transactions
Dividends
During 2015, the Company received cash dividends from subsidiaries of $17,725. The Company received $150 cash dividends
from subsidiaries during the 2014 transition period. During fiscal year 2014, the Company received cash dividends from
subsidiaries of $52,564. No cash dividends were received during fiscal year 2013.
One of our wholly-owned subsidiaries has a credit facility that imposes restrictions on its ability to transfer funds to the
Company through intercompany loans, distributions, or dividends.
Investment in Subsidiaries
The Company’s investment in subsidiaries is stated at cost plus equity in undistributed earnings of subsidiaries.
Note 3. Investments
Investments consisted of the following.
2015 2014
Cost .......................................................................................................................................... 5,988$ 5,989$
Gross unrealized gains .............................................................................................................. - -
Gross unrealized losses ............................................................................................................ (942) (208)
Fair value .................................................................................................................................. 5,046$ 5,781$
December 31,
The investments are deemed as available-for-sale securities.
Investment gains/losses are recognized when investments are sold (as determined on a specific identification basis) or as
otherwise required by GAAP. The timing of realized gains and losses from sales can have a material effect on periodic earnings.
However, such realized gains or losses usually have little, if any, impact on total shareholders’ equity because the investments
are carried at fair value with any unrealized gains/losses included as a component of accumulated other comprehensive income in
shareholders’ equity. We believe that realized investment gains/losses are often meaningless in terms of understanding reported
results. Short-term investment gains/losses have caused and may continue to cause significant volatility in our results.
Investment gains were as follows.
2013
Gain on contributions to investment partnerships .............................................................................................. $ 162,869
Gross realized gains on sales ................................................................................................................................ 1
Gross realized losses on sales .............................................................................................................................. -
Other than temporary impairment ....................................................................................................................... (570)
Gains on contributions and sales of investments ................................................................................................. $ 162,300
The Company did not recognize a gain during 2015, the 2014 or 2013 transition periods, or during fiscal 2014.
The Company recognized a pre-tax gain of $162,869 ($102,607 net of tax) on contributions of $324,751 in securities to
investment partnerships for fiscal year 2013. The gain had a material effect on the Company’s fiscal 2013 earnings. However ,
this gain had no impact on total shareholders’ equity because the investments were carried at fair value prior to the contribution,
with the unrealized gains included as a component of accumulated other comprehensive income.
During fiscal year 2013, the Company had unrealized losses on available-for-sale securities in a continuous unrealized loss
position for more than twelve consecutive months. Therefore, we recorded an impairment of $570 in fiscal year 2013.
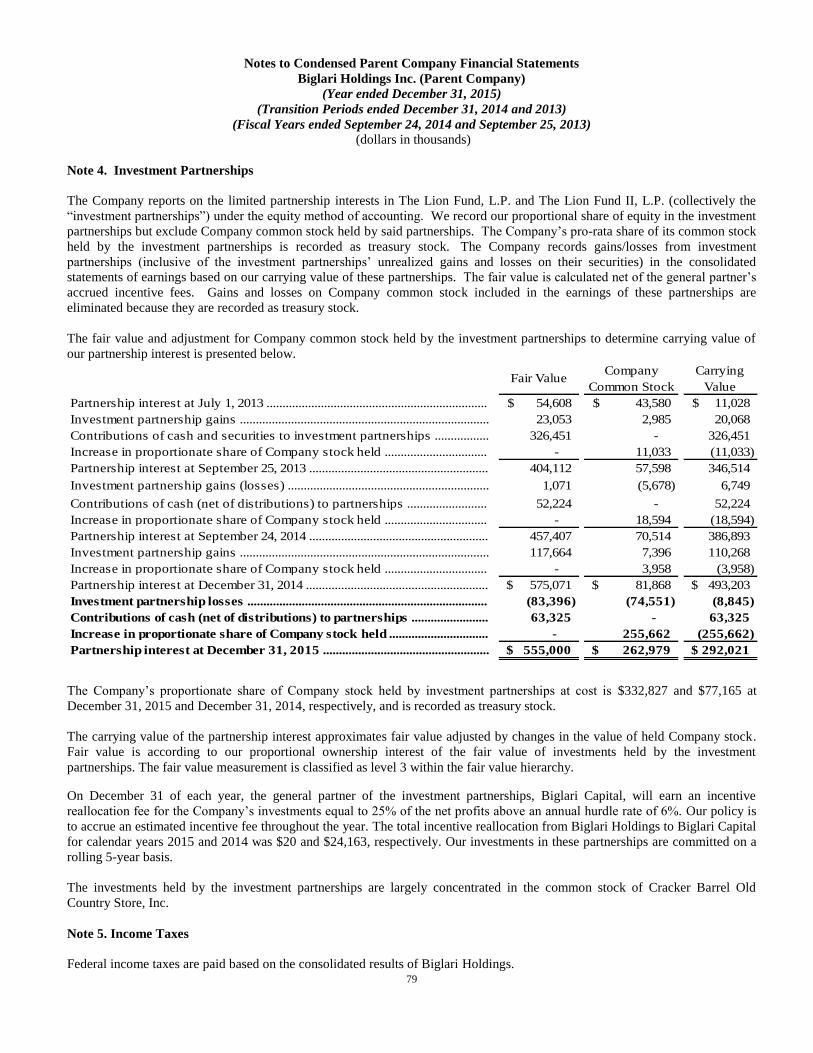
79
Notes to Condensed Parent Company Financial Statements
Biglari Holdings Inc. (Parent Company)
(Year ended December 31, 2015)
(Transition Periods ended December 31, 2014 and 2013)
(Fiscal Years ended September 24, 2014 and September 25, 2013)
(dollars in thousands)
Note 4. Investment Partnerships
The Company reports on the limited partnership interests in The Lion Fund, L.P. and The Lion Fund II, L.P. (collectively the
“investment partnerships”) under the equity method of accounting. We record our proportional share of equity in the investment
partnerships but exclude Company common stock held by said partnerships. The Company’s pro-rata share of its common stock
held by the investment partnerships is recorded as treasury stock. The Company records gains/losses from investment
partnerships (inclusive of the investment partnerships’ unrealized gains and losses on their securities) in the consolidated
statements of earnings based on our carrying value of these partnerships. The fair value is calculated net of the general partner’s
accrued incentive fees. Gains and losses on Company common stock included in the earnings of these partnerships are
eliminated because they are recorded as treasury stock.
The fair value and adjustment for Company common stock held by the investment partnerships to determine carrying value of
our partnership interest is presented below.
Fair ValueCompany
Common Stock
Carrying
Value
Partnership interest at July 1, 2013 ..................................................................... 54,608$ 43,580$ 11,028$
Investment partnership gains .............................................................................. 23,053 2,985 20,068
Contributions of cash and securities to investment partnerships ................. 326,451 - 326,451
Increase in proportionate share of Company stock held ................................ - 11,033 (11,033)
Partnership interest at September 25, 2013 ........................................................ 404,112 57,598 346,514
Investment partnership gains (losses) ............................................................... 1,071 (5,678) 6,749
Contributions of cash (net of distributions) to partnerships ......................... 52,224 - 52,224
Increase in proportionate share of Company stock held ................................ - 18,594 (18,594)
Partnership interest at September 24, 2014 ........................................................ 457,407 70,514 386,893
Investment partnership gains .............................................................................. 117,664 7,396 110,268
Increase in proportionate share of Company stock held ................................ - 3,958 (3,958)
Partnership interest at December 31, 2014 ......................................................... 575,071$ 81,868$ 493,203$
Investment partnership losses ........................................................................... (83,396) (74,551) (8,845)
Contributions of cash (net of distributions) to partnerships ........................ 63,325 - 63,325
Increase in proportionate share of Company stock held ............................... - 255,662 (255,662)
Partnership interest at December 31, 2015 .................................................... 555,000$ 262,979$ 292,021$
The Company’s proportionate share of Company stock held by investment partnerships at cost is $332,827 and $77,165 at
December 31, 2015 and December 31, 2014, respectively, and is recorded as treasury stock.
The carrying value of the partnership interest approximates fair value adjusted by changes in the value of held Company stock.
Fair value is according to our proportional ownership interest of the fair value of investments held by the investment
partnerships. The fair value measurement is classified as level 3 within the fair value hierarchy.
On December 31 of each year, the general partner of the investment partnerships, Biglari Capital, will earn an incentive
reallocation fee for the Company’s investments equal to 25% of the net profits above an annual hurdle rate of 6%. Our policy is
to accrue an estimated incentive fee throughout the year. The total incentive reallocation from Biglari Holdings to Biglari Capital
for calendar years 2015 and 2014 was $20 and $24,163, respectively. Our investments in these partnerships are committed on a
rolling 5-year basis.
The investments held by the investment partnerships are largely concentrated in the common stock of Cracker Barrel Old
Country Store, Inc.
Note 5. Income Taxes
Federal income taxes are paid based on the consolidated results of Biglari Holdings.

80
INDEX TO EXHIBITS Exhibit
Number
Description
All documents referenced below were filed pursuant to the Securities Exchange Act of 1934 by the Company, file number
0-8445, unless otherwise indicated.
2.01 Agreement and Plan of Merger, dated as of October 22, 2009, by and among the Company, Grill Acquisition
Corporation and Western. (Incorporated by reference to Exhibit 2.1 to the Company’s Current Report on Form 8-K
dated October 23, 2009).
3.01 Amended and Restated Articles of Incorporation of the Company, filed March 27, 2002, as amended by Articles of
Amendment dated December 17, 2009, January 27, 2010 and April 8, 2010. (Incorporated by reference to Exhibit 4.1
to the Company’s Registration Statement on Form S-8 dated April 15, 2010).
3.02 Amended and Restated By-Laws of the Company, as amended through June 3, 2015. (Incorporated by reference to
Exhibit 3.1 to the Company’s Current Report on Form 8-K dated June 4, 2015).
4.01 Specimen certificate representing Common Stock of the Company. (Incorporated by reference to Exhibit 4.01 to the
Company’s Quarterly Report on Form 10-Q for the fiscal quarter ended April 11, 2001).
10.01* 1997 Employee Stock Option Plan. (Incorporated by reference to the Appendix to the Company’s definitive Proxy
Statement dated December 24, 1996).
10.02* Amendment No. 1 to 1997 Employee Stock Option Plan. (Incorporated by reference to the Appendix to the
Company’s definitive Proxy Statement dated December 19, 2001).
10.03* Form of Stock Option Agreement under the Company’s 1997 Employee Stock Option Plan. (Incorporated by
reference to Exhibit 10.14 to the Company’s Annual Report on Form 10-K for the year ended September 29, 2004
filed on December 16, 2004).
10.04* 2005 Director Stock Option Plan. (Incorporated by reference to Appendix B to the Company’s definitive Proxy
Statement dated December 20, 2004).
10.05* 2006 Employee Stock Option Plan. (Incorporated by reference to Exhibit 10.1 to the Company’s Current Report on
Form 8-K dated February 8, 2006).
10.06* Form of Incentive Stock Option Agreement under the 2006 Employee Stock Option Plan (Incorporated by reference
to Exhibit 10.3 to the Company’s Current Report on Form 8-K dated February 8, 2006).
10.07* 2007 Non-Employee Director Restricted Stock Plan. (Incorporated by reference to Exhibit 10.1 to the Company’s
Current Report on Form 8-K filed February 9, 2007).
10.08* 2008 Equity Incentive Plan. (Incorporated by reference to Appendix A to the Company’s definitive Proxy Statement
dated February 8, 2008).
10.09* Form of Employee Stock Option Agreement under the Company’s 2008 Equity Incentive Plan. (Incorporated by
reference to Exhibit 10.01 to the Company’s Quarterly Report on Form 10-Q for the quarterly period ended April 9,
2008).
10.10* Form of 2008 Equity Incentive Plan Restricted Stock Agreement under the Company’s 2008 Equity Incentive Plan.
(Incorporated by reference to Exhibit 10.02 to the Company’s Quarterly Report on Form 10-Q for the quarterly
period ended April 9, 2008).
10.11* The Steak n Shake Non-Qualified Savings Plan, amended and restated as of March 15, 2010. (Incorporated by
reference to Exhibit 4.3 to the Company’s Registration Statement on Form S-8 dated April 22, 2010).
10.12 Multiple Unit Franchise Agreement, dated as of September 21, 2005, by and among the Company, Reinwald
Enterprises Emory, LLC and Reinwald Enterprises Wild Geese, LLC. (Incorporated by reference to Exhibit 10.1 to
the Company’s Current Report on Form 8-K filed September 27, 2005).
10.13*
Form of Indemnity Agreement entered into on October 9, 2007 with the following Officers and Directors of the
Company: Jeffrey A. Blade, Duane E. Geiger, Alan B. Gilman, Omar Janjua, David C. Milne, Thomas Murrill, Gary
T. Reinwald, Steven M. Schiller, J. Michael Vance, Geoff Ballotti, Wayne Kelley, Charles Lanham, Ruth Person,
John W. Ryan, J. Fred Risk, Steven M. Schmidt, Edward Wilhelm, and James Williamson, Jr. (Incorporated by
reference to Exhibit 10.35 to the Company’s Annual Report on Form 10-K for the fiscal year ended September 26,
2007).

81
Exhibit
Number
Description
10.14*
Severance Agreement, dated as of January 26, 2010, by and between the Company and Duane Geiger. (Incorporated
by reference to Exhibit 10.01 to the Company’s Quarterly Report on Form 10-Q for the quarterly period ended
December 23, 2009).
10.15* Amended and Restated Incentive Bonus Agreement, dated September 28, 2010, by and between the Company and
Sardar Biglari. (Incorporated by reference to Annex A to the Company’s definitive Proxy Statement dated September
28, 2011).
10.16 Trademark License Agreement, dated as of January 11, 2013, by and between Biglari Holdings Inc. and Sardar
Biglari. (Incorporated by reference to Exhibit 10.1 to the Company’s Current Report on Form 8-K dated January 11,
2013).
10.17 Trademark Sublicense Agreement, entered as of May 14, 2013, by and among the Company, Steak n Shake, LLC
and Steak n Shake Enterprises, Inc. (Incorporated by reference to Exhibit 10.01 to the Company’s Quarterly Report
on Form 10-Q for the quarterly period ended April 10, 2013).
10.18 Stock Purchase Agreement, dated July 1, 2013, by and between Biglari Holdings Inc. and Sardar Biglari.
(Incorporated by reference to Exhibit 10.1 to the Company’s Current Report on Form 8-K dated July 2, 2013).
10.29 Shared Services Agreement, dated July 1, 2013, by and between Biglari Holdings Inc. and Biglari Capital Corp.
(Incorporated by reference to Exhibit 10.2 to the Company’s Current Report on Form 8-K dated July 2, 2013).
10.20* First Amendment, dated as of July 1, 2013, to the Amended and Restated Incentive Bonus Agreement, dated as of
September 28, 2010, by and between Biglari Holdings Inc. and Sardar Biglari. (Incorporated by reference to Exhibit
10.3 to the Company’s Current Report on Form 8-K dated July 2, 2013).
10.21 Credit Agreement, dated as of March 19, 2014, among Steak n Shake Operations, Inc., as borrower, Steak n Shake
Enterprises, Inc. and Steak n Shake, LLC, as subsidiary guarantors, the lenders party thereto, Jefferies Finance LLC,
as joint lead arranger, syndication agent, documentation agent, book manager, administrative agent and collateral
agent, and Fifth Third Bank, as joint lead arranger, swingline lender and issuing bank. (Incorporated by reference to
Exhibit 10.1 to the Company’s Current Report on Form 8-K dated March 21, 2014).
10.22 Security Agreement, dated as of March 19, 2014, by Steak n Shake Operations, Inc., Steak n Shake Enterprises, Inc.
and Steak n Shake, LLC, as pledgors, assignors and debtors, in favor of Jefferies Finance LLC, in its capacity as
collateral agent, pledgee, assignee and secured party. (Incorporated by reference to Exhibit 10.2 to the Company’s
Current Report on Form 8-K dated March 21, 2014).
10.23 Form of Indemnity Agreement for Directors of the Company, as adopted on June 3, 2015. (Incorporated by reference
to Exhibit 10.1 to the Company’s Current Report on Form 8-K dated June 4, 2015).
10.24 Amended and Restated Partnership Agreement of The Lion Fund II, L.P. as amended on June 3, 2015. (Incorporated
by reference to Exhibit 10.1 to the Company’s Current Report on Form 8-K dated June 4, 2015).
14.01 Code of Conduct, dated December 30, 2015.
21.01 Subsidiaries of the Company.
23.01 Consent of Independent Registered Public Accounting Firm.
31.01 Rule 13(a)-14(a)/15d-14(a) Certification of Chief Executive Officer.
31.02 Rule 13(a)-14(a)/15d-14(a) Certification of Chief Financial Officer.
32.01 Section 1350 Certifications.
101**
*
**
Interactive Data Files.
Indicates management contract or compensatory plans or arrangements required to be filed as an exhibit to the
Annual Report on Form 10-K.
In accordance with Rule 406T of Regulation S-T, these interactive data files are deemed not filed or part of a
registration statement or prospectus for purposes of Sections 11 or 12 of the Securities Act of 1933, as amended, are
deemed not filed for purposes of Section 19 of the Securities Exchange Act of 1934, as amended, and otherwise are
not subject to liability under those sections.