forums.juniper.netforums.juniper.net/.../1/junos-security-monitoring-troubleshooting.pdf ·...
TRANSCRIPT

Junos®OS
Monitoring and Troubleshooting Guidefor Security Devices
Release
11.4
Published: 2011-10-31
Copyright © 2011, Juniper Networks, Inc.

Juniper Networks, Inc.1194 North Mathilda AvenueSunnyvale, California 94089USA408-745-2000www.juniper.net
This product includes the Envoy SNMP Engine, developed by Epilogue Technology, an Integrated Systems Company. Copyright © 1986-1997,Epilogue Technology Corporation. All rights reserved. This program and its documentation were developed at private expense, and no partof them is in the public domain.
This product includes memory allocation software developed by Mark Moraes, copyright © 1988, 1989, 1993, University of Toronto.
This product includes FreeBSD software developed by the University of California, Berkeley, and its contributors. All of the documentationand software included in the 4.4BSD and 4.4BSD-Lite Releases is copyrighted by the Regents of the University of California. Copyright ©1979, 1980, 1983, 1986, 1988, 1989, 1991, 1992, 1993, 1994. The Regents of the University of California. All rights reserved.
GateD software copyright © 1995, the Regents of the University. All rights reserved. Gate Daemon was originated and developed throughrelease 3.0 by Cornell University and its collaborators. Gated is based on Kirton’s EGP, UC Berkeley’s routing daemon (routed), and DCN’sHELLO routing protocol. Development of Gated has been supported in part by the National Science Foundation. Portions of the GateDsoftware copyright © 1988, Regents of the University of California. All rights reserved. Portions of the GateD software copyright © 1991, D.L. S. Associates.
This product includes software developed by Maker Communications, Inc., copyright © 1996, 1997, Maker Communications, Inc.
Juniper Networks, Junos, Steel-Belted Radius, NetScreen, and ScreenOS are registered trademarks of Juniper Networks, Inc. in the UnitedStates and other countries. The Juniper Networks Logo, the Junos logo, and JunosE are trademarks of Juniper Networks, Inc. All othertrademarks, service marks, registered trademarks, or registered service marks are the property of their respective owners.
Juniper Networks assumes no responsibility for any inaccuracies in this document. Juniper Networks reserves the right to change, modify,transfer, or otherwise revise this publication without notice.
Products made or sold by Juniper Networks or components thereof might be covered by one or more of the following patents that areowned by or licensed to Juniper Networks: U.S. Patent Nos. 5,473,599, 5,905,725, 5,909,440, 6,192,051, 6,333,650, 6,359,479, 6,406,312,6,429,706, 6,459,579, 6,493,347, 6,538,518, 6,538,899, 6,552,918, 6,567,902, 6,578,186, and 6,590,785.
Junos OSMonitoring and Troubleshooting Guide for Security DevicesRelease 11.4Copyright © 2011, Juniper Networks, Inc.All rights reserved.
Revision HistoryNovember 2011—R1 Junos OS 11.4
The information in this document is current as of the date listed in the revision history.
YEAR 2000 NOTICE
Juniper Networks hardware and software products are Year 2000 compliant. Junos OS has no known time-related limitations through theyear 2038. However, the NTP application is known to have some difficulty in the year 2036.
SOFTWARE LICENSE
The terms and conditions for using this software are described in the software license contained in the acknowledgment to your purchaseorder or, to the extent applicable, to any reseller agreement or end-user purchase agreement executed between you and Juniper Networks.By using this software, you indicate that you understand and agree to be bound by those terms and conditions. Generally speaking, thesoftware license restricts the manner in which you are permitted to use the software and may contain prohibitions against certain uses.The software license may state conditions under which the license is automatically terminated. You should consult the license for furtherdetails. For complete product documentation, please see the Juniper Networks website at www.juniper.net/techpubs.
Copyright © 2011, Juniper Networks, Inc.ii

ENDUSER LICENSE AGREEMENT
The Juniper Networks product that is the subject of this technical documentation consists of (or is intended for use with) Juniper Networkssoftware. Use of such software is subject to the terms and conditions of the End User License Agreement (“EULA”) posted at
http://www.juniper.net/support/eula.html. By downloading, installing or using such software, you agree to the terms and conditionsof that EULA.
iiiCopyright © 2011, Juniper Networks, Inc.

Copyright © 2011, Juniper Networks, Inc.iv

Abbreviated Table of Contents
About This Guide . . . . . . . . . . . . . . . . . . . . . . . . . . . . . . . . . . . . . . . . . . . . . . . . . xiii
Part 1 Monitoring the Device
Chapter 1 Device and Routing Operations Monitoring . . . . . . . . . . . . . . . . . . . . . . . . . . . . 3
Chapter 2 Security Logs . . . . . . . . . . . . . . . . . . . . . . . . . . . . . . . . . . . . . . . . . . . . . . . . . . . . . 113
Part 2 Troubleshooting the Device
Chapter 3 Root Password Recovery . . . . . . . . . . . . . . . . . . . . . . . . . . . . . . . . . . . . . . . . . . 119
Chapter 4 Diagnostic Tools . . . . . . . . . . . . . . . . . . . . . . . . . . . . . . . . . . . . . . . . . . . . . . . . . . 123
Chapter 5 Packet Capture for Network Traffic Analysis . . . . . . . . . . . . . . . . . . . . . . . . . 163
Chapter 6 Debugging For SRX Series Services Gateways . . . . . . . . . . . . . . . . . . . . . . . . 177
Chapter 7 RPM Probes for Performance Measurement . . . . . . . . . . . . . . . . . . . . . . . . . 183
Chapter 8 Alarms . . . . . . . . . . . . . . . . . . . . . . . . . . . . . . . . . . . . . . . . . . . . . . . . . . . . . . . . . . 207
Chapter 9 Systems Files Management . . . . . . . . . . . . . . . . . . . . . . . . . . . . . . . . . . . . . . . . 217
Part 3 Index
Index . . . . . . . . . . . . . . . . . . . . . . . . . . . . . . . . . . . . . . . . . . . . . . . . . . . . . . . . . . . 229
vCopyright © 2011, Juniper Networks, Inc.

Copyright © 2011, Juniper Networks, Inc.vi
Junos OS Monitoring and Troubleshooting Guide for Security Devices

Table of Contents
About This Guide . . . . . . . . . . . . . . . . . . . . . . . . . . . . . . . . . . . . . . . . . . . . . . . . . xiii
J Series and SRX Series Documentation and Release Notes . . . . . . . . . . . . . . . . . xiii
Objectives . . . . . . . . . . . . . . . . . . . . . . . . . . . . . . . . . . . . . . . . . . . . . . . . . . . . . . . . . xiv
Audience . . . . . . . . . . . . . . . . . . . . . . . . . . . . . . . . . . . . . . . . . . . . . . . . . . . . . . . . . xiv
Supported Routing Platforms . . . . . . . . . . . . . . . . . . . . . . . . . . . . . . . . . . . . . . . . . xiv
Document Conventions . . . . . . . . . . . . . . . . . . . . . . . . . . . . . . . . . . . . . . . . . . . . . . xiv
Documentation Feedback . . . . . . . . . . . . . . . . . . . . . . . . . . . . . . . . . . . . . . . . . . . . xvi
Requesting Technical Support . . . . . . . . . . . . . . . . . . . . . . . . . . . . . . . . . . . . . . . . xvi
Self-Help Online Tools and Resources . . . . . . . . . . . . . . . . . . . . . . . . . . . . . . xvi
Opening a Case with JTAC . . . . . . . . . . . . . . . . . . . . . . . . . . . . . . . . . . . . . . . . xvii
Part 1 Monitoring the Device
Chapter 1 Device and Routing Operations Monitoring . . . . . . . . . . . . . . . . . . . . . . . . . . . . 3
Monitoring Overview . . . . . . . . . . . . . . . . . . . . . . . . . . . . . . . . . . . . . . . . . . . . . . . . . 3
Monitoring Interfaces . . . . . . . . . . . . . . . . . . . . . . . . . . . . . . . . . . . . . . . . . . . . . . . . . 5
Monitoring Address Pools . . . . . . . . . . . . . . . . . . . . . . . . . . . . . . . . . . . . . . . . . . . . . 6
Monitoring Reports . . . . . . . . . . . . . . . . . . . . . . . . . . . . . . . . . . . . . . . . . . . . . . . . . . . 7
Threats Monitoring Report . . . . . . . . . . . . . . . . . . . . . . . . . . . . . . . . . . . . . . . . . 7
Traffic Monitoring Report . . . . . . . . . . . . . . . . . . . . . . . . . . . . . . . . . . . . . . . . . . 12
Monitoring Events and Alarms . . . . . . . . . . . . . . . . . . . . . . . . . . . . . . . . . . . . . . . . . 14
Monitoring Alarms . . . . . . . . . . . . . . . . . . . . . . . . . . . . . . . . . . . . . . . . . . . . . . . 14
Monitoring Events . . . . . . . . . . . . . . . . . . . . . . . . . . . . . . . . . . . . . . . . . . . . . . . 15
Monitoring Security Events by Policy . . . . . . . . . . . . . . . . . . . . . . . . . . . . . . . . . 17
Monitoring the System . . . . . . . . . . . . . . . . . . . . . . . . . . . . . . . . . . . . . . . . . . . . . . . 19
Monitoring System Properties for SRX Series Devices . . . . . . . . . . . . . . . . . . . 19
Monitoring System Properties for J Series Devices . . . . . . . . . . . . . . . . . . . . . . 21
Monitoring Chassis Information . . . . . . . . . . . . . . . . . . . . . . . . . . . . . . . . . . . . 22
Monitoring Process Details for J Series Devices . . . . . . . . . . . . . . . . . . . . . . . . 24
Monitoring NAT . . . . . . . . . . . . . . . . . . . . . . . . . . . . . . . . . . . . . . . . . . . . . . . . . . . . . 25
Monitoring Source NAT Information . . . . . . . . . . . . . . . . . . . . . . . . . . . . . . . . . 25
Monitoring Destination NAT Information . . . . . . . . . . . . . . . . . . . . . . . . . . . . . 26
Monitoring Static NAT Information . . . . . . . . . . . . . . . . . . . . . . . . . . . . . . . . . 28
Monitoring Incoming Table Information . . . . . . . . . . . . . . . . . . . . . . . . . . . . . . 29
Monitoring Interface NAT Port Information . . . . . . . . . . . . . . . . . . . . . . . . . . . 30
Monitoring Security Features . . . . . . . . . . . . . . . . . . . . . . . . . . . . . . . . . . . . . . . . . . 31
Monitoring Policies . . . . . . . . . . . . . . . . . . . . . . . . . . . . . . . . . . . . . . . . . . . . . . . 31
Checking Policies . . . . . . . . . . . . . . . . . . . . . . . . . . . . . . . . . . . . . . . . . . . . . . . 34
Monitoring Screen Counters . . . . . . . . . . . . . . . . . . . . . . . . . . . . . . . . . . . . . . . 37
Monitoring IDP Status . . . . . . . . . . . . . . . . . . . . . . . . . . . . . . . . . . . . . . . . . . . . 39
Monitoring Flow Gate Information . . . . . . . . . . . . . . . . . . . . . . . . . . . . . . . . . . 40
viiCopyright © 2011, Juniper Networks, Inc.

Monitoring Firewall Authentication Table . . . . . . . . . . . . . . . . . . . . . . . . . . . . . 41
Monitoring Firewall Authentication History . . . . . . . . . . . . . . . . . . . . . . . . . . . 43
Monitoring 802.1x . . . . . . . . . . . . . . . . . . . . . . . . . . . . . . . . . . . . . . . . . . . . . . . 45
Monitoring Voice ALGs . . . . . . . . . . . . . . . . . . . . . . . . . . . . . . . . . . . . . . . . . . . . . . . 46
Monitoring Voice ALG Summary . . . . . . . . . . . . . . . . . . . . . . . . . . . . . . . . . . . 46
Monitoring Voice ALG H.323 . . . . . . . . . . . . . . . . . . . . . . . . . . . . . . . . . . . . . . . 47
Monitoring Voice ALG MGCP . . . . . . . . . . . . . . . . . . . . . . . . . . . . . . . . . . . . . . 49
Monitoring Voice ALG SCCP . . . . . . . . . . . . . . . . . . . . . . . . . . . . . . . . . . . . . . . 52
Monitoring Voice ALG SIP . . . . . . . . . . . . . . . . . . . . . . . . . . . . . . . . . . . . . . . . . 55
Monitoring SIP ALGs . . . . . . . . . . . . . . . . . . . . . . . . . . . . . . . . . . . . . . . . . . . . . . . . 60
Monitoring SIP ALG Calls . . . . . . . . . . . . . . . . . . . . . . . . . . . . . . . . . . . . . . . . . 60
Monitoring SIP ALG Counters . . . . . . . . . . . . . . . . . . . . . . . . . . . . . . . . . . . . . . 60
Monitoring SIP ALG Rate Information . . . . . . . . . . . . . . . . . . . . . . . . . . . . . . . 62
Monitoring SIP ALG Transactions . . . . . . . . . . . . . . . . . . . . . . . . . . . . . . . . . . . 63
Monitoring H.323 ALG Information . . . . . . . . . . . . . . . . . . . . . . . . . . . . . . . . . . . . . 64
Monitoring MGCP ALGs . . . . . . . . . . . . . . . . . . . . . . . . . . . . . . . . . . . . . . . . . . . . . . 66
Monitoring MGCP ALG Calls . . . . . . . . . . . . . . . . . . . . . . . . . . . . . . . . . . . . . . . 66
Monitoring MGCP ALG Counters . . . . . . . . . . . . . . . . . . . . . . . . . . . . . . . . . . . 66
Monitoring MGCP ALG Endpoints . . . . . . . . . . . . . . . . . . . . . . . . . . . . . . . . . . 68
Monitoring SCCP ALGs . . . . . . . . . . . . . . . . . . . . . . . . . . . . . . . . . . . . . . . . . . . . . . 69
Monitoring SCCP ALG Calls . . . . . . . . . . . . . . . . . . . . . . . . . . . . . . . . . . . . . . . 69
Monitoring SCCP ALG Counters . . . . . . . . . . . . . . . . . . . . . . . . . . . . . . . . . . . . 69
Monitoring VPNs . . . . . . . . . . . . . . . . . . . . . . . . . . . . . . . . . . . . . . . . . . . . . . . . . . . . 71
Monitoring IKE Gateway Information . . . . . . . . . . . . . . . . . . . . . . . . . . . . . . . . 71
Monitoring IPsec VPN—Phase I . . . . . . . . . . . . . . . . . . . . . . . . . . . . . . . . . . . . 75
Monitoring IPsec VPN—Phase II . . . . . . . . . . . . . . . . . . . . . . . . . . . . . . . . . . . . 76
Monitoring IPsec VPN Information . . . . . . . . . . . . . . . . . . . . . . . . . . . . . . . . . . 77
Monitoring Switching . . . . . . . . . . . . . . . . . . . . . . . . . . . . . . . . . . . . . . . . . . . . . . . . 82
Monitoring Ethernet Switching . . . . . . . . . . . . . . . . . . . . . . . . . . . . . . . . . . . . . 82
Monitoring Spanning Tree . . . . . . . . . . . . . . . . . . . . . . . . . . . . . . . . . . . . . . . . 83
Monitoring GVRP . . . . . . . . . . . . . . . . . . . . . . . . . . . . . . . . . . . . . . . . . . . . . . . 85
Monitoring Routing Information . . . . . . . . . . . . . . . . . . . . . . . . . . . . . . . . . . . . . . . 85
Monitoring Route Information . . . . . . . . . . . . . . . . . . . . . . . . . . . . . . . . . . . . . 86
Monitoring RIP Routing Information . . . . . . . . . . . . . . . . . . . . . . . . . . . . . . . . . 87
Monitoring OSPF Routing Information . . . . . . . . . . . . . . . . . . . . . . . . . . . . . . 88
Monitoring BGP Routing Information . . . . . . . . . . . . . . . . . . . . . . . . . . . . . . . . 90
Monitoring Class-of-Service Performance . . . . . . . . . . . . . . . . . . . . . . . . . . . . . . . 92
Monitoring CoS Interfaces . . . . . . . . . . . . . . . . . . . . . . . . . . . . . . . . . . . . . . . . 93
Monitoring CoS Classifiers . . . . . . . . . . . . . . . . . . . . . . . . . . . . . . . . . . . . . . . . 94
Monitoring CoS Value Aliases . . . . . . . . . . . . . . . . . . . . . . . . . . . . . . . . . . . . . 94
Monitoring CoS RED Drop Profiles . . . . . . . . . . . . . . . . . . . . . . . . . . . . . . . . . . 95
Monitoring CoS Forwarding Classes . . . . . . . . . . . . . . . . . . . . . . . . . . . . . . . . 96
Monitoring CoS Rewrite Rules . . . . . . . . . . . . . . . . . . . . . . . . . . . . . . . . . . . . . 97
Monitoring CoS Scheduler Maps . . . . . . . . . . . . . . . . . . . . . . . . . . . . . . . . . . . 98
Monitoring MPLS Traffic Engineering Information . . . . . . . . . . . . . . . . . . . . . . . . 100
Monitoring MPLS Interfaces . . . . . . . . . . . . . . . . . . . . . . . . . . . . . . . . . . . . . . 100
Monitoring MPLS LSP Information . . . . . . . . . . . . . . . . . . . . . . . . . . . . . . . . . 100
Monitoring MPLS LSP Statistics . . . . . . . . . . . . . . . . . . . . . . . . . . . . . . . . . . . 101
Monitoring RSVP Session Information . . . . . . . . . . . . . . . . . . . . . . . . . . . . . . 102
Copyright © 2011, Juniper Networks, Inc.viii
Junos OS Monitoring and Troubleshooting Guide for Security Devices

Monitoring MPLS RSVP Interfaces Information . . . . . . . . . . . . . . . . . . . . . . . 103
Monitoring PPPoE . . . . . . . . . . . . . . . . . . . . . . . . . . . . . . . . . . . . . . . . . . . . . . . . . . 105
Monitoring PPP . . . . . . . . . . . . . . . . . . . . . . . . . . . . . . . . . . . . . . . . . . . . . . . . . . . . 108
Monitoring the WAN Acceleration Interface . . . . . . . . . . . . . . . . . . . . . . . . . . . . . 108
Monitoring DHCP . . . . . . . . . . . . . . . . . . . . . . . . . . . . . . . . . . . . . . . . . . . . . . . . . . 109
Monitoring DHCP Client Bindings . . . . . . . . . . . . . . . . . . . . . . . . . . . . . . . . . . 109
Monitoring DHCP Client Bindings . . . . . . . . . . . . . . . . . . . . . . . . . . . . . . . . . . 110
Monitoring System Log Messages with the J-Web Event Viewer . . . . . . . . . . . . . 110
Chapter 2 Security Logs . . . . . . . . . . . . . . . . . . . . . . . . . . . . . . . . . . . . . . . . . . . . . . . . . . . . . 113
System Log Messages Overview . . . . . . . . . . . . . . . . . . . . . . . . . . . . . . . . . . . . . . . 113
Redundant System Log Server . . . . . . . . . . . . . . . . . . . . . . . . . . . . . . . . . . . . . 113
Control Plane and Data Plane Logs . . . . . . . . . . . . . . . . . . . . . . . . . . . . . . . . . 113
Configuring System Log Messages . . . . . . . . . . . . . . . . . . . . . . . . . . . . . . . . . . . . . 115
Setting the System to Send All Log Messages Through eventd . . . . . . . . . . . 115
Setting the System to Stream Security Logs Through Revenue Ports . . . . . . 115
Sending System Log Messages to a File . . . . . . . . . . . . . . . . . . . . . . . . . . . . . 116
Part 2 Troubleshooting the Device
Chapter 3 Root Password Recovery . . . . . . . . . . . . . . . . . . . . . . . . . . . . . . . . . . . . . . . . . . 119
Recovering the Root Password for SRX Series Devices . . . . . . . . . . . . . . . . . . . . . 119
Recovering the Root Password for J Series Devices . . . . . . . . . . . . . . . . . . . . . . . 120
Chapter 4 Diagnostic Tools . . . . . . . . . . . . . . . . . . . . . . . . . . . . . . . . . . . . . . . . . . . . . . . . . . 123
Diagnostic Tools Overview . . . . . . . . . . . . . . . . . . . . . . . . . . . . . . . . . . . . . . . . . . . 123
J-Web Diagnostic Tools . . . . . . . . . . . . . . . . . . . . . . . . . . . . . . . . . . . . . . . . . . 123
CLI Diagnostic Commands . . . . . . . . . . . . . . . . . . . . . . . . . . . . . . . . . . . . . . . 124
MPLS Connection Checking Overview . . . . . . . . . . . . . . . . . . . . . . . . . . . . . . . . . . 126
Understanding Ping MPLS . . . . . . . . . . . . . . . . . . . . . . . . . . . . . . . . . . . . . . . . . . . 128
MPLS Enabled . . . . . . . . . . . . . . . . . . . . . . . . . . . . . . . . . . . . . . . . . . . . . . . . . 128
Loopback Address . . . . . . . . . . . . . . . . . . . . . . . . . . . . . . . . . . . . . . . . . . . . . . 128
Source Address for Probes . . . . . . . . . . . . . . . . . . . . . . . . . . . . . . . . . . . . . . . 128
J-Web User Interface Diagnostic Tools . . . . . . . . . . . . . . . . . . . . . . . . . . . . . . . . . 129
Using the J-Web Ping Host Tool . . . . . . . . . . . . . . . . . . . . . . . . . . . . . . . . . . . 129
J-Web Ping Host Results and Output Summary . . . . . . . . . . . . . . . . . . . . . . 130
Using the J-Web Ping MPLS Tool . . . . . . . . . . . . . . . . . . . . . . . . . . . . . . . . . . . 131
J-Web Ping MPLS Results and Output Summary . . . . . . . . . . . . . . . . . . . . . 134
Using the J-Web Traceroute Tool . . . . . . . . . . . . . . . . . . . . . . . . . . . . . . . . . . 135
J-Web Traceroute Results and Output Summary . . . . . . . . . . . . . . . . . . . . . 136
Using the J-Web Packet Capture Tool . . . . . . . . . . . . . . . . . . . . . . . . . . . . . . . 137
J-Web Packet Capture Results and Output Summary . . . . . . . . . . . . . . . . . 140
CLI Diagnostic Commands . . . . . . . . . . . . . . . . . . . . . . . . . . . . . . . . . . . . . . . . . . . 141
Using the ping Command . . . . . . . . . . . . . . . . . . . . . . . . . . . . . . . . . . . . . . . . 141
Using the ping mpls Commands . . . . . . . . . . . . . . . . . . . . . . . . . . . . . . . . . . . 143
Pinging RSVP-Signaled LSPs and LDP-Signaled LSPs . . . . . . . . . . . . . 144
Pinging Layer 3 VPNs . . . . . . . . . . . . . . . . . . . . . . . . . . . . . . . . . . . . . . . . 144
Pinging Layer 2 VPNs . . . . . . . . . . . . . . . . . . . . . . . . . . . . . . . . . . . . . . . . 145
ixCopyright © 2011, Juniper Networks, Inc.
Table of Contents

Pinging Layer 2 Circuits . . . . . . . . . . . . . . . . . . . . . . . . . . . . . . . . . . . . . . 146
Using the traceroute Commands . . . . . . . . . . . . . . . . . . . . . . . . . . . . . . . . . . 147
Displaying a List of Devices . . . . . . . . . . . . . . . . . . . . . . . . . . . . . . . . . . . 148
Displaying Real-Time Monitoring Information . . . . . . . . . . . . . . . . . . . . 149
Using the mtrace Commands . . . . . . . . . . . . . . . . . . . . . . . . . . . . . . . . . . . . . 151
Displaying Multicast Path Information . . . . . . . . . . . . . . . . . . . . . . . . . . . 152
Displaying Multicast Trace Operations . . . . . . . . . . . . . . . . . . . . . . . . . . 154
Using the monitor Commands . . . . . . . . . . . . . . . . . . . . . . . . . . . . . . . . . . . . 155
Displaying Log and Trace Files . . . . . . . . . . . . . . . . . . . . . . . . . . . . . . . . . 155
Displaying Real-Time Interface Information . . . . . . . . . . . . . . . . . . . . . . 156
Displaying Packet Headers . . . . . . . . . . . . . . . . . . . . . . . . . . . . . . . . . . . . 157
Chapter 5 Packet Capture for Network Traffic Analysis . . . . . . . . . . . . . . . . . . . . . . . . . 163
Packet Capture Overview . . . . . . . . . . . . . . . . . . . . . . . . . . . . . . . . . . . . . . . . . . . . 163
Packet Capture on Device Interfaces . . . . . . . . . . . . . . . . . . . . . . . . . . . . . . . 164
Firewall Filters for Packet Capture . . . . . . . . . . . . . . . . . . . . . . . . . . . . . . . . . 165
Packet Capture Files . . . . . . . . . . . . . . . . . . . . . . . . . . . . . . . . . . . . . . . . . . . . 165
Analysis of Packet Capture Files . . . . . . . . . . . . . . . . . . . . . . . . . . . . . . . . . . . 165
Example: Enabling Packet Capture on a Device . . . . . . . . . . . . . . . . . . . . . . . . . . 166
Example: Configuring Packet Capture on an Interface . . . . . . . . . . . . . . . . . . . . . 169
Example: Configuring a Firewall Filter for Packet Capture . . . . . . . . . . . . . . . . . . . 171
Packet Capture Tasks . . . . . . . . . . . . . . . . . . . . . . . . . . . . . . . . . . . . . . . . . . . . . . . 173
Disabling Packet Capture . . . . . . . . . . . . . . . . . . . . . . . . . . . . . . . . . . . . . . . . 173
Deleting Packet Capture Files . . . . . . . . . . . . . . . . . . . . . . . . . . . . . . . . . . . . . 173
Changing Encapsulation on Interfaces with Packet Capture Configured . . . 174
Chapter 6 Debugging For SRX Series Services Gateways . . . . . . . . . . . . . . . . . . . . . . . . 177
Data Path Debugging for SRX Series Devices . . . . . . . . . . . . . . . . . . . . . . . . . . . . 177
Understanding Data Path Debugging for SRX Series Devices . . . . . . . . . . . . 177
Debugging the Data Path (CLI Procedure) . . . . . . . . . . . . . . . . . . . . . . . . . . . 178
Security Debugging for SRX Series Devices . . . . . . . . . . . . . . . . . . . . . . . . . . . . . . 179
Understanding Security Debugging Using Trace Options . . . . . . . . . . . . . . . 179
Setting Security Trace Options (CLI Procedure) . . . . . . . . . . . . . . . . . . . . . . . 179
Displaying Output for Security Trace Options . . . . . . . . . . . . . . . . . . . . . . . . 180
Flow Debugging for SRX Series Devices . . . . . . . . . . . . . . . . . . . . . . . . . . . . . . . . . 181
Understanding Flow Debugging Using Trace Options . . . . . . . . . . . . . . . . . . 181
Setting Flow Debugging Trace Options (CLI Procedure) . . . . . . . . . . . . . . . . 181
Chapter 7 RPM Probes for Performance Measurement . . . . . . . . . . . . . . . . . . . . . . . . . 183
RPM Overview . . . . . . . . . . . . . . . . . . . . . . . . . . . . . . . . . . . . . . . . . . . . . . . . . . . . . 183
RPM Probes . . . . . . . . . . . . . . . . . . . . . . . . . . . . . . . . . . . . . . . . . . . . . . . . . . . 183
RPM Tests . . . . . . . . . . . . . . . . . . . . . . . . . . . . . . . . . . . . . . . . . . . . . . . . . . . . 184
Probe and Test Intervals . . . . . . . . . . . . . . . . . . . . . . . . . . . . . . . . . . . . . . . . . 184
Jitter Measurement with Hardware Timestamping . . . . . . . . . . . . . . . . . . . . 184
RPM Statistics . . . . . . . . . . . . . . . . . . . . . . . . . . . . . . . . . . . . . . . . . . . . . . . . . 185
RPM Thresholds and Traps . . . . . . . . . . . . . . . . . . . . . . . . . . . . . . . . . . . . . . . 186
Copyright © 2011, Juniper Networks, Inc.x
Junos OS Monitoring and Troubleshooting Guide for Security Devices

RPM for BGP Monitoring . . . . . . . . . . . . . . . . . . . . . . . . . . . . . . . . . . . . . . . . . 186
RPM Configuration . . . . . . . . . . . . . . . . . . . . . . . . . . . . . . . . . . . . . . . . . . . . . . . . . 187
RPM Configuration Options . . . . . . . . . . . . . . . . . . . . . . . . . . . . . . . . . . . . . . . 187
Example: Configuring Basic RPM Probes . . . . . . . . . . . . . . . . . . . . . . . . . . . . 191
Example: Configuring RPM Using TCP and UDP Probes . . . . . . . . . . . . . . . . 195
Tuning RPM Probes . . . . . . . . . . . . . . . . . . . . . . . . . . . . . . . . . . . . . . . . . . . . . 197
Example: Configuring RPM Probes for BGP Monitoring . . . . . . . . . . . . . . . . . 198
Directing RPM Probes to Select BGP Devices . . . . . . . . . . . . . . . . . . . . . . . . 201
Configuring RPM Timestamping . . . . . . . . . . . . . . . . . . . . . . . . . . . . . . . . . . . 201
RPM Support for VPN Routing and Forwarding . . . . . . . . . . . . . . . . . . . . . . . . . . 202
Monitoring RPM Probes . . . . . . . . . . . . . . . . . . . . . . . . . . . . . . . . . . . . . . . . . . . . . 202
Chapter 8 Alarms . . . . . . . . . . . . . . . . . . . . . . . . . . . . . . . . . . . . . . . . . . . . . . . . . . . . . . . . . . 207
Alarm Overview . . . . . . . . . . . . . . . . . . . . . . . . . . . . . . . . . . . . . . . . . . . . . . . . . . . 207
Alarm Types . . . . . . . . . . . . . . . . . . . . . . . . . . . . . . . . . . . . . . . . . . . . . . . . . . 207
Alarm Severity . . . . . . . . . . . . . . . . . . . . . . . . . . . . . . . . . . . . . . . . . . . . . . . . 208
Alarm Conditions . . . . . . . . . . . . . . . . . . . . . . . . . . . . . . . . . . . . . . . . . . . . . . 208
Interface Alarm Conditions . . . . . . . . . . . . . . . . . . . . . . . . . . . . . . . . . . . 208
System Alarm Conditions . . . . . . . . . . . . . . . . . . . . . . . . . . . . . . . . . . . . . 211
Example: Configuring Interface Alarms . . . . . . . . . . . . . . . . . . . . . . . . . . . . . . . . . 212
Monitoring Active Alarms on a Device . . . . . . . . . . . . . . . . . . . . . . . . . . . . . . . . . . 215
Chapter 9 Systems Files Management . . . . . . . . . . . . . . . . . . . . . . . . . . . . . . . . . . . . . . . . 217
File Management Overview . . . . . . . . . . . . . . . . . . . . . . . . . . . . . . . . . . . . . . . . . . 217
Managing Files with the J-Web User Interface . . . . . . . . . . . . . . . . . . . . . . . . . . . . 217
Cleaning Up Files . . . . . . . . . . . . . . . . . . . . . . . . . . . . . . . . . . . . . . . . . . . . . . . 218
Downloading Files . . . . . . . . . . . . . . . . . . . . . . . . . . . . . . . . . . . . . . . . . . . . . . 218
Deleting Files . . . . . . . . . . . . . . . . . . . . . . . . . . . . . . . . . . . . . . . . . . . . . . . . . . 219
Deleting the Backup Software Image . . . . . . . . . . . . . . . . . . . . . . . . . . . . . . 220
Managing Files with the CLI . . . . . . . . . . . . . . . . . . . . . . . . . . . . . . . . . . . . . . . . . . 220
Cleaning Up Files with the CLI . . . . . . . . . . . . . . . . . . . . . . . . . . . . . . . . . . . . 220
Managing Accounting Files . . . . . . . . . . . . . . . . . . . . . . . . . . . . . . . . . . . . . . . 221
Encrypting and Decrypting Configuration Files . . . . . . . . . . . . . . . . . . . . . . . . . . . 222
Encrypting Configuration Files . . . . . . . . . . . . . . . . . . . . . . . . . . . . . . . . . . . . 223
Decrypting Configuration Files . . . . . . . . . . . . . . . . . . . . . . . . . . . . . . . . . . . . 224
Modifying the Encryption Key . . . . . . . . . . . . . . . . . . . . . . . . . . . . . . . . . . . . . 224
Part 3 Index
Index . . . . . . . . . . . . . . . . . . . . . . . . . . . . . . . . . . . . . . . . . . . . . . . . . . . . . . . . . . . . 229
xiCopyright © 2011, Juniper Networks, Inc.
Table of Contents

Copyright © 2011, Juniper Networks, Inc.xii
Junos OS Monitoring and Troubleshooting Guide for Security Devices

About This Guide
This preface provides the following guidelines for using the Junos OSMonitoring and
Troubleshooting Guide for Security Devices:
• J Series and SRX Series Documentation and Release Notes on page xiii
• Objectives on page xiv
• Audience on page xiv
• Supported Routing Platforms on page xiv
• Document Conventions on page xiv
• Documentation Feedback on page xvi
• Requesting Technical Support on page xvi
J Series and SRX Series Documentation and Release Notes
For a list of related J Series documentation, see
http://www.juniper.net/techpubs/software/junos-jseries/index-main.html .
For a list of related SRX Series documentation, see
http://www.juniper.net/techpubs/hardware/srx-series-main.html .
If the information in the latest release notes differs from the information in the
documentation, follow the Junos OS Release Notes.
To obtain the most current version of all Juniper Networks®
technical documentation,
see the product documentation page on the Juniper Networks website at
http://www.juniper.net/techpubs/.
Juniper Networks supports a technical book program to publish books by Juniper Networks
engineers and subject matter experts with book publishers around the world. These
books go beyond the technical documentation to explore the nuances of network
architecture, deployment, and administration using the Junos operating system (Junos
OS) and Juniper Networks devices. In addition, the Juniper Networks Technical Library,
published in conjunction with O'Reilly Media, explores improving network security,
reliability, and availability using Junos OS configuration techniques. All the books are for
sale at technical bookstores and book outlets around the world. The current list can be
viewed at http://www.juniper.net/books .
xiiiCopyright © 2011, Juniper Networks, Inc.

Objectives
This guide describes how to use and configure key security features on J Series Services
Routers and SRX Series Services Gateways running Junos OS. It provides conceptual
information, suggested workflows, and examples where applicable.
Audience
This manual is designed for anyone who installs, sets up, configures, monitors, or
administers a J Series Services Router or an SRX Series Services Gateway running Junos
OS. The manual is intended for the following audiences:
• Customers with technical knowledge of and experience with networks and network
security, the Internet, and Internet routing protocols
• Network administrators who install, configure, and manage Internet routers
Supported Routing Platforms
This manual describes features supported on J Series Services Routers and SRX Series
Services Gateways running Junos OS.
Document Conventions
Table 1 on page xiv defines the notice icons used in this guide.
Table 1: Notice Icons
DescriptionMeaningIcon
Indicates important features or instructions.Informational note
Indicates a situation that might result in loss of data or hardware damage.Caution
Alerts you to the risk of personal injury or death.Warning
Alerts you to the risk of personal injury from a laser.Laser warning
Table 2 on page xv defines the text and syntax conventions used in this guide.
Copyright © 2011, Juniper Networks, Inc.xiv
Junos OS Monitoring and Troubleshooting Guide for Security Devices

Table 2: Text and Syntax Conventions
ExamplesDescriptionConvention
To enter configuration mode, type theconfigure command:
user@host> configure
Represents text that you type.Bold text like this
user@host> show chassis alarms
No alarms currently active
Represents output that appears on theterminal screen.
Fixed-width text like this
• A policy term is a named structurethat defines match conditions andactions.
• JunosOSSystemBasicsConfigurationGuide
• RFC 1997,BGPCommunities Attribute
• Introduces important new terms.
• Identifies book names.
• Identifies RFC and Internet draft titles.
Italic text like this
Configure the machine’s domain name:
[edit]root@# set system domain-namedomain-name
Represents variables (options for whichyou substitute a value) in commands orconfiguration statements.
Italic text like this
• To configure a stub area, include thestub statement at the [edit protocolsospf area area-id] hierarchy level.
• The console port is labeledCONSOLE.
Represents names of configurationstatements, commands, files, anddirectories; interface names;configuration hierarchy levels; or labelson routing platform components.
Text like this
stub <default-metricmetric>;Enclose optional keywords or variables.< > (angle brackets)
broadcast | multicast
(string1 | string2 | string3)
Indicates a choice between the mutuallyexclusive keywords or variables on eitherside of the symbol. The set of choices isoften enclosed in parentheses for clarity.
| (pipe symbol)
rsvp { # Required for dynamicMPLS onlyIndicates a comment specified on thesame line as the configuration statementto which it applies.
# (pound sign)
community namemembers [community-ids ]
Enclose a variable for which you cansubstitute one or more values.
[ ] (square brackets)
[edit]routing-options {static {route default {nexthop address;retain;
}}
}
Identify a level in the configurationhierarchy.
Indention and braces ( { } )
Identifies a leaf statement at aconfiguration hierarchy level.
; (semicolon)
J-Web GUI Conventions
xvCopyright © 2011, Juniper Networks, Inc.
About This Guide

Table 2: Text and Syntax Conventions (continued)
ExamplesDescriptionConvention
• In the Logical Interfaces box, selectAll Interfaces.
• To cancel the configuration, clickCancel.
Represents J-Web graphical userinterface (GUI) items you click or select.
Bold text like this
In the configuration editor hierarchy,select Protocols>Ospf.
Separates levels in a hierarchy of J-Webselections.
> (bold right angle bracket)
Documentation Feedback
We encourage you to provide feedback, comments, and suggestions so that we can
improve the documentation. You can send your comments to
[email protected], or fill out the documentation feedback form at
https://www.juniper.net/cgi-bin/docbugreport/ . If you are using e-mail, be sure to include
the following information with your comments:
• Document or topic name
• URL or page number
• Software release version (if applicable)
Requesting Technical Support
Technical product support is available through the Juniper Networks Technical Assistance
Center (JTAC). If you are a customer with an active J-Care or JNASC support contract,
or are covered under warranty, and need postsales technical support, you can access
our tools and resources online or open a case with JTAC.
• JTAC policies—For a complete understanding of our JTAC procedures and policies,
review the JTAC User Guide located at
http://www.juniper.net/us/en/local/pdf/resource-guides/7100059-en.pdf .
• Product warranties—For product warranty information, visit
http://www.juniper.net/support/warranty/ .
• JTAC Hours of Operation —The JTAC centers have resources available 24 hours a day,
7 days a week, 365 days a year.
Self-Help Online Tools and Resources
For quick and easy problem resolution, Juniper Networks has designed an online
self-service portal called the Customer Support Center (CSC) that provides you with the
following features:
• Find CSC offerings: http://www.juniper.net/customers/support/
• Find product documentation: http://www.juniper.net/techpubs/
Copyright © 2011, Juniper Networks, Inc.xvi
Junos OS Monitoring and Troubleshooting Guide for Security Devices

• Find solutions and answer questions using our Knowledge Base: http://kb.juniper.net/
• Download the latest versions of software and review release notes:
http://www.juniper.net/customers/csc/software/
• Search technical bulletins for relevant hardware and software notifications:
https://www.juniper.net/alerts/
• Join and participate in the Juniper Networks Community Forum:
http://www.juniper.net/company/communities/
• Open a case online in the CSC Case Management tool: http://www.juniper.net/cm/
To verify service entitlement by product serial number, use our Serial Number Entitlement
(SNE) Tool: https://tools.juniper.net/SerialNumberEntitlementSearch/
Opening a Casewith JTAC
You can open a case with JTAC on the Web or by telephone.
• Use the Case Management tool in the CSC at http://www.juniper.net/cm/ .
• Call 1-888-314-JTAC (1-888-314-5822 toll-free in the USA, Canada, and Mexico).
For international or direct-dial options in countries without toll-free numbers, visit us at
http://www.juniper.net/support/requesting-support.html
xviiCopyright © 2011, Juniper Networks, Inc.
About This Guide

Copyright © 2011, Juniper Networks, Inc.xviii
Junos OS Monitoring and Troubleshooting Guide for Security Devices

PART 1
Monitoring the Device
• Device and Routing Operations Monitoring on page 3
• Security Logs on page 113
1Copyright © 2011, Juniper Networks, Inc.

Copyright © 2011, Juniper Networks, Inc.2
Junos OS Monitoring and Troubleshooting Guide for Security Devices

CHAPTER 1
DeviceandRoutingOperationsMonitoring
• Monitoring Overview on page 3
• Monitoring Interfaces on page 5
• Monitoring Address Pools on page 6
• Monitoring Reports on page 7
• Monitoring Events and Alarms on page 14
• Monitoring the System on page 19
• Monitoring NAT on page 25
• Monitoring Security Features on page 31
• Monitoring Voice ALGs on page 46
• Monitoring SIP ALGs on page 60
• Monitoring H.323 ALG Information on page 64
• Monitoring MGCP ALGs on page 66
• Monitoring SCCP ALGs on page 69
• Monitoring VPNs on page 71
• Monitoring Switching on page 82
• Monitoring Routing Information on page 85
• Monitoring Class-of-Service Performance on page 92
• Monitoring MPLS Traffic Engineering Information on page 100
• Monitoring PPPoE on page 105
• Monitoring PPP on page 108
• Monitoring the WAN Acceleration Interface on page 108
• Monitoring DHCP on page 109
• Monitoring System Log Messages with the J-Web Event Viewer on page 110
Monitoring Overview
Junos OS supports a suite of J-Web tools and CLI operational mode commands for
monitoring the system health and performance of your device. Monitoring tools and
commands display the current state of the device. To use the J-Web user interface and
CLI operational tools, you must have the appropriate access privileges.
3Copyright © 2011, Juniper Networks, Inc.

You can use the J-Web Monitor option to monitor a device. J-Web results appear in the
browser.
You can also monitor the device with CLI operational mode commands. CLI command
output appears on the screen of your console or management device, or you can filter
the output to a file. For operational commands that display output, such as the show
commands, you can redirect the output into a filter or a file. When you display help about
these commands, one of the options listed is |, called a pipe, which allows you to filter
the command output.
For example, if you enter the show configuration command, the complete device
configuration appears on the screen. To limit the display to only those lines of the
configuration that contain address, enter the show configuration command using a pipe
into the match filter:
user@host> show configuration | match addressaddress-range low 192.168.3.2 high 192.168.3.254; address-range low 192.168.71.71 high 192.168.71.254; address 192.168.71.70/21; address 192.168.2.1/24; address 127.0.0.1/32;
For a complete list of the filters, type a command, followed by the pipe, followed by a
question mark (?):
user@host> show configuration | ?Possible completions: compare Compare configuration changes with prior version count Count occurrences display Show additional kinds of information except Show only text that does not match a pattern find Search for first occurrence of pattern hold Hold text without exiting the prompt last Display end of output only match Show only text that matches a pattern no-more Don't paginate output request Make system-level requests resolve Resolve IP addresses save Save output text to file trim Trim specified number of columns from start of line
You can specify complex expressions as an option for the match and except filters.
NOTE: To filter the output of configurationmode commands, use the filtercommands provided for the operational mode commands. In configurationmode, an additional filter is supported.
RelatedDocumentation
Monitoring Interfaces on page 5•
• Junos OS CLI Reference
• Junos OS Security Configuration Guide
• Junos OS System Basics Configuration Guide
• Junos OS Interfaces Command Reference
Copyright © 2011, Juniper Networks, Inc.4
Junos OS Monitoring and Troubleshooting Guide for Security Devices

• Junos OS System Basics and Services Command Reference
• Junos OS Feature Support Reference for SRX Series and J Series Devices
Monitoring Interfaces
Purpose View general information about all physical and logical interfaces for a device.
Action SelectMonitor>Interfaces in the J-Web user interface. The J-Web Interfaces page
displays the following details about each device interface:
• Port—Indicates the interface name.
• Admin Status—Indicates whether the interface is enabled (Up) or disabled (Down).
• Link Status—Indicates whether the interface is linked (Up) or not linked (Down).
• Address—Indicates the IP address of the interface.
• Zone—Indicates whether the zone is an untrust zone or a trust zone.
• Services—Indicates services that are enabled on the device, such as HTTP and SSH.
• Protocols—Indicates protocols that are enabled on the device, such as BGP and IGMP.
• Input Rate graph—Displays interface bandwidth utilization. Input rates are shown in
bytes per second.
• Output Rate graph—Displays interface bandwidth utilization. Output rates are shown
in bytes per second.
• Error Counters chart—Displays input and output error counters in the form of a bar
chart.
• Packet Counters chart—Displays the number of broadcast, unicast, and multicast
packet counters in the form of a pie chart. (Packet counter charts are supported only
for interfaces that support MAC statistics.)
To change the interface display, use the following options:
• Port for FPC—Controls the member for which information is displayed.
• Start/Stop button—Starts or stops monitoring the selected interfaces.
• Show Graph—Displays input and output packet counters and error counters in the form
of charts.
• Pop-up button—Displays the interface graphs in a separate pop-up window.
• Details—Displays extensive statistics about the selected interface, including its general
status, traffic information, IP address, I/O errors, class-of-service data, and statistics.
• Refresh Interval—Indicates the duration of time after which you want the data on the
page to be refreshed.
• Clear Statistics—Clears the statistics for the selected interface.
5Copyright © 2011, Juniper Networks, Inc.
Chapter 1: Device and Routing Operations Monitoring

Alternatively, you can enter the following show commands in the CLI to view interface
status and traffic statistics:
• show interfaces terse
NOTE: On SRX Series devices, on configuring identical IPs on a singleinterface, youwill not seeawarningmessage; instead, youwill see a syslogmessage.
• show interfaces detail
• show interfaces extensive
• show interfaces interface-name
RelatedDocumentation
Monitoring Overview on page 3•
• Monitoring Address Pools on page 6
• Junos OS CLI User Guide
• Junos OS CLI Reference
• Junos OS Interfaces Command Reference
• Junos OS Interfaces Configuration Guide for Security Devices
• Junos OS System Basics and Services Command Reference
• Junos OS Feature Support Reference for SRX Series and J Series Devices
Monitoring Address Pools
Purpose Use the monitoring functionality to view the Address Pools page.
Action To monitor Address Pools, selectMonitor>Access>Address Pools.
Meaning Table 3 on page 6 summarizes key output fields in the Address Pools page.
Table 3: Address Pools Monitoring Page
Additional InformationValuesField
Address Pool Properties
-Displays the name of the address pool.Address Pool Name
-Displays the IP network address of theaddress pool.
Network Address
-Displays the name, the lower limit, andthe upper limit of the address range.
Address Ranges
Copyright © 2011, Juniper Networks, Inc.6
Junos OS Monitoring and Troubleshooting Guide for Security Devices

Table 3: Address Pools Monitoring Page (continued)
Additional InformationValuesField
-Displays the primary-dns IP address.Primary DNS
-Displays the secondary-dns IP address.Secondary DNS
-Displays the primary-wins IP address.Primary WINS
-Displays the secondary-wins IP address.Secondary WINS
Address Pool Address Assignment
-Displays the IP address of the addresspool.
IP Address
-Displays the hardware MAC address ofthe address pool.
Hardware Address
-Displays the user name using the addresspool.
Host/User
The authentication types can beextended authentication (XAuth) or IKEAuthentication.
Displays the authentication type used bythe address pool
Type
RelatedDocumentation
Monitoring Interfaces on page 5•
• Threats Monitoring Report on page 7
Monitoring Reports
On-box reporting offers a comprehensive reporting facility where your security
management team can spot a security event when it occurs, immediately access and
review pertinent details about the event, and quickly decide appropriate remedial action.
The J-Web reporting feature provides one- or two-page reports that are equivalent to a
compilation of numerous log entries.
This section contains the following topics:
• Threats Monitoring Report on page 7
• Traffic Monitoring Report on page 12
Threats Monitoring Report
Purpose Use the Threats Report to monitor general statistics and activity reports of current threats
to the network. You can analyze logging data for threat type, source and destination
details, and threat frequency information. The report calculates, displays, and refreshes
the statistics, providing graphic presentations of the current state of the network.
7Copyright © 2011, Juniper Networks, Inc.
Chapter 1: Device and Routing Operations Monitoring

Action To view the Threats Report:
1. Click Threats Report in the bottom right of the Dashboard, or select
Monitor>Reports>Threats. The Threats Report appears.
2. Select one of the following tabs:
• Statistics tab. See Table 4 on page 8 for a description of the page content.
• Activities tab. See Table 5 on page 10 for a description of the page content.
Table 4: Statistics Tab Output in the Threats Report
DescriptionField
General Statistics Pane
One of the following categories of threats:
• Traffic
• IDP
• Content Security
• Antivirus
• Antispam
• Web Filter—Click the Web filter category to display counters for 39 subcategories.
• Content Filter
• Firewall Event
Threat Category
Severity level of the threat:
• emerg
• alert
• crit
• err
• warning
• notice
• info
• debug
Severity
Number of threats encountered per category in the past 24 hours.Hits in past 24 hours
Number of threats encountered per category in the last hour.Hits in current hour
Threat Counts in the Past 24 Hours
Graph representing the number of threats received each hour for the past 24 hours sortedby severity level.
By Severity
Graph representing the number of threats received each hour for the past 24 hours sortedby category.
By Category
Twenty-four hour span with the current hour occupying the right-most column of the display.The graph shifts to the left every hour.
X Axis
Copyright © 2011, Juniper Networks, Inc.8
Junos OS Monitoring and Troubleshooting Guide for Security Devices

Table 4: Statistics Tab Output in the Threats Report (continued)
DescriptionField
Number of threats encountered. The axis automatically scales based on the number ofthreats encountered.
Y Axis
Most Recent Threats
Names of the most recent threats. Depending on the threat category, you can click the threatname to go to a scan engine site for a threat description.
Threat Name
Category of each threat:
• Traffic
• IDP
• Content Security
• Antivirus
• Antispam
• Web Filter
• Content Filter
• Firewall Event
Category
Source IP address (and port number, if applicable) of the threat.Source IP/Port
Destination IP address (and port number, if applicable) of the threat.Destination IP/Port
Protocol name of the threat.Protocol
Threat identification based on the category type:
• Antivirus—URL
• Web filter—category
• Content filter—reason
• Antispam—sender e-mail
Description
Action taken in response to the threat.Action
Time the threat occurred.Hit Time
Threat Trend in past 24 hours
Pie chart graphic representing comparative threat counts by category:
• Traffic
• IDP
• Content Security
• Antivirus
• Antispam
• Web Filter
• Content Filter
• Firewall Event
Category
9Copyright © 2011, Juniper Networks, Inc.
Chapter 1: Device and Routing Operations Monitoring

Table 4: Statistics Tab Output in the Threats Report (continued)
DescriptionField
Web Filter Counters Summary
Web filter count broken down by up to 39 subcategories. Clicking on the Web filter listing inthe General Statistics pane opens the Web Filter Counters Summary pane.
Category
Number of threats per subcategory in the last 24 hours.Hits in past 24 hours
Number of threats per subcategory in the last hour.Hits in current hour
Table 5: Activities Tab Output in the Threats Report
FunctionField
Most Recent Virus Hits
Name of the virus threat. Viruses can be based on services, like Web, FTP, or e-mail, or basedon severity level.
Threat Name
Severity level of each threat:
• emerg
• alert
• crit
• err
• warning
• notice
• info
• debug
Severity
IP address (and port number, if applicable) of the source of the threat.Source IP/Port
IP address (and port number, if applicable) of the destination of the threat.Destination IP/Port
Protocol name of the threat.Protocol
Threat identification based on the category type:
• Antivirus—URL
• Web filter—category
• Content filter—reason
• Antispam—sender e-mail
Description
Action taken in response to the threat.Action
Last time the threat occurred.Last Hit Time
Most Recent Spam E-Mail Senders
E-mail address that was the source of the spam.From e-mail
Copyright © 2011, Juniper Networks, Inc.10
Junos OS Monitoring and Troubleshooting Guide for Security Devices

Table 5: Activities Tab Output in the Threats Report (continued)
FunctionField
Severity level of the threat:
• emerg
• alert
• crit
• err
• warning
• notice
• info
• debug
Severity
IP address of the source of the threat.Source IP
Action taken in response to the threat.Action
Last time that the spam e-mail was sent.Last Send Time
Recently Blocked URL Requests
URL request that was blocked.URL
IP address (and port number, if applicable) of the source.Source IP/Port
IP address (and port number, if applicable) of the destination.Destination IP/Port
Number of threats encountered in the last hour.Hits in current hour
Most Recent IDP Attacks
Attack
Severity of each threat:
• emerg
• alert
• crit
• err
• warning
• notice
• info
• debug
Severity
IP address (and port number, if applicable) of the source.Source IP/Port
IP address (and port number, if applicable) of the destination.Destination IP/Port
Protocol name of the threat.Protocol
11Copyright © 2011, Juniper Networks, Inc.
Chapter 1: Device and Routing Operations Monitoring

Table 5: Activities Tab Output in the Threats Report (continued)
FunctionField
Action taken in response to the threat.Action
Last time the IDP threat was sent.Last Send Time
Traffic Monitoring Report
Purpose Monitor network traffic by reviewing reports of flow sessions over the past 24 hours. You
can analyze logging data for connection statistics and session usage by a transport
protocol.
Action To view network traffic in the past 24 hours, selectMonitor>Reports>Traffic in the J-Web
user interface. See Table 6 on page 12 for a description of the report.
Table 6: Traffic Report Output
DescriptionField
Sessions in Past 24 Hours per Protocol
Name of the protocol. To see hourly activity by protocol, click the protocol name and reviewthe “Protocol activities chart” in the lower pane.
• TCP
• UDP
• ICMP
Protocol Name
Total number of sessions for the protocol in the past 24 hours.Total Session
Total number of incoming bytes in KB.Bytes In (KB)
Total number of outgoing bytes in KB.Bytes Out (KB)
Total number of incoming packets.Packets In
Total number of outgoing packets.Packets Out
Most Recently Closed Sessions
Source IP address (and port number, if applicable) of the closed session.Source IP/Port
Destination IP address (and port number, if applicable) of the closed session.Destination IP/Port
Protocol of the closed session.
• TCP
• UDP
• ICMP
Protocol
Total number of incoming bytes in KB.Bytes In (KB)
Copyright © 2011, Juniper Networks, Inc.12
Junos OS Monitoring and Troubleshooting Guide for Security Devices

Table 6: Traffic Report Output (continued)
DescriptionField
Total number of outgoing bytes in KB.Bytes Out (KB)
Total number of incoming packets.Packets In
Total number of outgoing packets.Packets Out
The time the session was closed.Timestamp
Protocol Activities Chart
Graphic representation of traffic as incoming and outgoing bytes per hour. The byte countis for the protocol selected in the Sessions in Past 24 Hours per Protocol pane. Changingthe selection causes this chart to refresh immediately.
Bytes In/Out
Graphic representation of traffic as incoming and outgoing packets per hour. The packetcount is for the protocol selected in the Sessions in Past 24 Hours per Protocol pane.Changing the selection causes this chart to refresh immediately.
Packets In/Out
Graphic representation of traffic as the number of sessions per hour. The session count isfor the protocol selected in the Sessions in Past 24 Hours per Protocol pane. Changing theselection causes this chart to refresh immediately.
Sessions
One hour per column for 24 hours.X Axis
Byte, packet, or session count.Y Axis
Protocol Session Chart
Graphic representation of the traffic as the current session count per protocol. The protocolsdisplayed are TCP, UDP, and ICMP.
Sessions by Protocol
RelatedDocumentation
Monitoring Overview on page 3•
• Monitoring Interfaces on page 5
• Junos OS CLI Reference
• Junos OS Interfaces Command Reference
• Junos OS Interfaces Configuration Guide for Security Devices
• Junos OS System Basics and Services Command Reference
• Junos OS Feature Support Reference for SRX Series and J Series Devices
13Copyright © 2011, Juniper Networks, Inc.
Chapter 1: Device and Routing Operations Monitoring

Monitoring Events and Alarms
• Monitoring Alarms on page 14
• Monitoring Events on page 15
• Monitoring Security Events by Policy on page 17
Monitoring Alarms
Purpose Use the monitoring functionality to view the alarms page.
Action To monitor alarms selectMonitor>Events and Alarms>View Alarms.
Meaning Table 7 on page 14 summarizes key output fields in the alarms page.
Table 7: AlarmsMonitoring Page
Additional InformationValueField
Alarm Filter
—Specifies the type of alarm to monitor:
• System– System alarms include FRUdetection alarms (power suppliesremoved, for instance).
• Chassis– Chassis alarms indicateenvironmental alarms such astemperature.
• All– Indicates to display all the types ofalarms.
Alarm Type
—Specifies the alarm severity that you wantto monitor
• Major– A major (red) alarm conditionrequires immediate action.
• Minor– A minor (yellow) condition requiresmonitoring and maintenance.
• All– Indicates to display all the severities.
Severity
—Enter a brief synopsis of the alarms you wantto monitor.
Description
—Specifies the beginning of the date rangethat you want to monitor. Set the date usingthe calendar pick tool.
Date From
—Specifies the end of the date range that youwant to monitor. Set the date using thecalendar pick tool.
To
—Executes the options that you specified.Go
Copyright © 2011, Juniper Networks, Inc.14
Junos OS Monitoring and Troubleshooting Guide for Security Devices

Table 7: AlarmsMonitoring Page (continued)
Additional InformationValueField
—Clears the options that you specified.Reset
—Displays the following information abouteach alarm:
• Type– Type of alarm: System, Chassis, orAll.
• Severity– Severity class of the alarm:Minor or Major.
• Description– Description of the alarm.
• Time– Time that the alarm was registered.
Alarm Details
RelatedDocumentation
Monitoring Events on page 15•
• Monitoring Security Events by Policy on page 17
Monitoring Events
Purpose Use the monitoring functionality to view the events page.
Action To monitor events selectMonitor>Events and Alarms>View Events.
Meaning Table 8 on page 15 summarizes key output fields in the events page.
Table 8: Events Monitoring Page
Additional InformationValueField
Events Filter
—Specifies the name of the system log file thatrecords errors and events.
System Log File
—Specifies the system processes thatgenerate the events to display.
Process
Select to enable.Specifies to enable the option to includearchived files.
Include archived files
—Specifies the beginning date range tomonitor. Set the date using the calendar picktool.
Date From
—Specifies the end of the date range tomonitor. Set the date using the calendar picktool.
To
—Specifies the specific ID of the error or eventto monitor.
Event ID
15Copyright © 2011, Juniper Networks, Inc.
Chapter 1: Device and Routing Operations Monitoring

Table 8: Events Monitoring Page (continued)
Additional InformationValueField
—Enter a description for the errors or events.Description
—Fetches the errors and events specified inthe search criteria.
Search
—Clears the cache of errors and events thatwere previously selected.
Reset
—Creates an HTML report based on thespecified parameters.
Generate Report
Events Detail
–Displays the system process that generatedthe error or event.
Process
–Displays the severity level that indicates howseriously the triggering event affects routingplatform functions. Only messages from thefacility that are rated at that level or higherare logged. Possible severities and theircorresponding color code are:
• Debug/Info/Notice(Green)–Indicatesconditions that are not errors but are ofinterest or might warrant special handling.
• Warning (Yellow) – Indicates conditionsthat warrant monitoring.
• Error (Blue) – Indicates standard errorconditions that generally have less seriousconsequences than errors in theemergency, alert, and critical levels.
• Critical (Pink) – Indicates criticalconditions, such as hard drive errors.
• Alert (Orange) – Indicates conditions thatrequire immediate correction, such as acorrupted system database.
• Emergency(Red)– Indicates system panicor other conditions that cause the routingplatform to stop functioning.
Severity
—Displays the unique ID of the error or event.The prefix on each code identifies thegenerating software process. The rest of thecode indicates the specific event or error.
Event ID
—Displays a more detailed explanation of themessage.
Event Description
—Time that the error or event occurred.Time
Copyright © 2011, Juniper Networks, Inc.16
Junos OS Monitoring and Troubleshooting Guide for Security Devices

RelatedDocumentation
Monitoring Alarms on page 14•
• Monitoring Security Events by Policy on page 17
Monitoring Security Events by Policy
Purpose Monitor security events by policy and display logged event details with the J-Web user
interface.
Action SelectMonitor>Events and Alarms>Security Events. The View Policy Log pane
appears. Table 9 on page 17 describes the content of this pane.
1.
Table 9: View Policy Log Fields
ValueField
Name of the event log files to search.Log file name
Name of the policy of the events to be retrieved.Policy name
Source address of the traffic that triggered the event.Source address
Destination address of the traffic that triggered the event.Destination address
Type of event that was triggered by the traffic.Event type
Application of the traffic that triggered the event.Application
Source port of the traffic that triggered the event.Source port
Destination port of the traffic that triggered the event.Destination port
Source zone of the traffic that triggered the event.Source zone
Destination zone of the traffic that triggered the event.Destination zone
Source NAT rule of the traffic that triggered the event.Source NAT rule
Destination NAT rule of the traffic that triggered the event.Destination NAT rule
If your device is not configured to store session log files locally, the Create log
configuration button is displayed in the lower-right portion of the View Policy Log
pane.
• To store session log files locally, click Create log configuration.
If session logs are being sent to an external log collector (stream mode has been
configured for log files), a message appears indicating that event mode must be
configured to view policy logs.
17Copyright © 2011, Juniper Networks, Inc.
Chapter 1: Device and Routing Operations Monitoring

NOTE: Reverting to event mode will discontinue event logging to theexternal log collector.
• To reset themode option to event, enter the set security log command.
2. Enter one or more search fields in the View Policy Log pane and clickSearch to display
events matching your criteria.
For example, enter the event type Session Close and the policy pol1 to display event
details from all Session Close logs that contain the specified policy. To reduce search
results further, add more criteria about the particular event or group of events that
you want displayed.
The Policy Events Detail pane displays information from each matching session log.
Table 10 on page 18 describes the contents of this pane.
Table 10: Policy Events Detail Fields
ValueField
Time when the event occurred.Timestamp
Policy that triggered the event.Policy name
Type of event log providing the data.Record type
Source address (and port, if applicable) of the event traffic.Source IP/Port
Destination address (and port, if applicable) of the event traffic.Destination IP/Port
Service name of the event traffic.Service name
NAT source address (and port, if applicable) of the event traffic.NAT source IP/Port
NAT destination address (and port, if applicable) of the eventtraffic.
NAT destination IP/Port
RelatedDocumentation
Monitoring Overview on page 3•
• Monitoring Interfaces on page 5
• Monitoring Alarms on page 14
• Monitoring Events on page 15
• Junos OS CLI Reference
• Junos OS Interfaces Command Reference
• Junos OS Interfaces Configuration Guide for Security Devices
• Junos OS System Basics and Services Command Reference
Copyright © 2011, Juniper Networks, Inc.18
Junos OS Monitoring and Troubleshooting Guide for Security Devices

• Junos OS Feature Support Reference for SRX Series and J Series Devices
Monitoring the System
The J-Web user interface lets you monitor a device’s physical characteristics, current
processing status and alarms, and ongoing resource utilization to quickly assess the
condition of a device at any time.
On SRX Series devices, the Dashboard lets you customize your view by selecting which
informational panes to include on the Dashboard. On a J Series device, the
Monitor>SystemView path provides detailed views of system, chassis, and process
information.
This section contains the following topics:
• Monitoring System Properties for SRX Series Devices on page 19
• Monitoring System Properties for J Series Devices on page 21
• Monitoring Chassis Information on page 22
• Monitoring Process Details for J Series Devices on page 24
Monitoring SystemProperties for SRX Series Devices
Purpose View system properties and customize the Dashboard.
When you start the J-Web user interface on an SRX Series device, the interface opens
to the Dashboard. At the top and bottom of the page, the Dashboard displays an
interactive representation of your device and a current log messages pane. By default,
the center panes of the Dashboard display System Information, Resource Utilization,
Security Resources, and System Alarms. However, you can customize the Dashboard
panes to provide the best overview of your system.
Action To control the content and appearance of the Dashboard:
1. Click the Preferences icon at the top-right corner of the page. The Dashboard
Preference dialog box appears.
2. Select the types of information you want to display.
3. (Optional) Specify the Automatically Refresh Data option to specify how often you
want the data on the Dashboard to be refreshed.
4. ClickOK to save the configuration or Cancel to clear it.
5. On the Dashboard, minimize, maximize, or drag the individual information panes to
customize the display as needed.
Chassis View—Displays an image of the device chassis, including line cards, link states,
errors, individual PICs, FPCs, fans, and power supplies.
You can use the Chassis View to link to corresponding configuration and monitoring
pages for the device. To link to interface configuration pages for a selected port from
19Copyright © 2011, Juniper Networks, Inc.
Chapter 1: Device and Routing Operations Monitoring

the Chassis View, right-click the port in the device image and choose one of the
following options:
• Chassis Information—Links to the Chassis page.
• Configure Port: Port-name—Links to the interfaces configuration page for the
selected port.
• Monitor Port: Port-name—Links to the monitor interfaces page for the selected
port.
System Identification—Displays the device’s serial number, hostname, current software
version, the BIOS version, the amount of time since the device was last booted, and
the system’s time.
NOTE:
• To view the BIOS version under system identification, delete yourbrowser cookies.
• Thehostnamethatappears in thispane isdefinedusing the setsystem
hostname command.
On SRX Series devices, security logs were always timestamped usingtheUTC time zone by running set system time-zone utc and set security
logutc-timestampCLIcommands.Now, timezonecanbedefinedusing
the local time zone by running the set system time-zone time-zone
command to specify the local time zone that the system should usewhen timestamping the security logs.
Resource Utilization—Provides a graphic representation of resource use. Each bar
represents the percentage of CPU, memory, or storage utilization for the data plane
or the control plane.
Security Resources—Provides the maximum, configured, and active sessions; firewall and
VPN policies; and IPsec VPNs. Click Sessions,FW/VPN Policies, or IPsec VPNs for
detailed statistics about each category.
System Alarms—Indicates a missing rescue configuration or software license, where valid.
System alarms are preset and cannot be modified.
File Usage—Displays the usage statistics for log files, temporary files, crash (core) files,
and database files.
Login Sessions—Provides a list of all currently logged in sessions. The display includes
user credentials, login time, and idle time for each session.
Chassis Status—Provides a snapshot of the current physical condition of the device,
including temperature and fan status.
Storage Usage—Displays the storage usage report in detail.
Copyright © 2011, Juniper Networks, Inc.20
Junos OS Monitoring and Troubleshooting Guide for Security Devices

Threat Activity—Provides information about the most current threats received on the
device.
Message Logs—Displays log messages and errors. You can clear old logs from the Message
Logs pane by clicking the Clear button.
To control the information that is displayed in the Chassis View, use the following options:
• To view an image of the front of the device, right-click the image and choose ViewFront.
• To view an image of the back of the device, right-click the image and choose ViewRear.
• To enlarge or shrink the device view, use the Zoom bar.
• To return the device image to its original position and size, click Reset.
NOTE: Touse theChassisView,a recentversionofAdobeFlash that supportsActionScript and AJAX (Version 9)must be installed. Also note that theChassis View appears by default on the Dashboard page. You can enable ordisable it using options in the Dashboard Preference dialog box. Clearingcookies in Internet Explorer also causes the Chassis View appear on theDashboard page.
To return to the Dashboard at any time, selectDashboard in the J-Web user interface.
Alternatively, you can view system properties by entering the following show commands
in the CLI:
• show system uptime
• show system users
• show system storage
• show version
• show chassis hardware
Monitoring SystemProperties for J Series Devices
Purpose View the system properties on a J Series device.
Action SelectMonitor>SystemView>System Information in the J-Web user interface. The
System Information page displays the following types of information:
21Copyright © 2011, Juniper Networks, Inc.
Chapter 1: Device and Routing Operations Monitoring

• General—General tab of the System Information page displays the device’s serial
number, current Junos OS version, hostname, IP address, loopback address, domain
name server, and time zone.
NOTE: The hostname that appears on this page is defined using the set
system hostname command.
On J Series devices, security logswere always timestamped using theUTCtime zone by running set system time-zone utc and set security log
utc-timestamp CLI commands. Now, time zone can be defined using the
local time zone by running the set system time-zone time-zone command
to specify the local time zone that the system should use whentimestamping the security logs.
• Time—Time tab of the System Information page displays the current time for the
device, the last time the device was booted, the last time protocol settings were
configured on the device, and the last time the device configuration was updated.
Additionally, this tab displays the CPU load averages for the last 1, 5, and 15 minutes.
• Storage Media—Storage Media tab of the System Information page displays information
about the memory components installed on the device (such as flash memory or USB)
and the amount of memory used compared to total memory available.
• Logged-In User Details—Logged-In User Details section of the System Information
page displays information about the users who are currently logged into the device,
including their usernames, the terminals and systems from which they logged in, the
length of their user sessions, and how long their sessions have remained idle.
• Active User Count—Active User Count field displays the number of users currently
signed into the device.
Alternatively, you can view system properties by entering the following show commands
in the CLI configuration editor:
• show system uptime
• show system users
• show system storage
• show version
• show chassis hardware
• show interface terse
Monitoring Chassis Information
Purpose View chassis properties, which include the status of hardware components on the device.
Copyright © 2011, Juniper Networks, Inc.22
Junos OS Monitoring and Troubleshooting Guide for Security Devices

Action To view these chassis properties, select Monitor>SystemView>Chassis Information in
the J-Web user interface.
CAUTION: Donot install acombinationofPhysical InterfaceModules (PIMs)in a single chassis that exceeds themaximum power and heat capacity ofthe chassis. If J Series power management is enabled, PIMs that exceed themaximumpower and heat limits remain offlinewhen the chassis is poweredon. To check PIM power and heat status, use the show chassis fpc and show
chassis power-ratings commands.
The Chassis Information page displays the following types of information:
• Routing Engine Details—This section of the page includes the following tabs:
• Master—Master tab displays information about the routing engine, including the
routing engine module, model number, version, part number, serial number, memory
utilization, temperature, and start time. Additionally, this tab displays the CPU load
averages for the last 1, 5, and 15 minutes.
• Backup—If a backup routing engine is available, the Backup tab displays the routing
engine module, model number, version, part number, serial number, memory
utilization, temperature, and start time. Additionally, this tab displays the CPU load
averages for the last 1, 5, and 15 minutes.
NOTE: If you need to contact customer support about the device chassis,supply themwith the version and serial number displayed in the RoutingEngine Details section of the page.
• Power and Fan Tray Details—This Details section of the page includes the following
tabs:
• Power—Power tab displays the names of the device’s power supply units and their
statuses.
• Fan—Fan tab displays the names of the device’s fans and their speeds (normal or
high). (The fan speeds are adjusted automatically according to the current
temperature.)
• Chassis Component Details—This section of the page includes the following tabs:
• General—General tab displays the version number, part number, serial number, and
description of the selected device component.
• Temperature—Temperature tab displays the temperature of the selected device
component (if applicable).
• Resource—Resource tab displays the state, total CPU DRAM, and start time of the
selected device component (if applicable).
23Copyright © 2011, Juniper Networks, Inc.
Chapter 1: Device and Routing Operations Monitoring

NOTE: On some devices, you can have an FPC state as “offline.” Youmay want to put an FPC offline because of an error or if the FPC is notresponding. You can put the FPC offline by using the CLI commandrequest chassis fpc slot number offline.
• Sub-Component—Sub-Component tab displays information about the device’s
sub-components (if applicable). Details include the sub-component’s version, part
number, serial number, and description.
To control which component details appear, select a hardware component from the
Select component list.
Alternatively, you can view chassis details by entering the following show commands in
the CLI configuration editor:
• show chassis hardware
• show chassis routing-engine
• show chassis environment
• show chassis redundant-power-supply
• show redundant-power-supply status
Monitoring Process Details for J Series Devices
Purpose View the process details that indicate the status of each of the processes running on the
J Series device.
Action SelectMonitor>SystemView>Process Details in the J-Web user interface.
The Process Details page displays the following types of information for the entire device:
• CPU Load—Displays the average CPU usage of the device over the last minute in the
form of a graph.
• Total Memory Utilization—Displays the current total memory usage of the device in
the form of a graph.
The Process Details page also displays the following types of information for each process
running on the device:
• PID—Displays the unique number identifying the process.
• Value—Displays the name of the process.
• State—Displays the current state of the process (runnable, sleeping, or unknown).
• CPU Load—Displays the current CPU usage of the process.
Copyright © 2011, Juniper Networks, Inc.24
Junos OS Monitoring and Troubleshooting Guide for Security Devices

• Memory Utilization—Displays the current memory usage of the process.
• Start Time—Displays the time that the process started running.
Alternatively, you can view chassis details from the Dashboard on an SRX Series device
or by entering the following show commands in the CLI configuration editor:
• show chassis routing-engine
• show system process
RelatedDocumentation
Monitoring Overview on page 3•
• Monitoring Interfaces on page 5
• Junos OS CLI Reference
• J Series Services Routers Hardware Guide
• Junos OS Interfaces Command Reference
• Junos OS Interfaces Configuration Guide for Security Devices
• Junos OS Feature Support Reference for SRX Series and J Series Devices
Monitoring NAT
This section contains the following topics:
• Monitoring Source NAT Information on page 25
• Monitoring Destination NAT Information on page 26
• Monitoring Static NAT Information on page 28
• Monitoring Incoming Table Information on page 29
• Monitoring Interface NAT Port Information on page 30
Monitoring Source NAT Information
Purpose View the source Network Address Translation (NAT) summary table and the details of
the specified NAT source address pool information.
Action SelectMonitor>NAT>Source NAT in the J-Web user interface, or enter the following CLI
commands:
• show security nat source-nat summary
• show security nat source-nat pool pool-name
Table 11 on page 26 summarizes key output fields in the source NAT display.
25Copyright © 2011, Juniper Networks, Inc.
Chapter 1: Device and Routing Operations Monitoring

Table 11: Summary of Key Source NATOutput Fields
Additional InformationValuesField
Source NAT Summary Table
Name of the source pool.Pool Name
Starting IP address of one address range in the sourcepool.
AddressLow
Ending IP address of one address range in the sourcepool.
AddressHigh
Name of the interface on which the source pool isdefined.
Interface
Whether Port Address Translation (PAT) is enabled(Yes, or No).
PAT
Source NAT Pool Specific Summary: pool-name
IP address in the source pool.Address
Name of the interface on which the source pool isdefined.
Interface
Status of the IP address:
• Active—Denotes that the IP address is in use. Thisstatus applies only to source NAT without PortAddress Translation (PAT).
• Free—IP address is available for allocation.
Status
Number of allocated single ports.SinglePorts
Number of allocated twin ports.Twin Ports
Whether PAT is enabled (Yes or No).PAT
Monitoring Destination NAT Information
Purpose View the source Network Address Translation (NAT) summary table and the details of
the specified NAT source address pool information.
Action SelectMonitor>NAT>Source NAT in the J-Web user interface, or enter the following CLI
command:
pool-name
Table 11 on page 26 summarizes key output fields in the source NAT display.
Copyright © 2011, Juniper Networks, Inc.26
Junos OS Monitoring and Troubleshooting Guide for Security Devices

Table 12: Summary of Key Source NATOutput Fields
Additional InformationValuesField
Source NAT Rules Filter Options
Name of the rule set.Rule-SetName
Total rules available.Total Rules
Source NAT Rules Tab Options
ID of the rule.ID
Name of the rule .Name
Name of the ruleset.RulesetName
Name of the routing instance/zone/interface fromwhich the packet flows.
From
Name of the routing instance/zone/interface to whichthe packet flows .
To
Source IP address range in the source pool.SourceAddressRange
Destination IP address range in the source pool.DestinationAddressRange
Action configured for the destination NAT rules.Action
Destination port in the destination pool.DestinationPort
Number of times the router translates two componentsin the IP header of the incoming packet.
TranslationHits
Pools Filter Option
Drop-down box for selecting the pool name to bedisplayed.
Pool Name
Total pools added.Total Pools
Pools Tab Option
ID of the pool.ID
Name of the destination pool.Name
27Copyright © 2011, Juniper Networks, Inc.
Chapter 1: Device and Routing Operations Monitoring

Table 12: Summary of Key Source NATOutput Fields (continued)
Additional InformationValuesField
IP address range in the destination pool.AddressRange
Destination port number in the pool.Port
Name of the routing instance.RoutingInstance
Total IP address, IP address set, or address book entry.TotalAddresses
Number of times a translation in the translation tableis used for destination NAT.
TranslationHits
Ending IP address of one address range in the sourcepool.
AddressHigh
Top 10 Translation Hits
Displays the graph of top 10 translation hits.Graph
Monitoring Static NAT Information
Purpose View static NAT table information.
Action SelectMonitor>NAT>Static NAT in the J-Web user interface, or enter the following CLI
command:
• show security nat static-nat summary
Table 13 on page 28 summarizes key output fields in the static NAT display.
Table 13: Summary of Key Static NATOutput Fields
Additional InformationValuesField
Rule Filter Option
Filter to sort rules by name.Rule-Set Name
Number of rules configured.Total Rules
Rule Tab Option
Rule ID number.ID
Position
Name of the rule.Name
Copyright © 2011, Juniper Networks, Inc.28
Junos OS Monitoring and Troubleshooting Guide for Security Devices

Table 13: Summary of Key Static NATOutput Fields (continued)
Additional InformationValuesField
Name of the rule set.Rule set Name
Name of the routing instance/interface/zone from whichthe packet comes
From
Destination IP address and subnet mask.DestinationAddress
Host IP address and subnet mask mapped to thedestination IP address and subnet mask.
Host Address
Subnet IP address.Netmask
Name of the routing instance from which the packet comes.Host RoutingInstance
Number of times a translation in the translation table isused for a static NAT rule.
Translation Hits
Monitoring Incoming Table Information
Purpose View NAT table information.
Action SelectMonitor>NAT>Incoming Table in the J-Web user interface, or enter the following
CLI command:
show security nat incoming-table
Table 14 on page 29 summarizes key output fields in the incoming table display.
Table 14: Summary of Key Incoming Table Output Fields
Additional InformationValuesField
Statistics
Number of entries in the NAT table.In use
Maximum number of entries possible in the NAT table.Maximum
Number of entries failed for allocation.Entryallocationfailed
Incoming Table
Clear
Destination IP address and port number.Destination
29Copyright © 2011, Juniper Networks, Inc.
Chapter 1: Device and Routing Operations Monitoring

Table 14: Summary of Key Incoming Table Output Fields (continued)
Additional InformationValuesField
Host IP address and port number that the destinationIP address is mapped to.
Host
Number of sessions referencing the entry.References
Timeout, in seconds, of the entry in the NAT table.Timeout
Name of source pool where translation is allocated.Source-pool
Monitoring Interface NAT Port Information
Purpose View port usage for an interface source pool information.
Action SelectMonitor>Firewall/NAT>Interface NAT in the J-Web user interface, or enter the
following CLI command:
• show security nat interface-nat-ports
Table 15 on page 30 summarizes key output fields in the interface NAT display.
Table 15: Summary of Key Interface NATOutput Fields
Additional InformationValuesField
Interface NAT Summary Table
Port pool index.Pool Index
Total number of ports in a port pool.Total Ports
Number of ports allocated one at a time that are in use.SinglePortsAllocated
Number of ports allocated one at a time that are freefor use.
SinglePortsAvailable
Number of ports allocated two at a time that are in use.Twin PortsAllocated
Number of ports allocated two at a time that are freefor use.
Twin PortsAvailable
RelatedDocumentation
Monitoring Overview on page 3•
• Monitoring Interfaces on page 5
Copyright © 2011, Juniper Networks, Inc.30
Junos OS Monitoring and Troubleshooting Guide for Security Devices

• Junos OS CLI Reference
• J Series Services Routers Hardware Guide
• Junos OS Interfaces Command Reference
• Junos OS Interfaces Configuration Guide for Security Devices
• Junos OS Feature Support Reference for SRX Series and J Series Devices
Monitoring Security Features
This section contains the following topics:
• Monitoring Policies on page 31
• Checking Policies on page 34
• Monitoring Screen Counters on page 37
• Monitoring IDP Status on page 39
• Monitoring Flow Gate Information on page 40
• Monitoring Firewall Authentication Table on page 41
• Monitoring Firewall Authentication History on page 43
• Monitoring 802.1x on page 45
Monitoring Policies
Purpose Display, sort, and review policy activity for every activated policy configured on the device.
Policies are grouped by Zone Context (the from and to zones of the traffic) to control
the volume of data displayed at one time. From the policy list, select a policy to display
statistics and current network activity.
Action To review policy activity:
1. SelectMonitor>Security>Policy>Activities in the J-Web user interface. The Security
Policies Monitoring page appears and lists the policies from the first Zone Context.
See Table 16 on page 32 for field descriptions.
2. Select theZoneContext of the policy you want to monitor, and click Filter. All policies
within the zone context appear in match sequence.
3. Select a policy, and click one of the following functions:
• Clear Statistics—Clears all counters to zero for the selected policy.
• Deactivate—Deactivates the selected policy. When you click Deactivate, the commit
window appears for you to confirm the deactivation.
• Move—Repositions the selected policy in the match sequence. You have the option
to move the policy up or down one row at a time, or to the top or bottom of the
sequence.
31Copyright © 2011, Juniper Networks, Inc.
Chapter 1: Device and Routing Operations Monitoring

Table 16: Security Policies Monitoring Output Fields
Additional InformationValueField
To display policies for a different context, select azone context and clickFilter. Both inactive and activepolicies appear for each context. However, the Total# field for a context specifies the number of activepolicies only.
Displays a list of all from and to zone combinationsfor the configured policies. The total number ofactive policies for each context is specified in theTotal # field. By default, the policies from the firstZone Context are displayed.
Zone Context(Total #)
–Specifies the action to take for traffic that does notmatch any of the policies in the context:
• permit-all—Permit all traffic that does not matcha policy.
• deny-all—Deny all traffic that does not match apolicy.
Default Policyaction
–Displays the source zone to be used as matchcriteria for the policy.
From Zone
–Displays the destination zone to be used as matchcriteria for the policy.
To Zone
–Displays the name of the policy.Name
–Displays the source addresses to be used as matchcriteria for the policy. Address sets are resolved totheir individual names. (In this case, only the namesare given, not the IP addresses).
Source Address
–Displays the destination addresses (or addresssets) to be used as match criteria for the policy.Addresses are entered as specified in thedestination zone’s address book.
DestinationAddress
–Displays the name of a predefined or customapplication signature to be used as match criteriafor the policy.
Application
The rule set appears in two lines. The first linedisplays the configured dynamic applicationsignatures in the rule set. The second line displaysthe default dynamic application signature.
If more than two dynamic application signatures arespecified for the rule set, hover over the output fieldto display the full list in a tooltip.
Displays the dynamic application signatures to beused as match criteria if an application firewall ruleset is configured for the policy.
For a network firewall, a dynamic application is notdefined.
Dynamic App
Copyright © 2011, Juniper Networks, Inc.32
Junos OS Monitoring and Troubleshooting Guide for Security Devices

Table 16: Security Policies Monitoring Output Fields (continued)
Additional InformationValueField
The action portion of the rule set appears in twolines. The first line identifies the action to be takenwhen the traffic matches a dynamic applicationsignature. The second line displays the default actionwhen traffic does not match a dynamic applicationsignature.
Displays the action portion of the rule set if anapplication firewall rule set is configured for thepolicy.
• permit—Permits access to the network servicescontrolled by the policy. A green backgroundsignifies permission.
• deny—Denies access to the network servicescontrolled by the policy. A red backgroundsignifies denial.
Action
–Displays the network services permitted or deniedby the policy if an application firewall rule set isconfigured. Network services include:
• gprs-gtp-profile—Specify a GPRS TunnelingProtocol profile name.
• idp—Perform intrusion detection and prevention.
• redirect-wx—Set WX redirection.
• reverse-redirect-wx—Set WX reverse redirection.
• uac-policy—Enable unified access controlenforcement of the policy.
NW Services
–Specifies whether counters for computing session,packet, and byte statistics for the policy areenabled. By default, counters are not enabled.
Count
–Specifies whether session logging is enabled. Bydefault, session logging is not enabled. Sessionactivity to log can include the following:
• Session initialization
• Session close
• Both
Log
To toggle a graph on and off, click the counter namebelow the graph.
Provides a representation of the value over time fora specified counter. The graph is blank if PolicyCounters indicates no data. As a selected counteraccumulates data, the graph is updated at eachrefresh interval.
Policy Hit CountersGraph
33Copyright © 2011, Juniper Networks, Inc.
Chapter 1: Device and Routing Operations Monitoring
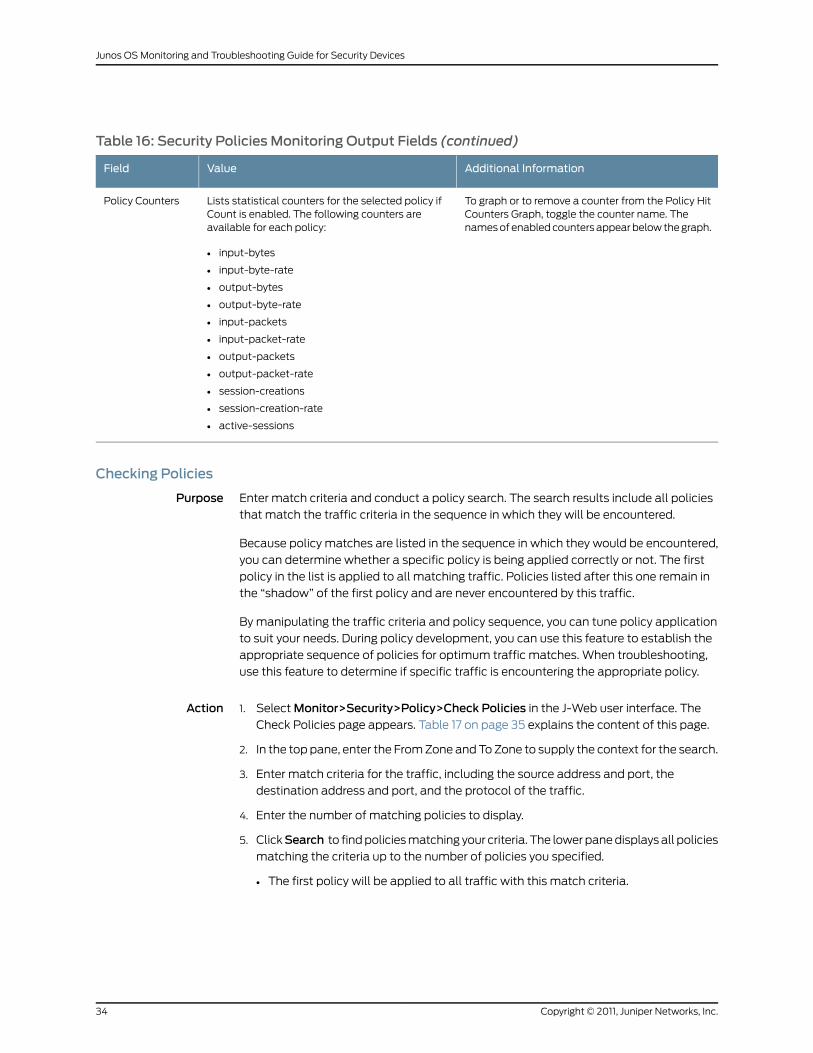
Table 16: Security Policies Monitoring Output Fields (continued)
Additional InformationValueField
To graph or to remove a counter from the Policy HitCounters Graph, toggle the counter name. Thenames of enabled counters appear below the graph.
Lists statistical counters for the selected policy ifCount is enabled. The following counters areavailable for each policy:
• input-bytes
• input-byte-rate
• output-bytes
• output-byte-rate
• input-packets
• input-packet-rate
• output-packets
• output-packet-rate
• session-creations
• session-creation-rate
• active-sessions
Policy Counters
Checking Policies
Purpose Enter match criteria and conduct a policy search. The search results include all policies
that match the traffic criteria in the sequence in which they will be encountered.
Because policy matches are listed in the sequence in which they would be encountered,
you can determine whether a specific policy is being applied correctly or not. The first
policy in the list is applied to all matching traffic. Policies listed after this one remain in
the “shadow” of the first policy and are never encountered by this traffic.
By manipulating the traffic criteria and policy sequence, you can tune policy application
to suit your needs. During policy development, you can use this feature to establish the
appropriate sequence of policies for optimum traffic matches. When troubleshooting,
use this feature to determine if specific traffic is encountering the appropriate policy.
Action 1. SelectMonitor>Security>Policy>Check Policies in the J-Web user interface. The
Check Policies page appears. Table 17 on page 35 explains the content of this page.
2. In the top pane, enter the From Zone and To Zone to supply the context for the search.
3. Enter match criteria for the traffic, including the source address and port, the
destination address and port, and the protocol of the traffic.
4. Enter the number of matching policies to display.
5. ClickSearch to find policies matching your criteria. The lower pane displays all policies
matching the criteria up to the number of policies you specified.
• The first policy will be applied to all traffic with this match criteria.
Copyright © 2011, Juniper Networks, Inc.34
Junos OS Monitoring and Troubleshooting Guide for Security Devices

• Remaining policies will not be encountered by any traffic with this match criteria.
6. To manipulate the position and activation of a policy, select the policy and click the
appropriate button:
• Delete—Deletes the selected policy. The policy is removed from the policy
configuration.
• Deactivate—Deactivates the selected policy. A deactivated policy remains in the
policy configuration, but it is no longer included in policy matching until it is
reactivated.
• Move—Moves the selected policy up or down to position it at a more appropriate
point in the search sequence.
Table 17: Check Policies Output
FunctionField
Check Policies Search Input Pane
Name or ID of the source zone. If a From Zone is specified by name, the name istranslated to its ID internally.
From Zone
Name or ID of the destination zone. If a To Zone is specified by name, the name istranslated to its ID internally.
To Zone
Address of the source in IP notation.Source Address
Port number of the source.Source Port
Address of the destination in IP notation.Destination Address
Port number of the destination.Destination Port
35Copyright © 2011, Juniper Networks, Inc.
Chapter 1: Device and Routing Operations Monitoring

Table 17: Check Policies Output (continued)
FunctionField
Name or equivalent value of the protocol to be matched.
ah—51
egp—8
esp—50
gre—47
icmp—1
igmp—2
igp—9
ipip—94
ipv6—41
ospf—89
pgm—113
pim—103
rdp—27
rsvp—46
sctp—132
tcp—6
udp—17
vrrp—112
Protocol
(Optional) Number of policies to display. Default value is 1. Maximum value is 16.Result Count
Check Policies List
Name of the source zone.From Zone
Name of the destination zone.To Zone
Number of policies retrieved.Total Policies
The action to be taken if no match occurs.Default Policy action
Policy nameName
Name of the source address (not the IP address) of a policy. Address sets are resolvedto their individual names.
Source Address
Copyright © 2011, Juniper Networks, Inc.36
Junos OS Monitoring and Troubleshooting Guide for Security Devices
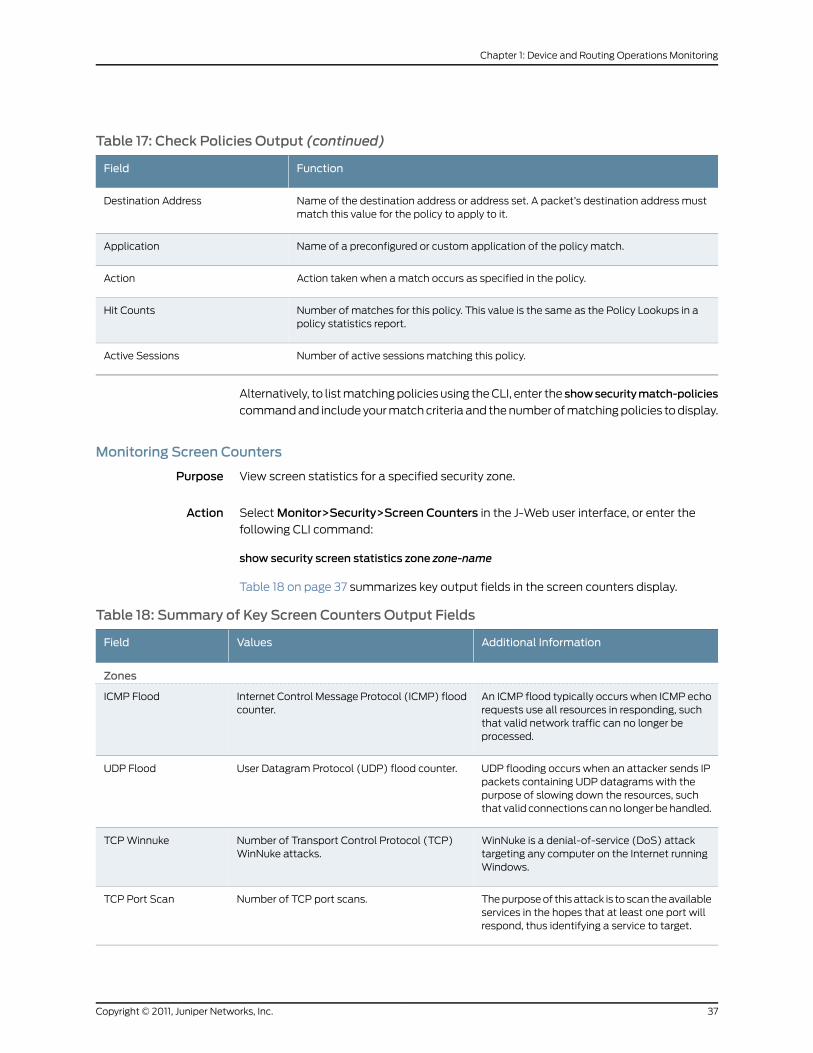
Table 17: Check Policies Output (continued)
FunctionField
Name of the destination address or address set. A packet’s destination address mustmatch this value for the policy to apply to it.
Destination Address
Name of a preconfigured or custom application of the policy match.Application
Action taken when a match occurs as specified in the policy.Action
Number of matches for this policy. This value is the same as the Policy Lookups in apolicy statistics report.
Hit Counts
Number of active sessions matching this policy.Active Sessions
Alternatively, to list matching policies using the CLI, enter the showsecuritymatch-policies
command and include your match criteria and the number of matching policies to display.
Monitoring Screen Counters
Purpose View screen statistics for a specified security zone.
Action SelectMonitor>Security>Screen Counters in the J-Web user interface, or enter the
following CLI command:
show security screen statistics zone zone-name
Table 18 on page 37 summarizes key output fields in the screen counters display.
Table 18: Summary of Key Screen Counters Output Fields
Additional InformationValuesField
Zones
An ICMP flood typically occurs when ICMP echorequests use all resources in responding, suchthat valid network traffic can no longer beprocessed.
Internet Control Message Protocol (ICMP) floodcounter.
ICMP Flood
UDP flooding occurs when an attacker sends IPpackets containing UDP datagrams with thepurpose of slowing down the resources, suchthat valid connections can no longer be handled.
User Datagram Protocol (UDP) flood counter.UDP Flood
WinNuke is a denial-of-service (DoS) attacktargeting any computer on the Internet runningWindows.
Number of Transport Control Protocol (TCP)WinNuke attacks.
TCP Winnuke
The purpose of this attack is to scan the availableservices in the hopes that at least one port willrespond, thus identifying a service to target.
Number of TCP port scans.TCP Port Scan
37Copyright © 2011, Juniper Networks, Inc.
Chapter 1: Device and Routing Operations Monitoring

Table 18: Summary of Key Screen Counters Output Fields (continued)
Additional InformationValuesField
An IP address sweep can occur with the intentof triggering responses from active hosts.
Number of ICMP address sweeps.ICMP Address Sweep
Teardrop attacks exploit the reassembly offragmented IP packets.
Number of teardrop attacks.IP Tear Drop
Number of TCP SYN attacks.TCP SYN Attack
IP spoofing occurs when an invalid sourceaddress is inserted in the packet header to makethe packet appear to come from a trustedsource.
Number of IP spoofs.IP Spoofing
Ping of death occurs when IP packets are sentthat exceed the maximum legal length (65,535bytes).
ICMP ping of death counter.ICMP Ping of Death
Number of IP source route attacks.IP Source Route
Land attacks occur when attacker sends spoofedSYN packets containing the IP address of thevictim as both the destination and source IPaddress.
Number of land attacks.TCP Land Attack
Number of TCP SYN fragments.TCP SYN Fragment
A normal TCP segment header has at least onecontrol flag set.
Number of TCP headers without flags set.TCP No Flag
Number of unknown Internet protocols.IP Unknown Protocol
Number of invalid options.IP Bad Options
This option records the IP addresses of thenetwork devices along the path that the IPpacket travels.
Number of packets with the IP record routeoption enabled.
IP Record Route Option
This option records the time (in Universal Time)when each network device receives the packetduring its trip from the point of origin to itsdestination.
Number of IP timestamp option attacks.IP Timestamp Option
Number of IP security option attacks.IP Security Option
This option specifies a partial route list for apacket to take on its journey from source todestination.
Number of IP loose route option attacks.IP Loose route Option
Copyright © 2011, Juniper Networks, Inc.38
Junos OS Monitoring and Troubleshooting Guide for Security Devices
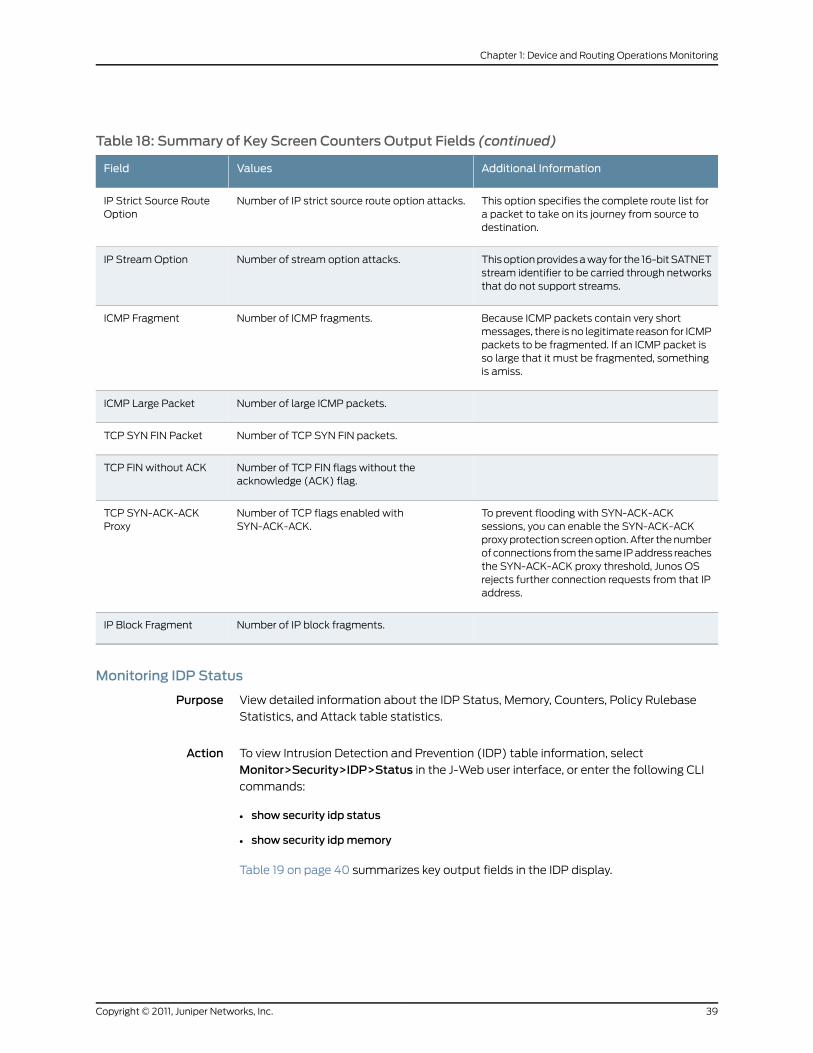
Table 18: Summary of Key Screen Counters Output Fields (continued)
Additional InformationValuesField
This option specifies the complete route list fora packet to take on its journey from source todestination.
Number of IP strict source route option attacks.IP Strict Source RouteOption
This option provides a way for the 16-bit SATNETstream identifier to be carried through networksthat do not support streams.
Number of stream option attacks.IP Stream Option
Because ICMP packets contain very shortmessages, there is no legitimate reason for ICMPpackets to be fragmented. If an ICMP packet isso large that it must be fragmented, somethingis amiss.
Number of ICMP fragments.ICMP Fragment
Number of large ICMP packets.ICMP Large Packet
Number of TCP SYN FIN packets.TCP SYN FIN Packet
Number of TCP FIN flags without theacknowledge (ACK) flag.
TCP FIN without ACK
To prevent flooding with SYN-ACK-ACKsessions, you can enable the SYN-ACK-ACKproxy protection screen option. After the numberof connections from the same IP address reachesthe SYN-ACK-ACK proxy threshold, Junos OSrejects further connection requests from that IPaddress.
Number of TCP flags enabled withSYN-ACK-ACK.
TCP SYN-ACK-ACKProxy
Number of IP block fragments.IP Block Fragment
Monitoring IDP Status
Purpose View detailed information about the IDP Status, Memory, Counters, Policy Rulebase
Statistics, and Attack table statistics.
Action To view Intrusion Detection and Prevention (IDP) table information, select
Monitor>Security>IDP>Status in the J-Web user interface, or enter the following CLI
commands:
• show security idp status
• show security idpmemory
Table 19 on page 40 summarizes key output fields in the IDP display.
39Copyright © 2011, Juniper Networks, Inc.
Chapter 1: Device and Routing Operations Monitoring

Table 19: Summary of IDP Status Output Fields
Additional InformationValuesField
IDP Status
Displays the status of the current IDP policy.Status of IDP
Displays the time from when the IDP policy firstbegan running on the system.
Up Since
Displays the number of packets received andreturned per second.
Packets/Second
Displays the maximum number of packetsreceived per second and the time when themaximum was reached.
Peak
Displays the aggregated throughput (kilobits persecond) for the system.
Kbits/Second
Displays the maximum kilobits per second andthe time when the maximum was reached.
Peak Kbits
Displays the delay, in microseconds, for a packetto receive and return by a node .
Latency (Microseconds)
Displays the name of the current installed IDPpolicy.
Current Policy
IDPMemory Status
Displays the status of all IDP data plane memory.IDP Memory Statistics
Displays the name of the PIC.PIC Name
Displays the total memory space, in megabytes,allocated for the IDP data plane.
Total IDP Data PlaneMemory (MB)
Displays the used memory space, in megabytes,for the data plane.
Used (MB)
Displays the available memory space, inmegabytes, for the data plane.
Available (MB)
Monitoring FlowGate Information
Purpose View information about temporary openings known as pinholes or gates in the security
firewall.
Action SelectMonitor>Security>FlowGate Information in the J-Web user interface, or enter
the show security flow gate command.
Copyright © 2011, Juniper Networks, Inc.40
Junos OS Monitoring and Troubleshooting Guide for Security Devices

Table 20 on page 41 summarizes key output fields in the flow gate display.
Table 20: Summary of Key FlowGate Output Fields
Additional InformationValuesField
FlowGate Information
Range of flows permitted by the pinhole.Hole
Tuples used to create the session if it matches thepinhole:
• Source address and port
• Destination address and port
Translated
Application protocol, such as UDP or TCP.Protocol
Name of the application.Application
Idle timeout for the pinhole.Age
Internal debug flags for pinhole.Flags
Incoming zone.Zone
Number of resource manager references to the pinhole.Referencecount
Resource manager information about the pinhole.Resource
Monitoring Firewall Authentication Table
Purpose View information about the authentication table, which divides firewall authentication
user information into multiple parts.
Action SelectMonitor>Security>Firewall Authentication>Authentication Table in the J-Web
user interface. To view detailed information about the user with a particular identifier,
select the ID on the Authentication Table page. To view detailed information about the
user at a particular source IP address, select the Source IP on the Authentication Table
page.
Alternatively, enter the following CLI show commands:
• show security firewall-authentication users
• show security firewall-authentication users address ip-address
• show security firewall-authentication users identifier identifier
Table 21 on page 42 summarizes key output fields in firewall authentication table display.
41Copyright © 2011, Juniper Networks, Inc.
Chapter 1: Device and Routing Operations Monitoring

Table 21: Summary of Key Firewall Authentication Table Output Fields
Additional InformationValuesField
Firewall authentication users
Number of users in the authentication table.Total users in table
Authentication table
Authentication identification number.ID
IP address of the authentication source.Source Ip
Idle timeout for the user.Age
Status of authentication (success or failure).Status
Name of the user.user
Detailed report per ID selected: ID
Name of the source zone.Source Zone
Name of the destination zone.Destination Zone
Users information.Name of the profile.profile
Path chosen for authentication.Authentication method
Policy Identifier.Policy Id
Name of the interface.Interface name
Number of packets in bytes sent by this user.Bytes sent by this user
Number of packets in bytes received by this user.Bytes received by thisuser
Name of the client group.Client-groups
Detailed report per Source Ip selected
IP address of the authentication source.Entries from Source IP
Name of the source zone.Source Zone
Name of the destination zone.Destination Zone
Name of the profile.profile
Idle timeout for the user.Age
Status of authentication (success or failure).Status
Copyright © 2011, Juniper Networks, Inc.42
Junos OS Monitoring and Troubleshooting Guide for Security Devices

Table 21: Summary of Key Firewall Authentication Table Output Fields (continued)
Additional InformationValuesField
Name of the user.user
Path chosen for authentication.Authentication method
Policy Identifier.Policy Id
Name of the interface.Interface name
Number of packets in bytes sent by this user.Bytes sent by this user
Number of packets in bytes received by this user.Bytes received by thisuser
Name of the client group.Client-groups
Monitoring Firewall Authentication History
Purpose View information about the authentication history, which is divided into multiple parts.
Action SelectMonitor>Security>FirewallAuthentication>AuthenticationHistory in the J-Web
user interface. To view the detailed history of the authentication with this identifier, select
the ID on the Firewall Authentication History page. To view a detailed authentication
history of this source IP address, select the Source IP on the Firewall Authentication
History page.
Alternatively, enter the following CLI show commands:
• show security firewall-authentication history
• show security firewall-authentication history address ip-address
• show security firewall-authentication history identifier identifier
Table 22 on page 43 summarizes key output fields in firewall authentication history
display.
Table 22: Summary of Key Firewall Authentication History Output Fields
Additional InformationValuesField
History of Firewall Authentication Data
Number of authentication.Total authentications
History Table
Identification number.ID
IP address of the authentication source.Source Ip
43Copyright © 2011, Juniper Networks, Inc.
Chapter 1: Device and Routing Operations Monitoring

Table 22: Summary of Key Firewall Authentication History Output Fields (continued)
Additional InformationValuesField
Authentication date.Start Date
Authentication time.Start Time
Authentication duration.Duration
Status of authentication (success or failure).Status
Name of the user.User
Detail history of selected Id: ID
Path chosen for authentication.Authentication method
Security policy identifier.Policy Id
Name of the source zone.Source zone
Name of the destination zone.Destination Zone
Name of the interface.Interface name
Number of packets in bytes sent by this user.Bytes sent by this user
Number of packets in bytes received by this user.Bytes received by thisuser
Name of the client group.Client-groups
Detail history of selected Source Ip:Source Ip
Name of the user.User
Authentication date.Start Date
Authentication time.Start Time
Authentication duration.Duration
Status of authentication (success or failure).Status
Name of the profile.Profile
Path chosen for authentication.Authentication method
Security policy identifier.Policy Id
Name of the source zone.Source zone
Copyright © 2011, Juniper Networks, Inc.44
Junos OS Monitoring and Troubleshooting Guide for Security Devices

Table 22: Summary of Key Firewall Authentication History Output Fields (continued)
Additional InformationValuesField
Name of the destination zone.Destination Zone
Name of the interface.Interface name
Number of packets in bytes sent by this user.Bytes sent by this user
Number of packets in bytes received by this user.Bytes received by thisuser
Name of the client group.Client-groups
Monitoring 802.1x
Purpose View information about 802.1X properties.
Action SelectMonitor>Security>802.1x in the J-Web user interface, or enter the following CLI
commands:
• show dot1x interfaces interface-name
• show dot1x authentication-failed-users
Table 23 on page 45 summarizes the Dot1X output fields.
Table 23: Summary of Dot1X Output Fields
Additional InformationValuesField
List of ports for selection.Select Port
Total number of hosts connected to the port.Number of connectedhosts
Total number of authentication-bypassed hostswith respect to the port.
Number ofauthenticationbypassed hosts
Authenticated Users Summary
MAC address of the connected host.MAC Address
Name of the user.User Name
Information about the host connection status.Status
Information about host authentication.Authentication Due
Authentication Failed Users Summary
45Copyright © 2011, Juniper Networks, Inc.
Chapter 1: Device and Routing Operations Monitoring

Table 23: Summary of Dot1X Output Fields (continued)
Additional InformationValuesField
MAC address of the authentication-failed host.MAC Address
Name of the authentication-failed user.User Name
RelatedDocumentation
Monitoring Overview on page 3•
• Monitoring Interfaces on page 5
• Junos OS CLI Reference
• J Series Services Routers Hardware Guide
• Junos OS Interfaces Command Reference
• Junos OS Interfaces Configuration Guide for Security Devices
• Junos OS Feature Support Reference for SRX Series and J Series Devices
Monitoring Voice ALGs
• Monitoring Voice ALG Summary on page 46
• Monitoring Voice ALG H.323 on page 47
• Monitoring Voice ALG MGCP on page 49
• Monitoring Voice ALG SCCP on page 52
• Monitoring Voice ALG SIP on page 55
Monitoring Voice ALG Summary
Purpose Use the monitoring functionality to view the voice ALG summary page.
Action To monitor voice ALG summary, selectMonitor>Security>Voice ALGs>Summary.
Meaning Table 24 on page 46 summarizes key output fields in the voice ALG summary page.
Table 24: Voice ALG SummaryMonitoring Page
Additional InformationValueField
Select one of the virtual chassismembesr listed.
Display the list of virtual chassis member.Virtual Chassis Member
Select the time interval from thedrop-down list.
Displays the time interval set for pagerefresh.
Refresh Interval (30 sec)
–Displays the option to refresh the page.Refresh
Copyright © 2011, Juniper Networks, Inc.46
Junos OS Monitoring and Troubleshooting Guide for Security Devices

Table 24: Voice ALG SummaryMonitoring Page (continued)
Additional InformationValueField
Click Clear to clear the monitorsummary.
Provides an option to clear the monitorsummary.
Clear
–Displays the protocols configured.Protocol Name
–Displays the total number of calls.Total Calls
–Displays the number of active calls.Number of Active Calls
–Displays the number of packets received.Number of Received Packets
–Displays the number of errors.Number of Errors
–Displays the H.323 calls chart.H.323 Calls Chart
–Displays the MGCP calls chart.MGCP Calls Chart
–Displays the SCCP calls chart.SCCP Calls Chart
–Displays the SIP calls chart.SIP Calls Chart
RelatedDocumentation
Monitoring Voice ALG H.323 on page 47•
• Monitoring Voice ALG MGCP on page 49
• Monitoring Voice ALG SCCP on page 52
• Monitoring Voice ALG SIP on page 55
Monitoring Voice ALGH.323
Purpose Use the monitoring functionality to view the ALG H.323 page.
Action To monitor ALG H.323 selectMonitor>Security>Voice ALGs>H.323.
Meaning Table 25 on page 47 summarizes key output fields in the ALG H.323 page.
Table 25: ALG H.323Monitoring Page
Additional InformationValueField
Select one of the virtual chassismembers listed.
Display the list of virtual chassis member.Virtual Chassis Member
Select the time interval from thedrop-down list.
Displays the time interval set for page refresh.Refresh Interval (30 sec)
47Copyright © 2011, Juniper Networks, Inc.
Chapter 1: Device and Routing Operations Monitoring

Table 25: ALG H.323Monitoring Page (continued)
Additional InformationValueField
–Displays the option to refresh the page.Refresh
Click clear to clear the monitorsummary.
Provides an option to clear the monitor summary.Clear
H.323 Counter Summary
–Displays the following categories:
• Packets received—Number of ALG H.323 packetsreceived.
• Packets dropped—Number of ALG H.323 packetsdropped.
• RASmessage received Number of incoming RAS(Registration, Admission, and Status) messages persecond per gatekeeper received and processed.
• Q.931message received—Counter for Q.931 messagereceived.
• H.245message received— Counter for H.245 messagereceived.
• Number of calls—Total number of ALG H.323 calls.
• Number of active calls—Number of active ALG H.323calls.
• NumberofDSCPMarked—Number of DSCP Marked onALG H.323 calls.
Category
–Provides count of response codes for each H.323 countersummary category.
Count
H.323 Error Counter
–Displays the following categories:
• Decoding errors—Number of decoding errors.
• Message flood dropped—Error counter for messageflood dropped.
• NAT errors—H.323 ALG NAT errors.
• Resourcemanagererrors—H.323 ALG resource managererrors.
• DSCPMarked errors—H.323 ALG DSCP marked errors.
Category
–Provides count of response codes for each H.323 errorcounter category.
Count
Counter Summary Chart
–Provides the graphical representation of the packetsreceived.
Packets Received
H.323Message Counter
Copyright © 2011, Juniper Networks, Inc.48
Junos OS Monitoring and Troubleshooting Guide for Security Devices

Table 25: ALG H.323Monitoring Page (continued)
Additional InformationValueField
–Displays the following categories:
• RRQ—Registration Request message counter.
• RCF—Registration Confirmation Message.
• ARQ—Admission Request message counter.
• ACF—Admission Confirmation
• URQ—Unregistration Request.
• UCF—Unregistration Confirmation.
• DRQ—Disengage Request.
• DCF—Disengage Confirmation.
• OthRAS—Other incoming Registration, Admission, andStatus messages message counter.
• Setup—Timeout value, in seconds, for the response ofthe outgoing setup message.
• Alert—Alert message type.
• Connect—Connect setup process.
• CallProd—Number of call production messages sent.
• Info—Number of info requests sent.
• RelCmpl—Number of Rel Cmpl message ssent.
• Facility—Number of facility messages sent.
• Empty—Empty capabilities to the support messagecounter.
• OLC—Open Local Channel message counter.
• OLCACK—Open Local Channel Acknowledge messagecounter.
• Oth H245—Other H.245 message counter
Category
–Provides count of response codes for each H.323 messagecounter category.
Count
RelatedDocumentation
Monitoring Voice ALG Summary on page 46•
• Monitoring Voice ALG MGCP on page 49
• Monitoring Voice ALG SCCP on page 52
• Monitoring Voice ALG SIP on page 55
Monitoring Voice ALGMGCP
Purpose Use the monitoring functionality to view the voice ALG MGCP page.
Action To monitor ALG MGCP, selectMonitor>Security>Voice ALGs>MGCP.
Meaning Table 26 on page 50 summarizes key output fields in the voice ALG MGCP page.
49Copyright © 2011, Juniper Networks, Inc.
Chapter 1: Device and Routing Operations Monitoring

Table 26: Voice ALGMGCPMonitoring Page
Additional InformationValueField
Select one of the virtual chassis memberslisted.
Displays the list of virtual chassis member.Virtual Chassis Member
Select the time interval from thedrop-down list.
Displays the time interval set for pagerefresh.
Refresh Interval (30 sec)
–Displays the option to refresh the page.Refresh
ClickClear to clear the monitor summary.Provides an option to clear the monitorsummary.
Clear
Counters
MGCP Counters Summary
–Displays the following categories:
• PacketsReceived—Number of ALG MGCPpackets received.
• PacketsDropped— Number of ALG MGCPpackets dropped.
• Message received— Number of ALGMGCP messages received.
• Numberofconnections— Number of ALGMGCP connections.
• Numberofactiveconnections— Numberof active ALG MGCP connections.
• Number of calls— Number of ALG MGCPcalls.
• Numberofactivecalls— Number of activeALG MGCP calls.
• Numberofactive transactions— Numberof active transactions.
• Number of transactions— Number oftransactions.
• Number of re-transmission—Number ofALG MGCP retransmissions.
• Numberofactiveendpoints— Number ofMGCP active enpoints.
• Number of DSCPmarked— Number ofMGCP DSCPs marked.
Category
–Provides the count of response codes foreach MGCP counter summary category.
Count
MGCP Error Counter
Copyright © 2011, Juniper Networks, Inc.50
Junos OS Monitoring and Troubleshooting Guide for Security Devices

Table 26: Voice ALGMGCPMonitoring Page (continued)
Additional InformationValueField
–Displays the following categories:
• Unknown-method— MGCP ALG unknownmethod errors.
• Decoding error— MGCP ALG decodingerrors.
• Transaction error— MGCP ALGtransaction errors.
• Call error— MGCP ALG call ounter errors.
• Connectionerror— MGCP ALG connectionerrors.
• Connection flood drop— MGCP ALGconnection flood drop errors.
• Message flood drop— MGCP ALGmessage flood drop error.
• IP resolve error— MGCP ALG IP addressresolution errors.
• NAT error— MGCP ALG NAT errors.
• Resourcemanager error— MGCP ALGresource manager errors.
• DSCPMarked error— MGCP ALG DSCPmarked errors.
Category
–Provides the count of response codes foreach summary error counter category.
Count
–Displays the Counter Summary Chart.Counter Summary Chart
MGCPPacket Counters
–Displays the following categories:
• CRCX— Create Connection
• MDCX— Modify Connection
• DLCX— Delete Connection
• AUEP— Audit Endpoint
• AUCX— Audit Connection
• NTFY— Notify MGCP
• RSIP— Restart in Progress
• EPCF— Endpoint Configuration
• RQNT— Request for Notification
• 000-199—Respond code is 0-199
• 200-299—Respond code is 200-299
• 300-399—Respond code is 300-399
Category
–Provides count of response codes for eachMGCP packet counter category.
Count
Calls
51Copyright © 2011, Juniper Networks, Inc.
Chapter 1: Device and Routing Operations Monitoring

Table 26: Voice ALGMGCPMonitoring Page (continued)
Additional InformationValueField
–Displays the endpoint name.Endpoint@GW
–Displays the following options:
• trust—Trust zone.
• untrust—Untrust zone.
Zone
–Displays the endpoint IP address.Endpoint IP
–Displays the call identifier for ALG MGCP.Call ID
–Displays the resource manager group ID.RM Group
–Displays the duration for which connectionis active.
Call Duration
RelatedDocumentation
Monitoring Voice ALG Summary on page 46•
• Monitoring Voice ALG H.323 on page 47
• Monitoring Voice ALG SCCP on page 52
• Monitoring Voice ALG SIP on page 55
Monitoring Voice ALG SCCP
Purpose Use the monitoring functionality to view the voice ALG SCCP page.
Action To monitor voice ALG SCCP, selectMonitor>Security>Voice ALGs>SCCP.
Meaning Table 27 on page 52 summarizes key output fields in the voice ALG SCCP page.
Table 27: Voice ALG SCCPMonitoring Page
Additional InformationValueField
Select one of the virtual chassismembers listed.
Displays the list of virtual chassis member.Virtual Chassis Member
Select the time interval from thedrop-down list.
Displays the time interval set for page refresh.Refresh Interval (30 sec)
–Displays the option to refresh the page.Refresh
Click Clear to clear the monitorsummary.
Provides an option to clear the monitor summary.Clear
SCCP Call Statistics
Copyright © 2011, Juniper Networks, Inc.52
Junos OS Monitoring and Troubleshooting Guide for Security Devices

Table 27: Voice ALG SCCPMonitoring Page (continued)
Additional InformationValueField
–Displays the following categories:
• Activeclientsessions— Number of active SCCP ALGclient sessions.
• Active calls— Number of active SCCP ALG calls.
• Total calls— Total number of SCCP ALG calls.
• Packets received— Number of SCCP ALG packetsreceived.
• PDUs processed— Number of SCCP ALG protocoldata units (PDUs) processed.
• Current call rate— Number of calls per second.
• DSCPsMarked— Number of DSCP marked.
Category
–Provides count of response codes for each SCCP callstatistics category.
Count
–Displays the Call Statistics chart.Call Statistics Chart
SCCP Error Counters
53Copyright © 2011, Juniper Networks, Inc.
Chapter 1: Device and Routing Operations Monitoring

Table 27: Voice ALG SCCPMonitoring Page (continued)
Additional InformationValueField
–Displays the following categories:
• Packets dropped— Number of packets dropped bythe SCCP ALG.
• Decode errors— Number of SCCP ALG decodingerrors.
• Protocol errors— Number of protocol errors.
• Address translation errors— Number of NAT errorsencountered by SCCP ALG.
• Policy lookup errors— Number of packets droppedbecause of a failed policy lookup.
• Unknown PDUs— Number of unknown PDUs.
• Maximum calls exceed— Number of times themaximum SCCP calls limit was exceeded.
• Maximum call rate exceed— Number of times themaximum SCCP call rate was exceeded.
• Initializationerrors— Number of initialization errors.
• Internal errors— Number of internal errors.
• Nonspecific errors— Number of nonspecific errors.
• Noactive calls to bedeleted— Number of no activecalls to be deleted.
• No active client sessions to be deleted— Numberof no active client sessions to be deleted.
• Session cookie created error— Number of Sessioncookie created error.
Invalid NAT cookies deleted— Number of invalidNAT cookie deleted.
NAT cookies not found— Number of NAT cookienot found.
• DSCPMarked Error— Number of DSCP markederrors.
Category
–Provides count of response codes for each SCCP errorcounter category.
Count
Calls
–Displays the IP address of the client.Client IP
–Displays the client zone identifier.Zone
–Displays the IP address of the call manager.Call Manager
–Displays the conference call identifier.Conference ID
–Displays the resource manager group identifier.RM Group
Copyright © 2011, Juniper Networks, Inc.54
Junos OS Monitoring and Troubleshooting Guide for Security Devices

RelatedDocumentation
Monitoring Voice ALG Summary on page 46•
• Monitoring Voice ALG H.323 on page 47
• Monitoring Voice ALG MGCP on page 49
• Monitoring Voice ALG SIP on page 55
Monitoring Voice ALG SIP
Purpose Use the monitoring functionality to view the voice ALG SIP page.
Action To monitor voice ALG SIP selectMonitor>Security>Voice ALGs>SIP.
Meaning Table 28 on page 55 summarizes key output fields in the voice ALG SIP page.
Table 28: Voice ALG SIPMonitoring Page
Additional InformationValueField
Select one of the virtualchassis members listed.
Displays the list of virtual chassis member.Virtual Chassis Member
Select the time intervalfrom the drop-down list.
Displays the time interval set for page refresh.Refresh Interval (30 sec)
–Displays the option to refresh the page.Refresh
Click Clear to clear themonitor summary.
Provides an option to clear the monitor summary.Clear
Counters
SIP Counters Information
55Copyright © 2011, Juniper Networks, Inc.
Chapter 1: Device and Routing Operations Monitoring

Table 28: Voice ALG SIPMonitoring Page (continued)
Additional InformationValueField
–Method
Copyright © 2011, Juniper Networks, Inc.56
Junos OS Monitoring and Troubleshooting Guide for Security Devices

Table 28: Voice ALG SIPMonitoring Page (continued)
Additional InformationValueField
Displays the SIP counter information. The available options are:
• BYE— Number of BYE requests sent. A user sends a BYE requestto abandon a session. A BYE request from either userautomatically terminates the session.
• REGISTER— Number of REGISTER requests sent. A user sendsa REGISTER request to a SIP registrar server to inform it of thecurrent location of the user. The SIP registrar server records allthe information it receives in REGISTER requests and makesthis information available to any SIP server attempting to locatea user.
• OPTIONS— Number of OPTIONS requests sent. An OPTIONmessage is used by the User Agent (UA) to obtain informationabout the capabilities of the SIP proxy. A server responds withinformation about what methods, session description protocols,and message encoding it supports.
• INFO— Number of INFO requests sent. An INFO message is usedto communicate mid-session signaling information along thesignaling path for the call.
• MESSAGE— Number of MESSAGE requests sent. SIP messagesconsist of requests from a client to the server and responses tothe requests from the server to a client for the purpose ofestablishing a session (or a call).
• NOTIFY— Number of NOTIFY requests sent. A NOTIFY messageis sent to inform subscribers about the change in state of thesubscription.
• PRACK— Number of PRACK requests sent. The PRACK requestplays the same role as the ACK request, but for provisionalresponses.
• PUBLISH— Number of PUBLISH requests sent. The PUBLISHrequest is used for publishing the event state. PUBLISH is similarto REGISTER that allows a user to create, modify, and removestate in another entity which manages this state on behalf ofthe user.
• REFER— Number of REFER requests sent. A REFER request isused to refer the recipient (identified by the Request-URI) to athird party identified by the contact information provided in therequest.
• SUBSCRIBE— Number of SUBSCRIBE requests sent. ASUBSCRIBE request is used to request current state and stateinformation updates from a remote node.
• UPDATE— Number of UPDATE requests sent. An UPDATErequest is used to create a temporary opening in the firewall(pinhole) for new or updated Session Description Protocol(SDP) information. The following header fields are modified:Via, From, To, Call-ID, Contact, Route, and Record-Route.
• BENOTIFY— Number of BENOTIFY requests sent. A BENOTIFYrequest is used to reduce the unnecessary SIP signaling trafficon application servers. Applications that do not need a responsefor a NOTIFY request can enhance performance by enablingBENOTIFY.
• SERVICE— Number of SERVICE requests sent. The SERVICEmethod is used by a SIP client to request a service from a SIP
57Copyright © 2011, Juniper Networks, Inc.
Chapter 1: Device and Routing Operations Monitoring

Table 28: Voice ALG SIPMonitoring Page (continued)
Additional InformationValueField
server. It is a standard SIP message and will be forwarded untilit reaches the server or end user that is performing the service.
• OTHER— Number of OTHER requests sent.
–Displays the transmit and retransmit method.T, RT
–Displays one transmit and retransmit method.1xx, RT
–Displays two transmit and retransmit methods.2xx, RT
–Displays three transmit and retransmit methods.3xx, RT
–Displays four transmit and retransmit methods.4xx, RT
–Displays five transmit and retransmit methods.5xx, RT
–Displays six transmit and retransmit methods.6xx, RT
Calls
–Displays the call ID.Call ID
–Displays the call method used.Method
–Displays the state of the ALG SIP.State
–Displays the group identifier.Group ID
–Displays the invite method chart. The available options are:
• T/RT
• 1xx/ RT
• 2xx/ RT
• 3xx/ RT
• 4xx/ RT
• 5xx/ RT
• 6xx/ RT
Invite Method Chart
SIP Error Counters
Copyright © 2011, Juniper Networks, Inc.58
Junos OS Monitoring and Troubleshooting Guide for Security Devices

Table 28: Voice ALG SIPMonitoring Page (continued)
Additional InformationValueField
–Displays the SIP error counters. The available options are:
• Total Pkt-in— Number of SIP ALG total packets received.
• Total Pkt dropped on error— Number of packets dropped bythe SIP ALG.
• Call error— SIP Number of ALG call errors.
• IP resolve error— Number of SIP ALG IP address resolutionerrors.
• NAT error— SIP Number of ALG NAT errors.
• Resourcemanager error— Number of SIP ALG resourcemanager errors.
• RR header exceededmax— Number of times the SIP ALG RR(Record-Route) headers exceeded the maximum limit.
• Contactheader exceededmax— Number of times the SIP ALGcontact header exceeded the maximum limit.
• Call dropped due to limit— Number of SIP ALG calls droppedbecause of call limits.
• SIP stack error— Number of SIP ALG stack errors.
• SIP Decode error— Number of SIP ALG decode error
• SIP unknownmethod error— Number of SIP ALG unknowmethod error.
• SIP DSCPmarked— SIP ALG DSCP marked.
• SIP DSCPmarked error— Number of SIP ALG DSCP marked
• RTOmessagesent— Number of SIP ALG marked RTO messagesent.
• RTOmessage received— Number of SIP ALG RTO messagereceived.
• RTObuffer allocation failure— Number of SIP ALG RTO bufferallocation failure.
• RTO buffer transmit failure— Number of SIP ALG RTO buffertransmit failure.
• RTO send processing error— Number of SIP ALG RTO sendprocessing error.
• RTO receiving processing error— Number of SIP ALG RTOreceiving processing error.
• RTO receive invalid length— Number of SIP ALG RTO receivinginvalid length.
• RTO receive call process error— Number of SIP ALG RTOreceiving call process error.
• RTO receive call allocation error— Number of SIP ALG RTOreceiving call allocation error.
• RTO receive call register error— Number of SIP ALG RTOreceiving call register error.
• RTO receive invalid status error— Number of SIP ALG RTOreceiving register error.
Category
–Provides count of response codes for each SIP ALG countercategory.
Count
59Copyright © 2011, Juniper Networks, Inc.
Chapter 1: Device and Routing Operations Monitoring

RelatedDocumentation
Monitoring Voice ALG Summary on page 46•
• Monitoring Voice ALG H.323 on page 47
• Monitoring Voice ALG MGCP on page 49
• Monitoring Voice ALG SCCP on page 52
Monitoring SIP ALGs
This section contains the following topics:
• Monitoring SIP ALG Calls on page 60
• Monitoring SIP ALG Counters on page 60
• Monitoring SIP ALG Rate Information on page 62
• Monitoring SIP ALG Transactions on page 63
Monitoring SIP ALG Calls
Purpose View information about SIP ALG calls.
Action SelectMonitor>ALGs>SIP>Calls in the J-Web user interface. To view detailed
information, select the Call Leg on the SIP calls page.
Alternatively, enter the show security alg sip calls detail command.
Table 29 on page 60 summarizes key output fields in the SIP calls display.
Table 29: Summary of Key SIP Calls Output Fields
Additional InformationValuesField
SIP Calls Information
Call length identifier.Call Leg
Client zone identifier.Zone
Resource manager group identifier.RM Group
Local tag for the SIP ALG User Agent server.Local Tag
Remote tag for the SIP ALG User Agent server.RemoteTag
Monitoring SIP ALG Counters
Purpose View SIP ALG counters information.
Action SelectMonitor>ALGs>SIP>Count in the J-Web user interface, or enter the showsecurity
alg sip counters command.
Copyright © 2011, Juniper Networks, Inc.60
Junos OS Monitoring and Troubleshooting Guide for Security Devices

Table 30 on page 61 summarizes key output fields in the SIP counters display.
Table 30: Summary of Key SIP Counters Output Fields
Additional InformationValuesField
SIP Counters Information
An INVITE request is sent to invite another user toparticipate in a session.
Number of INVITE requests sent.INVITE
A user can send a CANCEL request to cancel a pendingINVITE request. A CANCEL request has no effect if theSIP server processing the INVITE had sent a finalresponse for the INVITE before it received the CANCEL.
Number of CANCEL requests sent.CANCEL
The user from whom the INVITE originated sends anACK request to confirm reception of the final responseto the INVITE request.
Number of ACK requests sent.ACK
A user sends a BYE request to abandon a session. ABYE request from either user automatically terminatesthe session.
Number of BYE requests sent.BYE
A user sends a REGISTER request to a SIP registrarserver to inform it of the current location of the user. ASIP registrar server records all the information it receivesin REGISTER requests and makes this informationavailable to any SIP server attempting to locate a user.
Number of REGISTER requests sent.REGISTER
An OPTION message is used by the User Agent (UA)to obtain information about the capabilities of the SIPproxy. A server responds with information about whatmethods, session description protocols, and messageencoding it supports.
Number of OPTIONS requests sent.OPTIONS
An INFO message is used to communicate mid-sessionsignaling information along the signaling path for thecall.
Number of INFO requests sent.INFO
SIP messages consist of requests from a client to aserver and responses to the requests from a server toa client with the purpose of establishing a session (ora call).
Number of MESSAGE requests sent.MESSAGE
A NOTIFY message is sent to inform subscribers ofchanges in state to which the subscriber has asubscription.
Number of NOTIFY requests sent.NOTIFY
A REFER request is used to refer the recipient (identifiedby the Request-URI) to a third party by the contactinformation provided in the request.
Number of REFER requests sent.REFER
A SUBSCRIBE request is used to request current stateand state updates from a remote node.
Number of SUBSCRIBE requests sent.SUBSCRIBE
61Copyright © 2011, Juniper Networks, Inc.
Chapter 1: Device and Routing Operations Monitoring

Table 30: Summary of Key SIP Counters Output Fields (continued)
Additional InformationValuesField
An UPDATE request is used to create a temporaryopening in the firewall (pinhole) for new or updatedSession Description Protocol (SDP) information. Thefollowing header fields are modified: Via, From, To,Call-ID, Contact, Route, and Record-Route.
Number of UPDATE requests sent.UPDATE
SIP Error Counters
SIP ALG total packets received.TotalPkt-in
Number of packets dropped by the SIP ALG.Total Pktdropped onerror
SIP ALG transaction errors.Transactionerror
SIP ALG call errors.Call error
SIP ALG IP address resolution errors.IP resolveerror
SIP ALG NAT errors.NAT error
SIP ALG resource manager errors.Resourcemanagererror
Number of times the SIP ALG RR (Record-Route)headers exceeded the maximum limit.
RR headerexceededmax
Number of times the SIP ALG contact header exceededthe maximum limit.
Contactheaderexceededmax
SIP ALG calls dropped because of call limits.Calldroppeddue to limit
SIP ALG stack errors.SIP stackerror
Monitoring SIP ALG Rate Information
Purpose View SIP ALG rate information.
Copyright © 2011, Juniper Networks, Inc.62
Junos OS Monitoring and Troubleshooting Guide for Security Devices

Action SelectMonitor>ALGs>SIP>Rate in the J-Web user interface, or enter the show security
alg sip rate command.
Table 31 on page 63 summarizes key output fields in the SIP rate display.
Table 31: Summary of Key SIP Rate Output Fields
Additional InformationValuesField
SIP Rate Information
SIP ALG CPU ticks per microsecond.CPU ticks permicroseconds is
Time, in microseconds, that the last SIP ALG messageneeded to transit the network.
Time taken forthe lastmessage inmicroseconds is
Total number of SIP ALG messages transiting thenetwork in 10 minutes.
Number ofmessages in 10minutes
Total time, in microseconds, during an interval of lessthan 10 minutes for the specified number of SIP ALGmessages to transit the network.
Time taken bythe messages in10 minutes
Number of SIP ALG messages per second transitingthe network.
Rate
Monitoring SIP ALG Transactions
Purpose View information about SIP ALG transactions.
Action SelectMonitor>ALGs>SIP>Transactions in the J-Web user interface, or enter the show
security alg sip transactions command.
Table 32 on page 63 summarizes key output fields in the SIP transactions display.
Table 32: Summary of Key SIP Transactions Output Fields
Additional InformationValuesField
SIP Transactions Information
• UAS—SIP ALG User Agent server transaction name.
• UAC—SIP ALG User Agent client transaction name.
TransactionName
63Copyright © 2011, Juniper Networks, Inc.
Chapter 1: Device and Routing Operations Monitoring
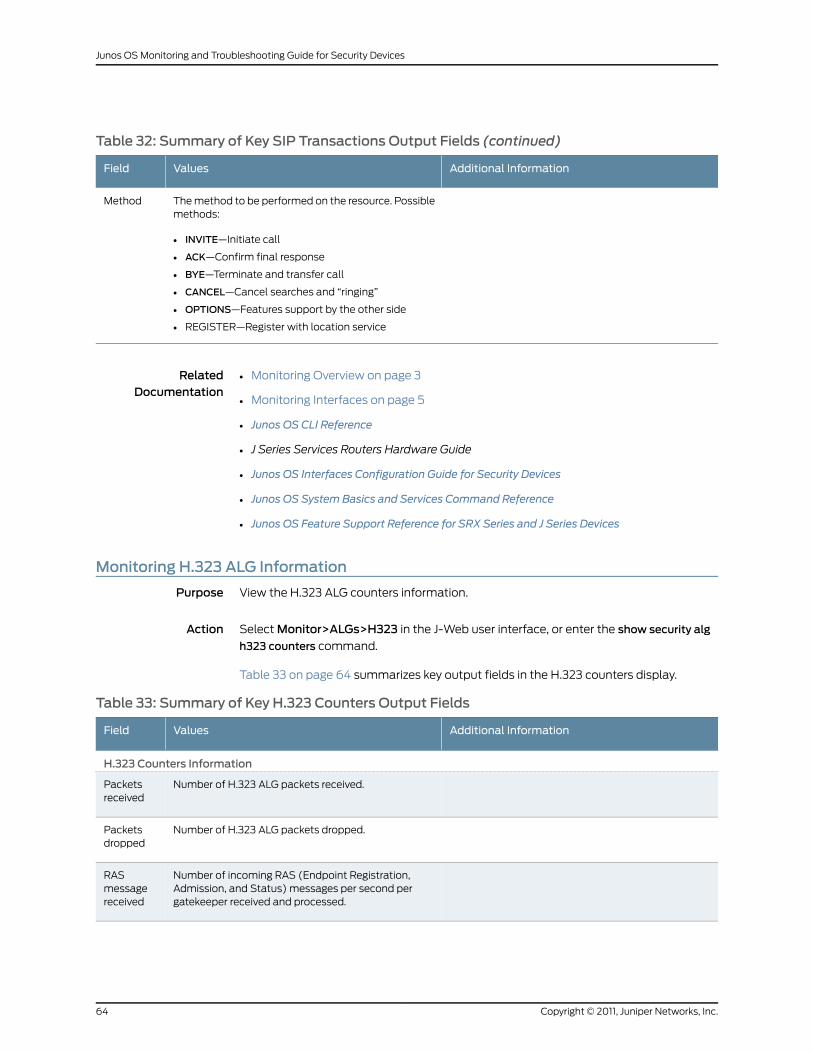
Table 32: Summary of Key SIP Transactions Output Fields (continued)
Additional InformationValuesField
The method to be performed on the resource. Possiblemethods:
• INVITE—Initiate call
• ACK—Confirm final response
• BYE—Terminate and transfer call
• CANCEL—Cancel searches and “ringing”
• OPTIONS—Features support by the other side
• REGISTER—Register with location service
Method
RelatedDocumentation
Monitoring Overview on page 3•
• Monitoring Interfaces on page 5
• Junos OS CLI Reference
• J Series Services Routers Hardware Guide
• Junos OS Interfaces Configuration Guide for Security Devices
• Junos OS System Basics and Services Command Reference
• Junos OS Feature Support Reference for SRX Series and J Series Devices
Monitoring H.323 ALG Information
Purpose View the H.323 ALG counters information.
Action SelectMonitor>ALGs>H323 in the J-Web user interface, or enter the show security alg
h323 counters command.
Table 33 on page 64 summarizes key output fields in the H.323 counters display.
Table 33: Summary of Key H.323 Counters Output Fields
Additional InformationValuesField
H.323 Counters Information
Number of H.323 ALG packets received.Packetsreceived
Number of H.323 ALG packets dropped.Packetsdropped
Number of incoming RAS (Endpoint Registration,Admission, and Status) messages per second pergatekeeper received and processed.
RASmessagereceived
Copyright © 2011, Juniper Networks, Inc.64
Junos OS Monitoring and Troubleshooting Guide for Security Devices

Table 33: Summary of Key H.323 Counters Output Fields (continued)
Additional InformationValuesField
Counter for Q.931 message received.Q.931messagereceived
Counter for H.245 message received.H.245messagereceived
Total number of H.323 ALG calls.Number ofcalls
This counter displays the number of call legs and maynot display the exact number of voice calls that areactive. For instance, for a single active voice callbetween two endpoints, this counter might display avalue of 2.
Number of active H.323 ALG calls.Number ofactive calls
H.323 Error Counters
Number of decoding errors.Decodingerrors
Error counter for message flood dropped.Messageflooddropped
H.323 ALG Network Address Translation (NAT) errors.NAT errors
H.323 ALG resource manager errors.Resourcemanagererrors
RelatedDocumentation
Monitoring Overview on page 3•
• Monitoring Interfaces on page 5
• Junos OS CLI Reference
• J Series Services Routers Hardware Guide
• Junos OS Interfaces Command Reference
• Junos OS System Basics and Services Command Reference
• Junos OS Feature Support Reference for SRX Series and J Series Devices
65Copyright © 2011, Juniper Networks, Inc.
Chapter 1: Device and Routing Operations Monitoring

MonitoringMGCPALGs
This section contains the following topics:
• Monitoring MGCP ALG Calls on page 66
• Monitoring MGCP ALG Counters on page 66
• Monitoring MGCP ALG Endpoints on page 68
MonitoringMGCPALG Calls
Purpose View information about MGCP ALG calls.
Action SelectMonitor>ALGs>MGCP>Calls in the J-Web user interface. To view detailed
information, select the endpoint on the MGCP calls page.
Alternatively, enter the show security algmgcp calls command.
Table 34 on page 66 summarizes key output fields in the MGCP calls display.
Table 34: Summary of KeyMGCP Calls Output Fields
Additional InformationValuesField
MGCPCalls Information
Endpoint name.Endpoint@GW
• trust—Trust zone.
• untrust—Untrust zone.
Zone
Call identifier for ALG MGCP.Call ID
Resource manager group ID.RM Group
Duration for which connection is active.Call Duration
Connection identifier for MGCP ALG calls.Connection Id
Calls Details: Endpoint
IP address of the MGCP ALG local call owner, asper the Session Description Protocol (SDP).
Local SDP
Remote IP address of the MGCP ALG remote callowner, as per the Session Description Protocol(SDP).
Remote SDP
MonitoringMGCPALG Counters
Purpose View MGCP ALG counters information.
Copyright © 2011, Juniper Networks, Inc.66
Junos OS Monitoring and Troubleshooting Guide for Security Devices

Action SelectMonitor>ALGs>MGCP>Counters in the J-Web user interface, or enter the show
security algmgcp counters command.
Table 35 on page 67 summarizes key output fields in the MGCP counters display.
Table 35: Summary of KeyMGCP Counters Output Fields
Additional InformationValuesField
MGCPCounters Information
Number of MGCP ALG packets received.Packets received
Number of MGCP ALG packets dropped.Packets dropped
Number of MGCP ALG messages received.Message received
Number of MGCP ALG connections.Number of connections
Number of active MGCP ALG connections.Number of activeconnections
Number of MGCP ALG calls.Number of calls
Number of MGCP ALG active calls.Number of active calls
Number of active transactions.Number of activetransactions
Number of MGCP ALG retransmissions.Number ofre-transmission
Error Counters
MGCP ALG unknown method errors.Unknown-method
MGCP ALG decoding errors.Decoding error
MGCP ALG transaction errors.Transaction error
MGCP ALG counter errors.Call error
MGCP ALG connection errors.Connection error
MGCP ALG connection flood drop errors.Connection flood drop
MGCP ALG message flood drop error.Message flood drop
MGCP ALG IP address resolution errors.IP resolve error
MGCP ALG Network Address Translation (NAT)errors.
NAT error
67Copyright © 2011, Juniper Networks, Inc.
Chapter 1: Device and Routing Operations Monitoring

Table 35: Summary of KeyMGCP Counters Output Fields (continued)
Additional InformationValuesField
MGCP ALG resource manager errors.Resource manager error
MonitoringMGCPALG Endpoints
Purpose View information about MGCP ALG endpoints.
Action SelectMonitor>ALGs>MGCP>Endpoints in the J-Web user interface. To view detailed
information, select the gateway on the MGCP endpoints page.
Alternatively, enter the show security algmgcp endpoints command.
Table 36 on page 68 summarizes key output fields in the MGCP endpoints display.
Table 36: Summary of KeyMGCP Endpoints Output Fields
Additional InformationValuesField
MGCP Endpoints
IP address of the gateway.Gateway
• trust—Trust zone.
• untrust—Untrust zone.
Zone
IP address.IP
Endpoints: Gateway name
Endpoint name.Endpoint
Transaction identifier.Transaction#
Call identifier.Call #
The certificate authority (CA) currently controlling thegateway.
NotifiedEntity
RelatedDocumentation
Monitoring Overview on page 3•
• Monitoring Interfaces on page 5
• Junos OS CLI Reference
• J Series Services Routers Hardware Guide
• Junos OS Interfaces Command Reference
• Junos OS System Basics and Services Command Reference
Copyright © 2011, Juniper Networks, Inc.68
Junos OS Monitoring and Troubleshooting Guide for Security Devices

• Junos OS Feature Support Reference for SRX Series and J Series Devices
Monitoring SCCP ALGs
This section contains the following topics:
• Monitoring SCCP ALG Calls on page 69
• Monitoring SCCP ALG Counters on page 69
Monitoring SCCP ALG Calls
Purpose View information about SCCP ALG calls.
Action SelectMonitor>ALGs>SCCP>Calls in the J-Web user interface. To view detailed
information, select the client IP address on the SCCP calls page.
Alternatively, enter the show security alg sccp calls command.
Table 37 on page 69 summarizes key output fields in the SCCP calls display.
Table 37: Summary of Key SCCP Calls Output Fields
Additional InformationValuesField
SCCP Calls Information
IP address of the client.Client IP
Client zone identifier.Zone
IP address of the call manager.CallManager
Conference call identifier.ConferenceID
Resource manager group identifier.RM Group
Monitoring SCCP ALG Counters
Purpose View SCCP ALG counters information.
Action SelectMonitor>ALGs>SCCP>Count in the J-Web user interface, or enter the show
security alg sccp counters command.
Table 38 on page 70 summarizes key output fields in the SCCP counters display.
69Copyright © 2011, Juniper Networks, Inc.
Chapter 1: Device and Routing Operations Monitoring

Table 38: Summary of Key SCCP Counters Output Fields
Additional InformationValuesField
SCCP Counters Information
Number of SCCP ALG clients currently registered.Clientscurrentlyregistered
Number of active SCCP ALG calls.Active calls
Total number of SCCP ALG calls.Total calls
Number of SCCP ALG packets received.Packetsreceived
Number of SCCP ALG protocol data units (PDUs)processed.
PDUsprocessed
Number of calls per second.Current callrate
Error counters
Number of packets dropped by the SCCP ALG.Packetsdropped
SCCP ALG decoding errors.Decodeerrors
Number of protocol errors.Protocolerrors
Number of Network Address Translation (NAT) errorsencountered by SCCP ALG.
Addresstranslationerrors
Number of packets dropped because of a failed policylookup.
Policylookuperrors
Number of unknown protocol data units (PDUs).UnknownPDUs
Number of times the maximum SCCP calls limit wasexceeded.
Maximumcallsexceed
Number of times the maximum SCCP call rateexceeded.
Maximumcall rateexceed
Number of initialization errors.Initializationerrors
Copyright © 2011, Juniper Networks, Inc.70
Junos OS Monitoring and Troubleshooting Guide for Security Devices

Table 38: Summary of Key SCCP Counters Output Fields (continued)
Additional InformationValuesField
Number of internal errors.Internalerrors
Number of unsupported feature errors.Unsupportedfeature
Number of nonspecific errors.Nonspecificerror
RelatedDocumentation
Monitoring Overview on page 3•
• Monitoring Interfaces on page 5
• Junos OS CLI Reference
• J Series Services Routers Hardware Guide
• Junos OS Interfaces Configuration Guide for Security Devices
• Junos OS System Basics and Services Command Reference
• Junos OS Feature Support Reference for SRX Series and J Series Devices
Monitoring VPNs
This section contains the following topics:
• Monitoring IKE Gateway Information on page 71
• Monitoring IPsec VPN—Phase I on page 75
• Monitoring IPsec VPN—Phase II on page 76
• Monitoring IPsec VPN Information on page 77
Monitoring IKE Gateway Information
Purpose View information about IKE security associations (SAs).
Action SelectMonitor>IPSec VPN>IKE Gateway in the J-Web user interface. To view detailed
information for a particular SA, select the IKE SA index on the IKE gateway page.
Alternatively, enter the following CLI commands:
• show security ike security-associations
• show security ike security-associations index index-id detail
Table 39 on page 72 summarizes key output fields in the IKE gateway display.
71Copyright © 2011, Juniper Networks, Inc.
Chapter 1: Device and Routing Operations Monitoring

Table 39: Summary of Key IKE SA Information Output Fields
Additional InformationValuesField
IKE Security Associations
This number is an internally generated numberyou can use to display information about a singleSA.
Index number of an SA.IKE SA Index
IP address of the destination peer with which thelocal peer communicates.
Remote Address
State of the IKE security associations:
• DOWN—SA has not been negotiated with thepeer.
• UP—SA has been negotiated with the peer.
State
Random number, called a cookie, which is sentto the remote node when the IKE negotiation istriggered.
Initiator cookie
A cookie is aimed at protecting the computingresources from attack without spendingexcessive CPU resources to determine thecookie’s authenticity.
Random number generated by the remote nodeand sent back to the initiator as a verificationthat the packets were received.
Responder cookie
Negotiation method agreed on by the two IPsecendpoints, or peers, used to exchangeinformation between themselves. Each exchangetype determines the number of messages andthe payload types that are contained in eachmessage. The modes, or exchange types, are:
• Main—The exchange is done with sixmessages. This mode, or exchange type,encrypts the payload, protecting the identityof the neighbor. The authentication methodused is displayed: preshared keys or certificate.
• Aggressive—The exchange is done with threemessages. This mode, or exchange type, doesnot encrypt the payload, leaving the identityof the neighbor unprotected.
Mode
IKE Security Association (SA) Index
IP address of the destination peer with which thelocal peer communicates.
IKE Peer
This number is an internally generated numberyou can use to display information about a singleSA.
Index number of an SA.IKE SA Index
Part played in the IKE session. The devicetriggering the IKE negotiation is the initiator, andthe device accepting the first IKE exchangepackets is the responder.
Role
Copyright © 2011, Juniper Networks, Inc.72
Junos OS Monitoring and Troubleshooting Guide for Security Devices

Table 39: Summary of Key IKE SA Information Output Fields (continued)
Additional InformationValuesField
State of the IKE security associations:
• DOWN—SA has not been negotiated with thepeer.
• UP—SA has been negotiated with the peer.
State
Random number, called a cookie, which is sentto the remote node when the IKE negotiation istriggered.
Initiator cookie
A cookie is aimed at protecting the computingresources from attack without spendingexcessive CPU resources to determine thecookie’s authenticity.
Random number generated by the remote nodeand sent back to the initiator as a verificationthat the packets were received.
Responder cookie
Negotiation method agreed on by the two IPsecendpoints, or peers, used to exchangeinformation between themselves. Each exchangetype determines the number of messages andthe payload types that are contained in eachmessage. The modes, or exchange types, are:
• Main—The exchange is done with sixmessages. This mode, or exchange type,encrypts the payload, protecting the identityof the neighbor. The authentication methodused is displayed: preshared keys or certificate.
• Aggressive—The exchange is done with threemessages. This mode, or exchange type, doesnot encrypt the payload, leaving the identityof the neighbor unprotected.
Exchange Type
Path chosen for authentication.Authentication Method
Address of the local peer.Local
Address of the remote peer.Remote
Number of seconds remaining until the IKE SAexpires.
Lifetime
73Copyright © 2011, Juniper Networks, Inc.
Chapter 1: Device and Routing Operations Monitoring

Table 39: Summary of Key IKE SA Information Output Fields (continued)
Additional InformationValuesField
IKE algorithms used to encrypt and secureexchanges between the peers during the IPsecPhase 2 process:
• Authentication—Type of authenticationalgorithm used.
• sha1—Secure Hash Algorithm 1 (SHA-1)authentication.
• md5—MD5 authentication.
• Encryption—Type of encryption algorithmused.
• aes-256-cbc—Advanced EncryptionStandard (AES) 256-bit encryption.
• aes-192-cbc—Advanced EncryptionStandard (AES) 192-bit encryption.
• aes-128-cbc—Advanced EncryptionStandard (AES) 128-bit encryption.
• 3des-cbc—3 Data Encryption Standard(DES) encryption.
• des-cbc—Data Encryption Standard (DES)encryption.
• Pseudorandomfunction—Cryptographicallysecure pseudorandom function family.
Algorithm
Traffic statistics include the following:
• Input bytes—The number of bytes presentedfor processing by the device.
• Output bytes—The number of bytes actuallyprocessed by the device.
• Input packets—The number of packetspresented for processing by the device.
• Output packets—The number of packetsactually processed by the device.
Traffic Statistics
• number created—The number of SAs created.
• number deleted—The number of SAs deleted.
IPsec securityassociations
Part played in the IKE session. The devicetriggering the IKE negotiation is the initiator, andthe device accepting the first IKE exchangepackets is the responder.
Role
Message identifier.Message ID
Specifies the identity of the local peer so that itspartner destination gateway can communicatewith it. The value is specified as any of thefollowing: IPv4 address, fully qualified domainname, e-mail address, or distinguished name.
Local identity
Copyright © 2011, Juniper Networks, Inc.74
Junos OS Monitoring and Troubleshooting Guide for Security Devices

Table 39: Summary of Key IKE SA Information Output Fields (continued)
Additional InformationValuesField
IPv4 address of the destination peer gateway.Remote identity
Monitoring IPsec VPN—Phase I
Purpose View IPsec VPN Phase I information.
Action SelectMonitor>IPSec VPN>Phase I in the J-Web user interface.
Table 40 on page 75 describes the available options for monitoring IPsec VPN-Phase I.
Table 40: IPsec VPN—Phase I Monitoring Page
Additional InformationValuesField
IKE SA TabOptions
IKE Security Associations
Index number of an SA.SA Index
IP address of the destination peer withwhich the local peer communicates.
Remote Address
State of the IKE security associations:
• DOWN—SA has not been negotiatedwith the peer.
• UP—SA has been negotiated with thepeer.
State
Random number, called a cookie, whichis sent to the remote node when the IKEnegotiation is triggered.
Initiator Cookie
A cookie is aimed at protecting thecomputing resources from attackwithout spending excessive CPUresources to determine the cookie’sauthenticity.
Random number generated by theremote node and sent back to theinitiator as a verification that the packetswere received.
Responder Cookie
75Copyright © 2011, Juniper Networks, Inc.
Chapter 1: Device and Routing Operations Monitoring

Table 40: IPsec VPN—Phase I Monitoring Page (continued)
Additional InformationValuesField
Negotiation method agreed upon by thetwo IPsec endpoints, or peers, used toexchange information. Each exchangetype determines the number of messagesand the payload types that are containedin each message. The modes, orexchange types, are:
• Main—The exchange is done with sixmessages. This mode, or exchangetype, encrypts the payload, protectingthe identity of the neighbor. Theauthentication method used isdisplayed: preshared keys orcertificate.
• Aggressive—The exchange is donewith three messages. This mode, orexchange type, does not encrypt thepayload, leaving the identity of theneighbor unprotected.
Mode
Monitoring IPsec VPN—Phase II
Purpose View IPsec VPN Phase II information.
Action SelectMonitor>IPSec VPN>Phase II in the J-Web user interface.
Table 41 on page 76 describes the available options for monitoring IPsec VPN-Phase II.
Table 41: IPsec VPN—Phase II Monitoring Page
Additional InformationValuesField
Statistics Tab Details
Provides total number of bytes encryptedand decrypted by the local system acrossthe IPsec tunnel.
By bytes
Provides total number of packetsencrypted and decrypted by the localsystem across the IPsec tunnel.
By packets
Provides details of the IPsec statistics.IPsec Statistics
IPsec SA Tab Details
IPsec Security Associations
Index number of the SA.ID
IP address of the remote gateway/port.Gateway/Port
Copyright © 2011, Juniper Networks, Inc.76
Junos OS Monitoring and Troubleshooting Guide for Security Devices

Table 41: IPsec VPN—Phase II Monitoring Page (continued)
Additional InformationValuesField
Cryptography scheme used to secureexchanges between peers during the IKEPhase II negotiations:
• An authentication algorithm used toauthenticate exchanges between thepeers. Options are hmac-md5-95 orhmac-sha1-96.
Algorithm
Security parameter index (SPI) identifier.An SA is uniquely identified by an SPI.Each entry includes the name of the VPN,the remote gateway address, the SPIsfor each direction, the encryption andauthentication algorithms, and keys. Thepeer gateways each have two SAs, oneresulting from each of the two phases ofnegotiation: Phase I and Phase II.
SPI
The lifetime of the SA, after which itexpires, expressed either in seconds orkilobytes.
Life
Specifies if VPN-Liveliness Monitoringhas been enabled/disabled. Enabled - 'U ', Disabled- '—'
Monitoring
Specifies the root system.Vsys
Monitoring IPsec VPN Information
Purpose View information about IPsec security (SAs).
Action SelectMonitor>IPSec VPN>IPsec VPN in the J-Web user interface. To view the IPsec
statistics information for a particular SA, select the IPsec SA ID value on the IPsec VPN
page.
Alternatively, enter the following CLI commands:
• show security ipsec security-associations
• show security ipsec statistics
Table 42 on page 77 summarizes key output fields in the IPsec VPN display.
Table 42: Summary of Key IPsec VPN Information Output Fields
Additional InformationValuesField
IPsec Security Associations
77Copyright © 2011, Juniper Networks, Inc.
Chapter 1: Device and Routing Operations Monitoring

Table 42: Summary of Key IPsec VPN Information Output Fields (continued)
Additional InformationValuesField
Total number of IPsec security associations(SAs) configured on the device.
Total configured SA
Index number of the SA.ID
IP address of the remote gateway.Gateway
If Network Address Translation (NAT-T) is used,this value is 4500. Otherwise, it is the standardIKE port, 500.
Port
Cryptography used to secure exchanges betweenpeers during the IKE Phase 2 negotiations:
• An authentication algorithm used toauthenticate exchanges between the peers.Options are hmac-md5-95 or hmac-sha1-96.
• An encryption algorithm used to encrypt datatraffic. Options are 3des-cbc, aes-128-cbc,aes-192-cbc, aes-256-cbc, or des-cbc.
Algorithm
Security parameter index (SPI) identifier. An SAis uniquely identified by an SPI. Each entryincludes the name of the VPN, the remotegateway address, the SPIs for each direction, theencryption and authentication algorithms, andkeys. The peer gateways each have two SAs, oneresulting from each of the two phases ofnegotiation: Phase 1 and Phase 2.
SPI
The lifetime of the SA, after which it expires,expressed either in seconds or kilobytes.
Life: sec/kb
For transport mode, the value of State is alwaysInstalled.
State has two options, InstalledandNot Installed.
• Installed—The security association is installedin the security association database.
• Not Installed—The security association is notinstalled in the security association database.
State
The root system.Vsys
IPsec Statistics Information
Copyright © 2011, Juniper Networks, Inc.78
Junos OS Monitoring and Troubleshooting Guide for Security Devices

Table 42: Summary of Key IPsec VPN Information Output Fields (continued)
Additional InformationValuesField
Encapsulation Security Protocol (ESP) statisticsinclude the following:
• Encrypted bytes—Total number of bytesencrypted by the local system across the IPsectunnel.
• Decrypted bytes—Total number of bytesdecrypted by the local system across the IPsectunnel.
• Encrypted packets—Total number of packetsencrypted by the local system across the IPsectunnel.
• Decrypted packets—Total number of packetsdecrypted by the local system across the IPsectunnel.
ESP Statistics
Authentication Header (AH) statistics includethe following:
• Input bytes—The number of bytes presentedfor processing by the device.
• Output bytes—The number of bytes actuallyprocessed by the device.
• Input packets—The number of packetspresented for processing by the device.
• Output packets—The number of packetsactually processed by the device.
AH Statistics
Errors include the following
• AH authentication failures—Total number ofauthentication header (AH) failures. An AHfailure occurs when there is a mismatch of theauthentication header in a packet transmittedacross an IPsec tunnel.
• Replay errors—Total number of replay errors.A replay error is generated when a duplicatepacket is received within the replay window.
• ESP authentication failures—Total number ofEncapsulation Security Payload (ESP) failures.An ESP failure occurs when there is anauthentication mismatch in ESP packets.
• ESP decryption failures—Total number of ESPdecryption errors.
• Badheaders—Total number of invalid headersdetected.
• Bad trailers—Total number of invalid trailersdetected.
Errors
Details for IPsec SA Index: ID
The root system.Virtual System
79Copyright © 2011, Juniper Networks, Inc.
Chapter 1: Device and Routing Operations Monitoring

Table 42: Summary of Key IPsec VPN Information Output Fields (continued)
Additional InformationValuesField
Gateway address of the local system.Local Gateway
Gateway address of the remote system.Remote Gateway
Specifies the identity of the local peer so that itspartner destination gateway can communicatewith it. The value is specified as any of thefollowing: IPv4 address, fully qualified domainname, e-mail address, or distinguished name.
Local identity
IPv4 address of the destination peer gateway.Remote identity
State of the don’t fragment bit—set or cleared.Df bit
Name of the applicable policy.Policy name
Direction of the security association—inbound,or outbound.
Direction
Security parameter index (SPI) identifier. An SAis uniquely identified by an SPI. Each entryincludes the name of the VPN, the remotegateway address, the SPIs for each direction, theencryption and authentication algorithms, andkeys. The peer gateways each have two SAs, oneresulting from each of the two phases ofnegotiation: Phase 1 and Phase 2.
SPI
Mode of the security association. Mode can betransport or tunnel.
• transport—Protects host-to-host connections.
• tunnel—Protects connections betweensecurity gateways.
Mode
Type of the security association, either manualor dynamic.
• manual—Security parameters require nonegotiation. They are static and are configuredby the user.
• dynamic—Security parameters are negotiatedby the IKE protocol. Dynamic securityassociations are not supported in transportmode.
Type
Copyright © 2011, Juniper Networks, Inc.80
Junos OS Monitoring and Troubleshooting Guide for Security Devices

Table 42: Summary of Key IPsec VPN Information Output Fields (continued)
Additional InformationValuesField
For transport mode, the value of State is alwaysInstalled.
State has two options, Installed, and NotInstalled.
• Installed—The security association is installedin the security association database.
• Not Installed—The security association is notinstalled in the security association database.
State
Protocol supported:
• Transport mode supports EncapsulationSecurity Protocol (ESP) and AuthenticationHeader (AH).
• Tunnel mode supports ESP and AH.
• Authentication—Type of authenticationused.
• Encryption—Type of encryption used.
Protocol
• Authentication—Type of authenticationalgorithm used.
• sha1—Secure Hash Algorithm 1 (SHA-1)authentication.
• md5—MD5 authentication.
• Encryption—Type of encryption algorithmused.
• aes-256-cbc—Advanced EncryptionStandard (AES) 256-bit encryption.
• aes-192-cbc—Advanced EncryptionStandard (AES) 192-bit encryption.
• aes-128-cbc—Advanced EncryptionStandard (AES) 128-bit encryption.
• 3des-cbc—3 Data Encryption Standard(DES) encryption.
• des-cbc—Data Encryption Standard (DES)encryption.
Authentication/Encryption
Each lifetime of a security association has twodisplay options,hardand soft, one of which mustbe present for a dynamic security association.This allows the key management system tonegotiate a new SA before the hard lifetimeexpires.
The soft lifetime informs the IPsec keymanagement system that the SA is about toexpire.
• Expires in seconds—Number of seconds leftuntil the SA expires.
• Expires in kilobytes—Number of kilobytes leftuntil the SA expires.
Soft Lifetime
The hard lifetime specifies the lifetime of the SA.
• Expires in seconds—Number of seconds leftuntil the SA expires.
• Expires in kilobytes—Number of kilobytes leftuntil the SA expires.
Hard Lifetime
81Copyright © 2011, Juniper Networks, Inc.
Chapter 1: Device and Routing Operations Monitoring

Table 42: Summary of Key IPsec VPN Information Output Fields (continued)
Additional InformationValuesField
State of the service that prevents packets frombeing replayed. It can be Enabled or Disabled.
Anti Replay Service
The antireplay window size protects the receiveragainst replay attacks by rejecting old orduplicate packets.
Configured size of the antireplay service window.It can be 32 or 64 packets. If the replay windowsize is 0, the antireplay service is disabled.
Replay Window Size
RelatedDocumentation
Monitoring Overview on page 3•
• Monitoring Interfaces on page 5
• Junos OS CLI Reference
• J Series Services Routers Hardware Guide
• Junos OS Interfaces Configuration Guide for Security Devices
• Junos OS System Basics and Services Command Reference
• Junos OS Feature Support Reference for SRX Series and J Series Devices
Monitoring Switching
• Monitoring Ethernet Switching on page 82
• Monitoring Spanning Tree on page 83
• Monitoring GVRP on page 85
Monitoring Ethernet Switching
Purpose View information about the Ethernet Switching interface details.
Action SelectMonitor>Switching>Ethernet Switching in the J-Web user interface, or enter the
following CLI commands:
• show ethernet-switching table
• show ethernet-switchingmac-learning-log
Table 43 on page 82 summarizes the Ethernet Switching output fields.
Table 43: Summary of Ethernet Switching Output Fields
Additional InformationValuesField
The VLAN for which Ethernet Switching is enabled.VLAN
The MAC address associated with the VLAN. If aVLAN range has been configured for a VLAN, theoutput displays the MAC addresses for the entireseries of VLANs that were created with that name.
MAC Address
Copyright © 2011, Juniper Networks, Inc.82
Junos OS Monitoring and Troubleshooting Guide for Security Devices

Table 43: Summary of Ethernet Switching Output Fields (continued)
Additional InformationValuesField
The type of MAC address. Values are:
• static—The MAC address is manually created.
• learn—The MAC address is learned dynamicallyfrom a packet's source MAC address.
• flood—The MAC address is unknown and floodedto all members.
Type
The time remaining before the entry ages out and isremoved from the Ethernet switching table.
Age
Interface associated with learned MAC addressesor All-members (flood entry).
Interfaces
The VLAN ID.VLAN-ID
The learned MAC address.MAC Address
Timestamp when the MAC address was added ordeleted from the log.
Time
Indicates the MAC address learned on the interface.State
RelatedDocumentation
Monitoring Overview on page 3•
• Monitoring Interfaces on page 5
• Junos OS CLI Reference
• J Series Services Routers Hardware Guide
• Junos OS Interfaces Command Reference
• Junos OS Interfaces Configuration Guide for Security Devices
• Junos OS Feature Support Reference for SRX Series and J Series Devices
Monitoring Spanning Tree
Purpose Use the monitoring functionality to view the Spanning Tree page.
Action To monitor spanning tree, selectMonitor>Switching>Spanning Tree.
Meaning Table 44 on page 83 summarizes key output fields in the spanning tree page.
Table 44: Spanning TreeMonitoring Page
Additional InformationValueField
Bridge parameters
83Copyright © 2011, Juniper Networks, Inc.
Chapter 1: Device and Routing Operations Monitoring

Table 44: Spanning TreeMonitoring Page (continued)
Additional InformationValueField
–An internally generated identifier.Context ID
–Spanning tree protocol type enabled.Enabled Protocol
The bridge ID consists of a configurablebridge priority and the MAC address of thebridge.
Bridge ID of the elected spanning tree rootbridge.
Root ID
–Locally configured bridge ID.Bridge ID
–An internally generated instance identifier.Inter instance ID
–Extended system generated instanceidentifier.
Extended system ID
–Maximum age of received bridge protocoldata units (BPDUs).
Maximum age
–Total number of STP topology changesdetected since the switch last booted.
Number of topology changes
–Spanning tree forward delay.Forward delay
Interface List
–Interface configured to participate in the STPinstance.
Interface Name
–Logical interface identifier configured toparticipate in the STP instance.
Port ID
–Port ID of the designated port for the LANsegment to which the interface is attached.
Designated Port ID
–Configured cost for the interface.Port Cost
–STP port state. Forwarding (FWD), blocking(BLK), listening, learning, or disabled.
State
–MSTP or RSTP port role. Designated (DESG),backup (BKUP), alternate (ALT), or root.
Role
RelatedDocumentation
Monitoring Ethernet Switching•
• Monitoring GVRP on page 85
Copyright © 2011, Juniper Networks, Inc.84
Junos OS Monitoring and Troubleshooting Guide for Security Devices

Monitoring GVRP
Purpose Use the monitoring functionality to view the GVRP page.
Action To monitor GVRP selectMonitor>Switching>GVRP.
Meaning Table 45 on page 85 summarizes key output fields in the GVRP page.
Table 45: GVRPMonitoring Page
Additional InformationValueField
Global GVRP Configuration
–Displays whether GVRP is enabled ordisabled.
GVRP Status
–Displays the GVRP timer in millisecond.GVRP Timer
–The number of milliseconds the interfacesmust wait before sending VLANadvertisements.
Join
–The number of milliseconds an interfacemust wait after receiving a Leave messageto remove the interface from the VLANspecified in the message.
Leave
–The interval in milliseconds at which LeaveAll messages are sent on interfaces. LeaveAll messages maintain current GVRP VLANmembership information in the network.
Leave All
GVRP Interface Details
–The interface on which GVRP is configured.Interface Name
–Displays whether GVRP is enabled ordisabled.
Protocol Status
RelatedDocumentation
Monitoring Ethernet Switching•
• Monitoring Spanning Tree on page 83
Monitoring Routing Information
This section contains the following topics:
• Monitoring Route Information on page 86
• Monitoring RIP Routing Information on page 87
85Copyright © 2011, Juniper Networks, Inc.
Chapter 1: Device and Routing Operations Monitoring

• Monitoring OSPF Routing Information on page 88
• Monitoring BGP Routing Information on page 90
Monitoring Route Information
Purpose View information about the routes in a routing table, including destination, protocol,
state, and parameter information.
Action SelectMonitor>Routing>Route Information in the J-Web user interface, or enter the
following CLI commands:
• show route terse
• show route detail
Table 46 on page 86 describes the different filters, their functions, and the associated
actions.
Table 47 on page 87 summarizes key output fields in the routing information display.
Table 46: Filtering RouteMessages
Your ActionFunctionField
Enter the destination address.Specifies the destination address of the route.Destination Address
Enter the protocol name.Specifies the protocol from which the route waslearned.
Protocol
Enter the next hop address.Specifies the network layer address of the directlyreachable neighboring system (if applicable) and theinterface used to reach it.
Next hop address
Enter the routing protocol.Specifies the dynamic routing protocol using which therouting information was received through a particularneighbor.
Receive protocol
Select the view details of the best route.Specifies only the best route available.Best route
Select the view details of inactive routes.Specifies the inactive routes.Inactive routes
Select the view details of the exact route.Specifies the exact route.Exact route
Select the view details of hidden routes.Specifies the hidden routes.Hidden routes
To apply the filter and display messages,click Search.
Applies the specified filter and displays the matchingmessages.
Search
To reset the filter, click Reset.Resets selected options to defaultReset
Copyright © 2011, Juniper Networks, Inc.86
Junos OS Monitoring and Troubleshooting Guide for Security Devices

Table 47: Summary of Key Routing Information Output Fields
Additional InformationValuesField
The list of static route addresses.StaticRouteAddresses
Protocol from which the route was learned: Static,Direct, Local, or the name of a particular protocol.
Protocol
The route preference is used as one of the routeselection criteria.
The preference is the individual preference value forthe route.
Preference
If a next hop is listed as Discard, all traffic with thatdestination address is discarded rather than routed.This value generally means that the route is a staticroute for which the discard attribute has been set.
If a next hop is listed as Reject, all traffic with thatdestination address is rejected. This value generallymeans that the address is unreachable. For example,if the address is a configured interface address and theinterface is unavailable, traffic bound for that addressis rejected.
If a next hop is listed as Local, the destination is anaddress on the host (either the loopback address orEthernet management port 0 address, for example).
Network Layer address of the directly reachableneighboring system (if applicable) and the interfaceused to reach it.
Next-Hop
How long the route has been active.Age
There are many possible flags.Flags for this route.State
AS path through which the route was learned. Theletters of the AS path indicate the path origin:
• I—IGP.
• E—EGP.
• ?—Incomplete. Typically, the AS path wasaggregated.
AS Path
Monitoring RIP Routing Information
Purpose View RIP routing information, including a summary of RIP neighbors and statistics.
Action SelectMonitor>Routing>RIP Information in the J-Web user interface, or enter the
following CLI commands:
• show rip statistics
• show rip neighbors
Table 48 on page 88 summarizes key output fields in the RIP routing display in the J-Web
user interface.
87Copyright © 2011, Juniper Networks, Inc.
Chapter 1: Device and Routing Operations Monitoring

Table 48: Summary of Key RIP Routing Output Fields
Additional InformationValuesField
RIP Statistics
The RIP protocol name.Protocol Name
The port on which RIP is enabled.Port number
The interval during which routes are neitheradvertised nor updated.
Hold down time
Number of RIP routes learned on the logicalinterface.
Global routeslearned
Number of RIP routes that are not advertised orupdated during the hold-down interval.
Global routes helddown
Number of requests dropped.Global requestdropped
Number of responses dropped.Global responsesdropped
RIP Neighbors
Tab used to view the details of the interface onwhich RIP is enabled.
Details
This value is the name of the interface on whichRIP is enabled. Click the name to see the details forthis neighbor.
Name of the RIP neighbor.Neighbor
State of the RIP connection: Up or Dn (Down).State
This value is the configured address of the interfaceon which RIP is enabled.
Local source address.Source Address
This value is the configured address of theimmediate RIP adjacency.
Destination address.Destination Address
The mode of sending RIP messages.Send Mode
The mode in which messages are received.Receive Mode
Value of the incoming metric configured for the RIPneighbor.
In Metric
Monitoring OSPF Routing Information
Purpose View OSPF routing information, including a summary of OSPF neighbors, interfaces, and
statistics.
Copyright © 2011, Juniper Networks, Inc.88
Junos OS Monitoring and Troubleshooting Guide for Security Devices

Action SelectMonitor>Routing>OSPF Information in the J-Web user interface, or enter the
following CLI commands:
• show ospf neighbors
• show ospf interfaces
• show ospf statistics
Table 49 on page 89 summarizes key output fields in the OSPF routing display in the
J-Web user interface.
Table 49: Summary of Key OSPF Routing Output Fields
Additional InformationValuesField
OSPF Interfaces
Tab used to view the details of the selectedOSPF.
Details
Name of the interface running OSPF.Interface
The Down state, indicating that the interface isnot functioning, andPtToPt state, indicating thata point-to-point connection has beenestablished, are the most common states.
State of the interface: BDR, Down, DR, DRother,Loop, PtToPt, or Waiting.
State
Number of the area that the interface is in.Area
ID of the area's designated device.DR ID
ID of the area's backup designated device.BDR ID
Number of neighbors on this interface.Neighbors
OSPF Statistics
Packets tab
Displays the total number of packets sent.Sent
Displays the total number of packets received.Received
Details tab
Number of entries in the extended queue.Flood Queue Depth
Number of retransmission entries enqueued.Total Retransmits
Total number of database description packets.Total DatabaseSummaries
OSPF Neighbors
Address of the neighbor.Address
89Copyright © 2011, Juniper Networks, Inc.
Chapter 1: Device and Routing Operations Monitoring

Table 49: Summary of Key OSPF Routing Output Fields (continued)
Additional InformationValuesField
Interface through which the neighbor isreachable.
Interface
Generally, only theDown state, indicating a failedOSPF adjacency, and the Full state, indicatinga functional adjacency, are maintained for morethan a few seconds. The other states aretransitional states that a neighbor is in onlybriefly while an OSPF adjacency is beingestablished.
State of the neighbor:Attempt,Down,Exchange,ExStart, Full, Init, Loading, or 2way.
State
ID of the neighbor.ID
Priority of the neighbor to become thedesignated router.
Priority
The activity time.Activity Time
Area that the neighbor is in.Area
Option bits received in the hello packets fromthe neighbor.
Options
Address of the designated router.DR Address
Address of the backup designated router.BDR Address
Length of time since the neighbor came up.Uptime
Length of time since the adjacency with theneighbor was established.
Adjacency
Monitoring BGP Routing Information
Purpose Monitor BGP routing information on the routing device, including a summary of BGP
routing and neighbor information.
Action SelectMonitor>Routing>BGP Information in the J-Web user interface, or enter the
following CLI commands:
• show bgp summary
• show bgp neighbor
Table 50 on page 91 summarizes key output fields in the BGP routing display in the J-Web
user interface.
Copyright © 2011, Juniper Networks, Inc.90
Junos OS Monitoring and Troubleshooting Guide for Security Devices

Table 50: Summary of Key BGP Routing Output Fields
Additional InformationValuesField
BGP Peer Summary
Number of BGP groups.Total Groups
Number of BGP peers.Total Peers
Number of unavailable BGP peers.Down Peers
Address of each BGP peer.Unconfigured Peers
RIB Summary tab
Name of the RIB group.RIB Name
Total number of prefixes from the peer, bothactive and inactive, that are in the routing table.
Total Prefixes
Number of prefixes received from the EBGPpeers that are active in the routing table.
Active Prefixes
Number of routes received from EBGP peerscurrently inactive because of damping or otherreasons.
Suppressed Prefixes
History of the routes received or suppressed.History Prefixes
Number of routes currently inactive because ofdamping or other reasons. These routes do notappear in the forwarding table and are notexported by routing protocols.
Dumped Prefixes
Number of pending routes.Pending Prefixes
Status of the graceful restart process for thisrouting table: BGP restart is complete, BGPrestart in progress, VPN restart in progress, orVPN restart is complete.
State
BGPNeighbors
Click this button to view the selected BGPneighbor details.
Details
Address of the BGP neighbor.Peer Address
AS number of the peer.Autonomous System
91Copyright © 2011, Juniper Networks, Inc.
Chapter 1: Device and Routing Operations Monitoring

Table 50: Summary of Key BGP Routing Output Fields (continued)
Additional InformationValuesField
Generally, the most common states are Active,which indicates a problem establishing the BGPconnection, and Established, which indicates asuccessful session setup. The other states aretransition states, and BGP sessions normally donot stay in those states for extended periods oftime.
Current state of the BGP session:
• Active—BGP is initiating a TCP connection inan attempt to connect to a peer. If theconnection is successful, BGP sends an openmessage.
• Connect—BGP is waiting for the TCPconnection to become complete.
• Established—The BGP session has beenestablished, and the peers are exchangingBGP update messages.
• Idle—This is the first stage of a connection.BGP is waiting for a Start event.
• OpenConfirm—BGP has acknowledged receiptof an open message from the peer and iswaiting to receive a keepalive or notificationmessage.
• OpenSent—BGP has sent an open messageand is waiting to receive an open messagefrom the peer.
Peer State
Elapsed time since the peering session was lastreset.
Elapsed Time
Description of the BGP session.Description
RelatedDocumentation
Monitoring Overview on page 3•
• Monitoring Interfaces on page 5
• Junos OS CLI Reference
• J Series Services Routers Hardware Guide
• Junos OS Interfaces Command Reference
• Junos OS Interfaces Configuration Guide for Security Devices
• Junos OS Feature Support Reference for SRX Series and J Series Devices
Monitoring Class-of-Service Performance
The J-Web user interface provides information about the class-of-service (CoS)
performance on a device. You can view information about the current status of CoS
components—classifiers, CoS value aliases, red drop profiles, forwarding classes, rewrite
rules and scheduler maps. You can also see the interfaces to which these components
are assigned.
In addition, you can display the entire CoS configuration, including system-chosen defaults,
by entering the show class-of-service command.
Copyright © 2011, Juniper Networks, Inc.92
Junos OS Monitoring and Troubleshooting Guide for Security Devices

This section contains the following topics:
• Monitoring CoS Interfaces on page 93
• Monitoring CoS Classifiers on page 94
• Monitoring CoS Value Aliases on page 94
• Monitoring CoS RED Drop Profiles on page 95
• Monitoring CoS Forwarding Classes on page 96
• Monitoring CoS Rewrite Rules on page 97
• Monitoring CoS Scheduler Maps on page 98
Monitoring CoS Interfaces
Purpose Display details about the physical and logical interfaces and the CoS components
assigned to them.
Action SelectMonitor>Class of Service>Interfaces in the J-Web user interface, or enter the
show class-of-service interface interface command.
Table 51 on page 93 summarizes key output fields for CoS interfaces.
Table 51: Summary of Key CoS Interfaces Output Fields
Additional InformationValuesField
To display names of logical interfacesconfigured on this physical interface, clickthe plus sign (+).
Name of a physical interface to which CoScomponents are assigned.
Interface
Name of the scheduler map associated withthis interface.
Scheduler Map
Number of queues you can configure on theinterface.
Queues Supported
Number of queues currently configured.Queues in Use
Name of a logical interface on the physicalinterface, to which CoS components areassigned.
Logical Interface
Category of an object—for example,classifier, scheduler-map, or rewrite.
Object
Name that you have given to an object—forexample, ba-classifier.
Name
Type of an object—for example, dscp, or expfor a classifier.
Type
Index of this interface or the internal indexof a specific object.
Index
93Copyright © 2011, Juniper Networks, Inc.
Chapter 1: Device and Routing Operations Monitoring
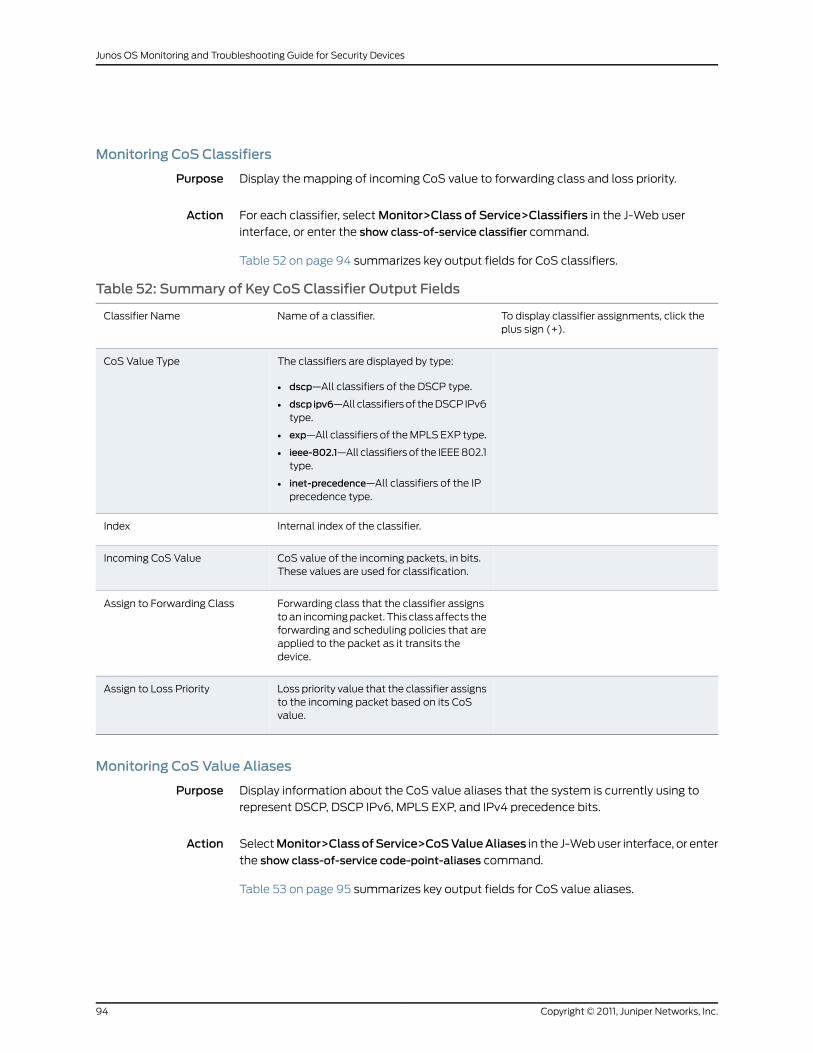
Monitoring CoS Classifiers
Purpose Display the mapping of incoming CoS value to forwarding class and loss priority.
Action For each classifier, selectMonitor>Class of Service>Classifiers in the J-Web user
interface, or enter the show class-of-service classifier command.
Table 52 on page 94 summarizes key output fields for CoS classifiers.
Table 52: Summary of Key CoS Classifier Output Fields
To display classifier assignments, click theplus sign (+).
Name of a classifier.Classifier Name
The classifiers are displayed by type:
• dscp—All classifiers of the DSCP type.
• dscp ipv6—All classifiers of the DSCP IPv6type.
• exp—All classifiers of the MPLS EXP type.
• ieee-802.1—All classifiers of the IEEE 802.1type.
• inet-precedence—All classifiers of the IPprecedence type.
CoS Value Type
Internal index of the classifier.Index
CoS value of the incoming packets, in bits.These values are used for classification.
Incoming CoS Value
Forwarding class that the classifier assignsto an incoming packet. This class affects theforwarding and scheduling policies that areapplied to the packet as it transits thedevice.
Assign to Forwarding Class
Loss priority value that the classifier assignsto the incoming packet based on its CoSvalue.
Assign to Loss Priority
Monitoring CoS Value Aliases
Purpose Display information about the CoS value aliases that the system is currently using to
represent DSCP, DSCP IPv6, MPLS EXP, and IPv4 precedence bits.
Action SelectMonitor>ClassofService>CoSValueAliases in the J-Web user interface, or enter
the show class-of-service code-point-aliases command.
Table 53 on page 95 summarizes key output fields for CoS value aliases.
Copyright © 2011, Juniper Networks, Inc.94
Junos OS Monitoring and Troubleshooting Guide for Security Devices

Table 53: Summary of Key CoS Value Alias Output Fields
Additional InformationValuesField
To display aliases and bit patterns, click theplus sign (+).
Type of the CoS value:
• dscp—Examines Layer 3 packet headersfor IP packet classification.
• dscp ipv6—Examines Layer 3 packetheaders for IPv6 packet classification.
• exp—Examines Layer 2 packet headersfor MPLS packet classification.
• ieee-802.1—Examines Layer 2 packetheader for packet classification.
• inet-precedence—Examines Layer 3packet headers for IP packetclassification.
CoS Value Type
Name given to a set of bits—for example,af11 is a name for 001010 bits.
CoS Value Alias
Set of bits associated with an alias.Bit Pattern
Monitoring CoS RED Drop Profiles
Purpose Display data point information for each CoS random early detection (RED) drop profile
currently on a system.
Action SelectMonitor>ClassofService>REDDropProfiles in the J-Web user interface, or enter
the show class-of-service drop-profile command.
Table 54 on page 95 summarizes key output fields for CoS RED drop profiles.
Table 54: Summary of Key CoS RED Drop Profile Output Fields
Additional InformationValuesField
To display profile values, click the plus sign(+).
Name of the RED drop profile.
A drop profile consists of pairs of valuesbetween 0 and 100, one for queue buffer filllevel and one for drop probability, thatdetermine the relationship between abuffer's fullness and the likelihood it willdrop packets.
RED Drop Profile Name
The x axis represents the queue buffer filllevel, and the y axis represents the dropprobability.
Link to a graph of a RED curve that thesystem uses to determine the dropprobability based on queue buffer fullness.
Graph RED Profile
95Copyright © 2011, Juniper Networks, Inc.
Chapter 1: Device and Routing Operations Monitoring

Table 54: Summary of Key CoS RED Drop Profile Output Fields (continued)
Additional InformationValuesField
Type of a specific drop profile:
• interpolated—The two coordinates (x andy) of the graph are interpolated toproduce a smooth profile.
• segmented—The two coordinates (x andy) of the graph are represented by linefragments to produce a segmentedprofile.
Type
Internal index of this drop profile.Index
Percentage fullness of a buffer queue. Thisvalue is the x coordinate of the RED dropprofile graph.
Fill Level
Drop probability of a packet correspondingto a specific queue buffer fill level. This valueis the y coordinate of the RED drop profilegraph.
Drop Probability
Monitoring CoS Forwarding Classes
Purpose View the current assignment of CoS forwarding classes to queue numbers on the system.
Action SelectMonitor>Class of Service>Forwarding Classes in the J-Web user interface, or
enter the show class-of-service forwarding-class command.
Table 55 on page 97 summarizes key output fields for CoS forwarding classes.
Copyright © 2011, Juniper Networks, Inc.96
Junos OS Monitoring and Troubleshooting Guide for Security Devices

Table 55: Summary of Key CoS Forwarding Class Output Fields
Additional InformationValuesField
Names of forwarding classes assigned toqueue numbers. By default, the followingforwarding classes are assigned to queues0 through 3:
• best-effort—Provides no special CoShandling of packets. Loss priority istypically not carried in a CoS value, andRED drop profiles are more aggressive.
• expedited-forwarding—Provides low loss,low delay, low jitter, assured bandwidth,and end-to-end service.
• assured-forwarding—Provides highassurance for packets within specifiedservice profile. Excess packets aredropped.
• network-control—Packets can be delayedbut not dropped.
Forwarding Class
By default, four queues, 0 through 3, areassigned to forwarding classes.
Queue number corresponding to theforwarding class name.
Queue
Monitoring CoS Rewrite Rules
Purpose Display information about CoS value rewrite rules, which are based on the forwarding
class and loss priority.
Action SelectMonitor>Class of Service>Rewrite Rules in the J-Web user interface, or enter
the show class-of-service rewrite-rules command.
Table 56 on page 97 summarizes key output fields for CoS rewrite rules.
Table 56: Summary of Key CoS Rewrite Rules Output Fields
Additional InformationValuesField
Names of rewrite rules.Rewrite Rule Name
To display forwarding classes, loss priorities,and rewritten CoS values, click the plus sign(+).
Rewrite rule type:
• dscp—For IPv4 DiffServ traffic.
• dscp-ipv6—For IPv6 DiffServ traffic.
• exp—For MPLS traffic.
• ieee-802.1—For Layer 2 traffic.
• inet-precedence—For IPv4 traffic.
CoS Value Type
Internal index for this particular rewrite rule.Index
97Copyright © 2011, Juniper Networks, Inc.
Chapter 1: Device and Routing Operations Monitoring
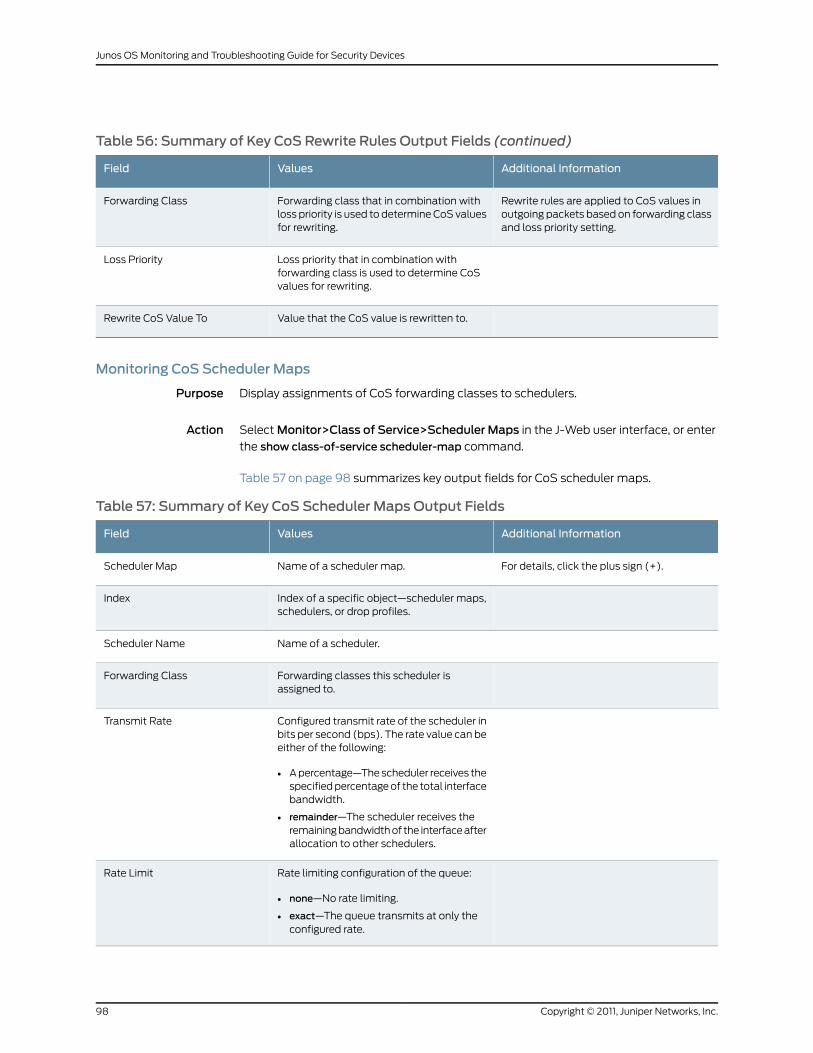
Table 56: Summary of Key CoS Rewrite Rules Output Fields (continued)
Additional InformationValuesField
Rewrite rules are applied to CoS values inoutgoing packets based on forwarding classand loss priority setting.
Forwarding class that in combination withloss priority is used to determine CoS valuesfor rewriting.
Forwarding Class
Loss priority that in combination withforwarding class is used to determine CoSvalues for rewriting.
Loss Priority
Value that the CoS value is rewritten to.Rewrite CoS Value To
Monitoring CoS Scheduler Maps
Purpose Display assignments of CoS forwarding classes to schedulers.
Action SelectMonitor>Class of Service>Scheduler Maps in the J-Web user interface, or enter
the show class-of-service scheduler-map command.
Table 57 on page 98 summarizes key output fields for CoS scheduler maps.
Table 57: Summary of Key CoS Scheduler Maps Output Fields
Additional InformationValuesField
For details, click the plus sign (+).Name of a scheduler map.Scheduler Map
Index of a specific object—scheduler maps,schedulers, or drop profiles.
Index
Name of a scheduler.Scheduler Name
Forwarding classes this scheduler isassigned to.
Forwarding Class
Configured transmit rate of the scheduler inbits per second (bps). The rate value can beeither of the following:
• A percentage—The scheduler receives thespecified percentage of the total interfacebandwidth.
• remainder—The scheduler receives theremaining bandwidth of the interface afterallocation to other schedulers.
Transmit Rate
Rate limiting configuration of the queue:
• none—No rate limiting.
• exact—The queue transmits at only theconfigured rate.
Rate Limit
Copyright © 2011, Juniper Networks, Inc.98
Junos OS Monitoring and Troubleshooting Guide for Security Devices

Table 57: Summary of Key CoS Scheduler Maps Output Fields (continued)
Additional InformationValuesField
Delay buffer size in the queue or the amountof transmit delay (in milliseconds). Thebuffer size can be either of the following:
• A percentage—The buffer is a percentageof the total buffer allocation.
• remainder—The buffer is sized accordingto what remains after other schedulerbuffer allocations.
Buffer Size
Scheduling priority of a queue:
• high—Packets in this queue aretransmitted first.
• low—Packets in this queue aretransmitted last.
• medium-high—Packets in this queue aretransmitted after high-priority packets.
• medium-low—Packets in this queue aretransmitted before low-priority packets.
Priority
Name and index of a drop profile that isassigned to a specific loss priority andprotocol pair.
Drop Profiles
Packet loss priority corresponding to a dropprofile:
• low—Packet has a low loss priority.
• high—Packet has a high loss priority.
• medium-low—Packet has a medium-lowloss priority.
• medium-high—Packet has a medium-highloss priority.
Loss Priority
Transport protocol corresponding to a dropprofile.
Protocol
Name of the drop profile.Drop Profile Name
RelatedDocumentation
Monitoring Overview on page 3•
• Monitoring Interfaces on page 5
• Junos OS CLI Reference
• J Series Services Routers Hardware Guide
• Junos OS Interfaces Command Reference
• Junos OS Interfaces Configuration Guide for Security Devices
99Copyright © 2011, Juniper Networks, Inc.
Chapter 1: Device and Routing Operations Monitoring

• Junos OS Feature Support Reference for SRX Series and J Series Devices
MonitoringMPLS Traffic Engineering Information
This section contains the following topics:
• Monitoring MPLS Interfaces on page 100
• Monitoring MPLS LSP Information on page 100
• Monitoring MPLS LSP Statistics on page 101
• Monitoring RSVP Session Information on page 102
• Monitoring MPLS RSVP Interfaces Information on page 103
MonitoringMPLS Interfaces
Purpose View the interfaces on which MPLS is configured, including operational state and any
administrative groups applied to an interface.
Action SelectMonitor>MPLS>Interfaces in the J-Web user interface, or enter the showmpls
interface command.
Table 58 on page 100 summarizes key output fields in the MPLS interface information
display.
Table 58: Summary of KeyMPLS Interface Information Output Fields
Additional InformationValuesField
Name of the interface on which MPLS isconfigured.
Interface
State of the specified interface: Up or Dn (down).State
Administratively assigned colors of the MPLS linkconfigured on the interface.
Administrative groups
MonitoringMPLS LSP Information
Purpose View all label-switched paths (LSPs) configured on the services router, including all
inbound (ingress), outbound (egress), and transit LSP information.
Action SelectMonitor>MPLS>LSP Information in the J-Web user interface, or enter the show
mpls lsp command.
Table 59 on page 101 summarizes key output fields in the MPLS LSP information display.
Copyright © 2011, Juniper Networks, Inc.100
Junos OS Monitoring and Troubleshooting Guide for Security Devices

Table 59: Summary of KeyMPLS LSP Information Output Fields
Additional InformationValuesField
Information about LSPs on the inbound device.Each session has one line of output.
Ingress LSP
MPLS learns this information by querying RSVP,which holds all the transit and outbound sessioninformation.
Information about the LSPs on the outbounddevice. Each session has one line of output.
Egress LSP
MPLS learns this information by querying RSVP,which holds all the transit and outbound sessioninformation.
Number of LSPs on the transit routers and thestate of these paths.
Transit LSP
Destination (outbound device) of the session.To
Source (inbound device) of the session.From
AdminDn indicates that the LSP is being takendown gracefully.
State of the path. It can beUp,Down, orAdminDn.State
For inbound RSVP sessions, the routing table isthe primary IPv4 table (inet.0). For transit andoutbound RSVP sessions, the routing table is theprimary MPLS table (mpls.0).
Number of active routes (prefixes) installed in therouting table.
Rt
This field is used for inbound LSPs only.Name of the active path: Primary or Secondary.Active Path
This field is used for inbound LSPs only.An asterisk (*) in this column indicates that theLSP is a primary path.
P
Configured name of the LSP.LSPname
This field is used for outbound and transit LSPsonly.
RSVP reservation style. This field consists of twoparts. The first is the number of activereservations. The second is the reservation style,which can be FF (fixed filter),SE (shared explicit),or WF (wildcard filter).
Style
Incoming label for this LSP.Labelin
Outgoing label for this LSP.Labelout
Total number of LSPs displayed for the particulartype—ingress (inbound), egress (outbound), ortransit.
Total
MonitoringMPLS LSP Statistics
Purpose Display statistics for LSP sessions currently active on the device, including the total
number of packets and bytes forwarded through an LSP.
101Copyright © 2011, Juniper Networks, Inc.
Chapter 1: Device and Routing Operations Monitoring

Action SelectMonitor>MPLS>LSPStatistics in the J-Web interface, or enter the showmpls lsp
statistics command.
NOTE: Statistics are not available for LSPson the outbounddevice, becausethe penultimate device in the LSP sets the label to 0. Also, as the packetarrives at the outbound device, the hardware removes its MPLS header andthe packet reverts to being an IPv4packet. Therefore, it is counted as an IPv4packet, not an MPLS packet.
Table 60 on page 102 summarizes key output fields in the MPLS LSP statistics display.
Table 60: Summary of KeyMPLS LSP Statistics Output Fields
Additional InformationValuesField
Information about LSPs on the inbound device.Each session has one line of output.
Ingress LSP
MPLS learns this information by querying RSVP,which holds all the transit and outbound sessioninformation.
Information about the LSPs on the outbounddevice. Each session has one line of output.
Egress LSP
MPLS learns this information by querying RSVP,which holds all the transit and outbound sessioninformation.
Number of LSPs on the transit routers and thestate of these paths.
Transit LSP
Destination (outbound device) of the session.To
Source (inbound device) of the session.From
AdminDn indicates that the LSP is being takendown gracefully.
State of the path: Up, Down, or AdminDn.State
Total number of packets received on the LSP fromthe upstream neighbor.
Packets
Total number of bytes received on the LSP fromthe upstream neighbor.
Bytes
Configured name of the LSP.LSPname
Total number of LSPs displayed for the particulartype—ingress (inbound), egress (outbound), ortransit.
Total
Monitoring RSVP Session Information
Purpose View information about RSVP-signaled LSP sessions currently active on the device,
including inbound (ingress) and outbound (egress) addresses, LSP state, and LSP name.
Copyright © 2011, Juniper Networks, Inc.102
Junos OS Monitoring and Troubleshooting Guide for Security Devices

Action SelectMonitor>MPLS>RSVP Sessions in the J-Web user interface, or enter the show
rsvp session command.
Table 61 on page 103 summarizes key output fields in the RSVP session information display.
Table 61: Summary of Key RSVP Session Information Output Fields
Additional InformationValuesField
Information about inbound RSVP sessions. Eachsession has one line of output.
Ingress LSP
MPLS learns this information by querying RSVP,which holds all the transit and outbound sessioninformation.
Information about outbound RSVP sessions. Eachsession has one line of output.
Egress LSP
MPLS learns this information by querying RSVP,which holds all the transit and outbound sessioninformation.
Information about transit RSVP sessions.Transit LSP
Destination (outbound device) of the session.To
Source (inbound device) of the session.From
AdminDn indicates that the LSP is being takendown gracefully.
State of the path: Up, Down, or AdminDn.State
For inbound RSVP sessions, the routing table isthe primary IPv4 table (inet.0). For transit andoutbound RSVP sessions, the routing table is theprimary MPLS table (mpls.0).
Number of active routes (prefixes) installed in therouting table.
Rt
This field is used for outbound and transit LSPsonly.
RSVP reservation style. This field consists of twoparts. The first is the number of activereservations. The second is the reservation style,which can be FF (fixed filter),SE (shared explicit),or WF (wildcard filter).
Style
Incoming label for this RSVP session.Labelin
Outgoing label for this RSVP session.Labelout
Configured name of the LSP.LSPname
Total number of RSVP sessions displayed for theparticular type—ingress (inbound), egress(outbound), or transit).
Total
MonitoringMPLS RSVP Interfaces Information
Purpose View information about the interfaces on which RSVP is enabled, including the interface
name, total bandwidth through the interface, and total current reserved and reservable
(available) bandwidth on the interface.
103Copyright © 2011, Juniper Networks, Inc.
Chapter 1: Device and Routing Operations Monitoring

Action SelectMonitor>MPLS>RSVP Interfaces in the J-Web user interface, or enter the show
rsvp interface command.
Table 62 on page 104 summarizes key output fields in the RSVP interfaces information
display.
Table 62: Summary of Key RSVP Interfaces Information Output Fields
Additional InformationValuesField
Number of interfaces on which RSVP is active.Each interface has one line of output.
RSVP Interface
Name of the interface.Interface
State of the interface:
• Disabled—No traffic engineering information isdisplayed.
• Down—The interface is not operational.
• Enabled—Displays traffic engineeringinformation.
• Up—The interface is operational.
State
Number of reservations that are actively reservingbandwidth on the interface.
Active resv
User-configured subscription factor.Subscription
Total interface bandwidth, in bits per second(bps).
Static BW
Amount of bandwidth that RSVP is allowed toreserve, in bits per second (bps). It is equal to(static bandwidth X subscription factor).
Available BW
Currently reserved bandwidth, in bits per second(bps).
Reserved BW
Highest bandwidth that has ever been reservedon this interface, in bits per second (bps).
Highwater mark
RelatedDocumentation
Monitoring Overview on page 3•
• Monitoring Interfaces on page 5
• Junos OS CLI Reference
• J Series Services Routers Hardware Guide
• Junos OS Interfaces Command Reference
• Junos OS Interfaces Configuration Guide for Security Devices
• Junos OS Feature Support Reference for SRX Series and J Series Devices
Copyright © 2011, Juniper Networks, Inc.104
Junos OS Monitoring and Troubleshooting Guide for Security Devices

Monitoring PPPoE
Purpose Display the session status for PPPoE interfaces, cumulative statistics for all PPPoE
interfaces on the device, and the PPPoE version configured on the device.
Action SelectMonitor>PPPoE in the J-Web user interface. To view interface-specific properties
in the J-Web interface, select the interface name on the PPPoE page.
Table 63 on page 105 summarizes key output fields in PPPoE displays.
Table 63: Summary of Key PPPoEOutput Fields
Additional InformationValuesField
PPPoE Interfaces
Click the interface name to display PPPoEinformation for the interface.
Name of the PPPoE interface.Interface
State of the PPPoE session on the interface.State
To establish a PPPoE session, first the device actingas a PPPoE client obtains the Ethernet address ofthe PPPoE server or access concentrator, and thenthe client and the server negotiate a unique sessionID. This process is referred to as PPPoE activediscovery and is made up of four steps: initiation,offer, request, and session confirmation. The accessconcentrator generates the session ID for sessionconfirmation and sends it to the PPPoE client in aPPPoE Active Discovery Session-Confirmation(PADS) packet.
Unique session identifier for the PPPoE session.Session ID
Service Name identifies the type of service providedby the access concentrator, such as the name of theInternet service provider (ISP), class, or quality ofservice.
Type of service required from the accessconcentrator.
Service Name
Configured access concentrator name.Configured ACName
Name of the access concentrator.Session AC Names
Media access control (MAC) address of the accessconcentrator.
AC MAC Address
Number of seconds the current PPPoE session hasbeen running.
Session Uptime
Number of seconds to wait before reconnectingafter a PPPoE session is terminated.
Auto-ReconnectTimeout
Number of seconds a PPPoE session can be idlewithout disconnecting.
Idle Timeout
105Copyright © 2011, Juniper Networks, Inc.
Chapter 1: Device and Routing Operations Monitoring

Table 63: Summary of Key PPPoEOutput Fields (continued)
Additional InformationValuesField
Name of the underlying logical Ethernet or ATMinterface on which PPPoE is running—for example,ge-0/0/0.1.
UnderlyingInterface
PPPoE Statistics
Total number of active PPPoE sessions.Active PPPoESessions
Packets sent and received during the PPPoEsession, categorized by packet type and packeterror:
• PADI—PPPoE Active Discovery Initiationpackets.
• PADO—PPPoE Active Discovery Offer packets.
• PADR—PPPoE Active Discovery Requestpackets.
• PADS—PPPoE Active DiscoverySession-Confirmation packets.
• PADT—PPPoE Active Discovery Terminatepackets.
• Service Name Error—Packets for which theService-Name request could not be honored.
• AC System Error—Packets for which the accessconcentrator experienced an error in processingthe host request. For example, the host hadinsufficient resources to create a virtual circuit.
• Generic Error—Packets that indicate anunrecoverable error occurred.
• MalformedPacket—Malformed or short packetsthat caused the packet handler to disregard theframe as unreadable.
• Unknown Packet—Unrecognized packets.
Packet Type
Number of the specific type of packet sent fromthe PPPoE client.
Sent
Number of the specific type of packet received bythe PPPoE client.
Received
Information about the timeouts that occurredduring the PPPoE session.
• PADI—Number of timeouts that occurred forthe PADI packet.
• PADO—Number of timeouts that occurred forthe PADO packet. (This value is always 0 andis not supported.
• PADR—Number of timeouts that occurred forthe PADR packet.
Timeout
Copyright © 2011, Juniper Networks, Inc.106
Junos OS Monitoring and Troubleshooting Guide for Security Devices

Table 63: Summary of Key PPPoEOutput Fields (continued)
Additional InformationValuesField
Number of the timeouts that occurred for PADI,PADO, and PADR packets.
Sent
PPPoE Version
Maximum number of active PPPoE sessions thedevice can support. The default is 256 sessions.
Maximum Sessions
The PPPoE Active Discovery Initiation (PADI) packetis sent to the access concentrator to initiate a PPPoEsession. Typically, the access concentrator respondsto a PADI packet with a PPPoE Active Discovery Offer(PADO) packet. If the access concentrator does notsend a PADO packet, the device sends the PADIpacket again after timeout period is elapsed. ThePADI Resend Timeout doubles for each successivePADI packet sent. For example, if the PADI ResendTimeout is2 seconds, the second PADI packet is sentafter 2 seconds, the third after 4 seconds, the fourthafter 8 seconds, and so on.
Initial time, (in seconds) the device waits to receivea PADO packet for the PADI packet sent—forexample,2 seconds. This timeout doubles for eachsuccessive PADI packet sent.
PADI ResendTimeout
The PPPoE Active Discovery Request (PADR) packetis sent to the access concentrator in response to aPADO packet, and to obtain the PPPoE session ID.Typically, the access concentrator responds to aPADR packet with a PPPoE Active DiscoverySession-Confirmation (PADS) packet, which containsthe session ID. If the access concentrator does notsend a PADS packet, the device sends the PADRpacket again after the PADR Resend Timeout periodis elapsed. The PADR Resend Timeout doubles foreach successive PADR packet sent.
Initial time (in seconds) the device waits to receivea PADS packet for the PADR packet sent. Thistimeout doubles for each successive PADR packetsent.
PADR ResendTimeout
Maximum value (in seconds) that the PADI orPADR resend timer can accept—for example, 64seconds. The maximum value is 64.
Maximum ResendTimeout
Time (in seconds), within which the configuredaccess concentrator must respond.
MaximumConfigured ACTimeout
Alternatively, enter the following CLI commands:
• show pppoe interfaces
• show pppoe statistics
• show pppoe version
You can also view status information about the PPPoE interface by entering the show
interfaces pp0 command in the CLI editor.
107Copyright © 2011, Juniper Networks, Inc.
Chapter 1: Device and Routing Operations Monitoring

RelatedDocumentation
Monitoring Overview on page 3•
• Monitoring Interfaces on page 5
• Monitoring DHCP Client Bindings on page 110
• Junos OS CLI Reference
• J Series Services Routers Hardware Guide
• Junos OS Interfaces Command Reference
• Junos OS Interfaces Configuration Guide for Security Devices
• Junos OS Feature Support Reference for SRX Series and J Series Devices
Monitoring PPP
Purpose Display PPP monitoring information, including PPP address pool information, session
status for PPP interfaces, cumulative statistics for all PPP interfaces, and a summary of
PPP sessions.
NOTE: PPPmonitoring information is available only in the CLI. The J-Webuser interface does not include pages for displaying PPPmonitoringinformation.
Action Enter the following CLI commands:
• show ppp address-pool pool-name
• show ppp interface interface-name
• show ppp statistics
• show ppp summary
RelatedDocumentation
Monitoring Overview on page 3•
• Monitoring Interfaces on page 5
• Junos OS CLI Reference
• J Series Services Routers Hardware Guide
• Junos OS Interfaces Command Reference
• Junos OS Interfaces Configuration Guide for Security Devices
• Junos OS Feature Support Reference for SRX Series and J Series Devices
Monitoring theWANAcceleration Interface
Purpose View status information and traffic statistics for the WAN acceleration interface.
Copyright © 2011, Juniper Networks, Inc.108
Junos OS Monitoring and Troubleshooting Guide for Security Devices

Action SelectMonitor>WANAcceleration in the J-Web user interface, or select
Monitor>Interfaces and select the interface name (wx-slot/0/0). Alternatively, enter
the following CLI command:
[edit]user@host# show interfaces wx-slot/0/0 detail
RelatedDocumentation
Monitoring Overview on page 3•
• Monitoring Interfaces on page 5
• Junos OS CLI Reference
• J Series Services Routers Hardware Guide
• Junos OS Interfaces Command Reference
• Junos OS Interfaces Configuration Guide for Security Devices
• Junos OS Feature Support Reference for SRX Series and J Series Devices
Monitoring DHCP
This section contains the following topics:
• Monitoring DHCP Client Bindings on page 109
• Monitoring DHCP Client Bindings on page 110
Monitoring DHCP Client Bindings
Purpose View information about DHCP client bindings.
Action SelectMonitor>Services>DHCP>Binding in the J-Web user interface, or enter the show
system services dhcp binding command.
Table 64 on page 109 summarizes the key output fields in the DHCP client binding displays.
Table 64: Summary of Key DHCP Client Binding Output Fields
Additional InformationValuesField
List of IP addresses the DHCP server has assigned toclients.
IP Address
Corresponding media access control (MAC) addressof the client.
HardwareAddress
Type of binding assigned to the client: dynamic or static.Type
Date and time the lease expires, or never for leases thatdo not expire.
LeaseExpires at
109Copyright © 2011, Juniper Networks, Inc.
Chapter 1: Device and Routing Operations Monitoring

Monitoring DHCP Client Bindings
Purpose View information about DHCP client bindings.
Action SelectMonitor>Services>DHCP>Binding in the J-Web user interface, or enter the show
system services dhcp binding command.
Table 64 on page 109 summarizes the key output fields in the DHCP client binding displays.
Table 65: Summary of Key DHCP Client Binding Output Fields
Additional InformationValuesField
List of IP addresses the DHCP server has assigned toclients.
IP Address
Corresponding media access control (MAC) addressof the client.
HardwareAddress
Type of binding assigned to the client: dynamic or static.Type
Date and time the lease expires, or never for leases thatdo not expire.
LeaseExpires at
RelatedDocumentation
Monitoring Overview on page 3•
• Monitoring Interfaces on page 5
• Junos OS CLI Reference
• J Series Services Routers Hardware Guide
• Junos OS Interfaces Command Reference
• Junos OS Interfaces Configuration Guide for Security Devices
• Junos OS Feature Support Reference for SRX Series and J Series Devices
Monitoring System LogMessages with the J-Web Event Viewer
Purpose Monitor errors and events that occur on the device.
Action SelectMonitor>Events and Alarms>View Events in the J-Web user interface.
The J-Web View Events page displays the following information about each event:
• Process—System process that generated the error or event.
• Severity— A severity level indicates how seriously the triggering event affects routing
platform functions. Only messages from the facility that are rated at that level or higher
are logged. Possible severities and their corresponding color code are:
Copyright © 2011, Juniper Networks, Inc.110
Junos OS Monitoring and Troubleshooting Guide for Security Devices

• Debug/Info/Notice (Green)—Indicates conditions that are not errors but are of
interest or might warrant special handling.
• Warning (Yellow)—Indicates conditions that warrant monitoring.
• Error (Blue)—Indicates standard error conditions that generally have less serious
consequences than errors in the emergency, alert, and critical levels.
• Critical (Pink)—Indicates critical conditions, such as hard drive errors.
• Alert (Orange)—Indicates conditions that require immediate correction, such as a
corrupted system database.
• Emergency (Red)—Indicates system panic or other conditions that cause the routing
platform to stop functioning.
• Event ID—Unique ID of the error or event. The prefix on each code identifies the
generating software process. The rest of the code indicates the specific event or error.
• Event Description—Displays a more detailed explanation of the message.
• Time—Time that the error or event occurred.
To control which errors and events are displayed in the list, use the following options:
• System Log File—Specify the name of the system log file that records the errors and
events.
• Process—Specify the system processes that generate the events you want to display.
To view all the processes running on your system, enter the show system processes
CLI command.
• Date From—Specify the beginning of the date range that you want to monitor. Set the
date using the calendar pick tool.
• To—Specify the end of the date range that you want to monitor. Set the date using
the calendar pick tool.
• Event ID—Specify the specific ID of the error or event that you want to monitor.
• Description—Enter a description for the errors or events.
• Search—Fetches the errors and events specified in the search criteria.
• Reset—Clears the cache of errors and events that were previously selected.
• Generate Report—Creates an HTML report based on the specified parameters.
RelatedDocumentation
• Monitoring Overview on page 3
• Monitoring Interfaces on page 5
• Junos OS CLI Reference
• J Series Services Routers Hardware Guide
• Junos OS Interfaces Command Reference
111Copyright © 2011, Juniper Networks, Inc.
Chapter 1: Device and Routing Operations Monitoring

• Junos OS Interfaces Configuration Guide for Security Devices
• Junos OS Feature Support Reference for SRX Series and J Series Devices
Copyright © 2011, Juniper Networks, Inc.112
Junos OS Monitoring and Troubleshooting Guide for Security Devices

CHAPTER 2
Security Logs
• System Log Messages Overview on page 113
• Configuring System Log Messages on page 115
System LogMessages Overview
Junos OS supports configuring and monitoring of system log messages (also called syslog
messages). You can configure files to log system messages and also assign attributes,
such as severity levels, to messages. Reboot requests are recorded to the system log
files, which you can view with the show log command.
This section contains the following topics:
• Redundant System Log Server on page 113
• Control Plane and Data Plane Logs on page 113
Redundant System Log Server
Security system logging traffic intended for remote servers is sent through the network
interface ports, which support two simultaneous system log destinations. Each system
logging destination must be configured separately. When two system log destination
addresses are configured, identical logs are sent to both destinations. While two
destinations can be configured on any device that supports the feature, adding a second
destination is primarily useful as a redundant backup for standalone and active/backup
configured chassis cluster deployments.
The following redundant server information is available:
• Facility: cron
• Description: Cron scheduling process
• Severity Level (from highest to lowest severity): debug
• Description: Software debugging messages
Control Plane and Data Plane Logs
Junos OS generates separate log messages to record events that occur on the system’s
control and data planes.
113Copyright © 2011, Juniper Networks, Inc.

• The control plane logs include events that occur on the routing platform. The system
sends control plane events to the eventd process on the Routing Engine, which then
handles the events by using Junos OS policies, by generating system log messages, or
both. You can choose to send control plane logs to a file, user terminal, routing platform
console, or remote machine. To generate control plane logs, use the syslog statement
at the [system] hierarchy level.
• The data plane logs primarily include security events that the system has handled
directly inside the data plane. These system logs are also referred to as security logs.
How the system handles data plane events depends on the device:
• For J Series devices, the most common logging configuration is the Junos OS
configuration in which the system sends data plane events to the eventd process on
the Routing Engine to be processed, formatted, and written to system log files in a
similar manner to control plane events.
• For SRX1400, SRX3400, SRX3600, SRX5600, and SRX5800 devices, the default
logging mode is stream mode. The system streams already-processed data plane
events directly to external log servers, bypassing the Routing Engine. If an event
requires processing, the system sends the event to theeventdprocess on the Routing
Engine.
NOTE: We recommend that only streammode be used for security logson high-end SRX Series devices. We do not recommend using eventmode logging for high-end SRX Series devices. Supported logging ratesapply to streammode only. Logsmay be dropped if you configure eventmode logging on high-end SRX Series devices.
• For SRX100, SRX210, SRX220, SRX240, and SRX650 devices, by default, the system
sends data plane events to theeventdprocess on the Routing Engine to be processed,
formatted, and written to system log files in a similar manner to control plane events.
RelatedDocumentation
Setting the System to Send All Log Messages Through eventd on page 115•
• Setting the System to Stream Security Logs Through Revenue Ports on page 115
• Sending System Log Messages to a File on page 116
• Junos OS System Log Messages Reference
• Junos OS Security Configuration Guide
• Junos OS Feature Support Reference for SRX Series and J Series Devices
Copyright © 2011, Juniper Networks, Inc.114
Junos OS Monitoring and Troubleshooting Guide for Security Devices

Configuring System LogMessages
This section contains the following topics:
• Setting the System to Send All Log Messages Through eventd on page 115
• Setting the System to Stream Security Logs Through Revenue Ports on page 115
• Sending System Log Messages to a File on page 116
Setting the System to Send All LogMessages Through eventd
The eventd process of logging configuration is most commonly used for Junos OS. In this
configuration, control plane logs and data plane, or security, logs are forwarded from the
data plane to the Routing Engine control plane rtlogd process. The rtlogd process then
either forwards syslog or sd-syslog-formatted logs to the eventd process or the
WELF-formatted logs to the external or remote WELF log collector.
To send all log messages through eventd:
1. Set the eventd process to handle security logs and send them to a remote server.
{primary:node0}user@host> set security logmode event
2. Configure the server that will receive the system log messages.
{primary:node0}user@host> set system syslog host hostname
where hostname is the fully qualified hostname or IP address of the server that will
receive the logs.
NOTE: Tosendduplicate logs toasecondremoteserver, repeat thecommandwith a new fully qualified hostname or IP address of a second server.
If your deployment is an active/active chassis cluster, you can also configuresecurity logging on the active node to be sent to separate remote servers toachieve logging redundancy.
To rename or redirect one of the logging configurations, you need to delete and recreate
it. To delete a configuration:
{primary:node0}user@host> delete security logmode event hostname
Setting the System to StreamSecurity Logs Through Revenue Ports
You can increase the number of data plane, or security, logs that are sent by modifying
the manner in which they are sent. When the logging mode is set to stream, security logs
generated in the data plane are streamed out a revenue traffic port directly to a remote
server.
115Copyright © 2011, Juniper Networks, Inc.
Chapter 2: Security Logs

To use the stream mode, enter the following commands:
{primary:node0}user@host> set security logmode source-addressuser@host> set security logmode streamuser@host>setsecurity logstreamstreamname format[syslog|sd-syslog|welf]category[all|content-security] host ipaddr
where source-address is the IP address of the source machine; syslog,sd-syslog (structured
system logging messages) andwelf are the logging formats; all and content-security are
the categories of logging; and ipaddr is the IP address of the server to which the logs will
be streamed.
NOTE: WELF logsmust be streamed through a revenue port because theeventd process does not recognize theWELF format. The category must be
set to content-security. For example:
{primary:node0}user@host> set security log stream securitylog1 format welf categorycontent-security host 10.121.23.5
To send duplicate logs to a second remote server, repeat the command with a new ipaddr.
If your deployment is an active/active chassis cluster, you can also configure security
logging on the active node to be sent to separate remote servers to achieve logging
redundancy.
Sending System LogMessages to a File
You can direct system log messages to a file on the CompactFlash (CF) card. The default
directory for log files is /var/log. To specify a different directory on the CF card, include
the complete pathname.
Create a file named security, and send log messages of the authorization class at the
severity level info to the file.
To set the filename, the facility, and severity level:
{primary:node0}user@host> set file security authorization info
RelatedDocumentation
• System Log Messages Overview on page 113
• Junos OS System Log Messages Reference
• Junos OS Security Configuration Guide
• Junos OS System Basics Configuration Guide
• Junos OS Feature Support Reference for SRX Series and J Series Devices
Copyright © 2011, Juniper Networks, Inc.116
Junos OS Monitoring and Troubleshooting Guide for Security Devices

PART 2
Troubleshooting the Device
• Root Password Recovery on page 119
• Diagnostic Tools on page 123
• Packet Capture for Network Traffic Analysis on page 163
• Debugging For SRX Series Services Gateways on page 177
• RPM Probes for Performance Measurement on page 183
• Alarms on page 207
• Systems Files Management on page 217
117Copyright © 2011, Juniper Networks, Inc.

Copyright © 2011, Juniper Networks, Inc.118
Junos OS Monitoring and Troubleshooting Guide for Security Devices

CHAPTER 3
Root Password Recovery
• Recovering the Root Password for SRX Series Devices on page 119
• Recovering the Root Password for J Series Devices on page 120
Recovering the Root Password for SRX Series Devices
If you forget the root password for an SRX Series device, you can use the password
recovery procedure to reset the root password.
NOTE: You need console access to recover the root password.
To recover the root password for an SRX Series device:
1. Power off the device by pressing the power button on the front panel and reboot the
device.
2. Turn on the power to the management device.
3. Power on the device by pressing the power button on the front panel. Verify that the
POWER LED on the front panel turns green.
The device’s boot sequence on your management device appears on the terminal
emulation screen.
4. When the autoboot completes, press the Spacebar a few times to access the bootstrap
loader prompt.
5. In operational mode, enter boot -s to start up the system in single-user mode.
loader>boot -s
6. Enter recovery to start the root password recovery procedure.
Enter full pathname of shell or 'recovery' for root password recovery or RETURN for/bin/sh: recovery
7. Enter configuration mode in the CLI.
8. Set the root password.
[edit]user@host# set system root-authentication plain-text-password
119Copyright © 2011, Juniper Networks, Inc.
9. Enter the new root password.
New password: juniper1Retype new password:
10. At the second prompt, reenter the new root password.
11. If you are finished configuring the network, commit the configuration.
root@host# commitcommit complete
12. Exit from configuration mode.
13. Exit from operational mode.
14. Enter y to reboot the device.
Reboot the system? [y/n] y
RelatedDocumentation
Recovering the Root Password for J Series Devices on page 120•
• Junos OS System Log Messages Reference
• Junos OS Security Configuration Guide
• Junos OS System Basics Configuration Guide
• Junos OS Feature Support Reference for SRX Series and J Series Devices
Recovering the Root Password for J Series Devices
If you forget the root password for the device, you can use the password recovery
procedure to reset the root password.
NOTE: You need console access to recover the root password.
To recover the root password for a J Series device:
1. Power off the device by pressing the power button on the front panel.
2. Turn off the power to the management device, such as a PC or laptop computer, that
you want to use to access the CLI.
3. Plug one end of the Ethernet rollover cable supplied with the device into the RJ-45 to
DB-9 serial port adapter supplied with the device (see Figure 1 on page 121).
4. Plug the RJ-45 to DB-9 serial port adapter into the serial port on the management
device (see Figure 1 on page 121).
5. Connect the other end of the Ethernet rollover cable to the console port on the device
(see Figure 1 on page 121).
Copyright © 2011, Juniper Networks, Inc.120
Junos OS Monitoring and Troubleshooting Guide for Security Devices

Figure 1: Connecting to the Console Port on the J Series Device
g003
810
6. Turn on the power to the management device.
7. Connect a management device, such as a PC or laptop computer, to the console port
on the device.
8. On the management device, start your asynchronous terminal emulation application
(such as Microsoft Windows Hyperterminal) and select the appropriate COM port to
use (for example, COM1).
9. Configure the port settings as follows:
• Bits per second: 9600
• Data bits: 8
• Parity: None
• Stop bits: 1
• Flow control: None
10. Power on the device by pressing the power button on the front panel. Verify that the
POWER LED on the front panel turns green.
The device’s boot sequence on your management device appears on the terminal
emulation screen.
11. Press the Spacebar to access the device's bootstrap loader command prompt:
Hit [Enter] to boot immediately, or space bar for command prompt.Booting [kernel] in 9 seconds...
12. Enter boot -s to start up the system in single-user mode.
ok boot -s
13. Enter recovery to start the root password recovery procedure.
121Copyright © 2011, Juniper Networks, Inc.
Chapter 3: Root Password Recovery

Enter full pathname of shell or 'recovery' for root password recovery orRETURN for /bin/sh: recovery
14. Enter configuration mode in the CLI.
15. Set the root password.
user@host# set system root-authentication plain-text-password
16. Enter the new root password.
New password: juniper1Retype new password:
17. At the second prompt, reenter the new root password.
18. If you are finished configuring the network, commit the configuration.
root@host# commitcommit complete
19. Exit from configuration mode.
20. Exit from operational mode.
21. At the prompt, enter y to reboot the router.
Reboot the system? [y/n] y
RelatedDocumentation
• Recovering the Root Password for SRX Series Devices on page 119
• Junos OS System Log Messages Reference
• Junos OS Security Configuration Guide
• Junos OS System Basics Configuration Guide
• Junos OS Feature Support Reference for SRX Series and J Series Devices
Copyright © 2011, Juniper Networks, Inc.122
Junos OS Monitoring and Troubleshooting Guide for Security Devices

CHAPTER 4
Diagnostic Tools
• Diagnostic Tools Overview on page 123
• MPLS Connection Checking Overview on page 126
• Understanding Ping MPLS on page 128
• J-Web User Interface Diagnostic Tools on page 129
• CLI Diagnostic Commands on page 141
Diagnostic Tools Overview
Juniper Networks devices support a suite of J-Web tools and CLI operational mode
commands for evaluating system health and performance. Diagnostic tools and
commands test the connectivity and reachability of hosts in the network.
• Use the J-Web Diagnose options to diagnose a device. J-Web results appear in the
browser.
• Use CLI operational mode commands to diagnose a device. CLI command output
appears on the screen of your console or management device, or you can filter the
output to a file.
To use the J-Web user interface and CLI operational tools, you must have the appropriate
access privileges.
This section contains the following topics:
• J-Web Diagnostic Tools on page 123
• CLI Diagnostic Commands on page 124
J-Web Diagnostic Tools
The J-Web diagnostic tools consist of the options that appear when you select
Troubleshoot andMaintain in the task bar. Table 66 on page 123 describes the functions
of the Troubleshoot options.
Table 66: J-Web Interface Troubleshoot Options
FunctionOption
Troubleshoot Options
123Copyright © 2011, Juniper Networks, Inc.

Table 66: J-Web Interface Troubleshoot Options (continued)
FunctionOption
Allows you to ping a remote host. You can configure advanced options for the ping operation.Ping Host
Allows you to ping an MPLS endpoint using various options.PingMPLS
Allows you to trace a route between the device and a remote host. You can configure advanced optionsfor the traceroute operation.
Traceroute
Allows you to capture and analyze router control traffic.Packet Capture
Maintain Options
Allows you to manage log, temporary, and core files on the device.Files
Allows you to upgrade and manage Junos OS packages.Upgrade
Displays a summary of the licenses needed and used for each feature that requires a license. Allows youto add licenses.
Licenses
Allows you to reboot the device at a specified time.Reboot
CLI Diagnostic Commands
The CLI commands available in operational mode allow you to perform the same
monitoring, troubleshooting, and management tasks you can perform with the J-Web
user interface. Instead of invoking the tools through a graphical interface, you use
operational mode commands to perform the tasks.
You can perform certain tasks only through the CLI. For example, you can use themtrace
command to display trace information about a multicast path from a source to a receiver,
which is a feature available only through the CLI.
To view a list of top-level operational mode commands, type a question mark (?) at the
command-line prompt.
At the top level of operational mode are the broad groups of CLI diagnostic commands
listed in Table 67 on page 124.
Table 67: CLI Diagnostic Command Summary
FunctionCommand
Controlling the CLI Environment
Configures the CLI display.set option
Diagnosis and Troubleshooting
Clears statistics and protocol database information.clear
Traces information about multicast paths from source to receiver.mtrace
Copyright © 2011, Juniper Networks, Inc.124
Junos OS Monitoring and Troubleshooting Guide for Security Devices

Table 67: CLI Diagnostic Command Summary (continued)
FunctionCommand
Performs real-time debugging of various Junos OS components, including therouting protocols and interfaces.
monitor
Determines the reachability of a remote network host.ping
Determines the reachability of an MPLS endpoint using various options.pingmpls
Tests the configuration and application of policy filters and AS path regularexpressions.
test
Traces the route to a remote network host.traceroute
Connecting to Other Network Systems
Opens secure shell connections.ssh
Opens Telnet sessions to other hosts on the network.telnet
Management
Copies files from one location on the device to another, from the device to a remotesystem, or from a remote system to the device.
copy
Restarts the various system processes, including the routing protocol, interface,and SNMP processes.
restart option
Performs system-level operations, including stopping and rebooting the deviceand loading Junos OS images.
request
Exits the CLI and starts a UNIX shell.start
Enters configuration mode.configuration
Exits the CLI and returns to the UNIX shell.quit
RelatedDocumentation
MPLS Connection Checking Overview on page 126•
• Understanding Ping MPLS on page 128
• Using the J-Web Ping Host Tool on page 129
• Using the ping Command on page 141
• Junos OS System Basics and Services Command Reference
• Junos OS Routing Protocols and Policies Command Reference
• Junos OS Feature Support Reference for SRX Series and J Series Devices
125Copyright © 2011, Juniper Networks, Inc.
Chapter 4: Diagnostic Tools

MPLS Connection Checking Overview
Use either the J-Web ping MPLS diagnostic tool or the CLI commands pingmpls, ping
mpls l2circuit,pingmpls l2vpn, andpingmpls l3vpn to diagnose the state of label-switched
paths (LSPs), Layer 2 and Layer 3 virtual private networks (VPNs), and Layer 2 circuits.
When you use the ping MPLS feature from a J Series device operating as the inbound
(ingress) node at the entry point of an LSP or VPN, the router sends probe packets into
the LSP or VPN. Based on how the LSP or VPN outbound (egress) node at the remote
endpoint of the connection replies to the probes, you can determine the connectivity of
the LSP or VPN.
Each probe is an echo request sent to the LSP or VPN exit point as an MPLS packet with
a UDP payload. If the outbound node receives the echo request, it checks the contents
of the probe and returns a value in the UDP payload of the response packet. If the J Series
device receives the response packet, it reports a successful ping response.
Responses that take longer than 2 seconds are identified as failed probes.
Table 68 on page 126 summarizes the options for using either the J-Web ping MPLS
diagnostic tool or the CLI pingmpls command to display information about MPLS
connections in VPNs and LSPs.
Table 68: Options for CheckingMPLS Connections
Additional InformationPurposepingmplsCommand
J-Web Ping MPLSTool
When an RSVP-signaled LSP hasseveral paths, the J Series devicesends the ping requests on the paththat is currently active.
Checks the operability of an LSP thathas been set up by the ResourceReservation Protocol (RSVP). The JSeries device pings a particular LSPusing the configured LSP name.
pingmpls rsvpPing RSVP-signaledLSP
When an LDP-signaled LSP hasseveral gateways, the J Series devicesends the ping requests through thefirst gateway.
Ping requests sent to LDP-signaledLSPs use only the master routinginstance.
Checks the operability of an LSP thathas been set up by the LabelDistribution Protocol (LDP). The JSeries device pings a particular LSPusing the forwarding equivalenceclass (FEC) prefix and length.
pingmpls ldpPingLDP-signaledLSP
The J Series device does not test theconnection between a PE device anda customer edge (CE) router.
Checks the operability of theconnections related to a Layer 3 VPN.The J Series device tests whether aprefix is present in a provider edge(PE) device’s VPN routing andforwarding (VRF) table, by means ofa Layer 3 VPN destination prefix.
pingmpls l3vpnPing LSP to Layer 3VPN prefix
Copyright © 2011, Juniper Networks, Inc.126
Junos OS Monitoring and Troubleshooting Guide for Security Devices

Table 68: Options for CheckingMPLS Connections (continued)
Additional InformationPurposepingmplsCommand
J-Web Ping MPLSTool
Checks the operability of theconnections related to a Layer 2 VPN.The J Series device directs outgoingrequest probes out the specifiedinterface.
pingmpls l2vpninterface
Locate LSP usinginterface name
Checks the operability of theconnections related to a Layer 2 VPN.The J series device pings on acombination of the Layer 2 VPNrouting instance name, the local siteidentifier, and the remote siteidentifier, to test the integrity of theLayer 2 VPN circuit (specified by theidentifiers) between the inbound andoutbound PE routers.
pingmpls l2vpninstance
Instance to which thisconnection belongs
Checks the operability of the Layer 2circuit connections. The J Seriesdevice directs outgoing requestprobes out the specified interface.
pingmpls l2circuitinterface
Locate LSP frominterface name
Checks the operability of the Layer 2circuit connections. The J Seriesdevice pings on a combination of theIPv4 prefix and the virtual circuitidentifier on the outbound PE router,testing the integrity of the Layer 2circuit between the inbound andoutbound PE routers.
pingmpls l2circuitvirtual-circuit
Locate LSP fromvirtual circuitinformation
Checks the operability of an LSPendpoint. The J Series device pingsan LSP endpoint using either an LDPFEC prefix or an RSVP LSP endpointaddress.
pingmplslsp-end-point
Ping end point of LSP
RelatedDocumentation
Diagnostic Tools Overview on page 123•
• Understanding Ping MPLS on page 128
• Using the J-Web Ping Host Tool on page 129
• Using the ping Command on page 141
• Junos OS System Basics and Services Command Reference
• Junos OS Routing Protocols and Policies Command Reference
• Junos OS Feature Support Reference for SRX Series and J Series Devices
127Copyright © 2011, Juniper Networks, Inc.
Chapter 4: Diagnostic Tools

Understanding PingMPLS
Before using the ping MPLS feature, make sure that the receiving interface on the VPN
or LSP remote endpoint has MPLS enabled, and that the loopback interface on the
outbound node is configured as 127.0.0.1. The source address for MPLS probes must be
a valid address on the J Series device.
This section includes the following topics:
• MPLS Enabled on page 128
• Loopback Address on page 128
• Source Address for Probes on page 128
MPLS Enabled
To process ping MPLS requests, the remote endpoint of the VPN or LSP must be
configured appropriately. You must enable MPLS on the receiving interface of the
outbound node for the VPN or LSP. If MPLS is not enabled, the remote endpoint drops
the incoming request packets and returns an “ICMP host unreachable” message to the
J Series device.
Loopback Address
The loopback address (lo0) on the outbound node must be configured as 127.0.0.1. If
this interface address is not configured correctly, the outbound node does not have this
forwarding entry. It drops the incoming request packets and returns a “host unreachable”
message to the J Series device.
Source Address for Probes
The source IP address you specify for a set of probes must be an address configured on
one of the J Series device interfaces. If it is not a valid J Series device address, the ping
request fails with the error message “Can't assign requested address.”
RelatedDocumentation
Diagnostic Tools Overview on page 123•
• MPLS Connection Checking Overview on page 126
• Using the J-Web Ping Host Tool on page 129
• Using the J-Web Ping MPLS Tool on page 131
• Using the ping Command on page 141
• Junos OS Interfaces Configuration Guide for Security Devices
• Junos OS Feature Support Reference for SRX Series and J Series Devices
Copyright © 2011, Juniper Networks, Inc.128
Junos OS Monitoring and Troubleshooting Guide for Security Devices

J-Web User Interface Diagnostic Tools
This section contains the following topics:
• Using the J-Web Ping Host Tool on page 129
• J-Web Ping Host Results and Output Summary on page 130
• Using the J-Web Ping MPLS Tool on page 131
• J-Web Ping MPLS Results and Output Summary on page 134
• Using the J-Web Traceroute Tool on page 135
• J-Web Traceroute Results and Output Summary on page 136
• Using the J-Web Packet Capture Tool on page 137
• J-Web Packet Capture Results and Output Summary on page 140
Using the J-Web Ping Host Tool
You can ping a host to verify that the host can be reached over the network. The output
is useful for diagnosing host and network connectivity problems. The J Series device
sends a series of ICMP echo (ping) requests to a specified host and receives ICMP echo
responses.
Alternatively, you can use the CLI ping command. (See “Using the ping Command” on
page 141.)
To use the ping host tool:
1. Select Troubleshoot>Ping Host from the task bar.
2. Next to Advanced options, click the expand icon.
3. Enter information into the Ping Host page (see Table 69 on page 129).
Table 69: J-Web Ping Host Field Summary
Your ActionFunctionField
Type the hostname or IP address of the host to ping.Identifies the host to ping.
This is the only required field.
Remote Host
Advanced Options
• Suppress the display of the hop hostnames byselecting the check box.
• Display the hop hostnames by clearing the checkbox.
Determines whether to display hostnames of thehops along the path.
Don't ResolveAddresses
Select the interface on which ping requests are sentfrom the list. If you select any, the ping requests aresent on all interfaces.
Specifies the interface on which the ping requestsare sent.
Interface
Select the number of ping requests to send from thelist.
Specifies the number of ping requests to send.Count
129Copyright © 2011, Juniper Networks, Inc.
Chapter 4: Diagnostic Tools

Table 69: J-Web Ping Host Field Summary (continued)
Your ActionFunctionField
• Set the DF bit by selecting the check box.
• Clear the DF bit by clearing the check box.
Specifies the Don't Fragment (DF) bit in the IP headerof the ping request packet.
Don't Fragment
• Record and display the path of the packet byselecting the check box.
• Suppress the recording and display of the path ofthe packet by clearing the check box.
Sets the record route option in the IP header of theping request packet. The path of the ping requestpacket is recorded within the packet and displayedin the main pane.
Record Route
Select the decimal value of the TOS field from thelist.
Specifies the type-of-service (TOS) value in the IPheader of the ping request packet.
Type-of-Service
Select the routing instance name from the list.Names the routing instance for the ping attempt.Routing Instance
Select the interval from the list.Specifies the interval, in seconds, between thetransmission of each ping request.
Interval
Type the size, in bytes, of the packet. The size canbe from 0 through 65,468. The device adds 8 bytesof ICMP header to the size.
Specifies the size of the ping request packet.Packet Size
Type the source IP address.Specifies the source address of the ping requestpacket.
Source Address
Select the TTL from the list.Specifies the time-to-live (TTL) hop count for theping request packet.
Time-to-Live
• Bypass the routing table and send the pingrequests to hosts on the specified interface onlyby selecting the check box.
• Route the ping requests using the routing table byclearing the check box.
Determines whether ping requests are routed bymeans of the routing table.
If the routing table is not used, ping requests are sentonly to hosts on the interface specified in theInterface box. If the host is not on that interface, pingresponses are not sent.
Bypass Routing
4. Click Start.
The results of the ping operation appear in the main pane. If no options are specified,
each ping response is in the following format:
bytes bytes from ip-address: icmp_seq=number ttl=number time=time
5. You can stop the ping operation before it is complete by clicking OK.
J-Web Ping Host Results and Output Summary
Table 70 on page 131 summarizes the output in the ping host display.
Copyright © 2011, Juniper Networks, Inc.130
Junos OS Monitoring and Troubleshooting Guide for Security Devices

Table 70: Ping Host Results and Output
DescriptionPing Host Result
• bytes —Size of ping response packet, which is equal to the value you entered inthe Packet Size box, plus 8.
• ip-address—IP address of destination host that sent the ping response packet.
bytes bytes from ip-address
number—Sequence Number field of the ping response packet. You can use this valueto match the ping response to the corresponding ping request.
icmp_seq=0
icmp_seq=number
number—Time-to-live hop-count value of the ping response packet.ttl=number
number—Number of ping requests (probes) sent to host.number packets transmitted
percentage—Number of ping responses divided by the number of ping requests,specified as a percentage.
percentage packet loss
• min-time—Minimum round-trip time (see time=time field in this table).
• avg-time—Average round-trip time.
• max-time—Maximum round-trip time.
• std-dev—Standard deviation of the round-trip times.
round-tripmin/avg/max/stddev =min-time/avg-time/max-time/std-devms
If the device does not receive ping responses from the destination host (the output shows
a packet loss of 100 percent), one of the following explanations might apply:
• The host is not operational.
• There are network connectivity problems between the device and the host.
• The host might be configured to ignore ICMP echo requests.
• The host might be configured with a firewall filter that blocks ICMP echo requests or
ICMP echo responses.
• The size of the ICMP echo request packet exceeds the MTU of a host along the path.
• The value you selected in the Time-to-Live box was less than the number of hops in
the path to the host, in which case the host might reply with an ICMP error message.
Using the J-Web PingMPLS Tool
Before using the ping MPLS feature, make sure that the receiving interface on the VPN
or LSP remote endpoint has MPLS enabled, and that the loopback interface on the
outbound node is configured as 127.0.0.1. The source address for MPLS probes must be
a valid address on the J Series device.
To use the ping MPLS tool:
1. Select Troubleshoot>PingMPLS from the task bar.
2. Next to the ping MPLS option you want to use, click the expand icon.
3. Enter information into the Ping MPLS page (see Table 71 on page 132).
131Copyright © 2011, Juniper Networks, Inc.
Chapter 4: Diagnostic Tools
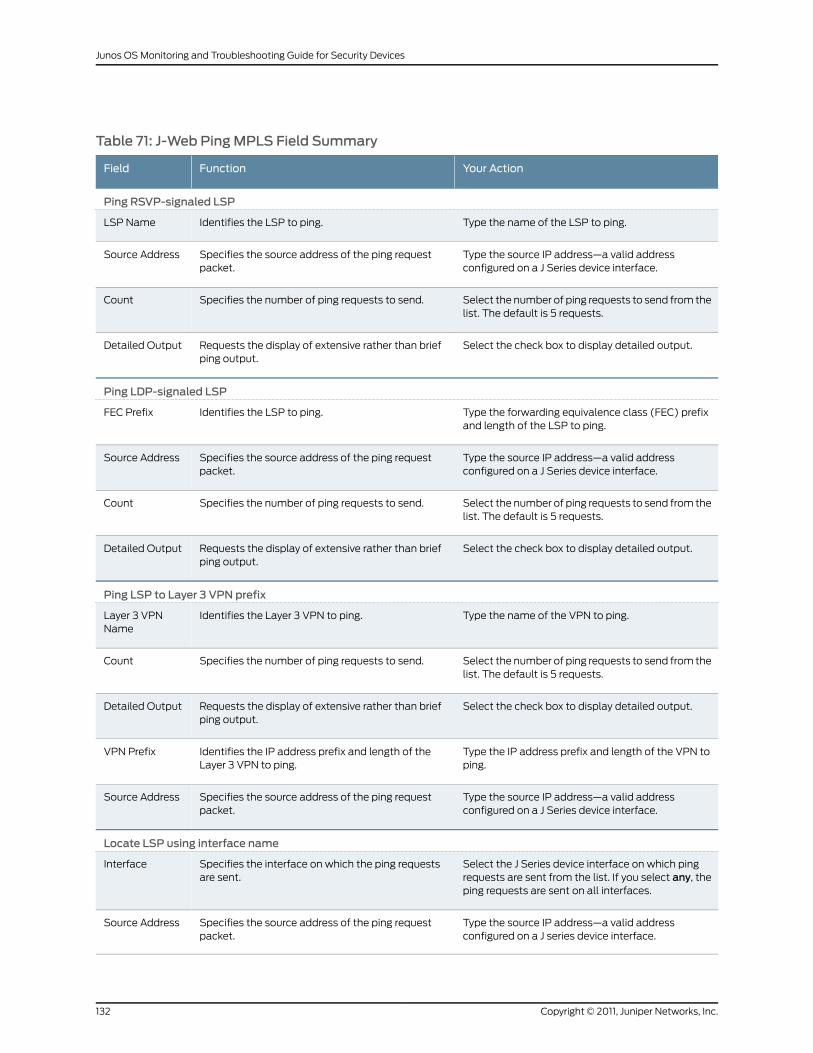
Table 71: J-Web PingMPLS Field Summary
Your ActionFunctionField
Ping RSVP-signaled LSP
Type the name of the LSP to ping.Identifies the LSP to ping.LSP Name
Type the source IP address—a valid addressconfigured on a J Series device interface.
Specifies the source address of the ping requestpacket.
Source Address
Select the number of ping requests to send from thelist. The default is 5 requests.
Specifies the number of ping requests to send.Count
Select the check box to display detailed output.Requests the display of extensive rather than briefping output.
Detailed Output
Ping LDP-signaled LSP
Type the forwarding equivalence class (FEC) prefixand length of the LSP to ping.
Identifies the LSP to ping.FEC Prefix
Type the source IP address—a valid addressconfigured on a J Series device interface.
Specifies the source address of the ping requestpacket.
Source Address
Select the number of ping requests to send from thelist. The default is 5 requests.
Specifies the number of ping requests to send.Count
Select the check box to display detailed output.Requests the display of extensive rather than briefping output.
Detailed Output
Ping LSP to Layer 3 VPN prefix
Type the name of the VPN to ping.Identifies the Layer 3 VPN to ping.Layer 3 VPNName
Select the number of ping requests to send from thelist. The default is 5 requests.
Specifies the number of ping requests to send.Count
Select the check box to display detailed output.Requests the display of extensive rather than briefping output.
Detailed Output
Type the IP address prefix and length of the VPN toping.
Identifies the IP address prefix and length of theLayer 3 VPN to ping.
VPN Prefix
Type the source IP address—a valid addressconfigured on a J Series device interface.
Specifies the source address of the ping requestpacket.
Source Address
Locate LSP using interface name
Select the J Series device interface on which pingrequests are sent from the list. If you select any, theping requests are sent on all interfaces.
Specifies the interface on which the ping requestsare sent.
Interface
Type the source IP address—a valid addressconfigured on a J series device interface.
Specifies the source address of the ping requestpacket.
Source Address
Copyright © 2011, Juniper Networks, Inc.132
Junos OS Monitoring and Troubleshooting Guide for Security Devices

Table 71: J-Web PingMPLS Field Summary (continued)
Your ActionFunctionField
Select the number of ping requests to send from thelist. The default is 5 requests.
Specifies the number of ping requests to send.Count
Select the check box to display detailed output.Requests the display of extensive rather than briefping output.
Detailed Output
Instance to which this connection belongs
Type the name of the VPN to ping.Identifies the Layer 2 VPN to ping.Layer 2VPNName
Type the remote site identifier for the VPN.Specifies the remote site identifier of the Layer 2 VPNto ping.
Remote SiteIdentifier
Type the source IP address—a valid addressconfigured on a J Series device interface.
Specifies the source address of the ping requestpacket.
Source Address
Type the local site identifier for the VPN.Specifies the local site identifier of the Layer 2 VPNto ping.
Local SiteIdentifier
Select the number of ping requests to send from thelist. The default is 5 requests.
Specifies the number of ping requests to send.Count
Select the check box to display detailed output.Requests the display of extensive rather than briefping output.
Detailed Output
Locate LSP from interface name
Select the J Series device interface on which pingrequests are sent from the list. If you select any, theping requests are sent on all interfaces.
Specifies the interface on which the ping requestsare sent.
Interface
Type the source IP address—a valid addressconfigured on a J Series device interface.
Specifies the source address of the ping requestpacket.
Source Address
Select the number of ping requests to send from thelist. The default is 5 requests.
Specifies the number of ping requests to send.Count
Select the check box to display detailed output.Requests the display of extensive rather than briefping output.
Detailed Output
Locate LSP from virtual circuit information
Type the IP address of the remote neighbor withinthe virtual circuit.
Identifies the remote neighbor (PE device) withinthe virtual circuit to ping.
RemoteNeighbor
Type the virtual circuit identifier for the Layer 2 circuit.Specifies the virtual circuit identifier for the Layer 2circuit to ping.
Circuit Identifier
Type the source IP address—a valid addressconfigured on a J Series device interface.
Specifies the source address of the ping requestpacket.
Source Address
133Copyright © 2011, Juniper Networks, Inc.
Chapter 4: Diagnostic Tools

Table 71: J-Web PingMPLS Field Summary (continued)
Your ActionFunctionField
Select the number of ping requests to send from thelist.
Specifies the number of ping requests to send.Count
Select the check box to display detailed output.Requests the display of extensive rather than briefping output.
Detailed Output
Ping end point of LSP
Type either the LDP FEC prefix and length or theRSVP LSP endpoint address for the LSP to ping.
Identifies the LSP endpoint to ping.VPN Prefix
Type the source IP address—a valid addressconfigured on a J Series device interface.
Specifies the source address of the ping requestpacket.
Source Address
Select the number of ping requests to send from thelist.
Specifies the number of ping requests to send.Count
Select the check box to display detailed output.Requests the display of extensive rather than briefping output.
Detailed Output
4. Click Start.
5. You can stop the ping operation before it is complete by clicking OK.
J-Web PingMPLS Results and Output Summary
Table 72 on page 134 summarizes the output in the ping MPLS display.
Table 72: J-Web PingMPLS Results and Output Summary
DescriptionField
Echo reply was received.Exclamation point (!)
Echo reply was not received within the timeout period.Period (.)
Echo reply was received with an error code. Errored packets are not counted in thereceived packets count and are accounted for separately.
x
number—Number of ping requests (probes) sent to a host.number packets transmitted
number—Number of ping responses received from a host.number packets received
percentage—Number of ping responses divided by the number of ping requests, specifiedas a percentage.
percentage packet loss
For Layer 2 circuits only, the number of milliseconds required for the ping packet toreach the destination. This value is approximate, because the packet has to reach theRouting Engine.
time
Copyright © 2011, Juniper Networks, Inc.134
Junos OS Monitoring and Troubleshooting Guide for Security Devices

If the device does not receive ping responses from the destination host (the output shows
a packet loss of 100 percent), one of the following explanations might apply:
• The host is not operational.
• There are network connectivity problems between the device and the host.
• The host might be configured to ignore echo requests.
• The host might be configured with a firewall filter that blocks echo requests or echo
responses.
• The size of the echo request packet exceeds the MTU of a host along the path.
• The outbound node at the remote endpoint is not configured to handle MPLS packets.
• The remote endpoint's loopback address is not configured to 127.0.0.1.
Using the J-Web Traceroute Tool
You can use the traceroute diagnostic tool to display a list of devices between the device
and a specified destination host. The output is useful for diagnosing a point of failure in
the path from the device to the destination host, and addressing network traffic latency
and throughput problems.
The device generates the list of devices by sending a series of ICMP traceroute packets
in which the time-to-live (TTL) value in the messages sent to each successive device is
incremented by 1. (The TTL value of the first traceroute packet is set to 1.) In this manner,
each device along the path to the destination host replies with a Time Exceeded packet
from which the source IP address can be obtained.
To use the traceroute tool:
1. Select Troubleshoot>Traceroute.
2. Next to Advanced options, click the expand icon.
3. Enter information into the Traceroute page (see Table 73 on page 135).
Table 73: Traceroute Field Summary
Your ActionFunctionField
Type the hostname or IP address of the destinationhost.
Identifies the destination host of the traceroute.
The Remote Host field is the only required field.
Remote Host
Advanced Options
• Suppress the display of the hop hostnames byselecting the check box.
• Display the hop hostnames by clearing the checkbox.
Determines whether hostnames of the hops alongthe path are displayed, in addition to IP addresses.
Don't ResolveAddresses
Type the gateway IP address.Specifies the IP address of the gateway to routethrough.
Gateway
135Copyright © 2011, Juniper Networks, Inc.
Chapter 4: Diagnostic Tools

Table 73: Traceroute Field Summary (continued)
Your ActionFunctionField
Type the source IP address.Specifies the source address of the outgoingtraceroute packets.
Source Address
• Bypass the routing table and send the traceroutepackets to hosts on the specified interface onlyby selecting the check box.
• Route the traceroute packets by means of therouting table bu clearing the check box.
Determines whether traceroute packets are routedby means of the routing table.
If the routing table is not used, traceroute packetsare sent only to hosts on the interface specified inthe Interface box. If the host is not on that interface,traceroute responses are not sent.
Bypass Routing
Select the interface on which traceroute packets aresent from the list. If you select any, the tracerouterequests are sent on all interfaces.
Specifies the interface on which the traceroutepackets are sent.
Interface
Select the TTL from the list.Specifies the maximum time-to-live (TTL) hop countfor the traceroute request packet.
Time-to-Live
Select the decimal value of the TOS field from thelist.
Specifies the type-of-service (TOS) value to includein the IP header of the traceroute request packet.
Type-of-Service
• Display the AS numbers by selecting the checkbox.
• Suppress the display of the AS numbers byclearing the check box.
Determines whether the autonomous system (AS)number of each intermediate hop between thedevice and the destination host is displayed.
Resolve ASNumbers
4. Click Start.
The results of the traceroute operation are displayed in the main pane. If no options
are specified, each line of the traceroute display is in the following format:
hop-number host (ip-address) [as-number]time1 time2 time3
The device sends a total of three traceroute packets to each router along the path
and the round-trip time for each traceroute operation appears. If the device times out
before receiving aTimeExceededmessage, an asterisk (*) appears for that round-trip
time.
5. You can stop the traceroute operation before it is complete by clicking OKwhile the
results of the traceroute operation appear.
J-Web Traceroute Results and Output Summary
Table 74 on page 136 summarizes the output in the traceroute display.
Table 74: J-Web Traceroute Results and Output Summary
DescriptionField
Number of the hop (device) along the path.hop-number
Copyright © 2011, Juniper Networks, Inc.136
Junos OS Monitoring and Troubleshooting Guide for Security Devices

Table 74: J-Web Traceroute Results and Output Summary (continued)
DescriptionField
Hostname, if available, or IP address of the device. If the Don't Resolve Addresses check box is selected,the hostname does not appear.
host
IP address of the device.ip-address
AS number of the device.as-number
Round-trip time between the sending of the first traceroute packet and the receiving of the correspondingTime Exceeded packet from that particular device.
time1
Round-trip time between the sending of the second traceroute packet and the receiving of the correspondingTime Exceeded packet from that particular device.
time2
Round-trip time between the sending of the third traceroute packet and the receiving of the correspondingTime Exceeded packet from that particular device.
time3
If the device does not display the complete path to the destination host, one of the
following explanations might apply:
• The host is not operational.
• There are network connectivity problems between the device and the host.
• The host, or a router along the path, might be configured to ignore ICMP traceroute
messages.
• The host, or a device along the path, might be configured with a firewall filter that
blocks ICMP traceroute requests or ICMP time exceeded responses.
• The value you selected in the Time Exceeded box was less than the number of hops
in the path to the host. In this case, the host might reply with an ICMP error message.
Using the J-Web Packet Capture Tool
You can use the J-Web packet capture diagnostic tool when you need to quickly capture
and analyze router control traffic on a device. Packet capture on the J-Web user interface
allows you to capture traffic destined for, or originating from, the Routing Engine. You
can use the J-Web packet capture tool to compose expressions with various matching
criteria to specify the packets that you want to capture. You can either choose to decode
and view the captured packets in the J-Web user interface as they are captured, or save
the captured packets to a file and analyze them offline using packet analyzers such as
Ethereal. The J-Web packet capture tool does not capture transient traffic.
To capture transient traffic and entire IPv4 data packets for offline analysis, you must
configure packet capture with the J-Web user interface or CLI configuration editor.
To use J-Web packet capture:
137Copyright © 2011, Juniper Networks, Inc.
Chapter 4: Diagnostic Tools

1. Select Troubleshoot>Packet Capture.
2. Enter information into the Packet Capture page (see Table 75 on page 138). The sample
configuration captures the next 10 TCP packets originating from the IP address
10.1.40.48 on port 23 and passing through the Gigabit Ethernet interface ge-0/0/0.
3. Save the captured packets to a file, or specify other advanced options by clicking the
expand icon next to Advanced options.
4. Click Start.
The captured packet headers are decoded and appear in the Packet Capture display.
5. Do one of the following:
• To stop capturing the packets and stay on the same page while the decoded packet
headers are being displayed, click Stop Capturing.
• To stop capturing packets and return to the Packet Capture page, click OK.
Table 75: Packet Capture Field Summary
Your ActionFunctionField
Select an interface from the list—for example,ge-0/0/0.
Specifies the interface on which the packets arecaptured.
If you select default, packets on the Ethernetmanagement port 0 are captured.
Interface
Select Detail from the list.Specifies the extent of details to be displayed for thepacket headers.
• Brief—Displays the minimum packet headerinformation. This is the default.
• Detail—Displays packet header information inmoderate detail.
• Extensive—Displays the maximum packet headerinformation.
Detail level
Select the number of packets to be captured fromthe list—for example, 10.
Specifies the number of packets to be captured.Values range from 1 to 1000. Default is 10. Packetcapture stops capturing packets after this numberis reached.
Packets
Select address-matching criteria. For example:
1. From the Direction list, select source.
2. From the Type list, select host.
3. In the Address box, type 10.1.40.48.
4. Click Add.
Specifies the addresses to be matched for capturingthe packets using a combination of the followingparameters:
• Direction—Matches the packet headers for IPaddress, hostname, or network address of thesource, destination or both.
• Type—Specifies if packet headers are matchedfor host address or network address.
You can add multiple entries to refine the matchcriteria for addresses.
Addresses
Copyright © 2011, Juniper Networks, Inc.138
Junos OS Monitoring and Troubleshooting Guide for Security Devices

Table 75: Packet Capture Field Summary (continued)
Your ActionFunctionField
Select a protocol from the list—for example, tcp.Matches the protocol for which packets are captured.You can choose to capture TCP, UDP, or ICMPpackets or a combination of TCP, UDP, and ICMPpackets.
Protocols
Select a direction and a port. For example:
1. From the Type list, select src.
2. In the Port box, type 23.
Matches packet headers containing the specifiedsource or destination TCP or UDP port number orport name.
Ports
Advanced Options
• Display absolute TCP sequence numbers in thepacket headers by selecting this check box.
• Stop displaying absolute TCP sequence numbersin the packet headers by clearing this check box.
Specifies that absolute TCP sequence numbers areto be displayed for the packet headers.
Absolute TCPSequence
• Include link-layer packet headers while capturingpackets, by selecting this check box.
• Exclude link-layer packet headers while capturingpackets by clearing this check box.
Specifies that link-layer packet headers to display.Layer 2 Headers
• Read all packets that reach the interface byselecting this check box.
• Read only packets addressed to the interface byclearing this check box.
Specifies not to place the interface in promiscuousmode, so that the interface reads only packetsaddressed to it.
In promiscuous mode, the interface reads everypacket that reaches it.
Non-Promiscuous
• Display the packet headers in hexadecimal formatby selecting this check box.
• Stop displaying the packet headers in hexadecimalformat by clearing this check box.
Specifies that packet headers, except link-layerheaders, are to be displayed in hexadecimal format.
Display Hex
• Display the packet headers in ASCII andhexadecimal formats by selecting this check box.
• Stop displaying the packet headers in ASCII andhexadecimal formats by clearing this check box.
Specifies that packet headers are to be displayed inhexadecimal and ASCII format.
Display ASCIIand Hex
Enter match conditions in expression format ormodify the expression composed from the matchconditions you specified for Addresses, Protocols,and Ports. If you change the match conditionsspecified for Addresses, Protocols, and Ports again,packet capture overwrites your changes with thenew match conditions.
Specifies the match condition for the packets tocapture.
The match conditions you specify for Addresses,Protocols, and Ports appear in expression format inthis field.
HeaderExpression
Type the number of bytes you want to capture foreach packet header—for example, 256.
Specifies the number of bytes to be displayed foreach packet. If a packet header exceeds this size,the display is truncated for the packet header. Thedefault value is 96 bytes.
Packet Size
139Copyright © 2011, Juniper Networks, Inc.
Chapter 4: Diagnostic Tools

Table 75: Packet Capture Field Summary (continued)
Your ActionFunctionField
• Prevent packet capture from resolving IPaddresses to hostnames by selecting this checkbox.
• Resolve IP addresses into hostnames by clearingthis check box.
Specifies that IP addresses are not to be resolvedinto hostnames in the packet headers displayed.
Don't ResolveAddresses
• Stop displaying timestamps in the capturedpacket headers by selecting this check box.
• Display the timestamp in the captured packetheaders by clearing this check box.
Suppresses the display of packet headertimestamps.
No Timestamp
• Save the captured packet headers to a file byselecting this check box.
• Decode and display the packet headers on theJ-Web page by clearing this check box.
Writes the captured packets to a file in PCAP formatin /var/tmp. The files are named with the prefixjweb-pcap and the extension .pcap.
If you select this option, the decoded packet headersdo not appear on the packet capture page.
Write PacketCapture File
J-Web Packet Capture Results and Output Summary
Table 76 on page 140 summarizes the output in the packet capture display.
Table 76: J-Web Packet Capture Results and Output Summary
DescriptionField
Time when the packet was captured. The timestamp 00:45:40.823971 means 00 hours (12.00 a.m.), 45minutes, and 40.823971 seconds.
NOTE: The time displayed is local time.
timestamp
Direction of the packet. Specifies whether the packet originated from the Routing Engine (Out), or wasdestined for the Routing Engine (In).
direction
Protocol for the packet.
In the sample output, IP indicates the Layer 3 protocol.
protocol
Hostname, if available, or IP address and the port number of the packet's origin. If the Don't ResolveAddresses check box is selected, only the IP address of the source displays.
NOTE: When a string is defined for the port, the packet capture output displays the string instead of theport number.
source address
Hostname, if available, or IP address of the packet's destination with the port number. If the Don't ResolveAddresses check box is selected, only the IP address of the destination and the port appear.
NOTE: When a string is defined for the port, the packet capture output displays the string instead of theport number.
destination address
Copyright © 2011, Juniper Networks, Inc.140
Junos OS Monitoring and Troubleshooting Guide for Security Devices

Table 76: J-Web Packet Capture Results and Output Summary (continued)
DescriptionField
Protocol for the packet.
In the sample output, TCP indicates the Layer 4 protocol.
protocol
Size of the packet (in bytes).data size
CLI Diagnostic Commands
This section contains the following topics:
• Using the ping Command on page 141
• Using the ping mpls Commands on page 143
• Using the traceroute Commands on page 147
• Using the mtrace Commands on page 151
• Using the monitor Commands on page 155
Using the ping Command
You can perform certain tasks only through the CLI. Use the CLI ping command to verify
that a host can be reached over the network. This command is useful for diagnosing host
and network connectivity problems. The device sends a series of ICMP echo (ping)
requests to a specified host and receives ICMP echo responses.
Enter the ping command with the following syntax:
user@host> ping host <interface source-interface> <bypass-routing> <count number><do-not-fragment> <inet | inet6> <interval seconds> <loose-source [hosts]><no-resolve> <pattern string> <rapid> <record-route><routing-instance routing-instance-name><sizebytes><sourcesource-address><strict><strict-source [hosts]><tosnumber><ttlnumber><wait seconds><detail><verbose>
Table 77 on page 141 describes the ping command options.
To quit the ping command, press Ctrl-C.
Table 77: CLI ping CommandOptions
DescriptionOption
Pings the hostname or IP address you specify.host
(Optional) Sends the ping requests on the interface you specify. If you do not include this option,ping requests are sent on all interfaces.
interface source-interface
(Optional) Bypasses the routing tables and sends the ping requests only to hosts on directlyattached interfaces. If the host is not on a directly attached interface, an error message is returned.
Use this option to ping a local system through an interface that has no route through it.
bypass-routing
141Copyright © 2011, Juniper Networks, Inc.
Chapter 4: Diagnostic Tools

Table 77: CLI ping CommandOptions (continued)
DescriptionOption
(Optional) Limits the number of ping requests to send. Specify a count from 1 through2,000,000,000. If you do not specify a count, ping requests are continuously sent until you pressCtrl-C.
countnumber
(Optional) Sets the Don't Fragment (DF) bit in the IP header of the ping request packet.do-not-fragment
(Optional) Forces the ping requests to an IPv4 destination.inet
(Optional) Forces the ping requests to an IPv6 destination.inet6
(Optional) Sets the interval between ping requests, in seconds. Specify an interval from0.1 through10,000. The default value is 1 second.
interval seconds
(Optional) For IPv4, sets the loose source routing option in the IP header of the ping requestpacket.
loose-source [hosts]
(Optional) Suppresses the display of the hostnames of the hops along the path.no-resolve
(Optional) Includes the hexadecimal string you specify, in the ping request packet.pattern string
(Optional) Sends ping requests rapidly. The results are reported in a single message, not inindividual messages for each ping request. By default, five ping requests are sent before the resultsare reported. To change the number of requests, include the count option.
rapid
(Optional) For IPv4, sets the record route option in the IP header of the ping request packet. Thepath of the ping request packet is recorded within the packet and displayed on the screen.
record-route
(Optional) Uses the routing instance you specify for the ping request.routing-instancerouting-instance-name
(Optional) Sets the size of the ping request packet. Specify a size from 0 through 65,468. Thedefault value is 56 bytes, which is effectively 64 bytes because 8 bytes of ICMP header data areadded to the packet.
size bytes
(Optional) Uses the source address that you specify, in the ping request packet.source source-address
(Optional) For IPv4, sets the strict source routing option in the IP header of the ping request packet.strict
(Optional) For IPv4, sets the strict source routing option in the IP header of the ping request packet,and uses the list of hosts you specify for routing the packet.
strict-source [hosts]
(Optional) Sets the type-of-service (TOS) value in the IP header of the ping request packet.Specify a value from 0 through 255.
tos number
(Optional) Sets the time-to-live (TTL) value for the ping request packet. Specify a value from 0through 255.
ttl number
Copyright © 2011, Juniper Networks, Inc.142
Junos OS Monitoring and Troubleshooting Guide for Security Devices

Table 77: CLI ping CommandOptions (continued)
DescriptionOption
(Optional) Sets the maximum time to wait after sending the last ping request packet. If you donot specify this option, the default delay is 10 seconds. If you use this option without the countoption, the J Series device uses a default count of 5 packets.
wait seconds
(Optional) Displays the interface on which the ping response was received.detail
(Optional) Displays detailed output.verbose
The following is sample output from a ping command:
user@host> ping host3 count 4
PING host3.site.net (176.26.232.111): 56 data bytes 64 bytes from 176.26.232.111: icmp_seq=0 ttl=122 time=0.661 ms 64 bytes from 176.26.232.111: icmp_seq=1 ttl=122 time=0.619 ms 64 bytes from 176.26.232.111: icmp_seq=2 ttl=122 time=0.621 ms 64 bytes from 176.26.232.111: icmp_seq=3 ttl=122 time=0.634 ms --- host3.site.net ping statistics --- 4 packets transmitted, 4 packets received, 0% packet loss round-trip min/avg/max/stddev = 0.619/0.634/0.661/0.017 ms
The fields in the display are the same as those displayed by the J-Web ping host diagnostic
tool.
RelatedDocumentation
Diagnostic Tools Overview on page 123•
• Understanding Ping MPLS on page 128
• Junos OS System Basics and Services Command Reference
• Junos OS Interfaces Command Reference
• Junos OS Interfaces Configuration Guide for Security Devices
• Junos OS Feature Support Reference for SRX Series and J Series Devices
Using the pingmpls Commands
Use the pingmpls commands to diagnose the state of LSPs, Layer 2 and Layer 3 VPNs,
and Layer 2 circuits. When you issue a command from a J Series device operating as the
inbound node at the entry point of an LSP or VPN, the router sends probe packets into
the LSP or VPN. Based on how the LSP or VPN outbound node at the remote endpoint
of the connection replies to the probes, you can determine the connectivity of the LSP
or VPN.
Each probe is an echo request sent to the LSP or VPN exit point as an MPLS packet with
a UDP payload. If the outbound node receives the echo request, it checks the contents
of the probe and returns a value in the UDP payload of the response packet. If the J Series
device receives the response packet, it reports a successful ping response. Responses
that take longer than 2 seconds are identified as failed probes.
143Copyright © 2011, Juniper Networks, Inc.
Chapter 4: Diagnostic Tools

This section contains the following topics:
• Pinging RSVP-Signaled LSPs and LDP-Signaled LSPs on page 144
• Pinging Layer 3 VPNs on page 144
• Pinging Layer 2 VPNs on page 145
• Pinging Layer 2 Circuits on page 146
Pinging RSVP-Signaled LSPs and LDP-Signaled LSPs
Enter the pingmpls command with the following syntax:
user@host> pingmpls (ldp fec | lsp-end-point prefix-name | rsvp lsp-name)<exp forwarding-class> <count number> <source source-address> <detail>
Table 78 on page 144 describes the pingmpls command options.
Table 78: CLI pingmpls ldp and pingmpls lsp-end-point CommandOptions
DescriptionOption
Pings an LDP-signaled LSP identified by the forwarding equivalence class (FEC) prefix and length.ldp fec
Pings an LSP endpoint using either an LDP FEC or a RSVP LSP endpoint address.lsp-end-point prefix-name
Pings an RSVP-signaled LSP identified by the specified LSP name.rsvp lsp-name
(Optional) Specifies the value of the forwarding class to be used in the MPLS ping packets.exp forwarding-class
(Optional) Limits the number of ping requests to send. Specify a count from0 through 1,000,000.The default value is 5. If you do not specify a count, ping requests are continuously sent until youpress Ctrl-C.
countnumber
(Optional) Uses the source address that you specify, in the ping request packet.source source-address
(Optional) Displays detailed output about the echo requests sent and received. Detailed outputincludes the MPLS labels used for each request and the return codes for each request.
detail
To quit the pingmpls command, press Ctrl-C.
The following is sample output from a pingmpls command:
user@host> pingmpls rsvp count 5
!!xxx--- lsping statistics ---5 packets transmitted, 2 packets received, 60% packet loss3 packets received with error status, not counted as received.
The fields in the display are the same as those displayed by the J-Web ping MPLS
diagnostic tool.
Pinging Layer 3 VPNs
Enter the pingmpls l3vpn command with the following syntax:
Copyright © 2011, Juniper Networks, Inc.144
Junos OS Monitoring and Troubleshooting Guide for Security Devices

user@host> pingmpls l3vpn prefix prefix-name <l3vpn-name> <bottom-label-ttl><exp forwarding-class> <count number> <source source-address> <detail>
Table 79 on page 145 describes the pingmpls l3vpn command options.
Table 79: CLI pingmpls l3vpn CommandOptions
DescriptionOption
Pings the remote host specified by the prefix to verify that the prefix is present in the PE device'sVPN routing and forwarding (VRF) table. This option does not test the connectivity between aPE device and a CE device.
l3vpn prefix prefix-name
(Optional) Layer 3 VPN name.l3vpn-name
(Optional) Displays the time-to-live (TTL) value for the bottom label in the MPLS label stack.bottom-label-ttl
(Optional) Specifies the value of the forwarding class to be used in the MPLS ping packets.exp forwarding-class
(Optional) Limits the number of ping requests to send. Specify a count from0 through 1,000,000.The default value is 5. If you do not specify a count, ping requests are continuously sent until youpress Ctrl-C.
countnumber
(Optional) Uses the source address that you specify, in the ping request packet.source source-address
(Optional) Displays detailed output about the echo requests sent and received. Detailed outputincludes the MPLS labels used for each request and the return codes for each request.
detail
To quit the pingmpls l3vpn command, press Ctrl-C.
The following is sample output from a pingmpls l3vpn command:
user@host> pingmpls l3vpn vpn1 prefix 10.255.245.122/32
!!!!!--- lsping statistics ---5 packets transmitted, 5 packets received, 0% packet loss
The fields in the display are the same as those displayed by the J-Web ping MPLS
diagnostic tool.
Pinging Layer 2 VPNs
Enter the pingmpls l2vpn command with the following syntax:
user@host> pingmpls l2vpn interface interface-name | instance l2vpn-instance-namelocal-site-id local-site-id-number remote-site-id remote-site-id-number<bottom-label-ttl> <exp forwarding-class> <count number> <source source-address><detail>
Table 80 on page 146 describes the pingmpls l2vpn command options.
145Copyright © 2011, Juniper Networks, Inc.
Chapter 4: Diagnostic Tools

Table 80: CLI pingmpls l2vpn CommandOptions
DescriptionOption
Sends ping requests out the specified interface configured for the Layer 2 VPN on the outbound(egress) PE device.
l2vpn interfaceinterface-name
Pings on a combination of the Layer 2 VPN routing instance name, the local site identifier, andthe remote site identifier, testing the integrity of the Layer 2 VPN circuit (specified by the identifiers)between the inbound (ingress) and outbound PE devices.
l2vpn instancel2vpn-instance-namelocal-site-idlocal-site-id-numberremote-site-idremote-site-id-number
(Optional) Displays the time-to-live (TTL) value for the bottom label in the MPLS label stack.bottom-label-ttl
(Optional) Specifies the value of the forwarding class to be used in the MPLS ping packets.exp forwarding-class
(Optional) Limits the number of ping requests to send. Specify a count from0 through 1,000,000.The default value is 5. If you do not specify a count, ping requests are continuously sent until youpress Ctrl-C.
countnumber
(Optional) Uses the source address that you specify, in the ping request packet.source source-address
(Optional) Displays detailed output about the echo requests sent and received. Detailed outputincludes the MPLS labels used for each request and the return codes for each request.
detail
To quit the pingmpls l2vpn command, press Ctrl-C.
The following is sample output from a pingmpls l2vpn command:
user@host> pingmpls l2vpn instance vpn1 remote-site-id 1 local-site-id 2 detail
Request for seq 1, to interface 68, labels <800001, 100176>Reply for seq 1, return code: Egress-okRequest for seq 2, to interface 68, labels <800001, 100176>Reply for seq 2, return code: Egress-okRequest for seq 3, to interface 68, labels <800001, 100176>Reply for seq 3, return code: Egress-okRequest for seq 4, to interface 68, labels <800001, 100176>Reply for seq 4, return code: Egress-okRequest for seq 5, to interface 68, labels <800001, 100176>Reply for seq 5, return code: Egress-ok
--- lsping statistics ---5 packets transmitted, 5 packets received, 0% packet loss
The fields in the display are the same as those displayed by the J-Web ping MPLS
diagnostic tool.
Pinging Layer 2 Circuits
Enter the pingmpls l2circuit command with the following syntax:
user@host> pingmpls l2circuit (interface interface-name | virtual-circuit neighborprefix-name virtual-circuit-id) <exp forwarding-class> <count number><source source-address> <detail>
Copyright © 2011, Juniper Networks, Inc.146
Junos OS Monitoring and Troubleshooting Guide for Security Devices

Table 81 on page 147 describes the pingmpls l2circuit command options.
Table 81: CLI pingmpls l2circuit CommandOptions
DescriptionOption
Sends ping requests out the specified interface configured for the Layer 2 circuit on the outboundPE device.
l2circuit interfaceinterface-name
Pings on a combination of the IPv4 prefix and the virtual circuit identifier on the outbound PEdevice, testing the integrity of the Layer 2 circuit between the inbound and outbound PE devices.
l2circuit virtual-circuitneighbor prefix-namevirtual-circuit-id
(Optional) Specifies the value of the forwarding class to be used in the MPLS ping packets.exp forwarding-class
(Optional) Limits the number of ping requests to send. Specify a count from0 through 1,000,000.The default value is 5. If you do not specify a count, ping requests are continuously sent until youpress Ctrl-C.
countnumber
(Optional) Uses the source address that you specify, in the ping request packet.source source-address
(Optional) Displays detailed output about the echo requests sent and received. Detailed outputincludes the MPLS labels used for each request and the return codes for each request.
detail
To quit the pingmpls l2circuit command, press Ctrl-C.
The following is sample output from a pingmpls l2circuit command:
user@host> pingmpls l2circuit interface fe-1/0/0.0
Request for seq 1, to interface 69, labels <100000, 100208>Reply for seq 1, return code: Egress-ok, time: 0.439 ms
The fields in the display are the same as those displayed by the J-Web ping MPLS
diagnostic tool.
RelatedDocumentation
Diagnostic Tools Overview on page 123•
• Understanding Ping MPLS on page 128
• Using the ping Command on page 141
• Junos OS System Basics and Services Command Reference
• Junos OS Interfaces Configuration Guide for Security Devices
• Junos OS Feature Support Reference for SRX Series and J Series Devices
Using the traceroute Commands
Use the CLI traceroute command to display a list of devices between the device and a
specified destination host. This command is useful for diagnosing a point of failure in the
path from the device to the destination host, and addressing network traffic latency and
throughput problems.
147Copyright © 2011, Juniper Networks, Inc.
Chapter 4: Diagnostic Tools

The device generates the list of routers by sending a series of ICMP traceroute packets
in which the time-to-live (TTL) value in the messages sent to each successive device is
incremented by 1. (The TTL value of the first traceroute packet is set to 1.) In this manner,
each router along the path to the destination host replies with a Time Exceeded packet
from which the source IP address can be obtained.
The traceroutemonitor command combines ping and traceroute functionality to display
real-time monitoring information about each device between the J Series device and a
specified destination host.
This section contains the following topics:
• Displaying a List of Devices on page 148
• Displaying Real-Time Monitoring Information on page 149
Displaying a List of Devices
To display a list of devices between the device and a specified destination host, enter
the traceroute command with the following syntax:
user@host> traceroute host <interface interface-name> <as-number-lookup><bypass-routing> <gateway address> <inet | inet6> <no-resolve><routing-instance routing-instance-name> <source source-address> <tos number><ttl number> <wait seconds>
Table 82 on page 148 describes the traceroute command options.
Table 82: CLI traceroute CommandOptions
DescriptionOption
Sends traceroute packets to the hostname or IP address you specify.host
(Optional) Sends the traceroute packets on the interface you specify. If you do not include thisoption, traceroute packets are sent on all interfaces.
interface interface-name
(Optional) Displays the autonomous system (AS) number of each intermediate hop betweenthe device and the destination host.
as-number-lookup
(Optional) Bypasses the routing tables and sends the traceroute packets only to hosts on directlyattached interfaces. If the host is not on a directly attached interface, an error message is returned.
Use this option to display a route to a local system through an interface that has no route throughit.
bypass-routing
(Optional) Uses the gateway you specify to route through.gateway address
(Optional) Forces the traceroute packets to an IPv4 destination.inet
(Optional) Forces the traceroute packets to an IPv6 destination.inet6
(Optional) Suppresses the display of the hostnames of the hops along the path.no-resolve
Copyright © 2011, Juniper Networks, Inc.148
Junos OS Monitoring and Troubleshooting Guide for Security Devices

Table 82: CLI traceroute CommandOptions (continued)
DescriptionOption
(Optional) Uses the routing instance you specify for the traceroute.routing-instancerouting-instance-name
(Optional) Uses the source address that you specify, in the traceroute packet.source address
(Optional) Sets the type-of-service (TOS) value in the IP header of the traceroute packet. Specifya value from 0 through 255.
tos number
(Optional) Sets the time-to-live (TTL) value for the traceroute packet. Specify a hop count from0 through 128.
ttl number
(Optional) Sets the maximum time to wait for a response.wait seconds
To quit the traceroute command, press Ctrl-C.
The following is sample output from a traceroute command:
user@host> traceroute host2
traceroute to 173.24.232.66 (172.24.230.41), 30 hops max, 40 byte packets 1 173.18.42.253 (173.18.42.253) 0.482 ms 0.346 ms 0.318 ms 2 host4.site1.net (173.18.253.5) 0.401 ms 0.435 ms 0.359 ms 3 host5.site1.net (173.18.253.5) 0.401 ms 0.360 ms 0.357 ms 4 173.24.232.65 (173.24.232.65) 0.420 ms 0.456 ms 0.378 ms 5 173.24.232.66 (173.24.232.66) 0.830 ms 0.779 ms 0.834 ms
The fields in the display are the same as those displayed by the J-Web traceroute
diagnostic tool.
Displaying Real-TimeMonitoring Information
To display real-time monitoring information about each device between the J Series
device and a specified destination host, enter the traceroutemonitor command with the
following syntax:
user@host> traceroutemonitor host <count number> <inet | inet6> <interval seconds><no-resolve> <size bytes><source source-address> <summary>
Table 83 on page 149 describes the traceroutemonitor command options.
Table 83: CLI traceroutemonitor CommandOptions
DescriptionOption
Sends traceroute packets to the hostname or IP address you specify.host
(Optional) Limits the number of ping requests, in packets, to send in summary mode. If you donot specify a count, ping requests are continuously sent until you press Q.
count number
(Optional) Forces the traceroute packets to an IPv4 destination.inet
(Optional) Forces the traceroute packets to an IPv6 destination.inet6
149Copyright © 2011, Juniper Networks, Inc.
Chapter 4: Diagnostic Tools

Table 83: CLI traceroutemonitor CommandOptions (continued)
DescriptionOption
(Optional) Sets the interval between ping requests, in seconds. The default value is 1 second.interval seconds
(Optional) Suppresses the display of the hostnames of the hops along the path.no-resolve
(Optional) Sets the size of the ping request packet. The size can be from 0 through 65,468 bytes.The default packet size is 64 bytes.
size bytes
(Optional) Uses the source address that you specify, in the traceroute packet.source address
(Optional) Displays the summary traceroute information.summary
To quit the traceroutemonitor command, press Q.
The following is sample output from a traceroutemonitor command:
user@host> traceroutemonitor host2
My traceroute [v0.69] host (0.0.0.0)(tos=0x0 psize=64 bitpattern=0x00) Wed Mar 14 23:14:11 2007 Keys: Help Display mode Restart statistics Order of fields quit Packets Pings Host Loss% Snt Last Avg Best Wrst StDev 1. 173.24.232.66 0.0% 5 9.4 8.6 4.8 9.9 2.1 2. 173.24.232.66 0.0% 5 7.9 17.2 7.9 29.4 11.0 3. 173.24.232.66 0.0% 5 9.9 9.3 8.7 9.9 0.5 4. 173.24.232.66 0.0% 5 9.9 9.8 9.5 10.0 0.2
Table 84 on page 150 summarizes the output fields of the display.
Table 84: CLI traceroutemonitor CommandOutput Summary
DescriptionField
Hostname or IP address of the J Series device issuing the traceroutemonitor command.host
Size of ping request packet, in bytes.psizesize
Keys
Displays the Help for the CLI commands.
Press H to display the Help.
Help
Toggles the display mode.
Press D to toggle the display mode
Displaymode
Copyright © 2011, Juniper Networks, Inc.150
Junos OS Monitoring and Troubleshooting Guide for Security Devices

Table 84: CLI traceroutemonitor CommandOutput Summary (continued)
DescriptionField
Restarts the traceroutemonitor command.
Press R to restart the traceroutemonitor command.
Restart statistics
Sets the order of the displayed fields.
Press O to set the order of the displayed fields.
Order of fields
Quits the traceroutemonitor command.
Press Q to quit the traceroutemonitor command.
quit
Packets
Number of the hop (device) along the route to the final destination host.number
Hostname or IP address of the device at each hop.Host
Percent of packet loss. The number of ping responses divided by the number of pingrequests, specified as a percentage.
Loss%
Pings
Number of ping requests sent to the device at this hop.Snt
Most recent round-trip time, in milliseconds, to the device at this hop.Last
Average round-trip time, in milliseconds, to the device at this hop.Avg
Shortest round-trip time, in milliseconds, to the device at this hop.Best
Longest round-trip time, in milliseconds, to the device at this hop.Wrst
Standard deviation of round-trip times, in milliseconds, to the device at this hop.StDev
RelatedDocumentation
Diagnostic Tools Overview on page 123•
• Using the ping Command on page 141
• Junos OS System Basics and Services Command Reference
• Junos OS Interfaces Command Reference
• Junos OS Interfaces Configuration Guide for Security Devices
• Junos OS Feature Support Reference for SRX Series and J Series Devices
Using themtrace Commands
Use CLI mtrace commands to trace information about multicast paths. The mtrace
from-source command displays information about a multicast path from a source to the
151Copyright © 2011, Juniper Networks, Inc.
Chapter 4: Diagnostic Tools

J Series device. The mtracemonitor command monitors and displays multicast trace
operations.
This section contains the following topics:
• Displaying Multicast Path Information on page 152
• Displaying Multicast Trace Operations on page 154
DisplayingMulticast Path Information
To display information about a multicast path from a source to the J Series device, enter
the mtrace from-source command with the following syntax:
user@host>mtrace from-source source host <extra-hops number> <group address><interval seconds> <max-hops number> <max-queries number> <response host><routing-instance routing-instance-name> <ttl number> <wait-time seconds> <loop><multicast-response | unicast-response> <no-resolve> <no-router-alert> <brief |detail>
Table 85 on page 152 describes the mtrace from-source command options.
Table 85: CLI mtrace from-source CommandOptions
DescriptionOption
Traces the path to the specified hostname or IP address.source host
(Optional) Sets the number of extra hops to trace past nonresponsive devices. Specifya value from 0 through 255.
extra-hops number
(Optional) Traces the path for the specified group address. The default value is0.0.0.0.group address
(Optional) Sets the interval between statistics gathering. The default value is 10.interval seconds
(Optional) Sets the maximum number of hops to trace toward the source. Specify avalue from 0 through 255. The default value is 32.
max-hops number
(Optional) Sets the maximum number of query attempts for any hop. Specify a valuefrom 1 through 32. The default value is 3.
max-queries number
(Optional) Sends the response packets to the specified hostname or IP address. Bydefault, the response packets are sent to the J Series device.
response host
(Optional) Traces the routing instance you specify.routing-instancerouting-instance-name
(Optional) Sets the time-to-live (TTL) value in the IP header of the query packets.Specify a hop count from 0 through 255. The default value for local queries to the allrouters multicast group is 1. Otherwise, the default value is 127.
ttl number
(Optional) Sets the time to wait for a response packet. The default value is 3 seconds.wait-time seconds
(Optional) Loops indefinitely, displaying rate and loss statistics. To quit the mtracecommand, press Ctrl-C.
loop
Copyright © 2011, Juniper Networks, Inc.152
Junos OS Monitoring and Troubleshooting Guide for Security Devices
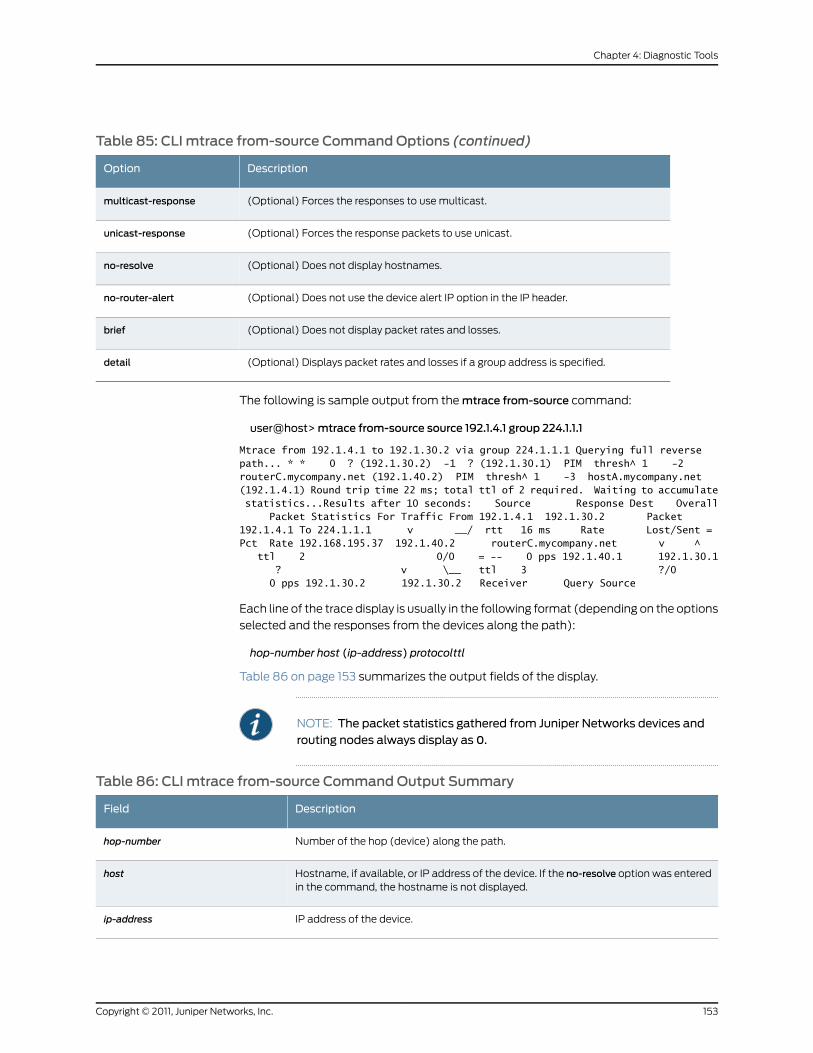
Table 85: CLI mtrace from-source CommandOptions (continued)
DescriptionOption
(Optional) Forces the responses to use multicast.multicast-response
(Optional) Forces the response packets to use unicast.unicast-response
(Optional) Does not display hostnames.no-resolve
(Optional) Does not use the device alert IP option in the IP header.no-router-alert
(Optional) Does not display packet rates and losses.brief
(Optional) Displays packet rates and losses if a group address is specified.detail
The following is sample output from the mtrace from-source command:
user@host>mtrace from-source source 192.1.4.1 group 224.1.1.1
Mtrace from 192.1.4.1 to 192.1.30.2 via group 224.1.1.1 Querying full reverse path... * * 0 ? (192.1.30.2) -1 ? (192.1.30.1) PIM thresh^ 1 -2 routerC.mycompany.net (192.1.40.2) PIM thresh^ 1 -3 hostA.mycompany.net (192.1.4.1) Round trip time 22 ms; total ttl of 2 required. Waiting to accumulate statistics...Results after 10 seconds: Source Response Dest Overall Packet Statistics For Traffic From 192.1.4.1 192.1.30.2 Packet 192.1.4.1 To 224.1.1.1 v __/ rtt 16 ms Rate Lost/Sent = Pct Rate 192.168.195.37 192.1.40.2 routerC.mycompany.net v ^ ttl 2 0/0 = -- 0 pps 192.1.40.1 192.1.30.1 ? v \__ ttl 3 ?/0 0 pps 192.1.30.2 192.1.30.2 Receiver Query Source
Each line of the trace display is usually in the following format (depending on the options
selected and the responses from the devices along the path):
hop-number host (ip-address) protocolttl
Table 86 on page 153 summarizes the output fields of the display.
NOTE: The packet statistics gathered from Juniper Networks devices androuting nodes always display as 0.
Table 86: CLI mtrace from-source CommandOutput Summary
DescriptionField
Number of the hop (device) along the path.hop-number
Hostname, if available, or IP address of the device. If the no-resolve option was enteredin the command, the hostname is not displayed.
host
IP address of the device.ip-address
153Copyright © 2011, Juniper Networks, Inc.
Chapter 4: Diagnostic Tools

Table 86: CLI mtrace from-source CommandOutput Summary (continued)
DescriptionField
Protocol used.protocol
TTL threshold.ttl
Total time between the sending of the query packet and the receiving of the responsepacket.
Round trip timemillisecondsms
Total number of hops required to reach the source.total ttl of number required
Source IP address of the response packet.Source
Response destination IP address.Response Dest
Average packet rate for all traffic at each hop.Overall
Number of packets lost, number of packets sent, percentage of packets lost, and averagepacket rate at each hop.
Packet Statistics For Traffic From
IP address receiving the multicast packets.Receiver
IP address of the host sending the query packets.Query Source
DisplayingMulticast Trace Operations
To monitor and display multicast trace operations, enter the mtracemonitor command:
user@host>mtracemonitor
Mtrace query at Apr 21 16:00:54 by 192.1.30.2, resp to 224.0.1.32, qid 2a83aa packet from 192.1.30.2 to 224.0.0.2 from 192.1.30.2 to 192.1.4.1 via group 224.1.1.1 (mxhop=60) Mtrace query at Apr 21 16:00:57 by 192.1.30.2, resp to 224.0.1.32, qid 25dc17 packet from 192.1.30.2 to 224.0.0.2 from 192.1.30.2 to 192.1.4.1 via group 224.1.1.1 (mxhop=60) Mtrace query at Apr 21 16:01:00 by 192.1.30.2, resp to same, qid 20e046 packet from 192.1.30.2 to 224.0.0.2 from 192.1.30.2 to 192.1.4.1 via group 224.1.1.1 (mxhop=60) Mtrace query at Apr 21 16:01:10 by 192.1.30.2, resp to same, qid 1d25ad packet from 192.1.30.2 to 224.0.0.2 from 192.1.30.2 to 192.1.4.1 via group 224.1.1.1 (mxhop=60)
This example displays onlymtracequeries. However, when the device captures anmtrace
response, the display is similar, but the completemtrace response also appears (exactly
as it is appears in the mtrace from-source command output).
Table 87 on page 154 summarizes the output fields of the display.
Table 87: CLI mtracemonitor CommandOutput Summary
DescriptionField
• operation-type—Type of multicast trace operation: query or response.
• time-of-day—Date and time the multicast trace query or response was captured.
Mtrace operation-type at time-of-day
Copyright © 2011, Juniper Networks, Inc.154
Junos OS Monitoring and Troubleshooting Guide for Security Devices

Table 87: CLI mtracemonitor CommandOutput Summary (continued)
DescriptionField
IP address of the host issuing the query.by
address—Response destination address.resp to address
qid—Query ID number.qid qid
• source—IP address of the source of the query or response.
• destination—IP address of the destination of the query or response.
packet from source to destination
• source—IP address of the multicast source.
• destination—IP address of the multicast destination.
from source to destination
address—Group address being traced.via group address
number—Maximum hop setting.mxhop=number
RelatedDocumentation
Diagnostic Tools Overview on page 123•
• Using the ping Command on page 141
• Junos OS System Basics and Services Command Reference
• Junos OS Interfaces Command Reference
• Junos OS Interfaces Configuration Guide for Security Devices
• Junos OS Feature Support Reference for SRX Series and J Series Devices
Using themonitor Commands
This section contains the following topics:
• Displaying Log and Trace Files on page 155
• Displaying Real-Time Interface Information on page 156
• Displaying Packet Headers on page 157
Displaying Log and Trace Files
Enter themonitor start command to display real-time additions to system logs and trace
files:
user@host>monitor start filename
When the device adds a record to the file specified by filename, the record displays on
the screen. For example, if you have configured a system log file named system-log (by
including the syslog statement at the [edit system] hierarchy level), you can enter the
monitor start system-log command to display the records added to the system log.
155Copyright © 2011, Juniper Networks, Inc.
Chapter 4: Diagnostic Tools

To display a list of files that are being monitored, enter the monitor list command. To
stop the display of records for a specified file, enter themonitor stop filename command.
Displaying Real-Time Interface Information
Enter the monitor interface command to display real-time traffic, error, alarm, and filter
statistics about a physical or logical interface:
user@host>monitor interface (interface-name | traffic)
Replace interface-name with the name of a physical or logical interface. If you specify the
traffic option, statistics for all active interfaces display.
The real-time statistics update every second. TheCurrentdeltaandDeltacolumns display
the amount the statistics counters have changed since the monitor interface command
was entered or since you cleared the delta counters. Table 88 on page 156 and Table 89
on page 156 list the keys you use to control the display using the interface-nameand traffic
options. (The keys are not case sensitive.)
Table 88: CLI monitor interface Output Control Keys
ActionKey
Clears (returns to 0) the delta counters in the Current delta column. Thestatistics counters are not cleared.
c
Freezes the display, halting the update of the statistics and delta counters.f
Displays information about a different interface. You are prompted for thename of a specific interface.
i
Displays information about the next interface. The device scrolls through thephysical and logical interfaces in the same order in which they are displayedby the show interfaces terse command.
n
Quits the command and returns to the command prompt.q or ESC
Thaws the display, resuming the update of the statistics and delta counters.t
Table 89: CLI monitor interface traffic Output Control Keys
ActionKey
Displays the statistics in units of bytes and bytes per second (bps).b
Clears (returns to 0) the delta counters in the Delta column. The statisticscounters are not cleared.
c
Displays the Delta column instead of the rate column—in bps or packets persecond (pps).
d
Displays the statistics in units of packets and packets per second (pps).p
Copyright © 2011, Juniper Networks, Inc.156
Junos OS Monitoring and Troubleshooting Guide for Security Devices

Table 89: CLI monitor interface traffic Output Control Keys (continued)
ActionKey
Quits the command and returns to the command prompt.q or ESC
Displays the rate column—in bps and pps—instead of the Delta column.r
The following are sample displays from the monitor interface command:
user@host>monitor interface fe-0/0/0
host1 Seconds: 11 Time: 16:47:49 Delay: 0/0/0 Interface: fe-0/0/0, Enabled, Link is Up Encapsulation: Ethernet, Speed: 100mbps Traffic statistics: Current delta Input bytes: 381588589 [11583] Output bytes: 9707279 [6542] Input packets: 4064553 [145] Output packets: 66683 [25] Error statistics: Input errors: 0 [0] Input drops: 0 [0] Input framing errors: 0 [0] Carrier transitions: 0 [0] Output errors: 0 [0] Output drops: 0 [0]
NOTE: The output fields that display when you enter themonitor interface
interface-name command are determined by the interface you specify.
user@host>monitor interface traffic
Interface Link Input packets (pps) Output packets (pps) fe-0/0/0 Up 42334 (5) 23306 (3) fe-0/0/1 Up 587525876 (12252) 589621478 (12891)
Displaying Packet Headers
Enter themonitor trafficcommand to display packet headers transmitted through network
interfaces with the following syntax:
NOTE: Using themonitor trafficcommandcandegradesystemperformance.
Werecommendthatyouusefilteringoptions—suchascountandmatching—to
minimize the impact to packet throughput on the system.
user@host>monitor traffic <absolute-sequence> <count number><interface interface-name> <layer2-headers> <matching "expression"><no-domain-names><no-promiscuous><no-resolve><no-timestamp><print-ascii><print-hex> <size bytes> <brief | detail | extensive>
Table 90 on page 158 describes the monitor traffic command options.
157Copyright © 2011, Juniper Networks, Inc.
Chapter 4: Diagnostic Tools

Table 90: CLI monitor traffic CommandOptions
DescriptionOption
(Optional) Displays the absolute TCP sequence numbers.absolute-sequence
(Optional) Displays the specified number of packet headers. Specifya value from 0 through 100,000. The command quits and exits tothe command prompt after this number is reached.
count number
(Optional) Displays packet headers for traffic on the specifiedinterface. If an interface is not specified, the lowest numberedinterface is monitored.
interface interface-name
(Optional) Displays the link-layer packet header on each line.layer2-headers
(Optional) Displays packet headers that match an expressionenclosed in quotation marks (" "). Table 91 on page 159 throughTable 93 on page 161 list match conditions, logical operators, andarithmetic, binary, and relational operators you can use in theexpression.
matching "expression"
(Optional) Suppresses the display of the domain name portion ofthe hostname.
no-domain-names
(Optional) Specifies not to place the monitored interface inpromiscuous mode.
In promiscuous mode, the interface reads every packet that reachesit. In nonpromiscuous mode, the interface reads only the packetsaddressed to it.
no-promiscuous
(Optional) Suppresses the display of hostnames.no-resolve
(Optional) Suppresses the display of packet header timestamps.no-timestamp
(Optional) Displays each packet header in ASCII format.print-ascii
(Optional) Displays each packet header, except link-layer headers,in hexadecimal format.
print-hex
(Optional) Displays the number of bytes for each packet that youspecify. If a packet header exceeds this size, the displayed packetheader is truncated. The default value is 96.
size bytes
(Optional) Displays minimum packet header information. This isthe default.
brief
(Optional) Displays packet header information in moderate detail.For some protocols, you must also use the sizeoption to see detailedinformation.
detail
(Optional) Displays the most extensive level of packet headerinformation. For some protocols, you must also use the size optionto see extensive information.
extensive
Copyright © 2011, Juniper Networks, Inc.158
Junos OS Monitoring and Troubleshooting Guide for Security Devices

To quit the monitor traffic command and return to the command prompt, press Ctrl-C.
To limit the packet header information displayed by themonitor traffic command, include
thematching"expression"option. An expression consists of one or more match conditions
listed in Table 91 on page 159, enclosed in quotation marks (" "). You can combine match
conditions by using the logical operators listed in Table 92 on page 160 (shown in order
of highest to lowest precedence).
For example, to display TCP or UDP packet headers, enter:
user@host>monitor traffic matching “tcp || udp”
To compare the following types of expressions, use the relational operators listed in
Table 93 on page 161 (listed from highest to lowest precedence):
• Arithmetic—Expressions that use the arithmetic operators listed in Table 93 on page 161.
• Binary—Expressions that use the binary operators listed in Table 93 on page 161.
• Packet data accessor—Expressions that use the following syntax:
protocol [byte-offset <size>]
Replace protocol with any protocol in Table 91 on page 159. Replace byte-offset with
the byte offset, from the beginning of the packet header, to use for the comparison.
The optional size parameter represents the number of bytes examined in the packet
header—1, 2, or 4 bytes.
For example, the following command displays all multicast traffic:
user@host>monitor traffic matching “ether[0] & 1 !=0”
Table 91: CLI monitor traffic Match Conditions
DescriptionMatch Condition
Entity Type
Matches packet headers that contain the specified address or hostname. You canpreprend any of the following protocol match conditions, followed by a space, to host:arp, ip, rarp, or any of the Directional match conditions.
host [address | hostname]
Matches packet headers with source or destination addresses containing the specifiednetwork address.
network address
Matches packet headers containing the specified network address and subnet mask.network addressmaskmask
Matches packet headers containing the specified source or destination TCP or UDPport number or port name.
port [port-number | port-name]
Directional
Matches packet headers containing the specified destination. Directional matchconditions can be prepended to any Entity Type match conditions, followed by a space.
destination
Matches packet headers containing the specified source.source
159Copyright © 2011, Juniper Networks, Inc.
Chapter 4: Diagnostic Tools

Table 91: CLI monitor traffic Match Conditions (continued)
DescriptionMatch Condition
Matches packet headers containing the specified source and destination.source and destination
Matches packet headers containing the specified source or destination.source or destination
Packet Length
Matches packets with lengths less than or equal to the specified value, in bytes.less bytes
Matches packets with lengths greater than or equal to the specified value, in bytes.greater bytes
Protocol
Matches all ARP packets.arp
Matches all Ethernet frames.ether
Matches broadcast or multicast Ethernet frames. This match condition can be prependedwith source or destination.
ether [broadcast | multicast]
Matches Ethernet frames with the specified address or protocol type. The argumentsarp, ip, and rarp are also independent match conditions, so they must be preceded witha backslash (\) when used in the ether protocol match condition.
ether protocol [address | (\arp | \ip |\rarp)
Matches all ICMP packets.icmp
Matches all IP packets.ip
Matches broadcast or multicast IP packets.ip [broadcast | multicast]
Matches IP packets with the specified address or protocol type. The arguments icmp,tcp, and udp are also independent match conditions, so they must be preceded with abackslash (\) when used in the ip protocol match condition.
ip protocol [address | (\icmp | igrp |\tcp | \udp)]
Matches all IS-IS routing messages.isis
Matches all RARP packets.rarp
Matches all TCP packets.tcp
Matches all UDP packets.udp
Table 92: CLI monitor traffic Logical Operators
DescriptionLogicalOperator
Logical NOT. If the first condition does not match, the next condition isevaluated.
!
Copyright © 2011, Juniper Networks, Inc.160
Junos OS Monitoring and Troubleshooting Guide for Security Devices

Table 92: CLI monitor traffic Logical Operators (continued)
DescriptionLogicalOperator
Logical AND. If the first condition matches, the next condition is evaluated. Ifthe first condition does not match, the next condition is skipped.
&&
Logical OR. If the first condition matches, the next condition is skipped. If thefirst condition does not match, the next condition is evaluated.
||
Group operators to override default precedence order. Parentheses are specialcharacters, each of which must be preceded by a backslash (\).
()
Table93: CLImonitor traffic Arithmetic, Binary, andRelationalOperators
DescriptionOperator
Arithmetic Operator
Addition operator.+
Subtraction operator.–
Division operator./
Binary Operator
Bitwise AND.&
Bitwise exclusive OR.*
Bitwise inclusive OR.|
Relational Operator
A match occurs if the first expression is less than or equal to the second.<=
A match occurs if the first expression is greater than or equal to the second.>=
A match occurs if the first expression is less than the second.<
A match occurs if the first expression is greater than the second.>
A match occurs if the first expression is equal to the second.=
A match occurs if the first expression is not equal to the second.!=
The following is sample output from the monitor traffic command:
user@host>monitor traffic count 4matching “arp” detail
Listening on fe-0/0/0, capture size 96 bytes 15:04:16.276780 In arp who-has 193.1.1.1 tell host1.site2.net 15:04:16.376848 In arp who-has host2.site2.net
161Copyright © 2011, Juniper Networks, Inc.
Chapter 4: Diagnostic Tools

tell host1.site2.net 15:04:16.376887 In arp who-has 193.1.1.2 tell host1.site2.net 15:04:16.601923 In arp who-has 193.1.1.3 tell host1.site2.net
RelatedDocumentation
• Diagnostic Tools Overview on page 123
• Using the ping Command on page 141
• Junos OS System Basics and Services Command Reference
• Junos OS Interfaces Command Reference
• Junos OS Interfaces Configuration Guide for Security Devices
• Junos OS Feature Support Reference for SRX Series and J Series Devices
Copyright © 2011, Juniper Networks, Inc.162
Junos OS Monitoring and Troubleshooting Guide for Security Devices

CHAPTER 5
Packet Capture for Network TrafficAnalysis
• Packet Capture Overview on page 163
• Example: Enabling Packet Capture on a Device on page 166
• Example: Configuring Packet Capture on an Interface on page 169
• Example: Configuring a Firewall Filter for Packet Capture on page 171
• Packet Capture Tasks on page 173
Packet Capture Overview
Packet capture is a tool that helps you to analyze network traffic and troubleshoot
network problems. The packet capture tool captures real-time data packets traveling
over the network for monitoring and logging.
NOTE: Packet capture is supported only on physical interfaces and tunnelinterfaces, such as gr, ip, st0, and lsq-/ls-. Packet capture is not supportedon redundant Ethernet interfaces (reth).
Packets are captured as binary data, without modification. You can read the packet
information offline with a packet analyzer such as Ethereal or tcpdump. If you need to
quickly capture packets destined for, or originating from, the Routing Engine and analyze
them online, you can use the J-Web packet capture diagnostic tool.
NOTE: The packet capture tool does not support IPv6 packet capture.
You can use either the J-Web configuration editor or CLI configuration editorto configure packet capture.
Network administrators and security engineers use packet capture to perform the
following tasks:
• Monitor network traffic and analyze traffic patterns.
• Identify and troubleshoot network problems.
163Copyright © 2011, Juniper Networks, Inc.
• Detect security breaches in the network, such as unauthorized intrusions, spyware
activity, or ping scans.
Packet capture operates like traffic sampling on the device, except that it captures entire
packets including the Layer 2 header and saves the contents to a file in libpcap format.
Packet capture also captures IP fragments. You cannot enable packet capture and traffic
sampling on the device at the same time. Unlike traffic sampling, there are no tracing
operations for packet capture.
NOTE: You can enable packet capture and port mirroring simultaneously ona device.
This section contains the following topics:
• Packet Capture on Device Interfaces on page 164
• Firewall Filters for Packet Capture on page 165
• Packet Capture Files on page 165
• Analysis of Packet Capture Files on page 165
Packet Capture on Device Interfaces
Packet capture is supported on the T1, T3, E1, E3, serial, Fast Ethernet, ADSL, G.SHDSL,
PPPoE, and ISDN interfaces.
To capture packets on an ISDN interface, configure packet capture on the dialer interface.
To capture packets on a PPPoE interface, configure packet capture on the PPPoE logical
interface.
Packet capture supports PPP, Cisco HDLC, Frame Relay, and other ATM encapsulations.
Packet capture also supports Multilink PPP (MLPPP), Multilink Frame Relay end-to-end
(MLFR), and Multilink Frame Relay UNI/NNI (MFR) encapsulations.
You can capture all IPv4 packets flowing on an interface in the inbound or outbound
direction. However, on traffic that bypasses the flow software module (protocol packets
such as ARP, OSPF, and PIM), packets generated by the Routing Engine are not captured
unless you have configured and applied a firewall filter on the interface in the outbound
direction.
Tunnel interfaces can support packet capture in the outbound direction only.
Use the J-Web configuration editor or CLI configuration editor to specify the maximum
packet size, the filename to be used for storing the captured packets, the maximum file
size, the maximum number of packet capture files, and the file permissions.
NOTE: For packets captured on T1, T3, E1, E3, serial, and ISDN interfaces inthe outbound (egress) direction, the size of the packet capturedmight be1 byte less than themaximum packet size configured because of the packetloss priority (PLP) bit.
Copyright © 2011, Juniper Networks, Inc.164
Junos OS Monitoring and Troubleshooting Guide for Security Devices

To modify encapsulation on an interface that has packet capture configured, you must
first disable packet capture.
Firewall Filters for Packet Capture
When you enable packet capture on a device, all packets flowing in the direction specified
in packet capture configuration (inbound, outbound, or both) are captured and stored.
Configuring an interface to capture all packets might degrade the performance of the
device. You can control the number of packets captured on an interface with firewall
filters and specify various criteria to capture packets for specific traffic flows.
You must also configure and apply appropriate firewall filters on the interface if you need
to capture packets generated by the host device, because interface sampling does not
capture packets originating from the host device.
Packet Capture Files
When packet capture is enabled on an interface, the entire packet including the Layer 2
header is captured and stored in a file. You can specify the maximum size of the packet
to be captured, up to 1500 bytes. Packet capture creates one file for each physical
interface. You can specify the target filename, the maximum size of the file, and the
maximum number of files.
File creation and storage take place in the following way. Suppose you name the packet
capture file pcap-file. Packet capture creates multiple files (one per physical interface),
suffixing each file with the name of the physical interface; for example, pcap-file.fe-0.0.1
for the Fast Ethernet interface fe-0.0.1. When the file named pcap-file.fe-0.0.1 reaches
the maximum size, the file is renamed pcap-file.fe-0.0.1.0. When the file named
pcap-file.fe-0.0.1 reaches the maximum size again, the file named pcap-file.fe-0.0.1.0 is
renamed pcap-file.fe-0.0.1.1 and pcap-file.fe-0.0.1 is renamed pcap-file.fe-0.0.1.0. This
process continues until the maximum number of files is exceeded and the oldest file is
overwritten. The pcap-file.fe-0.0.1 file is always the latest file.
Packet capture files are not removed even after you disable packet capture on an interface.
Analysis of Packet Capture Files
Packet capture files are stored in libpcap format in the /var/tmpdirectory. You can specify
user or administrator privileges for the files.
Packet capture files can be opened and analyzed offline with tcpdump or any packet
analyzer that recognizes the libpcap format. You can also use FTP or the Session Control
Protocol (SCP) to transfer the packet capture files to an external device.
NOTE: Disable packet capture before opening the file for analysis ortransferring the file to an external device with FTP or SCP. Disabling packetcapture ensures that the internal file buffer is flushed and all the capturedpackets are written to the file.
165Copyright © 2011, Juniper Networks, Inc.
Chapter 5: Packet Capture for Network Traffic Analysis

RelatedDocumentation
Example: Enabling Packet Capture on a Device on page 166•
• Example: Configuring Packet Capture on an Interface on page 169
• Example: Configuring a Firewall Filter for Packet Capture on page 171
• Junos OS System Basics and Services Command Reference
• Junos OS Feature Support Reference for SRX Series and J Series Devices
• Junos OS Routing Policy Configuration Guide
Example: Enabling Packet Capture on a Device
This example shows how to enable packet capture on a device, allowing you to analyze
network traffic and troubleshoot network problems
• Requirements on page 166
• Overview on page 166
• Configuration on page 166
• Verification on page 167
Requirements
Before you begin:
• Establish basic connectivity. See the Getting Started Guide for your device.
• Configure network interfaces. See the JunosOS InterfacesConfigurationGuide forSecurity
Devices.
Overview
In this example, you set the maximum packet capture size in each file as 500 bytes. The
range is from 68 through 1500, and the default is 68 bytes. You specify the target filename
for the packet capture file as pcap-file. You then specify the maximum number of files
to capture as 100. The range is from 2 through 10,000, and the default is 10 files. You set
the maximum size of each file to 1024 bytes. The range is from 1,024 through 104,857,600,
and the default is 512,000 bytes. Finally, you specify that all users have permission to
read the packet capture files.
Configuration
CLI QuickConfiguration
To quickly configure this example, copy the following commands, paste them into a text
file, remove any line breaks, change any details necessary to match your network
configuration, and then copy and paste the commands into the CLI at the [edit]hierarchy
level.
set forwarding-options packet-capturemaximum-capture-size 500set packet-capture file filename pcap-file file files 100 size 1024world-readable
Copyright © 2011, Juniper Networks, Inc.166
Junos OS Monitoring and Troubleshooting Guide for Security Devices

Step-by-StepProcedure
The following example requires you to navigate various levels in the configuration
hierarchy. For instructions on how to do that, see Using the CLI Editor in Configuration
Mode in the Junos OS CLI User Guide.
To enable packet capture on a device:
1. Set the maximum packet capture size.
[edit]user@host# edit forwarding-optionsuser@host# set packet-capturemaximum-capture-size 500
2. Specify the target filename.
[edit forwarding-options]user@host# set packet-capture file filename pcap-file
3. Specify the maximum number of files to capture.
[edit forwarding-options]user@host# set packet-capture file files 100
4. Specify the maximum size of each file.
[edit forwarding-options]user@host# set packet-capture file size 1024
5. Specify that all users have permission to read the file.
[edit forwarding-options]user@host# set packet-capture file world-readable
Results From configuration mode, confirm your configuration by entering the show
forwarding-options command. If the output does not display the intended configuration,
repeat the configuration instructions in this example to correct it.
[edit]user@host# show forwarding-optionspacket-capture {file filename pcap-file files 100 size 1k world-readable;maximum-capture-size 500;
}
If you are done configuring the device, enter commit from configuration mode.
Verification
Confirm that the configuration is working properly.
• Verifying the Packet Capture Configuration on page 167
• Verifying Captured Packets on page 168
Verifying the Packet Capture Configuration
Purpose Verify that the packet capture is configured on the device.
167Copyright © 2011, Juniper Networks, Inc.
Chapter 5: Packet Capture for Network Traffic Analysis

Action From configuration mode, enter the show forwarding-options command. Verify that the
output shows the intended file configuration for capturing packets.
Verifying Captured Packets
Purpose Verify that the packet capture file is stored under the /var/tmp directory and the packets
can be analyzed offline.
Action Disable packet capture.
Using FTP, transfer a packet capture file (for example, 126b.fe-0.0.1), to a server where
you have installed packet analyzer tools (for example, tools-server).
1.
a. From configuration mode, connect to tools-server using FTP.
[edit]user@host# run ftp tools-serverConnected to tools-server.mydomain.net220 tools-server.mydomain.net FTP server (Version 6.00LS) readyName (tools-server:user):remoteuser331 Password required for remoteuser.Password:230 User remoteuser logged in.Remote system type is UNIX.Using binary mode to transfer files.ftp>
b. Navigate to the directory where packet capture files are stored on the device.
ftp> lcd /var/tmpLocal directory now /cf/var/tmp
c. Copy the packet capture file that you want to analyze to the server, for example
126b.fe-0.0.1.
ftp> put 126b.fe-0.0.1local: 126b.fe-0.0.1 remote: 126b.fe-0.0.1200 PORT command successful.150 Opening BINARYmode data connection for '126b.fe-0.0.1'.100% 1476 00:00 ETA226 Transfer complete.1476 bytes sent in 0.01 seconds (142.42 KB/s)
d. Return to configuration mode.
ftp> bye221 Goodbye.[edit]user@host#
2. Open the packet capture file on the server with tcpdump or any packet analyzer that
supports libpcap format and review the output.
root@server% tcpdump -r 126b.fe-0.0.1 -xevvvv
01:12:36.279769 Out 0:5:85:c4:e3:d1 > 0:5:85:c8:f6:d1, ethertype IPv4 (0x0800), length 98: (tos 0x0, ttl 64, id 33133, offset 0, flags [none], proto: ICMP (1),
Copyright © 2011, Juniper Networks, Inc.168
Junos OS Monitoring and Troubleshooting Guide for Security Devices

length: 84) 14.1.1.1 > 15.1.1.1: ICMP echo request seq 0, length 64 0005 85c8 f6d1 0005 85c4 e3d1 0800 4500 0054 816d 0000 4001 da38 0e01 0101 0f01 0101 0800 3c5a 981e 0000 8b5d 4543 51e6 0100 aaaa aaaa aaaa aaaa aaaa aaaa aaaa aaaa aaaa 0000 0000 0000 0000 0000 0000 0000 0000 0000 0000 0000 0000 0000 0000 000001:12:36.279793 Out 0:5:85:c8:f6:d1 > 0:5:85:c4:e3:d1, ethertype IPv4 (0x0800), length 98: (tos 0x0, ttl 63, id 41227, offset 0, flags [none], proto: ICMP (1), length: 84) 15.1.1.1 > 14.1.1.1: ICMP echo reply seq 0, length 64 0005 85c4 e3d1 0005 85c8 f6d1 0800 4500 0054 a10b 0000 3f01 bb9a 0f01 0101 0e01 0101 0000 445a 981e 0000 8b5d 4543 51e6 0100 aaaa aaaa aaaa aaaa aaaa aaaa aaaa aaaa aaaa 0000 0000 0000 0000 0000 0000 0000 0000 0000 0000 0000 0000 0000 0000 0000root@server%
RelatedDocumentation
Packet Capture Overview on page 163•
• Example: Configuring Packet Capture on an Interface on page 169
• Disabling Packet Capture on page 173
• Junos OS CLI User Guide
• Junos OS Interfaces Command Reference
• Junos OS Feature Support Reference for SRX Series and J Series Devices
Example: Configuring Packet Capture on an Interface
This example shows how to configure packet capture on an interface to analyze traffic.
• Requirements on page 169
• Overview on page 169
• Configuration on page 170
• Verification on page 170
Requirements
Before you begin:
• Establish basic connectivity. See the Getting Started Guide for your device.
• Configure network interfaces. See the JunosOS InterfacesConfigurationGuide forSecurity
Devices.
Overview
In this example, you create an interface called fe-0/0/1. You then configure the direction
of the traffic for which you are enabling packet capture on the logical interface as inbound
and outbound.
169Copyright © 2011, Juniper Networks, Inc.
Chapter 5: Packet Capture for Network Traffic Analysis

NOTE: On traffic that bypasses the flow softwaremodule (protocol packetssuch as ARP, OSPF, and PIM), packets generated by the Routing Engine arenot captured unless you have configured and applied a firewall filter on theinterface in the output direction.
Configuration
CLI QuickConfiguration
To quickly configure this example, copy the following commands, paste them into a text
file, remove any line breaks, change any details necessary to match your network
configuration, and then copy and paste the commands into the CLI at the [edit]hierarchy
level.
edit interfaces fe-0/0/1set unit 0 family inet sampling input output
Step-by-StepProcedure
The following example requires you to navigate various levels in the configuration
hierarchy. For instructions on how to do that, see Using the CLI Editor in Configuration
Mode in the Junos OS CLI User Guide.
To configure packet capture on an interface:
1. Create an interface.
[edit]user@host# edit interfaces fe-0/0/1
2. Configure the direction of the traffic.
[edit interfaces fe-0/0/1]user@host# set unit 0 family inet sampling input output
3. If you are done configuring the device, commit the configuration.
[edit]user@host# commit
Verification
Confirm that the configuration is working properly.
• Verifying the Packet Capture Configuration on page 170
Verifying the Packet Capture Configuration
Purpose Verify that packet capture is configured on the interface.
Action From configuration mode, enter the show interfaces fe-0/0/1 command.
RelatedDocumentation
Packet Capture Overview on page 163•
• Example: Configuring a Firewall Filter for Packet Capture on page 171
• Junos OS System Basics and Services Command Reference
Copyright © 2011, Juniper Networks, Inc.170
Junos OS Monitoring and Troubleshooting Guide for Security Devices

• Junos OS Interfaces Command Reference
• Junos OS Feature Support Reference for SRX Series and J Series Devices
• Junos OS Routing Policy Configuration Guide
Example: Configuring a Firewall Filter for Packet Capture
This example shows how to configure a firewall filter for packet capture and apply it to
a logical interface.
• Requirements on page 171
• Overview on page 171
• Configuration on page 171
• Verification on page 172
Requirements
Before you begin:
• Establish basic connectivity. See the Getting Started Guide for your device.
• Configure network interfaces. See the JunosOS InterfacesConfigurationGuide forSecurity
Devices.
Overview
In this example, you set a firewall filter called dest-all and a term name called dest-term
to capture packets from a specific destination address, which is 192.168.1.1/32. You define
the match condition to accept the sampled packets. Finally, you apply the dest-all filter
to all of the outgoing packets on interface fe-0/0/1.
NOTE: If you apply a firewall filter on the loopback interface, it affects alltraffic toand fromtheRoutingEngine. If the firewall filter hasa sampleaction,
packets to and from the Routing Engine are sampled. If packet capture isenabled, then packets to and from the Routing Engine are captured in thefiles created for the input and output interfaces.
Configuration
CLI QuickConfiguration
To quickly configure this example, copy the following commands, paste them into a text
file, remove any line breaks, change any details necessary to match your network
configuration, and then copy and paste the commands into the CLI at the [edit]hierarchy
level.
set firewall filter dest-all term dest-term from destination-address 192.168.1.1/32set firewall filter dest-all term dest-term then sample acceptedit interfacesset interfaces fe-0/0/1 unit 0 family inet filter output dest-all
171Copyright © 2011, Juniper Networks, Inc.
Chapter 5: Packet Capture for Network Traffic Analysis

Step-by-StepProcedure
The following example requires you to navigate various levels in the configuration
hierarchy. For instructions on how to do that, see Using the CLI Editor in Configuration
Mode in the Junos OS CLI User Guide.
To configure a firewall filter for packet capture and apply it to a logical interface:
1. Specify the firewall filter and its destination address.
[edit]user@host# edit firewalluser@host#set filterdest-all termdest-termfromdestination-address192.168.1.1/32
2. Define the match condition and its action.
[edit firewall]user@host# set filter dest-all term dest-term then sample accept
3. Apply the filter to all the outgoing packets.
[edit interfaces]user@host# set interfaces fe-0/0/1 unit 0 family inet filter output dest-all
Results From configuration mode, confirm your configuration by entering the show firewall filter
dest-all command. If the output does not display the intended configuration, repeat the
configuration instructions in this example to correct it.
[edit]user@host# show firewall filter dest-allterm dest-term {from {destination-address 192.168.1.1/32;
}then {sample;accept;
}}
If you are done configuring the device, enter commit from configuration mode.
Verification
Confirm that the configuration is working properly.
• Verifying the Firewall Filter for Packet Capture Configuration on page 172
Verifying the Firewall Filter for Packet Capture Configuration
Purpose Verify that the firewall filter for packet capture is configured.
Action From configuration mode, enter the show firewall filter dest-all command. Verify that the
output shows the intended configuration of the firewall filter for capturing packets sent
to the destination address.
Copyright © 2011, Juniper Networks, Inc.172
Junos OS Monitoring and Troubleshooting Guide for Security Devices

RelatedDocumentation
Packet Capture Overview on page 163•
• Example: Configuring Packet Capture on an Interface on page 169
• Junos OS CLI User Guide
• Junos OS System Basics and Services Command Reference
• Junos OS Feature Support Reference for SRX Series and J Series Devices
• Junos OS Routing Policy Configuration Guide
Packet Capture Tasks
This section contains the following topics:
• Disabling Packet Capture on page 173
• Deleting Packet Capture Files on page 173
• Changing Encapsulation on Interfaces with Packet Capture Configured on page 174
Disabling Packet Capture
You must disable packet capture before opening the packet capture file for analysis or
transferring the file to an external device. Disabling packet capture ensures that the
internal file buffer is flushed and all the captured packets are written to the file.
To disable packet capture, enter from configuration mode:
[edit forwarding-options]user@host# set packet-capture disable
If you are done configuring the device, enter commit from configuration mode.
Deleting Packet Capture Files
Deleting packet capture files from the /var/tmp directory only temporarily removes the
packet capture files. Packet capture files for the interface are automatically created
again the next time a packet capture configuration change is committed or as part of a
packet capture file rotation.
To delete a packet capture file:
1. Disable packet capture (see “Disabling Packet Capture” on page 173).
2. Delete the packet capture file for the interface.
a. From operational mode, access the local UNIX shell.
user@host> start shell%
b. Navigate to the directory where packet capture files are stored.
% cd /var/tmp%
173Copyright © 2011, Juniper Networks, Inc.
Chapter 5: Packet Capture for Network Traffic Analysis

c. Delete the packet capture file for the interface; for example pcap-file.fe.0.0.0.
% rm pcap-file.fe.0.0.0%
d. Return to operational mode.
% exituser@host>
3. Reenable packet capture (see “Example: Enabling Packet Capture on a Device” on
page 166).
4. If you are done configuring the device, enter commit from configuration mode.
Changing Encapsulation on Interfaces with Packet Capture Configured
Before modifying the encapsulation on a device interface that is configured for packet
capture, you must disable packet capture and rename the latest packet capture file.
Otherwise, packet capture saves the packets with different encapsulations in the same
packet capture file. Packet files containing packets with different encapsulations are not
useful, because packet analyzer tools like tcpdump cannot analyze such files.
After modifying the encapsulation, you can safely reenable packet capture on the device.
To change the encapsulation on interfaces with packet capture configured:
1. Disable packet capture (see “Disabling Packet Capture” on page 173).
2. Enter commit from configuration mode.
3. Rename the latest packet capture file on which you are changing the encapsulation
with the .chdsl extension.
a. From operational mode, access the local UNIX shell.
user@host> start shell%
b. Navigate to the directory where packet capture files are stored.
% cd /var/tmp%
c. Rename the latest packet capture file for the interface on which you are changing
the encapsulation; for example fe.0.0.0.
%mv pcap-file.fe.0.0.0 pcap-file.fe.0.0.0.chdsl%
d. Return to operational mode.
% exituser@host>
4. Change the encapsulation on the interface using the J-Web user interface or CLI
configuration editor.
5. If you are done configuring the device, enter commit from configuration mode.
Copyright © 2011, Juniper Networks, Inc.174
Junos OS Monitoring and Troubleshooting Guide for Security Devices

6. Reenable packet capture (see “Example: Enabling Packet Capture on a Device” on
page 166).
7. If you are done configuring the device, enter commit from configuration mode.
RelatedDocumentation
• Packet Capture Overview on page 163
• Example: Configuring Packet Capture on an Interface on page 169
• Junos OS System Basics and Services Command Reference
• Junos OS Interfaces Command Reference
• Junos OS Feature Support Reference for SRX Series and J Series Devices
• Junos OS Routing Policy Configuration Guide
175Copyright © 2011, Juniper Networks, Inc.
Chapter 5: Packet Capture for Network Traffic Analysis

Copyright © 2011, Juniper Networks, Inc.176
Junos OS Monitoring and Troubleshooting Guide for Security Devices

CHAPTER 6
Debugging For SRX Series ServicesGateways
• Data Path Debugging for SRX Series Devices on page 177
• Security Debugging for SRX Series Devices on page 179
• Flow Debugging for SRX Series Devices on page 181
Data Path Debugging for SRX Series Devices
This section contains the following topics:
• Understanding Data Path Debugging for SRX Series Devices on page 177
• Debugging the Data Path (CLI Procedure) on page 178
Understanding Data Path Debugging for SRX Series Devices
Data path debugging provides tracing and debugging at multiple processing units along
the packet-processing path. The packet filter can be executed with minimal impact to
the production system.
In data path debugging, a packet goes through multiple Services Processing Units (SPUs).
At the same time, several Flexible PIC Concentrator (FPC) I/O cards (IOCs) provide
EZchip ingress and egress traffic management. Junos OS supports IOC for filter-based,
per-packet counting and logging to record the processing path of a packet. Only the
matched packets are traced by the IOC EZchip ingress, EZchip egress, load-balancing
thread (LBT), and packet-ordering thread (POT).
The following events are defined in the packet-processing path:
• ezchip ingress
• ezchip egress
• spu.lbt
• spu.pot
177Copyright © 2011, Juniper Networks, Inc.

NOTE:
The packet-filtering behavior for the port and interface options is as follows:
• The packet filter traces both IPv4 and IPv6 traffic if only port is specified.
• The packet filter traces IPv4, IPV6, and non-IP traffic if only interface is
specified.
RelatedDocumentation
Junos OS Feature Support Reference for SRX Series and J Series Devices•
• Debugging the Data Path (CLI Procedure) on page 178
Debugging the Data Path (CLI Procedure)
To configure the device for data path debugging:
1. Specify the following request command to set the data path debugging for the multipleprocessing units along the packet-processing path:
[edit]user@host# set security datapath-debug
2. Specify the trace options for data path-debug using the following command:
[edit]user@host# set security datapath-debug traceoptions
3. Using the request security packet-filter command, you can set the packet filter tospecify the related packets to perform data path-debug action. A maximum of fourfilters are supported at the same time. For example, the following command sets thefirst packet-filter:
[edit]user@host# set security datapath-debug packet-filter name
4. Using the request security action-profile command, you can set the action for thepacket match for a specified filter. Only the default action profile is supported, whichis the trace option for network processor ezchip ingress, ezchip egress, spu.lbt, andspu.pot:
[edit]user@host# set security datapath-debug packet-filter name action-profile
RelatedDocumentation
Junos OS Feature Support Reference for SRX Series and J Series Devices•
• Understanding Data Path Debugging for SRX Series Devices on page 177
Copyright © 2011, Juniper Networks, Inc.178
Junos OS Monitoring and Troubleshooting Guide for Security Devices

Security Debugging for SRX Series Devices
This section contains the following topics:
• Understanding Security Debugging Using Trace Options on page 179
• Setting Security Trace Options (CLI Procedure) on page 179
• Displaying Output for Security Trace Options on page 180
Understanding Security Debugging Using Trace Options
The Junos OS trace function allows applications to write security debugging information
to a file. The information that appears in this file is based on criteria you set. You can use
this information to analyze security application issues.
The trace function operates in a distributed manner, with each thread writing to its own
trace buffer. These trace buffers are then collected at one point, sorted, and written to
trace files. Trace messages are delivered using the InterProcess Communications (IPC)
protocol. A trace message has a lower priority than that of control protocol packets such
as BGP, OSPF, and IKE, and therefore delivery is not considered to be as reliable.
RelatedDocumentation
Junos OS Feature Support Reference for SRX Series and J Series Devices•
• Setting Security Trace Options (CLI Procedure) on page 179
• Displaying Output for Security Trace Options on page 180
Setting Security Trace Options (CLI Procedure)
Use the following configuration statements to configure security trace options in the CLI
configuration editor.
• To disable remote tracing, enter the following statement:
[edit]user@host# set security traceoptions no-remote-trace
• To write trace messages to a local file, enter the following statement. The systemsaves the trace file in the /var/log/ directory.
[edit]user@host# set security traceoptions use-local-files
• To specify a name for the trace file, enter the following statement. Valid values rangefrom 1 and 1024 characters. The name cannot include spaces, /, or % characters. Thedefault filename is security.
[edit]user@host# set security traceoptions file filename
• To specify the maximum number of trace files that can accumulate, enter the followingstatement. Valid values range from 2 to 1000. The default value is 3.
[edit]user@host# set security traceoptions file files 3
179Copyright © 2011, Juniper Networks, Inc.
Chapter 6: Debugging For SRX Series Services Gateways

• To specify the match criteria that you want the system to use when logging informationto the file, enter the following statement. Enter a regular expression. Wildcard (*)characters are accepted.
[edit]user@host# set security traceoptions file match *thread
• To allow any user to read the trace file, enter theworld-readable statement. Otherwise,enter the no-world-readable statement.
[edit]user@host# set security traceoptions file world-readableuser@host# set security traceoptions file no-world-readable
• To specify the maximum size to which the trace file can grow, enter the followingstatement. Once the file reaches the specified size, it is compressed and renamedfilename0.gz, the next file is named filename1.gz, and so on. Valid values range from10240 to 1,073,741,824.
[edit]user@host# set security traceoptions file size 10240
• To turn on trace options and to perform more than one tracing operation, set thefollowing flags.
[edit]user@host# set security traceoptions flag alluser@host# set security traceoptions flag compilationuser@host# set security traceoptions flag configurationuser@host# set security traceoptions flag routing-socket
• To specify the groups that these trace option settings do or do not apply to, enter the
following statements:
[edit]user@host# set security traceoptions apply-groups valueuser@host# set security traceoptions apply-groups-except value
RelatedDocumentation
Junos OS Feature Support Reference for SRX Series and J Series Devices•
• Understanding Security Debugging Using Trace Options on page 179
• Displaying Output for Security Trace Options on page 180
Displaying Output for Security Trace Options
Purpose Display output for security trace options.
Action Use the show security traceoptions command to display the output of your trace files.For example:
[edit]user@host # show security traceoptions file usp_traceuser@host # show security traceoptions flag alluser@host # show security traceoptions rate-limit 888
Copyright © 2011, Juniper Networks, Inc.180
Junos OS Monitoring and Troubleshooting Guide for Security Devices

The output for this example is as follows:
Apr 11 16:06:42 21:13:15.750395:CID-906489336:FPC-01:PIC-01:THREAD_ID-01:PFE:nowupdate 0x3607edf8df8in 0x3607e8d0
Apr11 16:06:4221:13:15.874058:CID-1529687608:FPC-01:PIC-01:THREAD_ID-01:CTRL:EnterFunction[util_ssam_handler]
Apr 11 16:06:4221:13:15.874485:CID-00:FPC-01:PIC-01:THREAD_ID-01:CTRL:default1:Ratelimit changed to 888
Apr 11 16:06:42 21:13:15.874538:CID-00:FPC-01:PIC-01:THREAD_ID-01:CTRL:default1:Destination ID set to 1
Apr 11 16:06:4221:13:15.874651:CID-00:FPC-01:PIC-01:THREAD_ID-01:CTRL:default2:Ratelimit changed to 888
Apr 11 16:06:42 21:13:15.874832:CID-00:FPC-01:PIC-01:THREAD_ID-01:CTRL:default2:Destination ID set to 1
Apr 11 16:06:4221:13:15.874942:CID-00:FPC-01:PIC-01:THREAD_ID-01:CTRL:default3:Ratelimit changed to 888
Apr 11 16:06:42 21:13:15.874997:CID-00:FPC-01:PIC-01:THREAD_ID-01:CTRL:default3:Destination ID set to 1
RelatedDocumentation
Junos OS Feature Support Reference for SRX Series and J Series Devices•
• Understanding Security Debugging Using Trace Options on page 179
• Setting Security Trace Options (CLI Procedure) on page 179
Flow Debugging for SRX Series Devices
This section contains the following topics:
• Understanding Flow Debugging Using Trace Options on page 181
• Setting Flow Debugging Trace Options (CLI Procedure) on page 181
Understanding Flow Debugging Using Trace Options
For flow trace options, you can define a packet filter using combinations of
destination-port, destination-prefix, interface, protocol, source-port, and source-prefix. If
the security flow trace flag for a certain module is set, the packet matching the specific
packet filter triggers flow tracing and writes debugging information to the trace file.
RelatedDocumentation
Junos OS Feature Support Reference for SRX Series and J Series Devices•
• Setting Flow Debugging Trace Options (CLI Procedure) on page 181
Setting Flow Debugging Trace Options (CLI Procedure)
The following examples display the options you can set by usingsecurity flowtraceoptions.
• To match the imap destination port for the filter1 packet filter, use the following
statement:
[edit]user@host# set security flow traceoptions packet-filter filter1 destination-port imap
181Copyright © 2011, Juniper Networks, Inc.
Chapter 6: Debugging For SRX Series Services Gateways

• To set the 1.2.3.4 destination IPv4 prefix address for the filter1 packet filter, use thefollowing statement:
[edit]user@host# set security flowtraceoptionspacket-filter filter1 destination-prefix 1.2.3.4
• To set the fxp0 logical interface for the filter1 packet filter, use the following statement:
[edit]user@host# set security flow traceoptions packet-filter filter1 interface fxp0
• To match the TCP IP protocol for the filter1 packet filter, use the following statement:
[edit]user@host# set security flow traceoptions packet-filter filter1 protocol tcp
• To match the HTTP source port for the filter1 packet filter, use the following statement:
[edit]user@host# set security flow traceoptions packet-filter filter1 source-port http
• To set the 5.6.7.8 IPv4 prefix address for the filter1 packet filter, use the followingstatement:
[edit]user@host# set security flow traceoptions packet-filter filter1 source-prefix 5.6.7.8
RelatedDocumentation
• Junos OS Feature Support Reference for SRX Series and J Series Devices
• Understanding Flow Debugging Using Trace Options on page 181
Copyright © 2011, Juniper Networks, Inc.182
Junos OS Monitoring and Troubleshooting Guide for Security Devices

CHAPTER 7
RPM Probes for PerformanceMeasurement
• RPM Overview on page 183
• RPM Configuration on page 187
• RPM Support for VPN Routing and Forwarding on page 202
• Monitoring RPM Probes on page 202
RPMOverview
The real-time performance monitoring (RPM) feature allows network operators and
their customers to accurately measure the performance between two network endpoints.
With the RPM tool, you configure and send probes to a specified target and monitor the
analyzed results to determine packet loss, round-trip time, and jitter.
RPM allows you to perform service-level monitoring. When RPM is configured on a device,
the device calculates network performance based on packet response time, jitter, and
packet loss. These values are gathered by Hypertext Transfer Protocol (HTTP) GET
requests, Internet Control Message Protocol (ICMP) requests, and TCP and UDP requests,
depending on the configuration.
This section contains the following topics:
• RPM Probes on page 183
• RPM Tests on page 184
• Probe and Test Intervals on page 184
• Jitter Measurement with Hardware Timestamping on page 184
• RPM Statistics on page 185
• RPM Thresholds and Traps on page 186
• RPM for BGP Monitoring on page 186
RPMProbes
You gather RPM statistics by sending out probes to a specified probe target, identified
by an IP address or URL. When the target receives the probe, it generates responses,
183Copyright © 2011, Juniper Networks, Inc.

which are received by the device. By analyzing the transit times to and from the remote
server, the device can determine network performance statistics.
The device sends out the following probe types:
• HTTP GET request at a target URL
• HTTP GET request for metadata at a target URL
• ICMP echo request to a target address (the default)
• ICMP timestamp request to a target address
• UDP ping packets to a target device
• UDP timestamp requests to a target address
• TCP ping packets to a target device
UDP and TCP probe types require that the remote server be configured as an RPM receiver
so that it generates responses to the probes.
The RPM probe results are also available in the form of MIB objects through the SNMP
protocol.
RPMTests
Each probed target is monitored over the course of a test. A test represents a collection
of probes, sent out at regular intervals, as defined in the configuration. Statistics are then
returned for each test. Because a test is a collection of probes that have been monitored
over some amount of time, test statistics such as standard deviation and jitter can be
calculated and included with the average probe statistics.
Probe and Test Intervals
Within a test, RPM probes are sent at regular intervals, configured in seconds. When the
total number of probes has been sent and the corresponding responses received, the
test is complete. You can manually set the probe interval for each test to control how
the RPM test is conducted.
After all the probes for a particular test have been sent, the test begins again. The time
between tests is the test interval. You can manually set the test interval to tune RPM
performance.
Jitter Measurement with Hardware Timestamping
Jitter is the difference in relative transit time between two consecutive probes.
You can timestamp the following RPM probes to improve the measurement of latency
or jitter:
• ICMP ping
• ICMP ping timestamp
Copyright © 2011, Juniper Networks, Inc.184
Junos OS Monitoring and Troubleshooting Guide for Security Devices
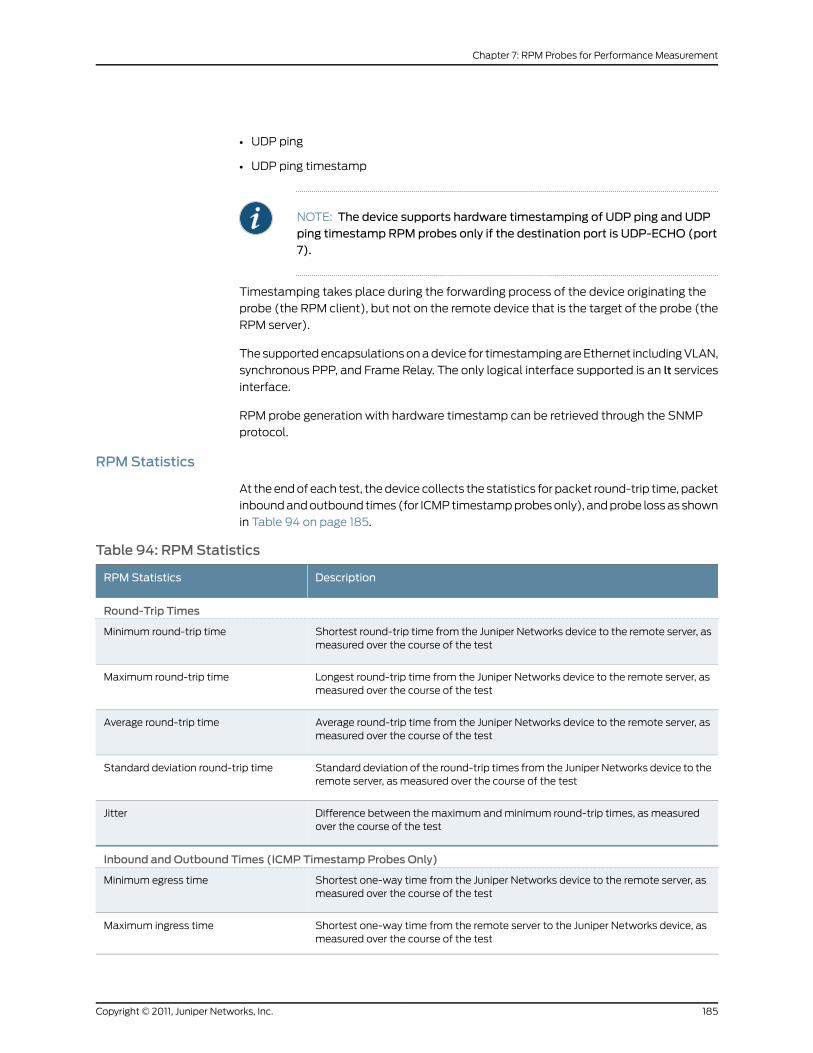
• UDP ping
• UDP ping timestamp
NOTE: The device supports hardware timestamping of UDP ping and UDPping timestamp RPM probes only if the destination port is UDP-ECHO (port7).
Timestamping takes place during the forwarding process of the device originating the
probe (the RPM client), but not on the remote device that is the target of the probe (the
RPM server).
The supported encapsulations on a device for timestamping are Ethernet including VLAN,
synchronous PPP, and Frame Relay. The only logical interface supported is an lt services
interface.
RPM probe generation with hardware timestamp can be retrieved through the SNMP
protocol.
RPMStatistics
At the end of each test, the device collects the statistics for packet round-trip time, packet
inbound and outbound times (for ICMP timestamp probes only), and probe loss as shown
in Table 94 on page 185.
Table 94: RPMStatistics
DescriptionRPM Statistics
Round-Trip Times
Shortest round-trip time from the Juniper Networks device to the remote server, asmeasured over the course of the test
Minimum round-trip time
Longest round-trip time from the Juniper Networks device to the remote server, asmeasured over the course of the test
Maximum round-trip time
Average round-trip time from the Juniper Networks device to the remote server, asmeasured over the course of the test
Average round-trip time
Standard deviation of the round-trip times from the Juniper Networks device to theremote server, as measured over the course of the test
Standard deviation round-trip time
Difference between the maximum and minimum round-trip times, as measuredover the course of the test
Jitter
Inbound and Outbound Times (ICMP Timestamp Probes Only)
Shortest one-way time from the Juniper Networks device to the remote server, asmeasured over the course of the test
Minimum egress time
Shortest one-way time from the remote server to the Juniper Networks device, asmeasured over the course of the test
Maximum ingress time
185Copyright © 2011, Juniper Networks, Inc.
Chapter 7: RPM Probes for Performance Measurement

Table 94: RPMStatistics (continued)
DescriptionRPM Statistics
Average one-way time from the Juniper Networks device to the remote server, asmeasured over the course of the test
Average egress time
Average one-way time from the remote server to the Juniper Networks device, asmeasured over the course of the test
Average ingress time
Standard deviation of the one-way times from the Juniper Networks device to theremote server, as measured over the course of the test
Standard deviation egress time
Standard deviation of the one-way times from the remote server to the JuniperNetworks device, as measured over the course of the test
Standard deviation ingress time
Difference between the maximum and minimum outbound times, as measuredover the course of the test
Egress jitter
Difference between the maximum and minimum inbound times, as measured overthe course of the test
Ingress jitter
Probe Counts
Total number of probes sent over the course of the testProbes sent
Total number of probe responses received over the course of the testProbe responses received
Percentage of probes sent for which a response was not receivedLoss percentage
RPMThresholds and Traps
You can configure RPM threshold values for the round-trip times, ingress (inbound) times,
and egress (outbound) times that are measured for each probe, as well as for the standard
deviation and jitter values that are measured for each test. Additionally, you can configure
threshold values for the number of successive lost probes within a test and the total
number of lost probes within a test.
If the result of a probe or test exceeds any threshold, the device generates a system log
message and sends any Simple Network Management Protocol (SNMP) notifications
(traps) that you have configured.
RPM for BGPMonitoring
When managing peering networks that are connected using Border Gateway Protocol
(BGP), you might need to find out if a path exists between the Juniper Networks device
and its configured BGP neighbors. You can ping each BGP neighbor manually to determine
the connection status, but this method is not practical when the device has a large number
of BGP neighbors configured.
In the device, you can configure RPM probes to monitor the BGP neighbors and determine
if they are active.
Copyright © 2011, Juniper Networks, Inc.186
Junos OS Monitoring and Troubleshooting Guide for Security Devices

RelatedDocumentation
RPM Configuration Options on page 187•
• Example: Configuring Basic RPM Probes on page 191
• RPM Support for VPN Routing and Forwarding on page 202
• Monitoring RPM Probes on page 202
• Junos OS Services Interfaces Configuration Guide
• Junos OS Feature Support Reference for SRX Series and J Series Devices
RPMConfiguration
This section contains the following options:
• RPM Configuration Options on page 187
• Example: Configuring Basic RPM Probes on page 191
• Example: Configuring RPM Using TCP and UDP Probes on page 195
• Tuning RPM Probes on page 197
• Example: Configuring RPM Probes for BGP Monitoring on page 198
• Directing RPM Probes to Select BGP Devices on page 201
• Configuring RPM Timestamping on page 201
RPMConfiguration Options
You can configure real-time performance monitoring (RPM) parameters. See Table 95
on page 187 for a summary of the configuration options.
Table 95: RPMConfiguration Summary
Your ActionFunctionField
Performance Probe Owners
Type the name of the RPM owner.Identifies an RPM owner for which one or more RPMtests are configured. In most implementations, theowner name identifies a network on which a set oftests is being run (a particular customer, for example).
Owner Name(required)
Identification
Type the name of the RPM test.Uniquely identifies the RPM testTest name (required)
Type the IP address, in dotted decimalnotation, or the URL of the probe target. If thetarget is a URL, type a fully formed URL thatincludes http://.
IP address or URL of probe targetTarget (Address orURL) (required)
Type the source address to be used for theprobe. If the source IP address is not one of thedevice's assigned addresses, the packet usesthe outgoing interface's address as its source.
Explicitly configured IP address to be used as theprobe source address
Source Address
187Copyright © 2011, Juniper Networks, Inc.
Chapter 7: RPM Probes for Performance Measurement

Table 95: RPMConfiguration Summary (continued)
Your ActionFunctionField
Type the routing instance name. The routinginstance applies only to probes of type icmpand icmp-timestamp. The default routinginstance is inet.0.
Particular routing instance over which the probe issent
Routing Instance
Type a number between 0 and 255. The defaulthistory size is 50 probes.
Number of probe results saved in the probe historyHistory Size
Request Information
Select the desired probe type from the list:
• http-get
• http-get-metadata
• icmp-ping
• icmp-ping-timestamp
• tcp-ping
• udp-ping
Specifies the type of probe to send as part of the test.Probe Type (required)
Type a number between 1 and 255 (seconds).Sets the wait time (in seconds) between each probetransmission
Interval
Type a number between 0 and 86400(seconds).
Sets the wait time (in seconds) between tests.Test Interval(required)
Type a number between 1 and 15.Sets the total number of probes to be sent for eachtest.
Probe Count
Type the number 7—a standard TCP or UDPport number—or a port number from 49152through 65535.
Specifies the TCP or UDP port to which probes aresent.
To use TCP or UDP probes, you must configure theremote server as a probe receiver. Both the probeserver and the remote server must be JuniperNetworks devices configured to receive and transmitRPM probes on the same TCP or UDP port.
Destination Port
Type a valid 6–bit pattern.Specifies the Differentiated Services code point(DSCP) bits. This value must be a valid 6–bit pattern.The default is 000000.
DSCP Bits
Type a size (in bytes) between 0 and 65507.Specifies the size of the data portion of the ICMPprobes.
Data Size
Type a hexadecimal value between 1 and 800hto use as the contents of the ICMP probe data.
Specifies the contents of the data portion of the ICMPprobes.
Data Fill
Copyright © 2011, Juniper Networks, Inc.188
Junos OS Monitoring and Troubleshooting Guide for Security Devices

Table 95: RPMConfiguration Summary (continued)
Your ActionFunctionField
To enable timestamping, select the check box.Enables timestamping of RPM probe messages. Youcan timestamp the following RPM probes to improvethe measurement of latency or jitter:
• ICMP ping
• ICMP ping timestamp
• UDP ping—destination port UDP-ECHO (port 7)only
• UDP ping timestamp—destination port UDP-ECHO(port 7) only
Hardware Timestamp
MaximumProbe Thresholds
Type a number between 0 and 15.Sets the total number of probes that must be lostsuccessively to trigger a probe failure and generate asystem log message.
Successive LostProbes
Type a number between 0 and 15.Sets the total number of probes that must be lost totrigger a probe failure and generate a system logmessage.
Lost Probes
Type a number between 0 and 60,000,000(microseconds).
Sets the total round-trip time (in microseconds), fromthe device to the remote server, that triggers a probefailure and generates a system log message.
Round Trip Time
Type a number between 0 and 60,000,000(microseconds).
Sets the total jitter (in microseconds), for a test, thattriggers a probe failure and generates a system logmessage.
Jitter
Type a number between 0 and 60,000,000(microseconds).
Sets the maximum allowable standard deviation (inmicroseconds) for a test, which, if exceeded, triggersa probe failure and generates a system log message.
Standard Deviation
Type a number between 0 and 60,000,000(microseconds).
Sets the total one-way time (in microseconds), fromthe device to the remote server, that triggers a probefailure and generates a system log message.
Egress Time
Type a number between 0 and 60,000,000(microseconds)
Sets the total one-way time (in microseconds), fromthe remote server to the device, that triggers a probefailure and generates a system log message.
Ingress Time
Type a number between 0 and 60,000,000(microseconds)
Sets the total outbound-time jitter (in microseconds),for a test, that triggers a probe failure and generatesa system log message.
Jitter Egress Time
Type a number between 0 and 60,000,000(microseconds).
Sets the total inbound-time jitter (in microseconds),for a test, that triggers a probe failure and generatesa system log message.
Jitter Ingress Time
189Copyright © 2011, Juniper Networks, Inc.
Chapter 7: RPM Probes for Performance Measurement

Table 95: RPMConfiguration Summary (continued)
Your ActionFunctionField
Type a number between 0 and 60,000,000(microseconds).
Sets the maximum allowable standard deviation ofoutbound times (in microseconds) for a test, which,if exceeded, triggers a probe failure and generates asystem log message.
Egress StandardDeviation
Type a number between 0 and 60,000,000(microseconds).
Sets the maximum allowable standard deviation ofinbound times (in microseconds) for a test, which, ifexceeded, triggers a probe failure and generates asystem log message.
Ingress StandardDeviation
Traps
• To enable SNMP traps for this condition,select the check box.
• To disable SNMP traps, clear the check box.
Generates SNMP traps when the threshold for jitterin outbound time is exceeded.
Egress JitterExceeded
• To enable SNMP traps for this condition,select the check box.
• To disable SNMP traps, clear the check box.
Generates SNMP traps when the threshold forstandard deviation in outbound times is exceeded.
Egress StandardDeviation Exceeded
• To enable SNMP traps for this condition,select the check box.
• To disable SNMP traps, clear the check box.
Generates SNMP traps when the threshold formaximum outbound time is exceeded.
Egress TimeExceeded
• To enable SNMP traps for this condition,select the check box.
• To disable SNMP traps, clear the check box.
Generates SNMP traps when the threshold for jitterin inbound time is exceeded.
Ingress JitterExceeded
• To enable SNMP traps for this condition,select the check box.
• To disable SNMP traps, clear the check box.
Generates SNMP traps when the threshold forstandard deviation in inbound times is exceeded.
Ingress StandardDeviation Exceeded
• To enable SNMP traps for this condition,select the check box.
• To disable SNMP traps, clear the check box.
Generates traps when the threshold for maximuminbound time is exceeded.
Ingress TimeExceeded
• To enable SNMP traps for this condition,select the check box.
• To disable SNMP traps, clear the check box.
Generates traps when the threshold for jitter inround-trip time is exceeded.
Jitter Exceeded
• To enable SNMP traps for this condition,select the check box.
• To disable SNMP traps, clear the check box.
Generates traps when the threshold for the numberof successive lost probes is reached.
Probe Failure
• To enable SNMP traps for this condition,select the check box.
• To disable SNMP traps, clear the check box.
Generates traps when the threshold for maximumround-trip time is exceeded.
RTT Exceeded
• To enable SNMP traps for this condition,select the check box.
• To disable SNMP traps, clear the check box.
Generates traps when the threshold for standarddeviation in round-trip times is exceeded.
Standard DeviationExceeded
Copyright © 2011, Juniper Networks, Inc.190
Junos OS Monitoring and Troubleshooting Guide for Security Devices

Table 95: RPMConfiguration Summary (continued)
Your ActionFunctionField
• To enable SNMP traps for this condition,select the check box.
• To disable SNMP traps, clear the check box.
Generates traps when a test is completed.Test Completion
• To enable SNMP traps for this condition,select the check box.
• To disable SNMP traps, clear the check box.
Generates traps when the threshold for the totalnumber of lost probes is reached.
Test Failure
Performance Probe Server
Type the number 7—a standard TCP or UDPport number—or a port number from 49160through 65535.
Specifies the port on which the device is to receiveand transmit TCP probes.
TCP Probe Server
Type the number 7—a standard TCP or UDPport number—or a port number from 49160through 65535.
Specifies the port on which the device is to receiveand transmit UDP probes.
UDP Probe Server
Example: Configuring Basic RPMProbes
This example shows how to configure basic RPM probes to measure performance between
two network endpoints.
• Requirements on page 191
• Overview on page 191
• Configuration on page 192
• Verification on page 194
Requirements
Before you begin:
• Establish basic connectivity. See the Getting Started Guide for your device.
• Configure network interfaces. See the JunosOS InterfacesConfigurationGuide forSecurity
Devices.
Overview
In this example, you configure basic probes for two RPM owners, customerA and
customerB. You configure the RPM test as icmp-test for customerA with a test interval
of 15 seconds and specify a probe type as icmp-ping-timestamp, a probe timestamp,
and a target address as 192.178.16.5. You then configure the RPM thresholds and
corresponding SNMP traps to catch ingress (inbound) times greater than 3000
microseconds.
Then you configure the RPM test as http-test for customerB with a test interval of 30
seconds and specify a probe type as http-get and a target URL as http://customerB.net.
Finally, you configure RPM thresholds and corresponding SNMP traps as probe-failure
191Copyright © 2011, Juniper Networks, Inc.
Chapter 7: RPM Probes for Performance Measurement

and test-failure to catch three or more successive lost probes and total lost probes of
10.
Configuration
CLI QuickConfiguration
To quickly configure this example, copy the following commands, paste them into a text
file, remove any line breaks, change any details necessary to match your network
configuration, and then copy and paste the commands into the CLI at the [edit]hierarchy
level.
set services rpm probe customerA test icmp-test probe-interval 15set services rpm probe customerA test icmp-test probe-type icmp-ping-timestampset services rpm probe customerA test icmp-test hardware-timestampset services rpm probe customerA test icmp-test target address 192.178.16.5set services rpm probe customerA test icmp-test thresholds ingress-time 3000set services rpm probe customerA test icmp-test traps ingress-time-exceededset services rpm probe customerB test http-test probe-interval 30set services rpm probe customerB test http-test probe-type http-getset services rpm probe customerB test http-test target url http://customerB.netset services rpm probe customerB test http-test thresholds successive-loss 3set services rpm probe customerB test http-test thresholds total-loss 10set services rpm probe customerB test http-test traps probe-failureset services rpm probe customerB test http-test traps test-failure
Step-by-StepProcedure
The following example requires you to navigate various levels in the configuration
hierarchy. For instructions on how to do that, see Using the CLI Editor in Configuration
Mode in the Junos OS CLI User Guide.
To configure basic RPM probes:
1. Configure the RPM.
[edit]user@host# edit services rpm
2. Configure the RPM owners.
[edit services rpm]user@host# set probe customerAuser@host# set probe customerB
3. Configure the RPM test for customerA.
[edit services rpm]user@host# edit probe customerAuser@host# set test icmp-test probe-interval 15user@host# set test icmp-test probe-type icmp-ping-timestamp
4. Specify a probe timestamp and a target address.
[edit services rpm probe customerA]user@host# set test icmp-test hardware-timestampuser@host# set test icmp-test target address 192.178.16.5
5. Configure RPM thresholds and corresponding SNMP traps.
[edit services rpm probe customerA]user@host# set test icmp-test thresholds ingress-time 3000
Copyright © 2011, Juniper Networks, Inc.192
Junos OS Monitoring and Troubleshooting Guide for Security Devices

user@host# set test icmp-test traps ingress-time-exceeded
6. Configure the RPM test for customerB.
[edit]user@host# edit services rpm probe customerBuser@host# set test http-test probe-interval 30
7. Specify a probe type and a target URL.
[edit services rpm probe customerB]user@host# set test http-test probe-type http-getuser@host# set test http-test target url http://customerB.net
8. Configure RPM thresholds and corresponding SNMP traps.
[edit services rpm probe customerB]user@host# set test http-test thresholds successive-loss 3user@host# set test http-test thresholds total-loss 10user@host# set test http-test traps probe-failureuser@host# set test http-test traps test-failure
Results From configuration mode, confirm your configuration by entering the show services rpm
command. If the output does not display the intended configuration, repeat the
configuration instructions in this example to correct it.
[edit]user@host# show services rpmprobe customerA {test icmp-test {probe-type icmp-ping-timestamp;target address 192.178.16.5;probe-interval 15;thresholds {
ingress-time 3000;}traps ingress-time-exceeded;hardware-timestamp;
}}probe customerB {test http-test {probe-type http-gettarget url http://customerB.net;probe-interval 30;thresholds {successive-loss 3;
total-loss 10;}traps [ probe-failure test-failure ];}
}
If you are done configuring the device, enter commit from configuration mode.
193Copyright © 2011, Juniper Networks, Inc.
Chapter 7: RPM Probes for Performance Measurement

Verification
Confirm that the configuration is working properly.
• Verifying RPM Services on page 194
• Verifying RPM Statistics on page 194
Verifying RPMServices
Purpose Verify that the RPM configuration is within the expected values.
Action From configuration mode, enter the show services rpm command. The output shows the
values that are configured for RPM on the device.
Verifying RPMStatistics
Purpose Verify that the RPM probes are functioning and that the RPM statistics are within expected
values.
Action From configuration mode, enter the show services rpm probe-results command.
user@host> show services rpm probe-results
Owner: customerD, Test: icmp-test Probe type: icmp-ping-timestamp Minimum Rtt: 312 usec, Maximum Rtt: 385 usec, Average Rtt: 331 usec, Jitter Rtt: 73 usec, Stddev Rtt: 27 usec Minimum egress time: 0 usec, Maximum egress time: 0 usec, Average egress time: 0 usec, Jitter egress time: 0 usec, Stddev egress time: 0 usec Minimum ingress time: 0 usec, Maximum ingress time: 0 usec, Average ingress time: 0 usec, Jitter ingress time: 0 usec, Stddev ingress time: 0 usec Probes sent: 5, Probes received: 5, Loss percentage: 0
Owner: customerE, Test: http-test Target address: 192.176.17.4, Target URL: http://customerB.net, Probe type: http-get Minimum Rtt: 1093 usec, Maximum Rtt: 1372 usec, Average Rtt: 1231 usec, Jitter Rtt: 279 usec, Stddev Rtt: 114 usec Probes sent: 3, Probes received: 3, Loss percentage: 0
Owner: Rpm-Bgp-Owner, Test: Rpm-Bgp-Test-1 Target address: 10.209.152.37, Probe type: icmp-ping, Test size: 5 probes Routing Instance Name: LR1/RI1 Probe results: Response received, Fri Oct 28 05:20:23 2005 Rtt: 662 usec Results over current test: Probes sent: 5, Probes received: 5, Loss percentage: 0 Measurement: Round trip time Minimum: 529 usec, Maximum: 662 usec, Average: 585 usec, Jitter: 133 usec, Stddev: 53 usec Results over all tests: Probes sent: 5, Probes received: 5, Loss percentage: 0 Measurement: Round trip time
Copyright © 2011, Juniper Networks, Inc.194
Junos OS Monitoring and Troubleshooting Guide for Security Devices

Minimum: 529 usec, Maximum: 662 usec, Average: 585 usec, Jitter: 133 usec, Stddev: 53 usec
Example: Configuring RPMUsing TCP and UDP Probes
This example shows how to configure RPM using TCP and UDP probes.
• Requirements on page 195
• Overview on page 195
• Configuration on page 195
• Verification on page 197
Requirements
Before you begin:
• Establish basic connectivity. See the Getting Started Guide for your device.
• Configure network interfaces. See the JunosOS InterfacesConfigurationGuide forSecurity
Devices.
• Configure the probe owner, the test, and the specific parameters of the RPM probe.
See “Example: Configuring Basic RPM Probes” on page 191.
Overview
In this example, you configure both the host (device A) and the remote device (device
B) to act as TCP and UDP servers. You configure a probe for customerC, which uses TCP
packets. Device B is configured as an RPM server for both TCP and UDP packets, using
an lt services interface as the destination interface, and ports 50000 and 50037,
respectively.
CAUTION: Use probe classification with caution, because improperconfiguration can cause packets to be dropped.
NOTE: On J Series devices, the destination interfacemust be an lt services
interface.
Configuration
CLI QuickConfiguration
To quickly configure this example, copy the following commands, paste them into a text
file, remove any line breaks, change any details necessary to match your network
configuration, and then copy and paste the commands into the CLI at the [edit]hierarchy
level.
{device A}set services rpm probe customerC test tcp-test probe-interval 5set services rpm probe customerC test tcp-test probe-type tcp-pingset services rpm probe customerC test tcp-test target address 192.162.45.6
195Copyright © 2011, Juniper Networks, Inc.
Chapter 7: RPM Probes for Performance Measurement

set services rpm probe customerC test tcp-test destination-interface lt-0/0/0set services rpm probe customerC test tcp-test destination-port 50000
{device B}set services rpm probe-server tcp port 50000set services rpm probe-server udp port 50037
Step-by-StepProcedure
The following example requires you to navigate various levels in the configuration
hierarchy. For instructions on how to do that, see Using the CLI Editor in Configuration
Mode in the Junos OS CLI User Guide.
To configure RPM using TCP and UDP probes:
1. Configure the RPM owner on device A.
{device A}[edit]user@host# edit services rpmuser@host# set probe customerC
2. Configure the RPM test.
{device A}[edit services rpm]user@host# edit services rpm probe customerCuser@host# set test tcp-test probe-interval 5
3. Set the probe type.
{device A}[edit services rpm probe customerC]user@host# set test tcp-test probe-type tcp-ping
4. Specify the target address.
{device A}[edit services rpm probe customerC]user@host# set test tcp-test target address 192.162.45.6
5. Configure the destination interface.
{device A}[edit services rpm probe customerC]user@host# set test tcp-test destination-interface It-0/0/0
6. Configure port 50000 as the TCP port to which the RPM probes are sent.
{device A}[edit services rpm probe customerC]user@host# set test tcp-test destination-port 50000
7. Configure device B to act as a TCP server using port 50000.
{device B}[edit]user@host# edit services rpmuser@host# set probe-server tcp port 50000
8. Configure device B to act as a UDP server using port 50037.
{device B}
Copyright © 2011, Juniper Networks, Inc.196
Junos OS Monitoring and Troubleshooting Guide for Security Devices

[edit services rpm]user@host# set probe-server udp port 50037
Results From configuration mode, confirm your configuration by entering the show services rpm
command. If the output does not display the intended configuration, repeat the
configuration instructions in this example to correct it.
[edit]user@host# show services rpmprobe customerC {test tcp-test {probe-type tcp-ping;target address 192.162.45.6;probe-interval 5;destination-port 50000;destination-interface lt-0/0/0.0;
}}probe-server {tcp {port 50000;
}udp {port 50037;
}}
If you are done configuring the device, enter commit from configuration mode.
Verification
Confirm that the configuration is working properly.
• Verifying RPM Probe Servers on page 197
Verifying RPMProbe Servers
Purpose Verify that the device is configured to receive and transmit TCP and UDP RPM probes
on the correct ports.
Action From configuration mode, enter the show services rpm active-servers command. The
output shows a list of the protocols and corresponding ports for which the device is
configured as an RPM server.
user@host> show services rpm active-servers
Protocol: TCP, Port: 50000
Protocol: UDP, Port: 50037
Tuning RPMProbes
After configuring an RPM probe, you can set parameters to control probe functions, such
as the interval between probes, the total number of concurrent probes that a system
197Copyright © 2011, Juniper Networks, Inc.
Chapter 7: RPM Probes for Performance Measurement

can handle, and the source address used for each probe packet. See “Example: Configuring
Basic RPM Probes” on page 191.
The following example requires you to navigate various levels in the configuration
hierarchy. For instructions on how to do that, see Using the CLI Editor in Configuration
Mode in the Junos OS CLI User Guide.
To tune RPM probes:
1. Set the maximum number of concurrent probes allowed on the system to 10.
[edit services rpm]user@host# set probe-limit 10
2. Access the ICMP probe of customer A.
[edit]user@host# edit services rpm probe customerA test icmp-test
3. Set the time between probe transmissions to 15 seconds.
[edit services rpm probe customerA test icmp-test]user@host# set probe-interval 15
4. Set the number of probes within a test to 10.
[edit services rpm probe customerA test icmp-test]user@host# set probe-count 10
5. Set the source address for each probe packet to 192.168.2.9. If you do not explicitly
configure a source address, the address on the outgoing interface through which the
probe is sent is used as the source address.
[edit services rpm probe customerA test icmp-test]user@host# set source-address 192.168.2.9
6. If you are done configuring the device, enter commit from configuration mode.
Example: Configuring RPMProbes for BGPMonitoring
This example shows how to configure RPM probes to monitor BGP neighbors.
• Requirements on page 198
• Overview on page 199
• Configuration on page 199
• Verification on page 200
Requirements
Before you begin:
• Configure the BGP parameters under RPM configuration to send RPM probes to BGP
neighbors. See “Example: Configuring Basic RPM Probes” on page 191.
• Use TCP or UDP probes by configure both the probe server (Juniper Networks device)
and the probe receiver (the remote device) to transmit and receive RPM probes on the
Copyright © 2011, Juniper Networks, Inc.198
Junos OS Monitoring and Troubleshooting Guide for Security Devices

same TCP or UDP port. See “Example: Configuring RPM Using TCP and UDP Probes”
on page 195.
Overview
In this example, you specify a hexadecimal value that you want to use for the data portion
of the RPM probe as ABCD123. ( It ranges from 1 through 2048 characters.) You specify
the data size of the RPM probe as 1024 bytes. ( The value ranges from 0 through 65,507.)
Then you configure destination port 50000 as the TCP port to which the RPM probes
are sent. You specify the number of probe results to be saved in the probe history as 25.
(It ranges from 0 through 255, and the default is 50.) You set the probe count to 5 and
probe interval as 1. (The probe count ranges from 1 through 15, and the default is 1; and
the probe interval ranges from 1 through 255, and the default is 3.) You then specify
tcp-ping as the type of probe to be sent as part of the test.
Finally, you set the test interval as 60. The value ranges from 0 through 86,400 seconds
for the interval between tests.
Configuration
CLI QuickConfiguration
To quickly configure this example, copy the following commands, paste them into a text
file, remove any line breaks, change any details necessary to match your network
configuration, and then copy and paste the commands into the CLI at the [edit]hierarchy
level.
set services rpm bgp data-fill ABCD123 data-size 1024set services rpm bgp destination-port 50000 history-size 25set services rpm bgp probe-count 5 probe-interval 1set services rpm bgp probe-type tcp-ping test-interval 60
Step-by-StepProcedure
The following example requires you to navigate various levels in the configuration
hierarchy. For instructions on how to do that, see Using the CLI Editor in Configuration
Mode in the Junos OS CLI User Guide.
To configure RPM probes to monitor BGP neighbors:
1. Configure the RPM and BGP.
[edit]user@host# edit services rpm bgp
2. Specify a hexadecimal value.
[edit services rpm bgp]user@host# set data-fill ABCD123
3. Specify the data size of the RPM probe.
[edit services rpm bgp]user@host# set data-size 1024
4. Configure the destination port.
[edit services rpm bgp]user@host# set destination-port 50000
199Copyright © 2011, Juniper Networks, Inc.
Chapter 7: RPM Probes for Performance Measurement

5. Specify the number of probes.
[edit services rpm bgp]user@host# set history-size 25
6. Set the probe count and probe interval.
[edit services rpm bgp]user@host# set probe-count 5 probe-interval 1
7. Specify the type of probe.
[edit services rpm bgp]user@host# set probe-type tcp-ping
NOTE: If you do not specify the probe type the default ICMPprobes aresent.
8. Set the test interval.
[edit services rpm bgp]user@host# set test-interval 60
Results From configuration mode, confirm your configuration by entering the show services rpm
command. If the output does not display the intended configuration, repeat the
configuration instructions in this example to correct it.
[edit]user@host# show services rpmbgp {probe-type tcp-ping;probe-count 5;probe-interval 1;test-interval 60;destination-port 50000;history-size 25;data-size 1024;
data-fill ABCD123;}
If you are done configuring the device, enter commit from configuration mode.
Verification
Confirm that the configuration is working properly.
• Verifying RPM Probes for BGP Monitoring on page 200
Verifying RPMProbes for BGPMonitoring
Purpose Verify that the RPM probes for BGP monitoring is configured.
Action From configuration mode, enter the show services rpm command.
Copyright © 2011, Juniper Networks, Inc.200
Junos OS Monitoring and Troubleshooting Guide for Security Devices

Directing RPMProbes to Select BGP Devices
If a device has a large number of BGP neighbors configured, you can direct (filter) the
RPM probes to a selected group of BGP neighbors rather than to all the neighbors. To
identify the BGP devices to receive RPM probes, you can configure routing instances.
The following example requires you to navigate various levels in the configuration
hierarchy. For instructions on how to do that, see Using the CLI Editor in Configuration
Mode in the Junos OS CLI User Guide.
To direct RPM probes to select BGP neighbors:
1. Configure routing instanceRI1 to send RPM probes to BGP neighbors within the routing
instance.
[edit services rpm bgp]user@host# set routing-instances RI1
2. If you are done configuring the device, enter commit from configuration mode.
Configuring RPMTimestamping
To account for latency in the communication of probe messages, you can enable
timestamping of the probe packets. You can timestamp the following RPM probe types:
icmp-ping, icmp-ping-timestamp, udp-ping, and udp-ping-timestamp.
This example shows how to enable timestamping for customerA. The test for customerA
is identified as customerA-test.
To configure timestamping:
1. Specify the RPM probe owner for which you want to enable timestamping.
[edit services rpm]user@host# edit probe customerA
2. Specify a name for the test.
[edit services rpm probe customerA]user@host# edit test customerA-test
3. Enable timestamping.
[edit services rpm probe customerA test customerA-test]user@host# edit hardware-timestamp
4. (Optional) If preferred, indicate that you want timestamping to be only one-way.
[edit services rpm probe customerA test customerA-test]user@host# edit one-way-hardware-timestamp
NOTE: Youcannot includeboth the source-addressandhardware-timestamp
or one-way-hardware-timestamp statements at the [edit services rpm probe
probe-name test test-name] hierarchy level simultaneously.
201Copyright © 2011, Juniper Networks, Inc.
Chapter 7: RPM Probes for Performance Measurement

RPMSupport for VPN Routing and Forwarding
Real-time performance monitoring (RPM) is supported on all Juniper Network devices.
VRF in a Layer 3 VPN implementation allows multiple instances of a routing table to
coexist within the same device at the same time. Because the routing instances are
independent, the same or overlapping IP addresses can be used without conflicting each
other.
RPM ICMP and UDP probe with VPN routing and forwarding (VRF) has been improved.
In previous releases, the RPM probes specified to a VRF table were not handled by the
real-time forwarding process (FWDD-RT). In Junos OS Release 10.0, RPM probes specified
to a VRF table are handled by the FWDD-RT, thereby providing more accurate results.
This feature supports RPM ICMP and UDP probes configured with routing instances of
type VRF.
RelatedDocumentation
RPM Overview on page 183•
• RPM Configuration Options on page 187
• Monitoring RPM Probes on page 202
• Junos OS System Basics and Services Command Reference
• Junos OS Feature Support Reference for SRX Series and J Series Devices
• Junos OS Routing Protocols and Policies Configuration Guide for Security Devices
Monitoring RPMProbes
The RPM information includes the round-trip time, jitter, and standard deviation values
for each configured RPM test on the device. To view these RPM properties, select
Troubleshoot>RPM>View RPM in the J-Web user interface, or in configuration mode
enter the show command:
[edit]user@host# show services rpm probe-results
In addition to the RPM statistics for each RPM test, the J-Web user interface displays the
round-trip times and cumulative jitter graphically. Figure 2 on page 203 shows sample
graphs for an RPM test.
Copyright © 2011, Juniper Networks, Inc.202
Junos OS Monitoring and Troubleshooting Guide for Security Devices

Figure 2: Sample RPMGraphs
In Figure 2 on page 203, the round-trip time and jitter values are plotted as a function of
the system time. Large spikes in round-trip time or jitter indicate a slower outbound
(egress) or inbound (ingress) time for the probe sent at that particular time.
Table 96 on page 203 summarizes key output fields in RPM displays.
Table 96: Summary of Key RPMOutput Fields
Additional InformationValuesField
Currently Running Tests
Click theGraph link to display the graph (if it is notalready displayed) or to update the graph for a particulartest.
Graph
Configured owner name of the RPM test.Owner
Configured name of the RPM test.Test Name
203Copyright © 2011, Juniper Networks, Inc.
Chapter 7: RPM Probes for Performance Measurement

Table 96: Summary of Key RPMOutput Fields (continued)
Additional InformationValuesField
Type of RPM probe configured for the specified test:
• http-get
• http-get-metadata
• icmp-ping
• icmp-ping-timestamp
• tcp-ping
• udp-ping
Probe Type
IP address or URL of the remote server that is beingprobed by the RPM test.
TargetAddress
If no source address is configured, the RPM probe packetsuse the outgoing interface as the source address, andthe Source Address field is empty.
Explicitly configured source address that is includedin the probe packet headers.
SourceAddress
Shortest round-trip time from the Juniper Networksdevice to the remote server, as measured over thecourse of the test.
MinimumRTT
Longest round-trip time from the Juniper Networksdevice to the remote server, as measured over thecourse of the test.
MaximumRTT
Average round-trip time from the Juniper Networksdevice to the remote server, as measured over thecourse of the test.
AverageRTT
Standard deviation of round-trip times from theJuniper Networks device to the remote server, asmeasured over the course of the test.
StandardDeviationRTT
Total number of probes sent over the course of thetest.
ProbesSent
Percentage of probes sent for which a response wasnot received.
LossPercentage
Round-Trip Time for a Probe
The Juniper Networks device maintains records of themost recent 50 probes for each configured test. These50 probes are used to generate RPM statistics for aparticular test.
Total number of probes used for the data set.Samples
System time when the first probe in the sample wasreceived.
EarliestSample
System time when the last probe in the sample wasreceived.
LatestSample
Copyright © 2011, Juniper Networks, Inc.204
Junos OS Monitoring and Troubleshooting Guide for Security Devices

Table 96: Summary of Key RPMOutput Fields (continued)
Additional InformationValuesField
Average round-trip time for the 50-probe sample.Mean Value
Standard deviation of the round-trip times for the50-probe sample.
StandardDeviation
Shortest round-trip time from the device to the remoteserver, as measured over the 50-probe sample.
LowestValue
System time when the lowest value in the 50-probesample was received.
Time ofLowestSample
Longest round-trip time from the Juniper Networksdevice to the remote server, as measured over the50-probe sample.
HighestValue
System time when the highest value in the 50-probesample was received.
Time ofHighestSample
Cumulative Jitter for a Probe
The Juniper Networks device maintains records of themost recent 50 probes for each configured test. These50 probes are used to generate RPM statistics for aparticular test.
Total number of probes used for the data set.Samples
System time when the first probe in the sample wasreceived.
EarliestSample
System time when the last probe in the sample wasreceived.
LatestSample
Average jitter for the 50-probe sample.Mean Value
Standard deviation of the jitter values for the 50-probesample.
StandardDeviation
Smallest jitter value, as measured over the 50-probesample.
LowestValue
System time when the lowest value in the 50-probesample was received.
Time ofLowestSample
Highest jitter value, as measured over the 50-probesample.
HighestValue
System time when the highest jitter value in the50-probe sample was received.
Time ofHighestSample
205Copyright © 2011, Juniper Networks, Inc.
Chapter 7: RPM Probes for Performance Measurement

RelatedDocumentation
• RPM Overview on page 183
• RPM Configuration Options on page 187
• RPM Support for VPN Routing and Forwarding on page 202
• Junos OS System Basics and Services Command Reference
• Junos OS Feature Support Reference for SRX Series and J Series Devices
• Junos OS Routing Protocols and Policies Configuration Guide for Security Devices
Copyright © 2011, Juniper Networks, Inc.206
Junos OS Monitoring and Troubleshooting Guide for Security Devices

CHAPTER 8
Alarms
• Alarm Overview on page 207
• Example: Configuring Interface Alarms on page 212
• Monitoring Active Alarms on a Device on page 215
AlarmOverview
Alarms alert you to conditions on a network interface, on the device chassis, or in the
system software that might prevent the device from operating normally. You can set the
conditions that trigger alarms on an interface. Chassis and system alarm conditions are
preset.
An active alarm lights the ALARM LED on the front panel of the device. You can monitor
active alarms from the J-Web user interface or the CLI. When an alarm condition triggers
an alarm, the device lights the yellow (amber) ALARM LED on the front panel. When the
condition is corrected, the light turns off.
NOTE: The ALARM LED on J Series devices light yellowwhether the alarm
condition is major (red) or minor (yellow).
This section contains the following topics:
• Alarm Types on page 207
• Alarm Severity on page 208
• Alarm Conditions on page 208
Alarm Types
The device supports three types of alarms:
• Interface alarms indicate a problem in the state of the physical links on fixed or installed
Physical Interface Modules (PIMs). To enable interface alarms, you must configure
them.
• Chassis alarms indicate a failure on the device or one of its components. Chassis alarms
are preset and cannot be modified.
207Copyright © 2011, Juniper Networks, Inc.

• System alarms indicate a missing rescue configuration or software license, where valid.
System alarms are preset and cannot be modified, although you can configure them
to appear automatically in the J-Web user interface or CLI.
Alarm Severity
Alarms have two severity levels:
• Major (red)—Indicates a critical situation on the device that has resulted from one of
the following conditions. A red alarm condition requires immediate action.
• One or more hardware components have failed.
• One or more hardware components have exceeded temperature thresholds.
• An alarm condition configured on an interface has triggered a critical warning.
• Minor (yellow)—Indicates a noncritical condition on the device that, if left unchecked,
might cause an interruption in service or degradation in performance. A yellow alarm
condition requires monitoring or maintenance.
A missing rescue configuration or software license generates a yellow system alarm.
Alarm Conditions
To enable alarms on a device interface, you must select an alarm condition and an alarm
severity. In contrast, alarm conditions and severity are preconfigured for chassis alarms
and system alarms.
NOTE: For informationaboutchassisalarmsforyourdevice, seetheHardwareGuide for your device.
This section contains the following topics:
• Interface Alarm Conditions on page 208
• System Alarm Conditions on page 211
Interface Alarm Conditions
Table 97 on page 209 lists the interface conditions, sorted by interface type, that you can
configure for an alarm. You can configure each alarm condition to trigger either a major
(red) alarm or minor a (yellow) alarm. The corresponding configuration option is included.
For the services stateful firewall filters (NAT, IDP, and IPsec), which operate on an internal
adaptive services module within a device, you can configure alarm conditions on the
integrated services and services interfaces.
Copyright © 2011, Juniper Networks, Inc.208
Junos OS Monitoring and Troubleshooting Guide for Security Devices

Table 97: Interface Alarm Conditions
ConfigurationOptionDescriptionAlarm ConditionInterface
aisThe normal T1 traffic signal contained a defectcondition and has been replaced by the AIS. Atransmission interruption occurred at the remoteendpoint or upstream of the remote endpoint. Thisall-ones signal is transmitted to preventconsequential downstream failures or alarms.
Alarm indication signal (AIS)DS1 (T1)
ylwThe remote endpoint is in yellow alarm failure. Thiscondition is also known as a far-end alarm failure.
Yellow alarm
link-downThe physical link is unavailable.Link is downEthernet
failureOn the adaptive services module, either the hardwareassociated with the module or the software thatdrives the module has failed.
Hardware or software failureIntegratedservices
cts-absentThe remote endpoint of the serial link is nottransmitting a CTS signal. The CTS signal must bepresent before data can be transmitted across aserial link.
Clear-to-send (CTS) signalabsent
Serial
dcd-absentThe remote endpoint of the serial link is nottransmitting a DCD signal. Because the DCD signaltransmits the state of the device, no signal probablyindicates that the remote endpoint of the serial linkis unavailable.
Data carrier detect (DCD) signalabsent
dsr-absentThe remote endpoint of the serial link is nottransmitting a DSR signal. The DSR signal indicatesthat the remote endpoint is ready to receive andtransmit data across the serial link.
Data set ready (DSR) signalabsent
loss-of-rx-clockThe clock signal from the remote endpoint is notpresent. Serial connections require clock signals tobe transmitted from one endpoint and received bythe other endpoint of the link.
Loss of receive clock
loss-of-tx-clockThe local clock signal is not present. Serialconnections require clock signals to be transmittedfrom one endpoint and received by the other endpointof the link.
Loss of transmit clock
209Copyright © 2011, Juniper Networks, Inc.
Chapter 8: Alarms

Table 97: Interface Alarm Conditions (continued)
ConfigurationOptionDescriptionAlarm ConditionInterface
hw-downA hardware problem has occurred on the device'sservices module. This error typically means that oneor more of the CPUs on the module has failed.
Services module hardwaredown
Services
linkdownThe link between the device and its services moduleis unavailable.
Services link down
pic-hold-resetThe device's services module is stuck in reset mode.If the services module fails to start up five or moretimes in a row, the services module is held in resetmode. Startup fails when the amount of time fromCPU release to CPU halt is less than 300 seconds.
Services module held in reset
pic-resetThe device's services module is resetting. The moduleresets after it crashes or is reset from the CLI, or whenit takes longer than 60 seconds to start up.
Services module reset
sw-downA software problem has occurred on the device'sservices module.
Services module software down
aisThe normal E3 traffic signal contained a defectcondition and has been replaced by the AIS. Atransmission interruption occurred at the remoteendpoint or upstream of the remote endpoint. Thisall-ones signal is transmitted to preventconsequential downstream failures or alarms.
Alarm indication signal (AIS)E3
losNo remote E3 signal is being received at the E3interface.
Loss of signal (LOS)
oofAn OOF condition has existed for 10 seconds. Thisalarm applies only to E3 interfaces configured inframe mode. The OOF failure is cleared when no OOFor LOS defects have occurred for 20 seconds.
Out of frame (OOF)
rdiAn AIS, LOS, or OOF condition exists. This alarmapplies only to E3 interfaces configured in framemode.
Remote defect indication
Copyright © 2011, Juniper Networks, Inc.210
Junos OS Monitoring and Troubleshooting Guide for Security Devices

Table 97: Interface Alarm Conditions (continued)
ConfigurationOptionDescriptionAlarm ConditionInterface
aisThe normal T3 traffic signal contained a defectcondition and has been replaced by the AIS. Atransmission interruption occurred at the remoteendpoint or upstream of the remote endpoint. Thisall-ones signal is transmitted to preventconsequential downstream failures or alarms.
Alarm indication signalT3 (DS3)
exzThe bit stream received from the upstream host hasmore consecutive zeros than are allowed in a T3frame.
Excessive number of zeros
ferfThe remote endpoint of the connection has failed. AFERF differs from a yellow alarm, because the failurecan be any failure, not just an OOF or LOS failure.
Far-end receive failure (FERF)
idleThe Idle signal is being received from the remoteendpoint.
Idle alarm
lcvEither the line encoding along the T3 link is corruptedor a mismatch between the encoding at the localand remote endpoints of a T3 connection occurred.
Line code violation
lofAn OOF or loss-of-signal LOS condition has existedfor 10 seconds. The LOF failure is cleared when noOOF or LOS defects have occurred for 20 seconds.A LOF failure is also called a red failure.
Loss of frame (LOF)
losNo remote T3 signal is being received at the T3interface.
Loss of signal (LOS)
pllThe clocking signals for the local and remoteendpoints no longer operate in lock-step.
Phase-locked loop out of lock
ylwThe remote endpoint is in yellow alarm failure. Thiscondition is also known as a far-end alarm failure.
Yellow alarm
SystemAlarm Conditions
Table 98 on page 211 lists the two preset system alarms, the condition that triggers each
alarm, and the action you take to correct the condition.
Table 98: SystemAlarm Conditions and Corrective Actions
Corrective ActionAlarm ConditionAlarm Type
Set the rescue configuration.The rescue configuration is not set.Configuration
211Copyright © 2011, Juniper Networks, Inc.
Chapter 8: Alarms

Table 98: SystemAlarm Conditions and Corrective Actions (continued)
Corrective ActionAlarm ConditionAlarm Type
Install a valid license key.You have configured at least one softwarefeature that requires a feature license, but novalid license for the feature is currentlyinstalled.
NOTE: This alarm indicates that you are inviolation of the software license agreement.You must install a valid license key to be incompliance with all agreements.
License
RelatedDocumentation
Example: Configuring Interface Alarms on page 212•
• Monitoring Active Alarms on a Device on page 215
• Junos OS CLI User Guide
• Junos OS System Log Messages Reference
• Junos OS Security Configuration Guide
• Junos OS Feature Support Reference for SRX Series and J Series Devices
Example: Configuring Interface Alarms
This example shows how to configure interface alarms.
• Requirements on page 212
• Overview on page 212
• Configuration on page 213
• Verification on page 214
Requirements
Before you begin:
• Establish basic connectivity. See the Getting Started Guide for your device.
• Configure network interfaces. See the JunosOS InterfacesConfigurationGuide forSecurity
Devices.
• Select the network interface on which to apply an alarm and the condition you want
to trigger the alarm. See “Alarm Overview” on page 207.
Overview
In this example, you enable interface alarms by explicitly setting alarm conditions. You
configure the system to generate a red interface alarm when a yellow alarm is detected
on a DS1 link. You configure the system to generate a red interface alarm when a link-down
failure is detected on an Ethernet link.
Copyright © 2011, Juniper Networks, Inc.212
Junos OS Monitoring and Troubleshooting Guide for Security Devices

For a serial link, you set cts-absent and dcd-absent to yellow to signify either the CST or
the DCD signal is not detected. You set loss-of-rx-clock and loss-of-tx-clock to red alarm
to signify either the receiver clock signal or the transmission clock signal is not detected.
For a T3 link, you set the interface alarm to red when the remote endpoint is experiencing
a failure. You set exz to yellow alarm when the upstream bit has more consecutive zeros
than are permitted in a T3 interface. You then set a red alarm when there is loss-of-signal
on the interface.
Finally, you configure the system to display active system alarms whenever a user with
the login class admin logs into the device.
Configuration
CLI QuickConfiguration
To quickly configure this example, copy the following commands, paste them into a text
file, remove any line breaks, change any details necessary to match your network
configuration, and then copy and paste the commands into the CLI at the [edit]hierarchy
level.
set chassis alarm ds1 ylw redset chassis alarm ethernet link-down redset chassis alarm serial cts-absent yellow dcd-absent yellowset chassis alarm serial loss-of-rx-clock red loss-of-tx-clock redset chassis alarm t3 ylw red exz yellow los redset system login class admin login-alarms
Step-by-StepProcedure
The following example requires you to navigate various levels in the configuration
hierarchy. For instructions on how to do that, see Using the CLI Editor in Configuration
Mode in the Junos OS CLI User Guide.
To configure interface alarms:
1. Configure an alarm.
[edit]user@host# edit chassis alarm
2. Specify the interface alarms on a DS1 and an Ethernet link.
[edit chassis alarm]user@host# set ds1 ylw reduser@host# set ethernet link–down red
3. Specify the interface alarms on a serial link.
[edit chassis alarm]user@host# set serial cts-absent yellowuser@host# set serial dcd-absent yellowuser@host# set serial loss-of-rx-clock reduser@host# set serial loss-of-tx-clock red
4. Specify the interface alarms on a T3 link.
[edit chassis alarm]user@host# set t3 ylw reduser@host# set t3 exz yellowuser@host# set t3 los red
213Copyright © 2011, Juniper Networks, Inc.
Chapter 8: Alarms

5. Configure the system to display active system alarms.
[edit]user@host# edit system loginuser@host# set class admin login-alarms
Results From configuration mode, confirm your configuration by entering the showchassisalarms
and show system login commands. If the output does not display the intended
configuration, repeat the configuration instructions in this example to correct it.
[edit]user@host# show chassis alarmst3 {exz yellow;los red;
ylw red;}ds1 {ylw red;
}ethernet {link-down red;
}serial {loss-of-rx-clock red;loss-of-tx-clock red;dcd-absent yellow;cts-absent yellow;
}[edit]user@host# show system loginshow system login
show system login}
If you are done configuring the device, enter commit from configuration mode.
Verification
Confirm that the configuration is working properly.
• Verifying the Alarm Configurations on page 214
Verifying the Alarm Configurations
Purpose Verify that the alarms are configured.
Action From configuration mode, enter the showchassisalarmscommand. Verify that the output
shows the intended configuration of the alarms.
RelatedDocumentation
Alarm Overview on page 207•
• Monitoring Active Alarms on a Device on page 215
Copyright © 2011, Juniper Networks, Inc.214
Junos OS Monitoring and Troubleshooting Guide for Security Devices

• Junos OS System Log Messages Reference
• Junos OS Security Configuration Guide
• Junos OS System Basics Configuration Guide
• Junos OS Feature Support Reference for SRX Series and J Series Devices
Monitoring Active Alarms on a Device
Purpose Use to monitor and filter alarms on a Juniper Networks device.
Action SelectMonitor>EventsandAlarms>ViewAlarms in the J-Web user interface. The J-Web
View Alarms page displays the following information about preset system and chassis
alarms:
• Type—Type of alarm: System, Chassis, or All.
• Severity—Severity class of the alarm: Minor or Major.
• Description—Description of the alarm.
• Time—Time that the alarm was registered.
To filter which alarms appear, use the following options:
• Alarm Type—Specifies which type of alarm to monitor: System, Chassis, or All. System
alarms include FRU detection alarms (power supplies removed, for instance). Chassis
alarms indicate environmental alarms such as temperature.
• Severity—Specifies the alarm severity that you want to monitor: Major, Minor, or All. A
major (red) alarm condition requires immediate action. A minor (yellow) condition
requires monitoring and maintenance.
• Description—Specifies the alarms you want to monitor. Enter a brief synopsis of the
alarms that you want to monitor.
• Date From—Specifies the beginning of the date range that you want to monitor. Set
the date using the calendar pick tool.
• To—Specifies the end of the date range that you want to monitor. Set the date using
the calendar pick tool.
• Go—Executes the options that you specified.
• Reset—Clears the options that you specified.
Alternatively, you can enter the following show commands in the CLI editor:
• show chassis alarms
• show system alarms
RelatedDocumentation
• Alarm Overview on page 207
• Example: Configuring Interface Alarms on page 212
215Copyright © 2011, Juniper Networks, Inc.
Chapter 8: Alarms

• Junos OS System Log Messages Reference
• Junos OS Security Configuration Guide
• Junos OS System Basics Configuration Guide
• Junos OS Feature Support Reference for SRX Series and J Series Devices
Copyright © 2011, Juniper Networks, Inc.216
Junos OS Monitoring and Troubleshooting Guide for Security Devices

CHAPTER 9
Systems Files Management
• File Management Overview on page 217
• Managing Files with the J-Web User Interface on page 217
• Managing Files with the CLI on page 220
• Encrypting and Decrypting Configuration Files on page 222
File Management Overview
You can use the J-Web user interface and the CLI to perform routine file management
operations such as archiving log files and deleting unused log files, cleaning up temporary
files and crash files, and downloading log files from the routing platform to your computer.
You can also encrypt the configuration files with the CLI to prevent unauthorized users
from viewing sensitive configuration information.
Before you perform any file management tasks, you must perform the initial device
configuration described in the Getting Started Guide for your device.
RelatedDocumentation
Cleaning Up Files on page 218•
• Cleaning Up Files with the CLI on page 220
• Managing Accounting Files on page 221
• Encrypting Configuration Files on page 223
• Junos OS CLI User Guide
• Junos OS System Log Messages Reference
• Junos OS Feature Support Reference for SRX Series and J Series Devices
Managing Files with the J-Web User Interface
This section contains the following topics:
• Cleaning Up Files on page 218
• Downloading Files on page 218
• Deleting Files on page 219
• Deleting the Backup Software Image on page 220
217Copyright © 2011, Juniper Networks, Inc.

Cleaning Up Files
You can use the J-Web user interface to rotate log files and delete unnecessary files on
the device. If you are running low on storage space, the file cleanup procedure quickly
identifies files that can be deleted.
The file cleanup procedure performs the following tasks:
• Rotates log files—Archives all information in the current log files and creates fresh log
files.
• Deletes log files in /var/log—Deletes any files that are not currently being written to.
• Deletes temporary files in /var/tmp—Deletes any files that have not been accessed
within two days.
• Deletes all crash files in /var/crash—Deletes any core files that the device has written
during an error.
• Deletes all software images (*.tgz files) in /var/sw/pkg—Deletes any software images
copied to this directory during software upgrades.
To rotate log files and delete unnecessary files with the J-Web user interface:
1. In the J-Web user interface, selectMaintain>Files.
2. In the Clean Up Files section, click Clean Up Files. The device rotates log files and
identifies the files that can be safely deleted.
The J-Web user interface displays the files that you can delete and the amount of
space that will be freed on the file system.
3. Click one of the following buttons on the confirmation page:
• To delete the files and return to the Files page, click OK.
• To cancel your entries and return to the list of files in the directory, click Cancel.
Downloading Files
You can use the J-Web user interface to download a copy of an individual file from the
device. When you download a file, it is not deleted from the file system.
To download files with the J-Web user interface:
1. In the J-Web user interface, selectMaintain>Files.
2. In the Download and Delete Files section, click one of the following file types:
• Log Files—Lists the log files located in the /var/log directory on the device.
• Temporary Files—Lists the temporary files located in the /var/tmp directory on the
device.
Copyright © 2011, Juniper Networks, Inc.218
Junos OS Monitoring and Troubleshooting Guide for Security Devices

• Old Junos OS—Lists the software images located in the (*.tgz files) in the
/var/sw/pkg directory on the device.
• Crash (Core) Files—Lists the core files located in the /var/crash directory on the
device.
The J-Web user interface displays the files located in the directory.
3. Click Download to download an individual file.
4. Choose a location for the browser to save the file.
The file is downloaded.
Deleting Files
You can use the J-Web user interface to delete an individual file from the device. When
you delete the file, it is permanently removed from the file system.
CAUTION: If you are unsure whether to delete a file from the device, werecommend using the Cleanup Files tool. This tool determines which filescan be safely deleted from the file system.
To delete files with the J-Web user interface:
1. In the J-Web user interface, selectMaintain>Files.
2. In the Download and Delete Files section, click one of the following file types:
• Log Files—Lists the log files located in the /var/log directory on the device.
• Temporary Files—Lists the temporary files located in the /var/tmp directory on the
device.
• Old Junos OS—Lists the software images in the (*.tgz files) in the /var/sw/pkg
directory on the device.
• Crash (Core) Files—Lists the core files located in the /var/crash directory on the
device.
The J-Web user interface displays the files located in the directory.
3. Check the box next to each file you plan to delete.
4. Click Delete.
The J-Web user interface displays the files you can delete and the amount of space
that will be freed on the file system.
5. Click one of the following buttons on the confirmation page:
• To delete the files and return to the Files page, click OK.
• To cancel your entries and return to the list of files in the directory, click Cancel.
219Copyright © 2011, Juniper Networks, Inc.
Chapter 9: Systems Files Management

Deleting the Backup Software Image
Junos OS keeps a backup image of the software that was previously installed so that
you can downgrade to that version of the software if necessary. You can use the J-Web
user interface to delete this backup image. If you delete this image, you cannot downgrade
to this particular version of the software.
To delete the backup software image:
1. In the J-Web user interface, selectMaintain>Files.
2. Review the backup image information listed in the Delete Backup Junos Package
section.
3. Click the Delete backup Junos package link to delete the backup image.
4. Click one of the following buttons on the confirmation page:
• To delete the backup image and return to the Files page, click OK.
• To cancel the deletion of the backup image and return to the Files page, clickCancel.
RelatedDocumentation
File Management Overview on page 217•
• Cleaning Up Files with the CLI on page 220
• Managing Accounting Files on page 221
• Encrypting Configuration Files on page 223
• Junos OS CLI User Guide
• Junos OS System Log Messages Reference
• Junos OS Feature Support Reference for SRX Series and J Series Devices
Managing Files with the CLI
This section contains the following topics:
• Cleaning Up Files with the CLI on page 220
• Managing Accounting Files on page 221
Cleaning Up Files with the CLI
You can use the CLI request system storage cleanup command to rotate log files and
delete unnecessary files on the device. If you are running low on storage space, the file
cleanup procedure quickly identifies files that can be deleted.
The file cleanup procedure performs the following tasks:
• Rotates log files—Archives all information in the current log files, deletes old archives,
and creates fresh log files.
• Deletes log files in /var/log—Deletes any files that are not currently being written to.
Copyright © 2011, Juniper Networks, Inc.220
Junos OS Monitoring and Troubleshooting Guide for Security Devices

• Deletes temporary files in /var/tmp—Deletes any files that have not been accessed
within two days.
• Deletes all crash files in /var/crash—Deletes any core files that the device has written
during an error.
• Deletes all software images (*.tgz files) in /var/sw/pkg—Deletes any software images
copied to this directory during software upgrades.
To rotate log files and delete unnecessary files with the CLI:
1. Enter operational mode in the CLI.
2. Rotate log files and identify the files that can be safely deleted.
user@host> request system storage cleanup
The device rotates log files and displays the files that you can delete.
3. Enter yes at the prompt to delete the files.
NOTE: You can issue the request system storage cleanup dry-run command
to review the list of files that can be deleted with the request system storage
cleanup command, without actually deleting the files.
NOTE:
On SRX Series devices, the /var hierarchy is hosted in a separate partition
(instead of the root partition). If Junos OS installation fails as a result ofinsufficient space:
• Usethe requestsystemstoragecleanupcommandtodelete temporary files.
• Delete any user-created files in both the root partition and under the /var
hierarchy.
Managing Accounting Files
If you configure your system to capture accounting data in log files, set the location for
your accounting files to the DRAM.
The default location for accounting files is the cfs/var/log directory on the CompactFlash
(CF) card. The nonpersistent option minimizes the read/write traffic to your CF card. We
recommend that you use the nonpersistent option for all accounting files configured on
your system.
To store accounting log files in DRAM instead of the CF card:
1. Enter configuration mode in the CLI.
2. Create an accounting data log file in DRAM and replace filename with the name of
the file.
221Copyright © 2011, Juniper Networks, Inc.
Chapter 9: Systems Files Management

[edit]user@host# edit accounting-options file filename
3. Store accounting log files in the DRAM file.
[edit]user@host# set file filename nonpersistent
CAUTION: If log files for accounting data are stored onDRAM, these files arelost when the device reboots. Therefore, we recommend that you back upthese files periodically.
RelatedDocumentation
File Management Overview on page 217•
• Encrypting Configuration Files on page 223
• Decrypting Configuration Files on page 224
• Junos OS Network Interfaces Configuration Guide
• Junos OS System Log Messages Reference
• Junos OS Feature Support Reference for SRX Series and J Series Devices
Encrypting and Decrypting Configuration Files
Configuration files contain sensitive information such as IP addresses. By default, the
device stores configuration files in unencrypted format on an external CompactFlash
(CF) card. This storage method is considered a security risk because the CF card can
easily be removed from the device. To prevent unauthorized users from viewing sensitive
information in configuration files, you can encrypt them.
If your device runs the Canada and U.S. version of Junos OS, you can encrypt the
configuration files with the Advanced Encryption Standard (AES) or Data Encryption
Standard (DES) encryption algorithms. If your device runs the international version of
Junos OS, you can encrypt the files only with DES.
To prevent unauthorized access, the encryption key is stored in the device's EEPROM.
You can copy the encrypted configuration files to another device and decrypt them if
that device has the same encryption key. To prevent encrypted configuration files from
being copied to another device and decrypted, you can set a unique encryption key that
contains the chassis serial number of your device. Configuration files that are encrypted
with a unique encryption key cannot be decrypted on any other device.
The encryption process encrypts only the configuration files in the /config and
/var/db/configdirectories. Files in subdirectories under these directories are not encrypted.
The filenames of encrypted configuration files have the extension .gz.jc—for example,
juniper.conf.gz.jc.
Copyright © 2011, Juniper Networks, Inc.222
Junos OS Monitoring and Troubleshooting Guide for Security Devices

NOTE: Youmusthavesuperuserprivileges toencryptordecryptconfigurationfiles.
This section contains the following topics:
• Encrypting Configuration Files on page 223
• Decrypting Configuration Files on page 224
• Modifying the Encryption Key on page 224
Encrypting Configuration Files
To configure an encryption key in EEPROM and determine the encryption process, enter
one of the request system set-encryption-key commands in operational mode described
in Table 99 on page 223.
Table 99: request system set-encryption-key Commands
DescriptionCLI Command
Sets the encryption key and enables default configuration fileencryption:
• AES encryption for the Canada and U.S. version of Junos OS
• DES encryption for the international version of Junos OS
request system set-encryption-key
Sets the encryption key and specifies configuration fileencryption by DES.
request system set-encryption-key algorithm des
Sets the encryption key and enables default configuration fileencryption with a unique encryption key that includes thechassis serial number of the device.
Configuration files encrypted with the unique key can bedecrypted only on the current device. You cannot copy suchconfiguration files to another device and decrypt them.
request system set-encryption-key unique
Sets the encryption key and specifies configuration fileencryption by DES with a unique encryption key.
request system set-encryption-key des unique
To encrypt configuration files on a device:
1. Enter operational mode in the CLI.
2. Configure an encryption key in EEPROM and determine the encryption process; for
example, enter the request system set-encryption-key command.
user@host> request system set-encryption-keyEnter EEPROM stored encryption key:
3. At the prompt, enter the encryption key. The encryption key must have at least six
characters.
Enter EEPROM stored encryption key:juniper1
223Copyright © 2011, Juniper Networks, Inc.
Chapter 9: Systems Files Management

Verifying EEPROM stored encryption key:
4. At the second prompt, reenter the encryption key.
5. Enter configuration mode in the CLI.
6. Enable configuration file encryption to take place.
[edit]user@host# edit systemuser@host# set encrypt-configuration-files
7. Begin the encryption process by committing the configuration.
[edit]user@host# commitcommit complete
Decrypting Configuration Files
To disable the encryption of configuration files on a device and make them readable to
all:
1. Enter operational mode in the CLI.
2. Verify your permission to decrypt configuration files on this device by entering the
encryption key for the device.
user@host> request system set-encryption-keyEnter EEPROM stored encryption key:Verifying EEPROM stored encryption key:
3. At the second prompt, reenter the encryption key.
4. Enter configuration mode in the CLI.
5. Enable configuration file decryption.
[edit]user@host# edit systemuser@host# set no-encrypt-configuration-files
6. Begin the decryption process by committing the configuration.
[edit]user@host# commitcommit complete
Modifying the Encryption Key
When you modify the encryption key, the configuration files are decrypted and then
reencrypted with the new encryption key.
To modify the encryption key:
1. Enter operational mode in the CLI.
2. Configure a new encryption key in EEPROM and determine the encryption process;
for example, enter the request system set-encryption-key command.
Copyright © 2011, Juniper Networks, Inc.224
Junos OS Monitoring and Troubleshooting Guide for Security Devices

user@host> request system set-encryption-keyEnter EEPROM stored encryption key:
3. At the prompt, enter the new encryption key. The encryption key must have at least
six characters.
Enter EEPROM stored encryption key:juniperoneVerifying EEPROM stored encryption key:
4. At the second prompt, reenter the new encryption key.
RelatedDocumentation
• File Management Overview on page 217
• Cleaning Up Files on page 218
• Cleaning Up Files with the CLI on page 220
• Managing Accounting Files on page 221
• Junos OS Network Interfaces Configuration Guide
• Junos OS System Log Messages Reference
• Junos OS Feature Support Reference for SRX Series and J Series Devices
225Copyright © 2011, Juniper Networks, Inc.
Chapter 9: Systems Files Management

Copyright © 2011, Juniper Networks, Inc.226
Junos OS Monitoring and Troubleshooting Guide for Security Devices

PART 3
Index
• Index on page 229
227Copyright © 2011, Juniper Networks, Inc.

Copyright © 2011, Juniper Networks, Inc.228
Junos OS Monitoring and Troubleshooting Guide for Security Devices

Index
Symbols#, comments in configuration statements....................xv
( ), in syntax descriptions.....................................................xv
.gz.jc file extension See file encryption
/cf/var/crash directory See crash files
/cf/var/log directory See system logs
/cf/var/tmp directory See temporary files
/config directory
file encryption See file encryption
/var/db/config directory See file encryption
/var/log directory See system log messages
< >, in syntax descriptions....................................................xv
[ ], in configuration statements.........................................xv
{ }, in configuration statements.........................................xv
| (pipe) command.....................................................................3
| (pipe), in syntax descriptions...........................................xv
Aadaptive services interfaces
alarm conditions and configuration
options........................................................................209
Advanced Encryption Standard (AES) See AES
encryption
AES encryption
for Canada and U.S Junos........................................222
setting..............................................................................223
alarm class See alarm severity
ALARM LED, color.................................................................207
alarm severity
configuring for an interface.......................................212
major (red) ...................................................................208
See also major alarms
minor (yellow)..............................................................208
See also minor alarms
alarms
active, displaying at login...........................................212
conditions, on an interface......................................209
configurable..................................................................209
configuration requirements for interface
alarms...........................................................................212
licenses..............................................................................211
major See major alarms
minor See minor alarms
overview..........................................................................207
red See major alarms
rescue configuration.....................................................211
severity See alarm severity
types.................................................................................207
verifying............................................................................214
yellow See minor alarms
alias, CoS value.......................................................................94
arithmetic operators, for multicast traffic....................161
AS path, displaying.................................................................87
BBGP (Border Gateway Protocol)
monitoring........................................................................90
peers, probes to See BGP RPM probes
RPM probes to BGP neighbors See BGP RPM
probes
statistics.............................................................................91
BGP groups, displaying..........................................................91
BGP neighbors
directing RPM probes to............................................201
displaying...........................................................................91
monitoring with RPM probes...................................198
BGP peers See BGP neighbors
BGP routing information......................................................90
BGP RPM probes
directing to select BGP neighbors
(configuration editor).............................................201
overview...........................................................................186
setting up on local and remote device
(configuration editor)............................................198
BGP sessions, status..............................................................91
binary operators, for multicast traffic.............................161
braces, in configuration statements.................................xv
brackets
angle, in syntax descriptions......................................xv
square, in configuration statements........................xv
built-in Ethernet ports See Ethernet ports;
management interfaces
Ccables
console port, connecting...........................................120
Ethernet rollover, connecting...................................120
capturing packets See packet capture
229Copyright © 2011, Juniper Networks, Inc.

chassis
monitoring.........................................................................22
power management......................................................22
classifiers, CoS.........................................................................94
cleaning up files...........................................................218, 220
CLI configuration editor
interface alarms............................................................212
RPM....................................................................................191
system log messages, sending to a file.................116
code point aliases, CoS........................................................94
comments, in configuration statements........................xv
configuration files
decrypting........................................................................217
encrypting........................................................................217
console port
adapter.............................................................................120
control plane logs...................................................................113
conventions
notice icons......................................................................xiv
text and syntax...............................................................xiv
CoS (class of service)
classifiers..........................................................................94
CoS value aliases...........................................................94
forwarding classes........................................................96
interfaces..........................................................................93
loss priority.......................................................................98
packet loss priority........................................................98
RED drop profiles...........................................................95
rewrite rules......................................................................97
RPM probe classification...........................................195
See also TCP RPM probes; UDP RPM
probes
scheduler maps..............................................................98
crash files
cleaning up (CLI).........................................................220
cleaning up (J-Web)....................................................218
downloading (J-Web).................................................218
curly braces, in configuration statements......................xv
customer support...................................................................xvi
contacting JTAC..............................................................xvi
DData Encryption Standard (DES) See DES
encryption
data plane logs........................................................................113
decryption, configuration files See file encryption
deleting
crash files (J-Web).......................................................218
files, with caution.........................................................219
log files (J-Web)............................................................218
temporary files (J-Web).............................................218
DES encryption
for international Junos...............................................222
setting..............................................................................223
device
diagnosis..........................................................................123
packet capture..............................................................164
diagnosis
alarm configurations...................................................214
CLI command summary............................................124
displaying firewall filter for........................................172
displaying packet capture configurations...........167
interfaces..............................................................156, 209
J-Web tools overview..................................................123
license infringement.....................................................211
monitoring network performance..........................183
MPLS connections (J-Web).....................................126
multicast paths..............................................................151
network traffic................................................................157
packet capture..............................................................164
packet capture (J-Web).............................................137
ping command...............................................................141
ping host (J-Web)........................................................129
ping MPLS (J-Web).....................................................126
ports.................................................................................209
preparation.....................................................................128
system logs......................................................................113
system operation..........................................................155
traceroute (J-Web)......................................................135
traceroute command..................................................147
traceroute monitor command.................................147
traffic analysis with packet capture......................164
verifying captured packets.......................................168
verifying RPM probe servers.....................................197
verifying RPM statistics..............................................194
diagnostic commands.........................................................124
DiffServ code points, bits for RPM probes...................187
disabling
packet capture...............................................................173
documentation
comments on..................................................................xvi
downloading
crash files (J-Web).......................................................218
log files (J-Web)............................................................218
temporary files (J-Web).............................................218
drop probabilities, CoS.........................................................95
drop profiles, CoS...................................................................95
DS1 ports See T1 ports
Copyright © 2011, Juniper Networks, Inc.230
Junos OS Monitoring and Troubleshooting Guide for Security Devices
DS3 ports See E3 ports; T3 ports
DSCPs (DiffServ code points), bits for RPM
probes....................................................................................187
EE3 ports, alarm conditions and configuration
options.................................................................................209
egress See RPM probes, outbound times
encapsulation, modifying on packet
capture-enabled interfaces...........................................174
encryption, configuration files See file encryption
Ethernet ports
alarm conditions and configuration
options........................................................................209
configuring alarms on.................................................212
Ethernet rollover cable, connecting the router to a
management device.......................................................120
event viewer, J-Web
overview.....................................................................15, 110
See also system log messages
Ffile encryption
.gz.jc file extension.......................................................222
decrypting configuration files.................................224
directories.......................................................................222
encrypting configuration files..................................223
encryption algorithms required for Junos OS
versions.......................................................................222
encryption key...............................................................222
overview..........................................................................222
superuser privileges required for............................222
file management
configuration files.........................................................217
crash files (CLI)............................................................220
crash files (J-Web).......................................................218
encryption-decryption See file encryption
log files..............................................................................217
log files (CLI).................................................................220
log files (J-Web)............................................................218
packet capture file creation.....................................165
temporary files (CLI)..................................................220
temporary files (J-Web).............................................218
filtering
command output.............................................................3
firewall filters
for packet capture, configuring.................................171
for packet capture, overview....................................165
font conventions.....................................................................xiv
forwarding classes, CoS.......................................................96
frequency, test See RPM probes, test intervals
Ggroups
BGP, displaying................................................................91
Hhardware
major (red) alarm conditions on...........................208
supported platforms....................................................xiv
timestamp See RPM probe timestamps
heat status, checking.............................................................22
host reachability
ping command...............................................................141
ping host (J-Web)........................................................129
hostname
monitoring traffic by matching...............................159
pinging (CLI)....................................................................141
pinging (J-Web)............................................................129
tracing a route to (CLI)......................................148, 149
tracing a route to (J-Web).........................................135
HTTP (Hypertext Transfer Protocol), RPM
probes...................................................................................183
Hypertext Transfer Protocol, RPM probes...................183
IICMP (Internet Control Message Protocol)
RPM probes, description...........................................183
RPM probes, inbound and outbound
times.............................................................................185
RPM probes, setting.....................................................191
inbound time See RPM probes
ingress See RPM probes, inbound times
Instance to which this connection belongs
description......................................................................126
using...................................................................................132
interfaces See management interfaces; network
interfaces; ports
intervals, probe and test See RPM probes
JJ Series.......................................................................................217
alarms..............................................................................207
monitoring ..........................................................................3
packet capture..............................................................164
performance monitoring...........................................183
system log messages...................................................113
231Copyright © 2011, Juniper Networks, Inc.
Index

J-Web configuration editor
interface alarms............................................................212
RPM....................................................................................191
system log messages, sending to a file.................116
J-Web interface
Diagnose options..........................................................123
event viewer..............................................................15, 110
managing files................................................................217
jitter
description......................................................................185
See also RPM probes
in RPM probes, improving with
timestamps................................................................184
monitoring......................................................................202
threshold, setting..........................................................187
Junos OS
encryption See file encryption
Junos OS CLI
diagnostic command summary..............................124
filtering command output.............................................3
Llabel-switched paths See LSPs
laptop See management device
latency, in RPM probes, improving with
timestamps........................................................................184
Layer 2 circuits, monitoring................................................126
Layer 2 VPNs, monitoring...................................................126
Layer 3 VPNs, monitoring...................................................126
libpcap format, for packet capture files.......................168
licenses, alarm conditions and remedies......................211
limitations
ALARM LED lights yellow whether alarm is
minor or major..........................................................207
MPLS, no LSP statistics on outbound
device............................................................................101
mtrace from-source packet statistics always
0......................................................................................152
performance degradation with monitor traffic
command....................................................................157
PPP, no J-Web monitoring information
available......................................................................108
Locate LSP from interface name
description......................................................................126
using...................................................................................132
Locate LSP from virtual circuit information
description......................................................................126
using...................................................................................132
Locate LSP using interface name
description......................................................................126
using...................................................................................132
log files
archiving...........................................................................217
deleting unused files....................................................217
rotating..............................................................................217
log messages See system log messages
logical interfaces, CoS..........................................................93
logical operators, for multicast traffic..........................160
logs See system logs
loss priority, CoS.....................................................................98
LSPs (label-switched paths)
information about.........................................................101
monitoring, with ping MPLS.....................................126
statistics..........................................................................102
Mmajor (red) alarms
description.....................................................................208
management device
connecting through the CLI......................................120
connecting to console port.......................................120
diagnosing problems from........................................123
monitoring from................................................................3
recovering root password from.......................119, 120
management interfaces
alarm conditions and configuration
options........................................................................209
configuring alarms on.................................................212
monitoring..................................................................5, 156
statistics..........................................................................156
managing
files.....................................................................................217
manuals
comments on..................................................................xvi
match conditions, for multicast traffic
.............................................................................................159
messages See system log messages
minor (yellow) alarms
description.....................................................................208
monitor interface command.............................................156
controlling output........................................................156
monitor interface traffic command...............................156
controlling output........................................................156
monitor list command.........................................................155
monitor start command.....................................................155
monitor stop command......................................................155
Copyright © 2011, Juniper Networks, Inc.232
Junos OS Monitoring and Troubleshooting Guide for Security Devices

monitor traffic command...................................................157
options.............................................................................158
performance impact....................................................157
monitor traffic matching command..............................158
arithmetic, binary, and relational
operators......................................................................161
logical operators...........................................................160
match conditions.........................................................159
monitoring
BGP......................................................................................91
BGP neighbors, with RPM probes..........................198
chassis................................................................................22
interfaces....................................................................5, 156
Layer 2 circuits...............................................................126
Layer 2 VPNs..................................................................126
Layer 3 VPNs..................................................................126
MPLS traffic engineering................100, 101, 102, 103
multicast paths..............................................................151
network interface traffic.............................................157
network traffic with packet capture.....................164
OSPF..................................................................................89
ports.......................................................................................5
PPP (CLI)........................................................................108
PPPoE...............................................................................105
preparation.....................................................................128
RIP.......................................................................................88
routing information.......................................................85
routing tables..................................................................86
RPM probes...................................................................202
system log messages...................................................113
system logs.....................................................................155
trace files.........................................................................155
monitoring the wx interface.............................................108
MPLS (Multiprotocol Label Switching)
connections, checking................................................126
LSPs...................................................................................101
monitoring interfaces.................................................100
monitoring LSP information....................................100
monitoring LSP statistics..................................101, 102
monitoring MPLS interfaces....................................100
monitoring RSVP interfaces.....................................103
monitoring RSVP sessions........................................102
monitoring traffic engineering................................100
mtrace monitor command................................................154
results...............................................................................154
mtrace-from-source command......................................152
options..............................................................................152
results................................................................................153
multicast
trace operations, displaying.....................................154
tracing paths...................................................................152
Multiprotocol Label Switching See MPLS
Nneighbors, BGP See BGP neighbors; BGP RPM
probes
network interfaces
alarm conditions and configuration
options........................................................................209
configuring alarms on.................................................212
integrated services, alarm conditions and
configuration options............................................209
monitoring..................................................................5, 156
monitoring MPLS traffic engineering...................100
monitoring traffic..........................................................157
monitoring, CoS..............................................................93
monitoring, PPPoE......................................................105
monitoring, RSVP.........................................................103
packet capture, configuring on...............................169
packet capture, disabling before changing
encapsulation............................................................174
packet capture, supported on.................................164
services, alarm conditions and configuration
options........................................................................209
statistics..........................................................................156
network performance See RPM
next hop, displaying...............................................................87
notice icons...............................................................................xiv
OOpen Shortest Path First See OSPF
operational mode, filtering command output................3
operators
arithmetic, binary, and relational
operators......................................................................161
logical...............................................................................160
OSPF (Open Shortest Path First)
monitoring........................................................................88
statistics............................................................................89
OSPF interfaces
displaying..........................................................................89
status.................................................................................89
OSPF neighbors
displaying..........................................................................89
status.................................................................................89
OSPF routing information...................................................88
outbound time See RPM probes
233Copyright © 2011, Juniper Networks, Inc.
Index

Ppacket capture
configuring......................................................................169
configuring (J-Web).....................................................137
configuring on an interface.......................................169
device interfaces supported....................................164
disabling...........................................................................173
disabling before changing encapsulation on
interfaces.....................................................................174
displaying configurations...........................................167
displaying firewall filter for........................................172
enabling...........................................................................166
encapsulation on interfaces, disabling before
modifying.....................................................................174
files See packet capture files
firewall filters, configuring..........................................171
firewall filters, overview.............................................165
J-Web tool........................................................................137
overview...........................................................................164
overview (J-Web)..........................................................137
preparation.....................................................................166
verifying captured packets.......................................168
verifying configuration................................................167
verifying firewall filter for............................................172
packet capture files
analyzing..........................................................................165
libpcap format..............................................................168
overview...........................................................................165
renaming before modifying encapsulation on
interfaces.....................................................................174
Packet Capture page
field summary................................................................138
results...............................................................................140
packet loss priority, CoS.......................................................98
packets
capturing.........................................................................164
capturing with J-Web packet capture...................137
monitoring jitter............................................................202
monitoring packet loss..............................................202
monitoring round-trip times....................................202
multicast, tracking .......................................................152
packet capture..............................................................164
packet capture (J-Web).............................................137
tracking MPLS................................................................134
tracking with J-Web traceroute...............................135
tracking with the traceroute command...............147
parentheses, in syntax descriptions.................................xv
passwords
root password, recovering.........................................120
srx root password, recovering...................................119
paths, multicast, tracing......................................................151
PC See management device
PCAP See packet capture
peers, BGP See BGP neighbors; BGP RPM probes
performance, monitoring See RPM
physical interfaces, CoS.......................................................93
PIMs (Physical Interface Modules)
checking power and heat status..............................22
ping
host reachability (CLI).................................................141
host reachability (J-Web).........................................129
ICMP probes....................................................................191
RPM probes See RPM probes
TCP and UDP probes..................................................195
ping command........................................................................141
options...............................................................................141
Ping end point of LSP
description......................................................................126
using...................................................................................132
Ping Host page
field summary................................................................129
Ping LDP-signaled LSP
description......................................................................126
using...................................................................................132
Ping LSP to Layer 3 VPN prefix
description......................................................................126
using...................................................................................132
ping MPLS (J-Web)
indications.......................................................................134
Layer 2 circuits...............................................................126
Layer 2 VPNs..................................................................126
Layer 3 VPNs..................................................................126
LSP state.........................................................................126
options..............................................................................126
requirements..................................................................128
results...............................................................................134
ping mpls l2circuit command..........................................146
results...............................................................................134
ping mpls l2vpn command................................................145
results...............................................................................134
ping mpls l3vpn command...............................................144
results...............................................................................134
ping mpls ldp command....................................................144
results...............................................................................134
ping mpls lsp-end-point command..............................144
results...............................................................................134
Copyright © 2011, Juniper Networks, Inc.234
Junos OS Monitoring and Troubleshooting Guide for Security Devices

Ping MPLS page
field summary................................................................132
results...............................................................................134
ping mpls rsvp command..................................................144
results...............................................................................134
Ping RSVP-signaled LSP
description......................................................................126
using...................................................................................132
pipe (|) command, to filter output......................................3
Point-to-Point Protocol See PPP
Point-to-Point Protocol over Ethernet See PPPoE
ports
alarm conditions and configuration
options........................................................................209
configuring alarms on.................................................212
individual port types..................................................209
monitoring...........................................................................5
power management, chassis.............................................22
PPP (Point-to-Point Protocol)
monitoring (CLI)...........................................................108
PPPoE (Point-to-Point Protocol over Ethernet)
interfaces.........................................................................105
monitoring......................................................................105
session status................................................................105
statistics..........................................................................105
version information.....................................................105
probe loss
monitoring......................................................................202
threshold, setting..........................................................187
probes, monitoring.....................................................105, 202
See also RPM probes
protocols
originating, displaying...................................................87
OSPF, monitoring..........................................................88
PPP, monitoring............................................................108
RIP, monitoring................................................................87
routing protocols, monitoring............................85, 90
QQuick Configuration
RPM pages.......................................................................191
Rrandom early detection (RED) drop profiles,
CoS..........................................................................................95
real-time performance monitoring See RPM
RED drop profiles, CoS.........................................................95
relational operators, for multicast traffic......................161
request system set-encryption-key algorithm des
command............................................................................223
request system set-encryption-key command........223
request system set-encryption-key des
unique...................................................................................223
request system set-encryption-key unique................223
request system storage cleanup command..............220
request system storage cleanup dry-run
command...........................................................................220
rescue configuration, alarm about...................................211
Resource Reservation Protocol See RSVP
rewrite rules, CoS....................................................................97
RIP (Routing Information Protocol)
monitoring.........................................................................87
statistics............................................................................88
RIP neighbors
displaying..........................................................................88
status.................................................................................88
RIP routing information........................................................87
RJ-45 to DB-9 serial port adapter..................................120
rollover cable, connecting the console port................120
root password recovery..............................................119, 120
rotating files.............................................................................218
round-trip time
description......................................................................185
See also RPM probes
threshold, setting..........................................................187
routing
monitoring........................................................................85
traceroute (J-Web)......................................................135
traceroute command..................................................147
traceroute monitor command.................................147
routing table
monitoring........................................................................86
RPM (real-time performance monitoring)
basic probes (configuration editor).......................191
BGP monitoring See BGP RPM probes
inbound and outbound times..................................185
jitter, viewing..................................................................202
monitoring probes.......................................................202
overview...........................................................................183
See also RPM probes
preparation......................................................................191
probe and test intervals.............................................184
probe counts..................................................................185
Quick Configuration......................................................191
round-trip times, description...................................185
round-trip times, viewing.........................................202
sample configuration..................................................194
235Copyright © 2011, Juniper Networks, Inc.
Index

sample graphs..............................................................202
statistics..........................................................................185
statistics, verifying.......................................................194
TCP probes (configuration editor)........................195
See also TCP RPM probes
tests...................................................................................184
tests, viewing................................................................202
threshold values...........................................................186
tuning probes.................................................................197
UDP probes (configuration editor)........................195
See also UDP RPM probes
verifying probe servers................................................197
RPM pages................................................................................191
field summary................................................................187
RPM probe timestamps
overview...........................................................................184
setting (configuration editor)...................................191
RPM probes
basic (configuration editor).......................................191
BGP neighbors See BGP RPM probes
cumulative jitter...........................................................202
current tests..................................................................202
DSCP bits (Quick Configuration)............................187
graph results..................................................................202
ICMP (configuration editor)......................................191
inbound times................................................................185
jitter threshold................................................................187
monitoring......................................................................202
outbound times............................................................185
probe count, setting (Quick
Configuration)...........................................................187
probe count, tuning......................................................197
probe counts..................................................................185
probe intervals..............................................................184
probe intervals, setting (Quick
Configuration)...........................................................187
probe intervals, tuning................................................197
probe loss count...........................................................187
probe owner....................................................................187
probe type, setting (Quick Configuration)..........187
probe types.....................................................................183
round-trip time threshold..........................................187
round-trip times, description...................................185
round-trip times, viewing.........................................202
SNMP traps (Quick Configuration)........................187
source address, setting...............................................197
TCP (configuration editor)........................................195
See also TCP RPM probes
TCP server port..............................................................187
test intervals..................................................................184
test intervals, setting (Quick
Configuration)...........................................................187
test target........................................................................187
threshold values, description..................................186
threshold values, setting (Quick
Configuration)...........................................................187
timestamps See RPM probe timestamps
tuning................................................................................197
UDP (configuration editor).......................................195
See also UDP RPM probes
UDP server port.............................................................187
verifying TCP and UDP probe servers...................197
RSVP (Resource Reservation Protocol)
interfaces, monitoring................................................103
sessions, monitoring...................................................102
RTT See RPM probes, round-trip times
Ssamples
alarm configuration.....................................................214
basic RPM probes.........................................................191
RPM probes....................................................................194
RPM test graphs..........................................................202
TCP and UDP probes..................................................195
scheduler maps, CoS............................................................98
security
configuration file encryption....................................222
See also file encryption
packet capture for intrusion detection................164
security logs..............................................................................115
streaming through revenue ports............................115
serial ports
alarm conditions and configuration
options........................................................................209
configuring alarms on.................................................212
services module
alarm conditions and configuration
options........................................................................209
Services Router
monitoring ..........................................................................3
performance monitoring...........................................183
sessions
BGP peer, status details...............................................91
RSVP, monitoring.........................................................102
set no-encrypt-configuration-files command..........224
severity levels
for alarms See alarm severity
show bgp neighbor command..........................................90
Copyright © 2011, Juniper Networks, Inc.236
Junos OS Monitoring and Troubleshooting Guide for Security Devices

show bgp summary command.........................................90
show chassis alarms command.............................214, 215
show chassis environment command............................22
show chassis hardware command......................19, 21, 22
show chassis power-ratings command.........................22
show chassis redundant-power-supply
command..............................................................................22
show chassis routing-engine command.................22, 24
show class-of-service classifier command..................94
show class-of-service code-point-aliases
command..............................................................................94
show class-of-service drop-profile command...........95
show class-of-service forwarding-class
command..............................................................................96
show class-of-service rewrite-rules command..........97
show class-of-service scheduler-map
command.............................................................................98
show firewall filter dest-all command..........................172
show interfaces detail command.......................................5
show interfaces interface-name command...................5
show interfaces pp0 command......................................105
show interfaces terse command.........................................5
show log command...............................................................113
show mpls interface command......................................100
show mpls lsp command..................................................100
show mpls statistics command.......................................101
show ospf interfaces command.......................................88
show ospf neighbors command.......................................88
show ospf statistics command........................................88
show ppp address-pool command...............................108
show ppp interface command........................................108
show ppp statistics command........................................108
show ppp summary command.......................................108
show pppoe interfaces command.................................105
show pppoe statistics command...................................105
show pppoe version command.......................................105
show redundant-power-supply command..................22
show rip neighbors command...........................................87
show rip statistics command.............................................87
show route detail command..............................................86
show route terse command...............................................86
show services rpm active-servers
command..................................................................197, 200
explanation...........................................................197, 200
show services rpm probe-results
command..................................................................194, 202
explanation.....................................................................194
show system process command......................................24
show system processes command.................................113
show system storage command.................................19, 21
show system uptime command..................................19, 21
show system users command......................................19, 21
show version command..................................................19, 21
show forwarding-options command.............................167
SNMP traps
performance monitoring See RPM probes
SRX Series................................................................................217
alarms..............................................................................207
monitoring ..........................................................................3
packet capture..............................................................164
performance monitoring...........................................183
system log messages...................................................113
statistics
BGP......................................................................................91
interfaces.........................................................................156
LSP.....................................................................................102
OSPF..................................................................................89
performance monitoring...........................................185
PPPoE...............................................................................105
RIP.......................................................................................88
RPM, description..........................................................185
RPM, monitoring..........................................................202
RPM, verifying................................................................194
status
BGP......................................................................................91
OSPF interfaces.............................................................89
OSPF neighbors.............................................................89
RIP neighbors..................................................................88
streaming security logs through revenue ports..........115
support, technical See technical support
syntax conventions................................................................xiv
syslog See system logs
system log messages
/var/log directory...........................................................116
capturing in a file (configuration editor)..............116
destinations.............................................................113, 115
event viewer..............................................................15, 110
monitoring (Quick Configuration)..........................110
overview............................................................................113
system logs
control plane logs..........................................................113
data plane logs...............................................................113
file cleanup (CLI).........................................................220
file cleanup (J-Web)....................................................218
functions...........................................................................113
messages See system log messages
monitoring.......................................................................155
overview............................................................................113
237Copyright © 2011, Juniper Networks, Inc.
Index

redundant syslog server..............................................113
remote system log server...........................................115
sending through eventd..............................................115
system management
displaying log and trace file contents...................155
system logs......................................................................113
TT1 ports
alarm conditions and configuration
options........................................................................209
configuring alarms on.................................................212
T3 ports
alarm conditions and configuration
options........................................................................209
configuring alarms on.................................................212
TCP RPM probes
CoS classification, destination interface
requirement...............................................................195
CoS classification, use with caution.....................195
description......................................................................183
server port.......................................................................187
setting...............................................................................195
verifying servers.............................................................197
technical support
contacting JTAC..............................................................xvi
temporary files
cleaning up (CLI).........................................................220
cleaning up (J-Web)....................................................218
downloading (J-Web).................................................218
for packet capture........................................................165
tests See RPM
threshold values, for RPM probes See RPM probes
timestamps
for RPM probes See RPM probe timestamps
suppressing in packet headers, in captured
packets........................................................................138
suppressing in packet headers, in traffic
monitoring..................................................................158
trace files
monitoring.......................................................................155
multicast, monitoring..................................................154
traceroute
CLI command................................................................148
indications.......................................................................136
J-Web tool.......................................................................135
results...............................................................................136
TTL increments.............................................................135
traceroute command..........................................................148
options.............................................................................148
traceroute monitor
CLI command................................................................149
traceroute monitor command.........................................149
options.............................................................................149
results...............................................................................150
Traceroute page
field summary................................................................135
traffic
analyzing with packet capture................................164
multicast, tracking........................................................152
tracking with J-Web traceroute...............................135
tracking with the traceroute command...............147
troubleshooting
packet capture for analysis......................................164
See also diagnosis; packet capture
root password recovery......................................119, 120
TTL (time to live)
default, in multicast path-tracking
queries..........................................................................152
increments, in traceroute packets.........................135
threshold, in multicast trace results......................153
total, in multicast trace results................................153
UUDP RPM probes
CoS classification, destination interface
requirement...............................................................195
CoS classification, use with caution.....................195
description......................................................................183
server port.......................................................................187
setting...............................................................................195
verifying servers.............................................................197
Vverification
alarm configurations...................................................214
captured packets.........................................................168
destination path (J-Web)..........................................135
firewall filter for packet capture..............................172
host reachability (CLI).................................................141
host reachability (J-Web).........................................129
LSPs (J-Web).................................................................126
packet capture...............................................................167
RPM configuration.......................................................194
RPM probe servers.............................................197, 200
RPM statistics................................................................194
traceroute command..................................................147
Copyright © 2011, Juniper Networks, Inc.238
Junos OS Monitoring and Troubleshooting Guide for Security Devices

traceroute monitor command.................................147
tracing multicast paths..............................................152
version
PPPoE, information about........................................105
View Events page
field summary (filtering log messages)................86
Yyellow alarms See minor alarms
239Copyright © 2011, Juniper Networks, Inc.
Index

Copyright © 2011, Juniper Networks, Inc.240
Junos OS Monitoring and Troubleshooting Guide for Security Devices