aiif · 2017-12-04 · lesson 6: parameters and ... explain how to use multiplication to determine...
TRANSCRIPT

Probabilityand
Statistics
AIIFAlgebra II Foundations
Teacher Manual

Table of Contents
Lesson Page Lesson 1: Fundamental Counting Principle ................................................................................................1
Lesson 2: Permutations and Factorials............................................................................................................21
Lesson 3: Combinations.....................................................................................................................................40
Lesson 4: Probability..........................................................................................................................................59
Lesson 5: Expected Winnings ...........................................................................................................................76
Lesson 6: Parameters and Statistics .................................................................................................................88
Assessments ......................................................................................................................................................109
CREDITS Author: Dennis Goyette and Danny Jones Contributors: Robert Balfanz, Dorothy Barry, Leonard Bequiraj, Stan Bogart, Robert Bosco, Carlos Burke, Lorenzo
Hayward, Vicki Hill, Winnie Horan, Donald Johnson, Kay Johnson, Karen Kelleher, Kwan Lange, Dennis Leahy, Song-Yi Lee, Hsin-Jung Lin, Guy Lucas, Ira Lunsk, Sandra McLean, Hemant Mishra, Glenn Moore, Linda Muskauski, Tracy Morrison, Jennifer Prescott, Gerald Porter, Steve Rigefsky, Ken Rucker, Stephanie Sawyer, Dawne Spangler, Fred Vincent, Maria Waltemeyer, Teddy Wieland
Graphic Design: Gregg M. Howell © Copyright 2009, The Johns Hopkins University, on behalf of the Center for Social Organization of Schools. All Rights Reserved. CENTER FOR SOCIAL ORGANIZATION OF SCHOOLS Johns Hopkins University 3003 N. Charles Street—Suite 200 Baltimore, MD 21218 410-516-8800 410-516-8890 fax All rights reserved. Student assessments, Cutout objects, and transparencies may be duplicated for classroom use only; the number is not to exceed the number of students in each class. No other part of this document may be reproduced, in any form or by any means, without permission in writing from the publisher. Transition to Advanced Mathematics contains Internet website IP (Internet Protocol) addresses. At the time this manual was printed, the website addresses were checked for both validity and content as it relates to the manual’s corresponding topic. The Johns Hopkins University, and its licensors is not responsible for any changes in content, IP addresses changes, pop advertisements, or redirects. It is further recommended that teachers confirm the validity of the listed addresses if they intend to share any address with students.
Planning Document
Page i
AIIF
Planning Document: Probability and Statistics Overview Probability and Statistics is based on probability and statistics. The probability and statistics lessons include:
• Fundamental Counting Principle • Permutations and Factorial • Combinations • Probability • Expected Winnings • Parameters and Statistics
The number of total suggested days for the unit is 5 to 10. Adjustments may be needed based on student performance during the unit and amount of time available until the end of the semester.
Vocabulary
Fundamental Counting Principle Permutation Factorial Standard form Scientific notation Permutations formula Tree diagram
Combinations Combination formula Theoretical probability Experimental probability Independent event Dependent event With replacement Without replacement
Expected winnings Population parameter Sample statistic Random sample Biased Mean Median Mode
Range Standard deviation Lower quartile 25th percentile Upper quartile 75th percentile Box and whisker plot
Material List
Student journal Setting the Stage transparencies Dry-erase boards Markers and erasers Overhead markers Graphing calculators
Calculator view screen Blank transparencies Lesson specific Transparencies Overhead projector Construction paper
Poster paper Decks of cards (one for each group) Pennies Paper bags

Pl
anni
ng D
ocum
ent
Page
ii
AII
F
The
follo
win
g ta
ble
cont
ains
less
on n
ame,
tim
elin
e, s
umm
ary
of c
once
pts
cove
red,
and
the
Esse
ntia
l Que
stio
n(s)
for e
ach
less
on.
Le
sson
Ti
mel
ine
Con
cept
s C
over
ed
Esse
ntia
l Que
stio
n(s)
Fu
ndam
enta
l C
ount
ing
Prin
cipl
e 1
to 2
Day
s •
Dis
cove
r the
Fun
dam
enta
l Cou
ntin
g Pr
inci
ple
• U
se th
e Fu
ndam
enta
l Cou
ntin
g Pr
inci
ple
to
dete
rmin
e th
e nu
mbe
r of o
utco
mes
How
can
the
Fund
amen
tal C
ount
ing
Prin
cipl
e be
use
d to
det
erm
ine
the
num
ber
of o
utco
mes
of a
n ev
ent?
Pe
rmut
atio
ns a
nd
Fact
oria
l 1
to 2
Day
s •
Use
the
Fund
amen
tal C
ount
ing
Prin
cipl
e to
de
term
ine
the
num
ber o
f per
mut
atio
ns p
ossi
ble
for d
iffer
ent s
ituat
ions
•
Use
the
Fund
amen
tal C
ount
ing
Prin
cipl
e to
un
ders
tand
fact
oria
l •
Use
fact
oria
ls to
def
ine
the
calc
ulat
ions
for
perm
utat
ions
•
Det
erm
ine
the
num
ber o
f per
mut
atio
ns fo
r di
ffere
nt s
ituat
ions
• H
ow c
an th
e Fu
ndam
enta
l C
ount
ing
Prin
cipl
e be
use
d to
de
fine
fact
oria
l •
How
can
fact
oria
ls a
nd
perm
utat
ions
be
used
to d
eter
min
e th
e nu
mbe
r of o
utco
mes
of a
n ev
ent?
Com
bina
tions
1
to 2
Day
s •
Use
com
bina
tions
to d
eter
min
e th
e to
tal n
umbe
r of
out
com
es fo
r lot
tery
gam
es
• D
eter
min
e th
e nu
mbe
r of c
ombi
natio
ns fo
r di
ffere
nt s
ituat
ions
• H
ow c
an c
ombi
natio
ns b
e us
ed to
de
term
ine
the
num
ber o
f out
com
es
in g
amin
g?
• H
ow c
an c
ombi
natio
ns b
e us
ed to
de
term
ine
the
num
ber o
f co
mbi
natio
ns o
f diff
eren
t situ
atio
ns?
Prob
abili
ty
1 to
2 D
ays
• D
eter
min
e th
e pr
obab
ility
of i
ndep
ende
nt a
nd
depe
nden
t eve
nts
• D
eter
min
e th
eore
tical
and
exp
erim
enta
l pr
obab
ility
• W
hat i
s th
e di
ffere
nce
betw
een
theo
retic
al p
roba
bilit
y an
d ex
peri
men
tal p
roba
bilit
y?
• H
ow c
an th
e Fu
ndam
enta
l C
ount
ing
Prin
cipl
e, p
erm
utat
ions
, an
d co
mbi
natio
ns b
e us
ed to
de
term
ine
prob
abili
ty?
Expe
cted
Win
ning
s 1
to 2
Day
s •
Det
erm
ine
the
expe
cted
win
ning
s of
diff
eren
t si
tuat
ions
•
How
can
pro
babi
lity
be u
sed
to
dete
rmin
e th
e ex
pect
ed w
inni
ngs
in
vari
ous
situ
atio
ns?
Pa
ram
eter
s and
St
atis
tics
1 to
2 D
ays
• D
eter
min
e th
e m
ean,
med
ian,
mod
e, u
pper
qu
artil
e, lo
wer
qua
rtile
, min
imum
, max
imum
, •
How
is d
ata
used
to c
reat
e
hist
ogra
ms a
nd b
ox a
nd w
hisk
er

Pl
anni
ng D
ocum
ent
Page
iii
AII
F
and
stan
dard
dev
iatio
n of
a s
et o
f dat
a.
• D
raw
a h
isto
gram
•
Dra
w a
box
and
whi
sker
plo
t •
Inve
stig
ate
the
diffe
renc
e be
twee
n a
popu
latio
n pa
ram
eter
and
a sa
mpl
e st
atis
tic
• In
vest
igat
e th
e re
latio
nshi
p be
twee
n a
rand
om
sam
ple
and
bias
•
Inve
stig
ate
the
spre
ad o
f dat
a an
d st
anda
rd
devi
atio
n
plot
s?
• H
ow a
re th
e va
riou
s st
atis
tics
used
in
real
-wor
ld a
pplic
atio
ns?
Probability and Statistics Lesson 1: Fundamental Counting Principle Page 1
AIIF
Lesson 1: Fundamental Counting Principle Note: You may want to place students in new groups and new seating arrangements. Objectives The students will: • Discover the Fundamental Counting Principle. • Use the Fundamental Counting Principle to determine the number of outcomes. Essential Questions How can the Fundamental Counting Principle be used to determine the number of outcomes of an event? Tools • Overhead • Poster paper (Optional) • Blank transparencies • Deck of cards for each group • Overhead markers • Calculator Warm Up • Problems of the Day Number of Days • At least 1 block schedule Vocabulary Fundamental Counting Principle Event Notes • Prior to teaching, you will need to prepare transparencies from the master hard copies supplied in this
manual. • At the end of each lesson in Algebra II Foundations there are Practice Exercises, Outcome Sentences, and a
small quiz. The authors suggest that teachers use these tools as needed and as time allows.

Page 2
AIIF
Teacher Reference Setting the Stage Have groups of four complete this problem. Give the groups a time limit such as 15 minutes to determine a solution and to create a demonstration that showed how they determined the solution. They can draw on a transparency, draw on a poster board, or they can demonstrate in their group. Sally and her family always sat in the same order around a table. To Sally’s left sat her mom, across from her sat her dad, and to her right sat her brother. She wanted to make a change. In how many different orders could her family sit? Since the answer to this problem does not depend on specific locations of the family members, the easy way to determine an answer is to leave Sally in one position and then represent all the different ways that the other family members could sit. There are 6 different orders.
S
B
D
M
Original Arrangement:
Mom on Left, Dad Across, Brother on
Right
S
D
B
M
Mom on Left, Brother Across, Dad on Right
S
M
D
B
Brother on Left, Dad Across, Mom
on Right
S
B
M
D
Dad on Left, Mom Across, Brother on Right
S
D
M
B
Brother on Left, Mom Across, Dad
on Right
S
M
B
D
Dad on Left, Brother Across, Mom on Right
Probability and Statistics Lesson 1: Fundamental Counting Principle Page 3
AIIF
Pre-Reading Have each group of four students create a short story using the following vocabulary words. Student Leadership Positions ace of diamonds Fundamental counting principle ace of spades Event ace of clubs Occur ace of hearts 52-card deck dealing cards Face cards Activity 1 Arrange one row of 4 empty desks in the front of class, facing the class. Put the “president” table tent on the first desk, the “vice-president” table tent on the second desk, the “secretary” table tent on the third desk, and the “treasurer” table tent on the fourth desk. Table tents are located at the end of this lesson. For Exercise 1, place the treasurer table tent face down. Have three students come to the front of class. Explain to the class that these three students represent a school with only three juniors. It is class election week, how many ways can this class of three fill in the three positions? Have the class watch as you place a person behind each desk, representing one situation. Now rearrange the people into another situation. Keep doing this until you have shown the 6 different ways the three people can be placed into three different positions of class officers. Make sure after you demonstrate the 6 different ways, you talk about the fact that there where 3 choices for the president, then only 2 choices for the vice-president, and finally 1 choice for the secretary. Explain to them that this is an easy way of keeping track of the number of different ways and that 3 times 2 times 1 gives the answer of six, the same solution that they determined. For Exercise 2, have one more person come to the front of the class. Now ask the class to watch as the four people try to demonstrate the different ways that a junior class of only four students could fill the three positions. Let the four students try to demonstrate on their own. Eventually lead the class through the process if necessary. There are 4 options for the president, 3 options for the vice-president, and finally 2 options for the secretary, so there are 24 ways this could occur. For Exercise 3, turn the table tent over for the treasurer and show how four students could be placed in four positions. There are also 24 ways for this to occur. For Exercise 4, ask the class, “What if the size of the junior class was the same as our math class, how many different ways could we pick the class officers?” For example, if your math class has 30 students then there are 30 ways to pick a president, 29 ways to pick the vice-president, 28 ways to pick the treasurer, and finally 27 ways to pick the secretary for a total of 657,729 ways. You may want to discuss how long it would take to demonstrate all the different ways. For example, if it only took 5 seconds to create a new line up of four it would take 5 657, 720 3, 288, 600• = seconds to show all the different line-ups. This is the same as 54,810 minutes, which is the same as 913.5 hours, which is the same as 38.0625 days.

Page 4
AIIF
SJ Page 1 Activity 1 1. How many ways can three juniors fill three student leadership positions? Explain how to use multiplication to determine this solution. 3 2 1 6• • = 2. How many ways can four juniors fill three positions? Explain how to use multiplication to determine this solution. 4 3 2 24• • = 3. How many ways can four juniors fill four leadership positions? Explain how to use multiplication to determine this solution. 4 3 2 1 24• • • = 4. How many ways could your math class fill four student leadership positions?
Explain how to use multiplication to determine this solution. Sample response: 30 29 28 27 657 , 720• • • = Would it be easy to demonstrate all the different ways this could occur? Explain why or why not. Answers will vary.
President Vice-President Secretary Treasurer
President Vice-President Secretary
? ? ?
Probability and Statistics Lesson 1: Fundamental Counting Principle Page 5
AIIF
Activity 1 – President Table Tent Master
President Pres
iden
t

Page 6
AIIF
Activity 1 – Vice President Table Tent Master
Vice President V
ice
Pres
iden
t

Probability and Statistics Lesson 1: Fundamental Counting Principle Page 7
AIIF
Activity 1 – Secretary Table Tent Master
Secretary Secr
etar
y

Page 8
AIIF
Activity 1 – Treasurer Table Tent Master
Treasurer Trea
sure
r

Probability and Statistics Lesson 1: Fundamental Counting Principle Page 9
AIIF
Teacher Reference Activity 2 Before the students begin the exercises, have the students create the 120 different ways that the fingernails of one hand could be painted with five different colors, if each fingernail was painted a different color. Break the class into five groups. Assign each of the five groups a starting color. For example, Group 1 has to use blue for the thumb, Group 2 has to use green for the thumb, Group 3 has to use yellow for the thumb, Group 4 has to use purple for the thumb, and Group 5 has to use red for the thumb. Within the groups the students will have to decide how they will share the coloring so that all of the color patterns occur. You can have the students trace their hand to make a template and then color the area for the fingernails or you can make copies of the hand template and pass out 24 hand templates to each group of 5. Display the hands around the room. Perhaps keep them in some type of order. Note: This activity was based on an experience the author had with his children when going through a large maze. The goal of the maze was to reach five different boxes in the maze and place your finger in the box to color it. You could prove that you made it through the maze by showing everyone the five different colors on five different fingers from the five different color boxes. On the wall outside the maze was a drawing of all 120 different ways that the fingers could be colored. A different small prize was given for each different combination of colors.

Page 10
AIIF
SJ Page 2 Activity 2 Fundamental Counting Principle If one event can occur in m different ways and for each of these ways a second event can occur n different ways, then there are •m n possible different ways for both events to occur together. For example, if you have four different workout shirts and three different exercise shorts, then there are • =4 3 12 ways for you to dress out for a fitness workout. 1. How many ways are possible to paint the fingernails of one hand with 5 different colors if each
fingernail needs to be a different color? Show how to use multiplication to determine this solution. 5 4 3 2 1 120• • • • = 2. How many ways can you paint all ten fingernails with ten different colors? Show how to use multiplication to determine this solution. 10 9 8 7 6 5 4 3 2 1 3,628,800• • • • • • • • • = 3. How many ways can you paint all twenty nails (fingers and toes) with 20 different colors? Show how to use multiplication to determine this solution. 1820 19 18 17 16 15 14 13 12 11 10 9 8 7 6 5 4 3 2 1 2.43 10• • • • • • • • • • • • • • • • • • • ≈ ×
Note: Some calculators may not be able to display this number. That’s okay. One of the goals for this problem is show students how large the number of different ways can grow and how quickly.
4. How many ways are possible to paint the fingernails of one hand with 5 different colors if each
fingernail needs to be a different color and you have 10 colors to choose from? 10 9 8 7 6 30, 240• • • • =

Probability and Statistics Lesson 1: Fundamental Counting Principle Page 11
AIIF
Hand Template SJ Page 3

Page 12
AIIF
Teacher Reference Activity 3 You may want to give each group of four a deck of cards, although the number of ways to deal the cards will have more outcomes to model than the students will have time to model. Having the deck of cards at least allows the students to model a few examples so they can make the link between the model and the mathematics. Have the students work in pairs during this activity.

Probability and Statistics Lesson 1: Fundamental Counting Principle Page 13
AIIF
SJ Page 5 Activity 3 1. How many different ways out of a 52-card deck could you deal
three cards? 52 51 50 132,600• • = 2. How many different ways out of a 52-card deck could you deal
seven cards? 1152 51 50 49 48 47 46 6.74 10• • • • • • ≈ × 3. Using a 52-card deck, Paulina wanted to deal 6 cards in row that alternated red and black. How many
different ways could this occur? Note: There are 26 red cards and 26 black cards in a standard deck of 52 cards. 26 26 25 25 24 24 243, 360 , 000• • • • • =
4. Sharmin wanted to line up 13 out of the 52 cards in order of king, queen, jack, 10, 9, 8, 7, 6, 5, 4, 3, 2, ace. It
didn’t matter what suit. How many different ways could this occur? 134 4 4 4 4 4 4 4 4 4 4 4 4 4 67 ,108,864• • • • • • • • • • • • = =
5. How many ways is it possible to deal four cards from a 52-card deck? Any four cards is
52 51 50 49 6,497 , 400• • • =
Use this knowledge to determine the possibility of dealing in order the Ace of Clubs, Ace of Diamonds, Ace of Spades, then finally the Ace of Hearts. Sample Response: The exact order of Ace of Clubs, Ace of Diamonds, Ace of Spades, and finally the Ace of Hearts only occurs one way so there is 1 out of 6,497,400 possibilities.
6. If you separate the twelve face cards from the deck, how many different ways could you arrange all twelve
face cards? 12 11 10 9 8 7 6 5 4 3 2 1 479,001,600• • • • • • • • • • • =

Page 14
AIIF
Teacher Reference Activity 4 Have the students work in pairs to complete Exercises 1 through 3. Before they go onto Exercise 4, have the pairs report their findings. For Exercise 4, have each student create and display a license plate. Supply rulers and colored pencils or markers. The students may want to be creative and make a design for the background of the license plate. After the students have displayed the license plates have the entire class walk around and look at the plates. If a student wants to make a comment on a particular plate or ask a question have them place a note under the display. Extensions Have students determine the number of ways specific poker hands could occur using a standard deck of cards.

Probability and Statistics Lesson 1: Fundamental Counting Principle Page 15
AIIF
SJ Page 6 Activity 4 In order to keep track of who owns each car, states assign a license plate to each car in their state. Different states have different designs and different ways of assigning numbers and letters to the plate. 1. Explain why no two cars in a state can have the same order of the same numbers and same letters.
Sample response: Each car has to have a unique license number so that it can be assigned to one person. It wouldn’t make sense to have two license plates with the same number. If a police officer had to call in a violation, it wouldn’t make sense if there was another car assigned to the same number, the officer might give a violation to the wrong person.
2. In the example license plate above, the first three spaces can be filled with numbers from 0 to 9 and the
second three spaces can be filled with letters from A to Z. Note: Numbers and letters can repeat. a. How many different license plates can be created? 10 10 10 26 26 26 17 ,576,000• • • • • = b. Could there be enough different license plates for the number of cars in New York State with
this method? Explain why or why not. Note: The approximate number of vehicles in New York State is 12,000,000. Yes. Sample response: There are about 5,500,000 extra license numbers.
c. What would be the total number of license plates, if the numbers and letters could not repeat?
10 9 8 26 25 24 11, 232, 000• • • • • = 3. In 1933, the State of Washington used two digits followed by 3 digits to create license plates. Explain
why this method would not create enough license plates for the state of Washington today? Note: The approximate number of registered vehicles in Washington State is 5,600,000. Sample response: With the method used in 1933, there would be 10 10 10 10 10 100,000• • • • = license number which would not be enough.
Your State Name
644♦AMT
X Washington 93
18 • 957

Page 16
AIIF
SJ Page 6 (cont.) 4. Design your own license plate. Create a rule for assigning the digits and or letters. The maximum
number of letters and numbers to use on the plate are seven. Use your imagination. On the back of the plate write your rules. Also list how many different license plates can be created. Answers will vary.

Probability and Statistics Lesson 1: Fundamental Counting Principle Page 17
AIIF
SJ Page 7 Outcome Sentences The Fundamental Counting Principle I would like to find out more about I didn’t realize that I cannot agree with

Page 18
AIIF
Lesson 1 Quiz A Answers 1. 5 4 3 2 1 120• • • • = 2. 5 4 3 60• • = 3. 26 26 26 26 26 11,881,376• • • • = Lesson 1 Quiz B Answers 1. 10 9 8 7 6 4 3 2 1 3,628,800• • • • • • • • = 2. 10 9 8 720• • = 3. 10 10 10 10 10 10 10 10,000,000• • • • • • =

Probability and Statistics Lesson 1: Fundamental Counting Principle Page 19
AIIF
Lesson 1 Quiz A Name: 1. How many different ways could 5 runners place 1st, 2nd, 3rd, 4th, and 5th in a 5 kilometer race? 2. How many different ways could three runners out of five place 1st, 2nd, and 3rd? 3. A license plate has space for 5 letters. If the letters can repeat, how many different license plates can be
created with only the alphabet letters?

Page 20
AIIF
Lesson 1 Quiz B Name: 1. How many different ways could ten runners place 1st, 2nd, 3rd, 4th, 5th, 6th, 7th, 8th, 9th, and 10th in the 1,500
meter run? 2. How many different ways could three runners out of ten place 1st, 2nd, and 3rd? 3. A license plate has space for 7 numbers. If the numbers can repeat, how many different license plates
can be created with only numbers?

Probability and Statistics Lesson 2: Permutations and Factorials Page 21
AIIF
Lesson 2: Permutations and Factorials Objectives • Students will use the Fundamental Counting Principle to determine the number of permutations possible
for different situations. • Students will use the Fundamental Counting Principle to understand factorial. • Students will use Factorials to define the calculations for permutations. • Students will determine the number of permutations for different situations. Essential Questions • How can the Fundamental Counting Principle be used to define factorial? • How can factorials and permutations be used to determine the number of outcomes of an event? Tools • Overhead • Blank transparencies • Overhead markers • Poster paper (Optional) • Calculators Warm Up • Problems of the Day Number of Days • At least 1 block schedule Vocabulary Permutation Tree Diagram Factorial Standard Form Scientific Notation Permutations Formula

Page 22
AIIF
Setting the Stage Use this activity to reintroduce the students to scientific notation. Say to the students, “When a number becomes too large to fit on the screen of a calculator, some calculators use scientific notation to represent and display the number. For example, multiply the following numbers on a calculator.” Note: Place 30 29 28 27 26 25 24• • • • • • on the board or overhead. Ask the students, “What is the meaning of the display on the screen of the calculator?” (Note: Allow the students to experiment with a calculator, preferably a graphing calculator. You may need to have the students experiment with familiar numbers such as 1,000,000 times 1,000,000 to realize how the calculator displays the number.) The student answers may vary. Most calculators will use scientific notation to display the number so
that it can fit on the screen. This is accomplished by truncating the zeros at the end of a number and adjusting the location of the decimal. The value of the number is maintained by multiplying by ten to the power of the number of place values the decimal was moved. An example of a calculator display is 1.0260432E10.
Now ask the students to write the number in standard form.
They should respond with 10,260,432,000. Tell students, “Sometimes the number displayed on a calculator is only an approximation of the number. For example, on a calculator multiply 100 99 98 97 96 95 94 93 92 91 90• • • • • • • • • • and record the answer. The correct answer is 5,653,408,585,997,650,000,000. Place this number on the board and then have the students compare this number to the number displayed on their calculator.”
Sample response: The calculator truncated the zeros with five other numbers and rounded the last digit to display 5.653408586E21.
Pre-Reading It will take time for students to become familiar with the words and notations for permutations and factorials. You may need to pause when students encounter these words. Allow them to ask questions. You may want to have different students repeat back to you different scenarios such as after writing 6! on the board ask a student to read it to you and another to explain what it means. Do this until the students are familiar with the terms. Activity 1 This can be a fairly large and involved activity. Make sure you have students respond in class discussions as they work through the lesson. Make sure the students verbalize their understanding of the concepts before moving on to the next activity. The numbers become large and students should have a good working knowledge of how to use the calculator to determine factorials. You will want to have the students experiment with the calculator. Have the students complete Exercises 1 through 3 in pairs and then have them check with their larger group. Have a class discussion and guided practice on the definition of factorial. Have the students work in pairs on Exercises 4 through 8. If they struggle have them work in groups of four.

Probability and Statistics Lesson 2: Permutations and Factorials Page 23
AIIF
Study the value of 1,000! with the students. You might ask the students to try to find patterns in the number. Talk with them about how it would be impossible to actually experiment with all the different line ups. They may need a smaller example such as 50 students. Have the students work in their groups of 4 to complete Exercises 9 through 15. Walk around pick certain groups present their findings.

Page 24
AIIF
SJ Page 8 Activity 1 A permutation is an arrangement of a group of objects in a certain order. For example, there are six permutations for the letters A, B, and C. ABC ACB BAC BCA CAB CBA You have already worked with permutations in the previous lesson and you didn’t’ know it! For example, if there were three different people named Alex, Bonita, and Corrine there would be 6 permutations of how they could be placed in a line. Remember that the number of different ways to line up the three people could be determined by multiplying 3 times 2 times 1. 1. List all the different permutations for the letters A, B, C, and D. ABCD BACD CABD DABC ABDC BADC CADB DACB ACBD BCAD CBAD DBAC ACDB BCDA CBDA DBCA ADBC BDAC CDAB DCAB ADCB BDCA CDBA DCBA a. How many different permutations can occur for four people placed in a line? Show how to
determine this number using mathematics. 4 3 2 1 24• • • = 2. How many different permutations can occur for five people placed in a line? Show how to determine this number using mathematics. 5 4 3 2 1 120• • • • = 3. a. How many people are in your math class today? Answers will vary. b. How many different permutations can your math class be placed in a line? Sample response
based on 30 students is 3230 29 2 1 2.65 10• • • • ≈ × . Students may struggle with this problem. The goal is for them to realize the number is very large. Discuss the feasibility of having the class model each permutation. There is not enough time in a lifetime.
• • =3 2 1 6

Probability and Statistics Lesson 2: Permutations and Factorials Page 25
AIIF
SJ Page 9 It doesn’t take long for the number of permutations to become extremely large for different situations. It also doesn’t take long before you want to find a short hand method to write all the numbers to be multiplied. Mathematicians have decided to use the symbol ! to help. This symbol is called factorial and represents repeated multiplication from the number down to 1. For example, 5! (five-factorial) is the same as 5 4 3 2 1• • • • . For a large number like 20, it is easier to write 20! (twenty-factorial) instead of:
20 19 18 17 16 15 14 13 12 11 10 9 8 7 6 5 4 3 2 1• • • • • • • • • • • • • • • • • • • A general rule for factorial is ( ) ( )! 1 2 3 2 1n n n n= • − • − • • • • . Note: It is also common to write a continued pattern of numbers with a three-dot symbol. For example, 15! can be written as: 15 14 13 3 2 1• • • • • • 4. Write the following factorials using the three-dot symbol. a. 20! 20 19 2 1= • • • • b. 100! 100 99 2 1= • • • • 5. When dealing with situations of the Fundamental Counting Principle for permutations we can use
factorial. For example, there are 3! ways to line up 3 people in a different order. a. Use the factorial symbol to represent the number of ways to line up two people? 2! b. Use the factorial symbol to represent the number of ways to line up one person? 1! c. Use the factorial symbol to represent the number of ways to line up 10 people? 10! Note: Mathematicians define 0 ! 1= . Talk with students about 0! is equal to 1. You can think of it as how many ways can 0 objects get in a line? There is one way, no way. This logic might not always work in different circumstances, but it does with factorials and permutations.

Page 26
AIIF
SJ Page 10 Some calculators have a factorial button. 6. Experiment with your calculator and determine the largest number that you can compute the factorial
value of and still have the value fit on the calculator screen in standard form. Answers will vary. Sample response: The largest number for the author’s calculator is 13 ! 6, 227 , 020 , 800= . For 14! and larger it switches to scientific notation.
7. Experiment with your calculator and determine the largest number that you can compute the factorial
value of and still have the value fit on the calculator screen in scientific notation. Answers will vary. Sample response: The largest number for the author’s calculator is E69 ! 1.711224524 98= or
9869 ! 1.711224524 10= × . For 70! and larger factorials the calculator errors. 8. Use your calculator to determine which statements are true. Note: The order of operations should be
grouping first, then factorial, then multiplication or division, and then addition or subtraction. For example, simplifying the left side and right side of the following equations reveals that they are not equal.
4 ! 4 ! 8 !24 24 40, 320
48 40, 320
+ =+ =
≠
a. ( )2 5 ! 10 != b. ( )3 5 ! 5 ! 5 ! 5 != + + ( )
( )2 5! 10!
2 120 3,628,800240 3,628,800
≠
≠≠
( )( )
3 5 ! 5 ! 5 ! 5 !3 120 120 120 120
360 360
= + +
= + +=
c. ( ) ( )3 ! 4 ! 12 != d. 6 ! 3 !2 !
=
( )( )( )( )3! 4! 12!6 24 479,001,600
144 479,001,600
≠
≠≠
6 ! 3 !2 !
720 62
360 6
≠
≠
≠
e. 6 ! 4 !2 !
= f. 6 ! 6 5 4 32 !
= • • •
6 ! 4 !2 !
720 242
360 24
≠
≠
≠
6 ! 6 5 4 32 !
720 3602
360 360
= • • •
=
=

Probability and Statistics Lesson 2: Permutations and Factorials Page 27
AIIF
SJ Page 11 Factorial numbers get very large very fast for example: 1,000! = 40238726007709377354370243392300398571937486421071463254379991042993851239862902059204420848696940480047998861019719605863166687299480855890132382966994459099742450408707375991882362772718873251977950595099527612087497546249704360141827809464649629105639388743788648733711918104582578364784997701247663288983595573543251318532395846307555740911426241747434934755342864657661166779739666882029120737914385371958824980812686783837455973174613608537953452422158659320192809087829730843139284440328123155861103697680135730421616874760967587134831202547858932076716913244842623613141250878020800026168315102734182797770478463586817016436502415369139828126481021309276124489635992870511496497541990934222156683257208082133318611681155361583654698404670897560290095053761647584772842188967964624494516076535340819890138544248798495995331910172335555660213945039973628075013783761530712776192684903435262520001588853514733161170210396817592151090778801939317811419454525722386554146106289218796022383897147608850627686296714667469756291123408243920816015378088989396451826324367161676217916890977991190375403127462228998800519544441428201218736174599264295658174662830295557029902432415318161721046583203678690611726015878352075151628422554026517048330422614397428693306169089796848259012545832716822645806652676995865268227280707578139185817888965220816434834482599326604336766017699961283186078838615027946595513115655203609398818061213855860030143569452722420634463179746059468257310379008402443243846565724501440282188525247093519062092902313649327349756551395872055965422874977401141334696271542284586237738753823048386568897646192738381490140767310446640259899490222221765904339901886018566526485061799702356193897017860040811889729918311021171229845901641921068884387121855646124960798722908519296819372388642614839657382291123125024186649353143970137428531926649875337218940694281434118520158014123344828015051399694290153483077644569099073152433278288269864602789864321139083506217095002597389863554277196742822248757586765752344220207573630569498825087968928162753848863396909959826280956121450994871701244516461260379029309120889086942028510640182154399457156805941872748998094254742173582401063677404595741785160829230135358081840096996372524230560855903700624271243416909004153690105933983835777939410970027753472000000000000000000000000000000000000000000000000000000000000000000000000000000000000000000000000000000000000000000000000000000000000000000000000000000000000000000000000000000000000000000000000000000000000000000000000000000000000000000000000000000000 This would represent the number of ways that you could line up 1,000 people. Trivia It took many days for several computers to determine the value of 2,000,000!, but this number would be too large to fit on one page. In fact the number would be too large to fit in this book.

Page 28
AIIF
SJ Page 12 An interesting characteristic of factorials is shown below.
10 ! 10 9 8 7 != • • • 9. Explain why the equation above is correct. Sample response: Both sides of the equation mean the same thing.
10 ! 10 9 8 7 6 5 4 3 2 110 9 8 7 ! 10 9 8 7 6 5 4 3 2 1
= • • • • • • • • •• • • = • • • • • • • • •
10. Is this true for any factorial? Look at the following examples and explain. Sample response: Yes. This is
true for any factorial. Since a factorial of a number is the multiplication of that number and all the consecutive smaller numbers down to one. By replacing the remaining consecutive numbers in a list with a factorial number means the same thing.
10 ! 10 9 8 7 6 5 != • • • • •
13 ! 13 12 != •

Probability and Statistics Lesson 2: Permutations and Factorials Page 29
AIIF
SJ Page 13
11. Determine the value of 12 !12 !
12 ! 12 !12 !
=12 !
1=
12. Determine the value of !!
nn
n ! n !n !
=n !
1=
13. Determine the value of 12 !10 !
12 ! 12 11 10 ! 12 11 10 !10 ! 10 !
• • • •= =10 !
12 11 1 1321
• •= =
14. Determine the value of 15 !8 !
15! 15 14 13 12 11 10 9 8!8!
• • • • • • •=8!
32,432,400=
15. Determine the value of ( )!1 !
nn −
( )( )
( )( )n n 1 !n ! n n 1 !
n 1 ! n 1 !−−= =
− − ( )n 1 !−n=
Hint: Experiment with numbers and then make a conjecture.

Page 30
AIIF
Teacher Reference Activity 2 Before starting this activity, you may want to review the number of ways the 4 students filled the 3 positions in the Setting the Stage activity modeled in front of class. Guide the students through this activity. Pause periodically and ask probing questions or have a student come to the overhead to show their work.

Probability and Statistics Lesson 2: Permutations and Factorials Page 31
AIIF
SJ Page 14 Activity 2 Factorials are very useful for different situations. One situation refers back to placing four people out of a class of 30 into 4 positions. We know that the number of permutations should be
30 29 28 27• • •
1. This number could also be 30 !26 !
. Explain or show how this mathematically works. Sample response:
30 !26 !
is the same as 30 29 28 27• • • because 30! can be rewritten with 26! as a factor and then cancel.
30 ! 30 29 28 27 26 !26 !
• • • •=26 !
30 29 28 27= • • •
If we knew we had 30 people to choose from and four positions to fill, we could have written the following statement to determine the number of permutations.
( )30 ! 30 29 28 27
30 4 != • • •
−
2. What statement could we write if we had 30 people and five positions?
( )30 ! 30 29 28 27 26 25 ! 30 29 28 27 26
30 5 ! 25 !• • • • •= = • • • •
−
3. What statement could we write if we had 25 people and six positions?
( )25 ! 25 24 23 22 21 20 19 ! 25 24 23 22 21 20
25 6 ! 19 !• • • • • •= = • • • • •
−
4. What statement could we write if we had n people and r positions? ( )n !
n r !−
5. The notation for the number of permutations of n objects taken r at a time can be abbreviated by n rP .
Combine this notation with the answer for Activity 2 Exercise 4 to create a formula for the number of permutations of n objects taken r at a time.
Number of Permutations Formula The number of permutations of n objects taken r at a time.
nPr = ( )n rn !P
n r !=
−

Page 32
AIIF
SJ Page 15 6. Most scientific and graphing calculators are programmed with the ability to determine the number of
permutations of n objects taken r at time. Experiment with a calculator until you can determine the number of permutations of 5 objects taken 3 at a time.
5 3 60P = Explain how to enter the permutation information into your calculator. Be prepared to share this
information with the class. Note to Teacher: Different calculators will use different notation to enter permutation data. You will
want to experiment with calculators to determine the different methods. Some calculators may use the notation P(n,r) instead of nPr.
7. Determine the following number of permutations. The goal is to have the students use the calculator permutation method to determine the solution. If the calculator does not have that as an option then students will need to use the formula.
a. 4 4P 4 4P 24= b. 4 3P 4 3P 24= c. 4 2P 4 2P 12= d. 4 1P 4 1P 4= e. 4 0P 4 0P 1=
8. Explain why 2 4 0P = Sample response: There is no way to have two objects placed in four different positions at the same time. 9. What is the pattern for 5 1P , 6 1P , 20 1P , and 50 1P ? They all equal the first number before P. 5 1P 5= , 6 1P 6= , 20 1P 20= , and 50 1P 50= 10. What is the pattern for 5 0P , 6 0P , 20 0P , and 50 0P ? They all equal 1. 5 0P 1= , 6 0P 1= , 20 0P 1= , and 50 0P 1=

Probability and Statistics Lesson 2: Permutations and Factorials Page 33
AIIF
Teacher Reference Activity 3 Have pairs of students work on this task. They should be creative in their choice and in their tree diagram. You may need to supply examples for students. A few example topics could be ordering of positions within a company, ranking of place for a contest or race, and placing positions on a team. Practice Exercises Use these extra problems for homework or end of class work.
Page 34
AIIF
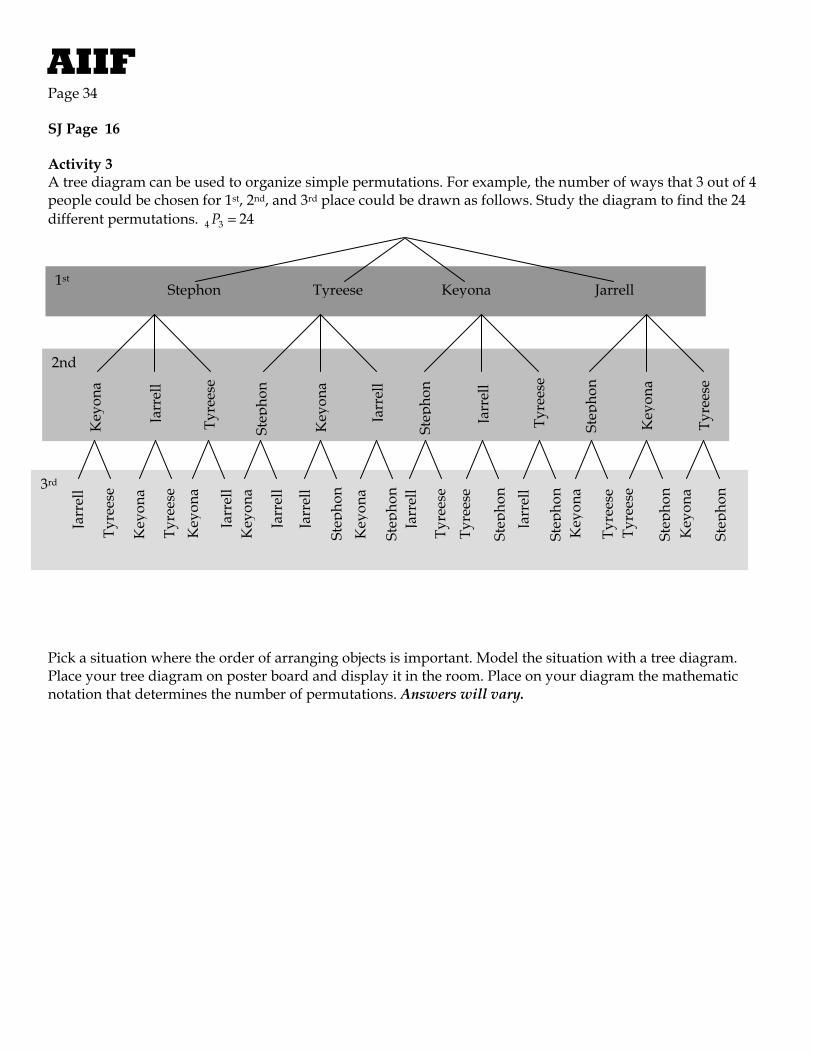
SJ Page 16 Activity 3 A tree diagram can be used to organize simple permutations. For example, the number of ways that 3 out of 4 people could be chosen for 1st, 2nd, and 3rd place could be drawn as follows. Study the diagram to find the 24 different permutations. 4 3 24P = Pick a situation where the order of arranging objects is important. Model the situation with a tree diagram. Place your tree diagram on poster board and display it in the room. Place on your diagram the mathematic notation that determines the number of permutations. Answers will vary.
3rd
2nd
1st Stephon Tyreese Keyona Jarrell
Step
hon
Key
ona
Jarr
ell
Key
ona
Jarr
ell
Tyre
ese
Step
hon
Jarr
ell
Tyre
ese
Step
hon
Key
ona
Tyre
ese
Key
ona
Key
ona
Key
ona
Key
ona
Ke y
ona
Ke y
ona
Jarr
ell
Jarr
ell
Jarr
ell
Jarr
ell
Jarr
ell
Jarr
ell
Tyre
ese
Tyre
ese
Tyre
ese
Tyre
ese
Tyre
ese
Tyre
ese
Ste p
hon
Step
hon
Ste p
hon
Ste p
hon
Step
hon
Step
hon

Probability and Statistics Lesson 2: Permutations and Factorials Page 35
AIIF
SJ Page 17 Practice Exercises 1. How many different ways could three sprinters out of eight place Gold, Sliver, and Bronze in the
Olympic 200 meter dash? Hint: Find 8P3? 8 3P 336= 2. Out of 40 football players, how many ways could you fill the 11 offensive positions? 16
40 11P 9.2 10≈ × 3. For a basket ball team of 12 members, how many ways could the five starting positions be filled? 12 5P 95, 040= 4. Explain the mathematical difference between picking five people out of 26 to fill five positions in a line
and picking five letters out of the alphabet to place in five positions where repetition of letters is allowed. When picking 5 people out of 26 to fill 5 positions, the first position has 26 different people to choose from, but after that position is filled there are only 25 to fill the second position, this continues until all positions are filled. When repetition is allowed there can be 26 for each position.
26 25 24 23 22 7 ,893,600• • • • = 26 26 26 26 26 11,881,376• • • • =

Page 36
AIIF
SJ Page 18 Outcome Sentences I can now use factorial to A permutation The difference between standard form and scientific form is I would rather use form, because
Probability and Statistics Lesson 2: Permutations and Factorials Page 37
AIIF
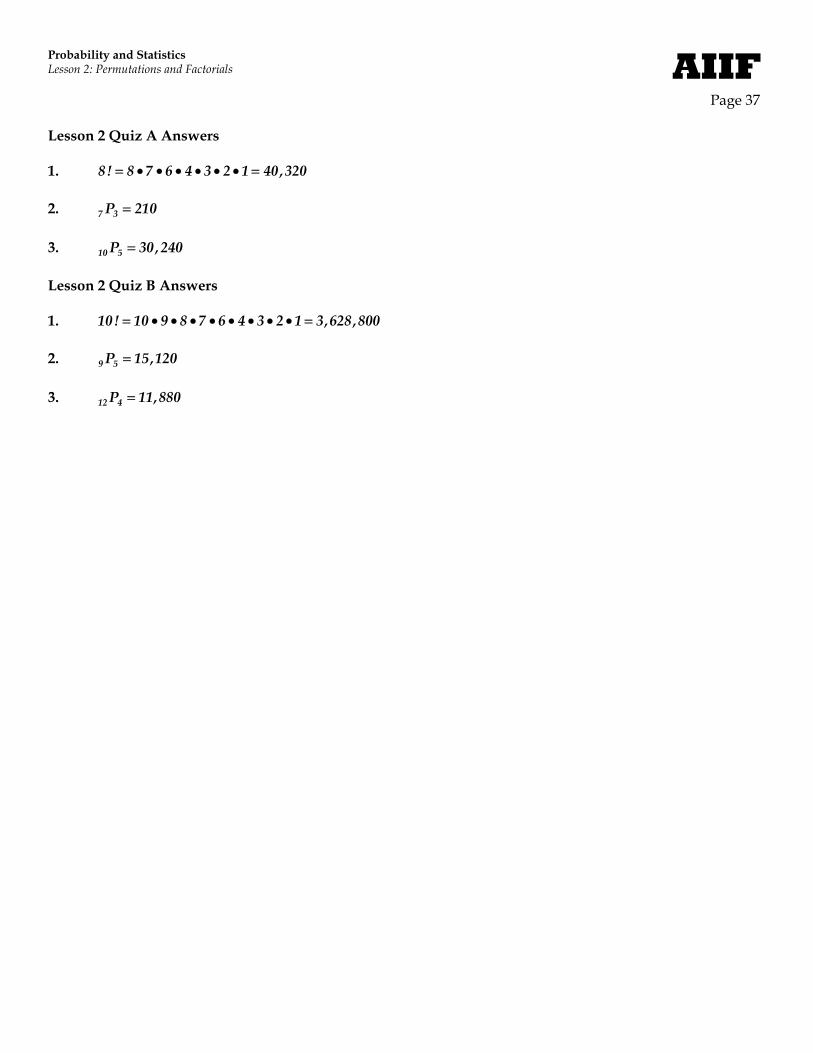
Lesson 2 Quiz A Answers 1. 8! 8 7 6 4 3 2 1 40,320= • • • • • • = 2. 7 3P 210= 3. 10 5P 30,240= Lesson 2 Quiz B Answers 1. 10! 10 9 8 7 6 4 3 2 1 3,628,800= • • • • • • • • = 2. 9 5P 15,120= 3. 12 4P 11,880=

Page 38
AIIF
Lesson 2 Quiz A Name: 1. What is 8! 2. What is 7 3P ? 3. How many different permutations exist for placing 5 out of 10 objects in a row?
Probability and Statistics Lesson 2: Permutations and Factorials Page 39
AIIF
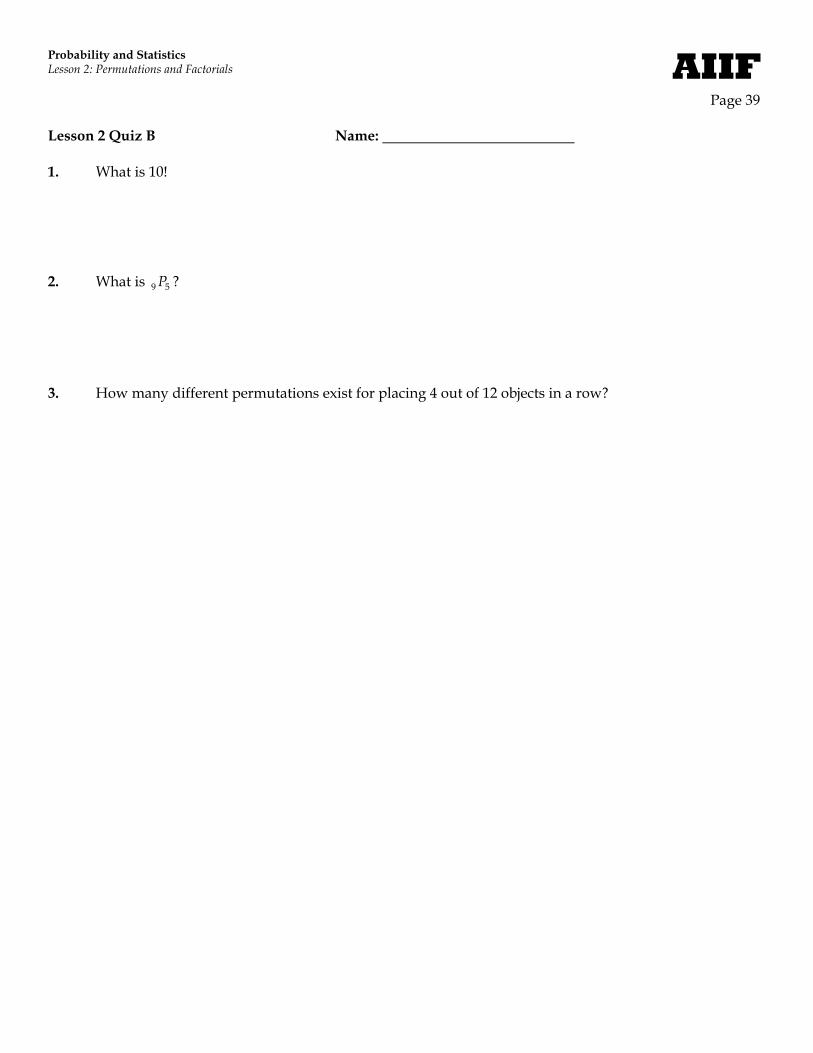
Lesson 2 Quiz B Name: 1. What is 10! 2. What is 9 5P ? 3. How many different permutations exist for placing 4 out of 12 objects in a row?
Page 40
AIIF
Lesson 3: Combinations Objectives • Students will use combinations to determine the total number of outcomes for lottery games. • Students will determine the number of combinations for different situations. Essential Questions • How can combinations be used to determine the number outcomes of in gaming? • How can combinations be used to determine the number of combinations of different situations? Materials • Student Journal • Overhead • Blank transparencies • Overhead markers • Poster paper (Optional) • Deck of cards for each group (Optional) • Calculators Warm Up • Problems of the Day Number of Days At least 1 block schedule Vocabulary Combinations Combination Formula

Probability and Statistics Lesson 3: Combinations Page 41
AIIF
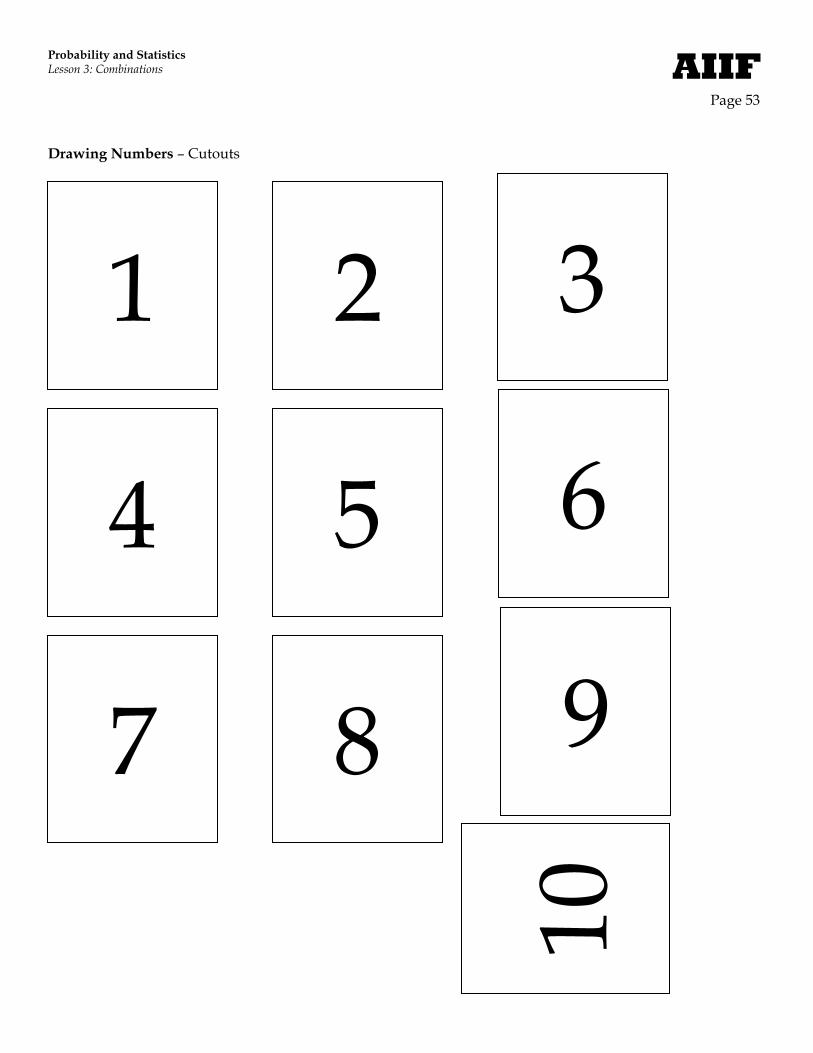
Teacher Reference Setting the Stage Have students bring in old lottery tickets and selection slips. Please confirm with them that they do not have to buy any and that if they never play the games or have old tickets in the house that it is just fine. You may also want to bring in some examples. If you yourself do not play, you could pick a few selection slips but not actual tickets. This will allow the students to see the numbers that can be chosen. Use them as a discussion to lead into this exercise. Make sure they understand that we will be playing simplified versions of lottery games so that they are easier to win. Pre-Reading Place the word “combination” in the center of the board or overhead and asks students to list all the meanings of which they can think relate to the word. After they have exhausted the list tell them there is another meaning and it is similar to the meaning of the word “permutation” that they learned in the previous lesson. They will study lottery tickets in this lesson and because order doesn’t matter with lottery numbers they will learn about combinations. Activity 1 You may want to bring in actual blank lottery playing cards to use to play the game. The disadvantage is there will more than likely not be a winner and you will have to somehow randomly generate numbers between 1 and 53. A simpler game has been prepared for the students. Cut out the 10 numbers at the end of the lesson and place them in a hat or box. These numbers will be randomly drawn to simulate a lottery. In the student journal, nine blank game slips have been prepared. You can try different variations of the game, but you may want to begin with students picking two numbers on their game slips and then drawing two cards out of a hat or box. (Note: You could also pick two cards for a deck of ten playing cards.) Play at least 5 games with the students. Be prepared with some type of reward such as school pencils, candy, homework pass, etc. Discuss with students the chances of winning and the differences that would occur if they picked 2 numbers but only had to match one as opposed to them picking 3 numbers and matching 3 numbers. We will develop probability in another lesson. Relate this matching to permutations. Remember with permutations the order of the numbers mattered but in this game the order doesn’t matter. For example, matching the numbers 2 and 7 is the same as matching the numbers 7 and 2, it didn’t matter what order the numbers were drawn.

Page 42
AIIF
Activity 1 SJ Page 19 We looked in detail at permutations where order mattered when picking people from a group to fill certain positions. But let’s look at another situation where order doesn’t matter. State Lotteries have become a popular way for states to make money. One of the popular lottery games works as follows. Five white balls are drawn out of a drum with 53 white balls and one red ball is drawn out of a drum with 42 red balls. The jackpot is won by matching all five white balls in any order and the red ball. The second prize of $100,000.00 is won by matching five white balls in any order. Play the simplified lottery game as directed by your teacher. Game 1 Game 2 Game 3 Game 4 Game 5 Game 6 Game 7 Game 8 Game 9
Shade two squares
1 2 3 4
5 6 7 8
9 10
Shade two squares
1 2 3 4
5 6 7 8
9 10
Shade two squares
1 2 3 4
5 6 7 8
9 10
Shade two squares
1 2 3 4
5 6 7 8
9 10
Shade two squares
1 2 3 4
5 6 7 8
9 10
Shade two squares
1 2 3 4
5 6 7 8
9 10
Shade two squares
1 2 3 4
5 6 7 8
9 10
Shade two squares
1 2 3 4
5 6 7 8
9 10
Shade two squares
1 2 3 4
5 6 7 8
9 10

Probability and Statistics Lesson 3: Combinations Page 43
AIIF
Teacher Reference Activity 2 Complete Exercise 1 with the class. Have students think out loud as you work the exercise. Have groups of 4 complete Exercise 2. Have the class work together after they have completed Exercise 2d. It may be interesting for students to play a different game to model a lottery at this time. Separate your class into groups of 5. One member of the group will be the dealer. You need two decks of cards for each group. Have the dealer separate the suites into piles. Pass out one pile to each member of the group, the dealer also gets a pile. Each person at the table gets one complete set of a suite. There should be three extra sets. Have the students set the face cards aside so that they only have the numbers one through ten. Let aces represent one. To play the game each person picks three numbers and lays them down, then the dealer randomly picks three numbers. If a person matches all three, they are the winner. Have the students try this for many rounds. Ask the students how easy it was to win. Have the students try an easier game. Use the numbers between 1 and 5 and play the same game. Ask the students if there were more winners? See if they could determine their chance of winning? The number of ways that they could match for the first game is one out of 120.
( ) =−10 ! 120
10 3 ! 3 !
and for the second game is one out of 10.
( )5 ! 10
5 3 ! 3 !=
−

Page 44
AIIF
SJ Page 20 Activity 2 How many ways are there to match winning numbers on a lottery card? Let’s investigate this by starting simpler. Begin by studying a lottery that only has four different numbers to choose. 1. Shade two of the squares above. Hopefully, these are your winning numbers. a. List of all ways that two numbers out of four could be picked. Remember order does not matter.
In other words drawing a 1 and then a 2 is the same as drawing a 2 and then a 1. It may help if students cut out little squares with the four numbers or use cards from a deck.
1,2 1,3 1,4 2,3 2,4 3,4 b. How many ways are possible? Six c. What are your chances of winning? Explain your answer. One out of six. There is one
combination that I picked out of six different combinations. d. Out of your class how many students do you think will win, if your teacher randomly draws
two numbers out of four? Answers will vary for different size classes. For a class of 30 students, there should be about five winners because 1 out of 6 is proportional to 5 out of 30. After students have guessed, draw two numbers to see how many students win. As a class, discuss if what actually happened matches what we determined may happen mathematically.
2. Shade three of the squares below. Hopefully, these are your winning numbers. a. List of all ways that three numbers out of four could be picked. Remember order does not
matter. 1,2,3 1,2,4 1,3,4 2,3,4 b. How many ways are possible? Four c. What are your chances of winning? Explain your answer. One out of four. There is one
combination that I picked out of four different combinations. d. Out of your class how many students do you think will win, if your teacher randomly draws
three numbers out of four? Answers will vary for different size classes. For a class of 32 students, there should be about 8 winners because 1 out of 4 is proportional to 8 out of 32. After students have guessed, draw three numbers to see how many students win. As a class discuss if what actually happened matches what we determined may happen mathematically.
Lottery Best Out of Four
1 2 3 4
Lottery Best Out of Four
1 2 3 4

Probability and Statistics Lesson 3: Combinations Page 45
AIIF
SJ Page 21 When order does not matter, a selection of r objects taken from a group of n objects is called a combination. 3. Explain how a state lottery represents a combination and not a permutation. You studied permutations
in the second lesson of this unit. Sample response: With state lotteries and combinations the order of objects chosen does not matter. In a lottery it doesn’t matter if 1 was chosen first and 4 chosen second. It would be the same if 4 was chosen first and 1 second.
By definition the number of combinations of n objects taken r at a time can be abbreviated by n rC and
calculated by ( )−!
! !n
n r r. These two statement are usually combined together to create the formula.
( )!
! !n rnC
n r r=
−
This formula can be used to determine the number of combinations for different situations. For example, in a lottery game of picking 3 numbers out of 7 the total number of combinations is:
( )7 37 !
7 3 ! 3 !7 6 5 4 3 2 14 3 2 1 3 2 135
C =−
• • • • • •=• • • • • •
=
4. Use this formula to determine the number of combinations for the following.
a. Choosing two numbers out of three. ( )3 23 !C
3 2 ! 2 !3 2 11 2 13
=−
• •=• •
=
b. Choosing two numbers out of four. ( )4 24 !C
4 2 ! 2 !4 3 2 12 1 2 16
=−
• • •=• • •
=
c. Choosing three numbers out of four. ( )4 34 !C
4 3 ! 3 !4 3 2 11 3 2 14
=−
• • •=• • •
=

Page 46
AIIF
SJ Page 22 5. In a certain lottery, five numbers are randomly chosen out of 53. How many combinations are
possible? ( )53 553!C
53 5 !5!53 52 51 50 49 48!
48! 5 4 3 2 12,869 ,685
=−
• • • • •=• • • • •
=
6. If five numbers out of 100 were randomly chosen, how many combinations would be possible?
( )100 5100 !C
100 5 !5!100 99 98 97 96 95!
95! 5 4 3 2 175,287 ,520
=−
• • • • •=• • • • •
=
7. How many different hands of five could you have out of a 52-card deck?
( )52 552!C
52 5 !5!52 51 50 49 48 47 !
47 ! 5 4 3 2 12,598,960
=−
• • • • •=• • • • •
=
8. How many different committees of five could you create from your math class? Answers will vary. For a class with 30 students:
( )30 530 !C
30 5 !5!30 29 28 27 26 25!
25! 5 4 3 2 1142,506
=−
• • • • •=• • • • •
=

Probability and Statistics Lesson 3: Combinations Page 47
AIIF
Teacher Reference Activity 3 Different calculators will use different notation to enter combination data. You will want to experiment with calculators to determine the different methods. Some calculators may use the notation C(n,r) instead of n rC .

Page 48
AIIF
SJ Page 23 Activity 3 Many calculators have been programmed to calculate the number of combinations. Explore the buttons or functions of your calculator to determine the method used to determine combinations. Have all the students complete this activity individually, but allow them to ask their group members for help. Have individuals share how their calculator works. You may want to have students with similar calculators sit next to each other. 1. Explain how to enter the combination information into your calculator. For
example, explain how to determine the number of combinations of 8 objects taken 4 at a time on your calculator. Be prepared to share this information with the class. Answers will vary. Generally you enter the n first then find the n rC function or button then enter the r. Other calculators may have you enter the n rC function or button followed by n and then r.
2. Determine the following using the combination feature of your calculator. a. 4 4C 4 4C 1= b. 4 3C 4 3C 4=
c. 4 2C 4 2C 6= d. 4 1C 4 1C 4= e. 4 0C 4 0C 1=
3. Explain why 2 4C does not work? Sample response: It is not possible to place four objects in a group
from only two objects. 4. What is the pattern for 5 1C , 6 1C , 20 1C , and 50 1C ? They all equal the first number before C. 5 1C 5= , 6 1C 6= , 20 1C 20= , 50 1C 50= 5. What is the pattern for 5 0C , 6 0C , 20 0C , and 50 0C ? They all equal 1. 5 0C 1= , 6 0C 1= , 20 0C 1= , 50 0C 1=

Probability and Statistics Lesson 3: Combinations Page 49
AIIF
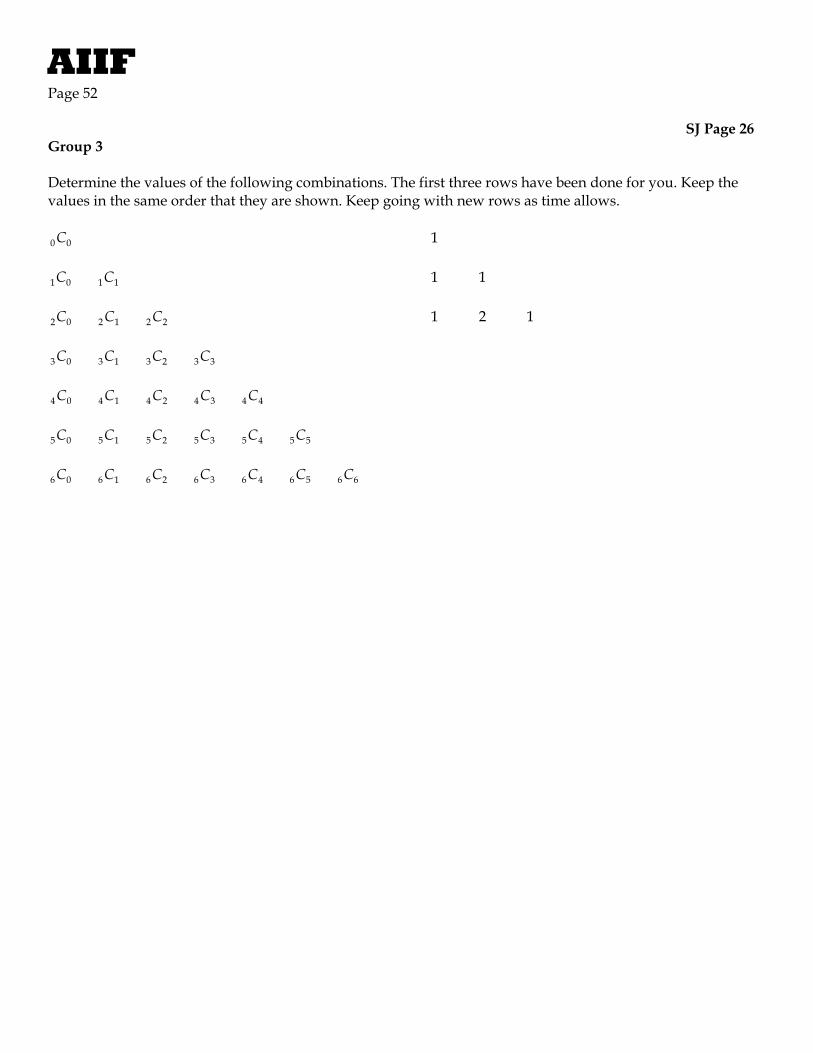
Teacher Reference Activity 4 Assign the three different group activities to different groups. For example, if you have 8 groups of 4 students, then assign two groups the Group 1 activity, three groups the Group 2 activity, and three groups the Group 3 activity. Each group needs to make a display of their results that they can share in front of class. They could use the overhead, poster paper, or the board to share their results. During and after groups have shared make sure to discuss that with three different methods we found the same pattern. Each group should discover the pattern. Below is an example of the pattern. It continues indefinitely.
1 1 1
1 2 1 1 3 3 1
1 4 6 4 1 1 5 10 10 5 1
1 6 15 20 15 6 1 1 7 21 35 35 21 7 1
1 8 28 56 70 56 28 8 1

Page 50
AIIF
SJ Page 24 Activity 4 Group 1 Continue the pattern of numbers in the pyramid until it is complete. The pattern of numbers is called Pascal’s Triangle.
1
1
1
1
1
1
1
1
1
2
33
4 6 4

Probability and Statistics Lesson 3: Combinations Page 51
AIIF
SJ Page 25 Group 2 Determine the expanded version of each expression. The first two have been completed for you. Make sure to write the coefficient in front of each term. Be prepared to show other students how you calculated the expanded versions. If you see a pattern, use the pattern to expand the expressions. ( )+ =0 1a b ( )+ = +1 1 1a b a b ( )2a b+ ( )3a b+ ( )4a b+ ( )5a b+ Now, write only the coefficients in a pyramid. The first three have been completed for you.
1
1 1
1 2 1
Page 52
AIIF
SJ Page 26 Group 3 Determine the values of the following combinations. The first three rows have been done for you. Keep the values in the same order that they are shown. Keep going with new rows as time allows. 0 0C 1 1 0C 1 1C 1 1 2 0C 2 1C 2 2C 1 2 1 3 0C 3 1C 3 2C 3 3C 4 0C 4 1C 4 2C 4 3C 4 4C 5 0C 5 1C 5 2C 5 3C 5 4C 5 5C 6 0C 6 1C 6 2C 6 3C 6 4C 6 5C 6 6C
Probability and Statistics Lesson 3: Combinations Page 53
AIIF
Drawing Numbers – Cutouts
1
4
7
2
5
8
3
6
9 10
Page 54
AIIF
SJ Page 27 Practice Exercises 1. How many different committee possibilities could there be by choosing 3 people out of 8 to serve on
the committee? Hint: Find 8C3? 8 3C 56= 2. Out of 52 playing cards, how many different five card hands could you have? 52 5C 2,598,960= 3. Your mom told you to pick out three different boxes of cereal from the cereal isle in the grocery store.
There where 45 different types of cereal. How many different combinations of 3 boxes could you chose? 45 3C 14,190=
Challenge Explain the difference between picking five people out of 26 to make a committee of five and picking 5 letters out of the alphabet where repetition of letters is allowed but order doesn’t matter. Sample response: In both situations the order of picking the objects doesn’t matter, but a committee cannot of have repetition of members.

Probability and Statistics Lesson 3: Combinations Page 55
AIIF
SJ Page 28 Outcome Sentences I would never play the lottery because In probability, combinations mean I was surprised that I now understand

Page 56
AIIF
Lesson 3 Quiz A Answers 1. 7 3C 35= 2. 52 4C 270,725= 3. 10 3C 120= Lesson 3 Quiz B Answers 1. 9 5C 126= 2. 52 7C 133,784,560= 3. 12 4C 495=

Probability and Statistics Lesson 3: Combinations Page 57
AIIF
Lesson 3 Quiz A Name: 1. What is 7 3C ? 2. How many different four-card hands could you be dealt out of 52 cards? 3. You wanted to buy 10 different video games, but you only had enough money for three games. How
many different video game combinations could you choose?

Page 58
AIIF
Lesson 3 Quiz B Name: 1. What is 9 5C ? 2. How many different seven-card hands could you be dealt out of 52 cards? 3. You wanted to buy 12 different music CDs, but you only had enough money for four CDs. How many
different CDs combinations could you choose?

Probability and Statistics Lesson 4: Probability Page 59
AIIF
Lesson 4: Probability Objectives • Students will determine the probability of independent and dependent events. • Students will determine theoretical and experimental probability. Essential Questions • What is the difference between theoretical probability and experimental probability? • How can the Fundamental Counting Principle, permutations, and combinations be used to determine
probability? Materials • Overhead • Blank Transparencies • Overhead Markers • Poster Paper (Optional) • Deck of Cards for each group • Calculator Warm Up • Problems of the Day Number of Days At least 1 block schedule Vocabulary Theoretical Probability Experimental Probability Independent Event Dependent Event With replacement Without replacement Event Outcome Favorable Event Intersection
Page 60
AIIF
Teacher Reference Setting the Stage Write or read the statement below to the students.
Monique thought that she should have no problem winning the lottery. She only had to pick five numbers out of 45 to win. She said to herself, “five out of 45 is the same as one out nine. I should only have to play the game about nine times to win.”
Have the students offer reasons that Monique is incorrect. Hopefully, someone brings up the fact that there are approximately 1,221,759 different combinations of numbers. So in theory there is one chance out of 1,221,759 that Monique might win. This is much different than one chance out of nine. Pre-Reading There are many terms that may be unfamiliar to students: theoretical probability, experimental probability, probability, event, outcome, favorable event, dealer, dealt, shuffle, dice, maze, intersection, dependent, and independent. Plan on creating a word wall that displays this words and as students are introduced to the terms you, with the students help, can put an example, that all can see, next to the word on the wall. Activity 1 Have the students sit in pairs. Each set of pairs should have a set of cards numbered 1 to 5. One person is the dealer and the other person is the player. Ask, “If the player picks a number from 1 to 5 and then if the dealer deals one card, what is the probability of the player getting the number he or she picked?” Have a discussion about the 5 possibilities noting that only one of the possibilities is the favored outcome. Thus the probability is 1 out of 5 or 1/5. Talk with the students about the definitions and that students will often see just the word probability instead of theoretical probability. We will assume the probability and theoretical probability mean the same thing, but we will not shorthand experimental probability.
Probability and Statistics Lesson 4: Probability Page 61
AIIF
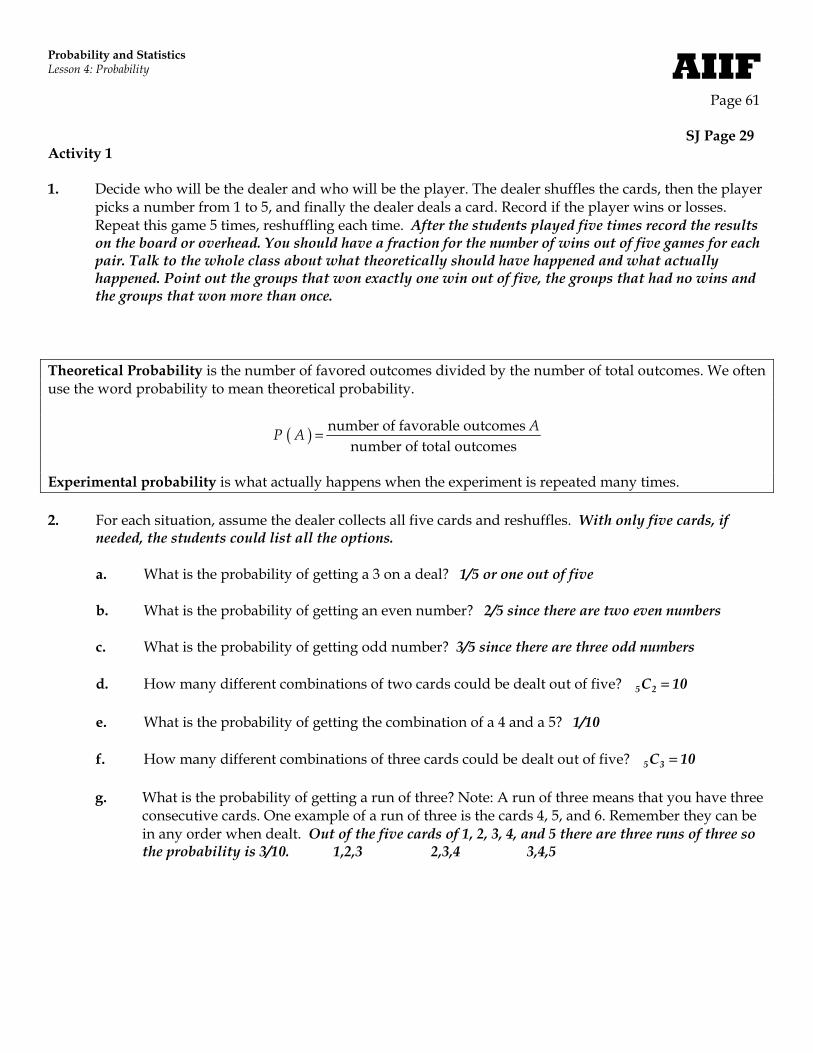
SJ Page 29 Activity 1 1. Decide who will be the dealer and who will be the player. The dealer shuffles the cards, then the player
picks a number from 1 to 5, and finally the dealer deals a card. Record if the player wins or losses. Repeat this game 5 times, reshuffling each time. After the students played five times record the results on the board or overhead. You should have a fraction for the number of wins out of five games for each pair. Talk to the whole class about what theoretically should have happened and what actually happened. Point out the groups that won exactly one win out of five, the groups that had no wins and the groups that won more than once.
Theoretical Probability is the number of favored outcomes divided by the number of total outcomes. We often use the word probability to mean theoretical probability.
( ) = number of favorable outcomes number of total outcomes
AP A
Experimental probability is what actually happens when the experiment is repeated many times. 2. For each situation, assume the dealer collects all five cards and reshuffles. With only five cards, if needed, the students could list all the options. a. What is the probability of getting a 3 on a deal? 1/5 or one out of five b. What is the probability of getting an even number? 2/5 since there are two even numbers c. What is the probability of getting odd number? 3/5 since there are three odd numbers d. How many different combinations of two cards could be dealt out of five? 5 2C 10= e. What is the probability of getting the combination of a 4 and a 5? 1/10 f. How many different combinations of three cards could be dealt out of five? 5 3C 10= g. What is the probability of getting a run of three? Note: A run of three means that you have three
consecutive cards. One example of a run of three is the cards 4, 5, and 6. Remember they can be in any order when dealt. Out of the five cards of 1, 2, 3, 4, and 5 there are three runs of three so the probability is 3/10. 1,2,3 2,3,4 3,4,5

Page 62
AIIF
Teacher Reference Activity 2 Have the students sit in pairs. Each set of pairs should have a set of cards numbered 1 to 4. One person is the dealer and the other person is the player.

Probability and Statistics Lesson 4: Probability Page 63
AIIF
SJ Page 30 Activity 2 Sometimes the probability of one card is affected by another card. 1. Each pair should have 4 cards. Pick one to be the dealer and
one to be the player. The goal for the player is to get even cards.
a. What is the probability of the player getting an even
card on the first deal? Have the dealer deal one card and record if the number is even. Give the card back to the dealer. The probability is 2 out of 4 or 1/2.
b. What is the probability of the player getting an even card on the second deal?
Have the dealer deal one card and record if the number is even or odd. The probability is 2 out of 4 or 1/2.
c. Was the outcome of the second card affected by the first card? No. The first card did not affect
the second card. 2. Each pair should have 4 cards. Pick one to be the dealer and one to be the player. The goal for the
player is to get even cards. a. What is the probability of the player getting an even card on the first deal?
Have the dealer deal one card and record if the number is even. Keep the card and do not give the card back to the dealer. The probability is 2 out of 4 or 1/2.
b. What is the probability of the player getting an even card on the second deal?
Have the dealer deal one card and record if the number is even or odd. It depends on what was played during the first card. If the first card was even, then there is one even left out of three thus the probability is 1/3. If the first card was odd, then there are two evens left out of three thus the probability is 2/3.
c. Explain how the probability of the second card depends on the first card. Yes. See answer for
Exercise 2b.
Page 64
AIIF
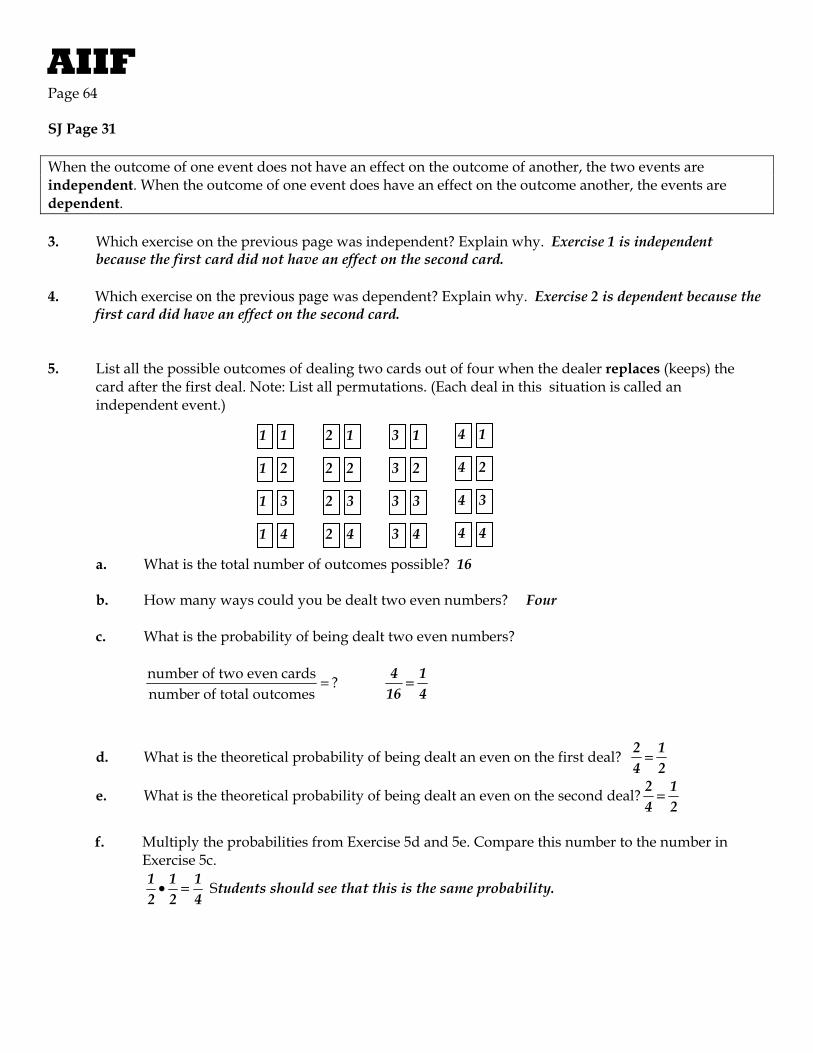
SJ Page 31 When the outcome of one event does not have an effect on the outcome of another, the two events are independent. When the outcome of one event does have an effect on the outcome another, the events are dependent. 3. Which exercise on the previous page was independent? Explain why. Exercise 1 is independent because the first card did not have an effect on the second card. 4. Which exercise on the previous page was dependent? Explain why. Exercise 2 is dependent because the
first card did have an effect on the second card. 5. List all the possible outcomes of dealing two cards out of four when the dealer replaces (keeps) the card after the first deal. Note: List all permutations. (Each deal in this situation is called an independent event.) a. What is the total number of outcomes possible? 16 b. How many ways could you be dealt two even numbers? Four c. What is the probability of being dealt two even numbers?
=number of two even cards ?number of total outcomes
4 116 4
=
d. What is the theoretical probability of being dealt an even on the first deal? 2 14 2
=
e. What is the theoretical probability of being dealt an even on the second deal? 2 14 2
=
f. Multiply the probabilities from Exercise 5d and 5e. Compare this number to the number in
Exercise 5c.
1 1 12 2 4
• = Students should see that this is the same probability.
1 1 2 1 3 1 4 1
1 2 2 2 3 2 4 2
1 3 2 3 3 3 4 3
1 4 2 4 3 4 4 4

Probability and Statistics Lesson 4: Probability Page 65
AIIF
SJ Page 32 6. List all the possible outcomes of dealing two cards out of four when the player keeps the card after the
first deal. Note: List all permutations. The second deal in this situation depends on the first deal, therefore it is dependent event.
a. What is the total number of outcomes possible? 12 b. How many ways could you have been dealt two even numbers? Two c. What is the probability of being dealt two even numbers?
=number of two even cards ?number of total outcomes
2 112 6
=
d. What is the theoretical probability of being dealt an even on the first deal? 2 14 2
=
e. Assume the first card was even, what is the theoretical probability of being dealt an even on the
second deal? 13
f. Multiply the probabilities from Exercise 6d and 6e. Compare this number to the number in
Exercise 6c. 1 1 12 3 6
• = Students should see that this is the same probability.
1 2 2 1 3 1 4 1
1 3 2 3 3 2 4 2
1 4 2 4 3 4 4 3

Page 66
AIIF
SJ Page 33 There will generally be a difference in probability between independent and dependent events. For example,
the probability of drawing a 2 and then a 3 out of four cards numbered 1 through 4 is 116
if the card is
replaced. INDEPENDENT
And 112
if the card is not replaced.
DEPENDENT Note: The diagrams above show all the permutations because order mattered. 7. What would be different in the examples above if the order didn’t matter? Draw a diagram to match
your explanation. If order didn’t matter then for the independent situation there would be two out of sixteen (1/8) and for the dependent situation there would two out of twelve. (1/6)
8. When playing cards, the player generally does not give the dealer back the cards until the hand is over;
therefore, most card games are dependent events. For the following, assume the dealer has only four cards numbered one through four. Also assume that the order doesn’t matter. Draw a picture if needed.
a. What is the probability of having at least one 4 when dealt two cards? 6/12 or 1/2 b. What is the probability of having at least one even number when dealt two cards? 10/12 or 5/6
1 1 2 1 3 1 4 1
1 2 2 2 3 2 4 2
1 3 2 3 3 3 4 3
1 4 2 4 3 4 4 4
1 2 2 1 3 1 4 1
1 3 2 3 3 2 4 2
1 4 2 4 3 4 4 3
1 2 2 1 3 1 4 1
1 3 2 3 3 2 4 2
1 4 2 4 3 4 4 3
1 2 2 1 3 1 4 1
1 3 2 3 3 2 4 2
1 4 2 4 3 4 4 3
1 1 2 1 3 1 4 1
1 2 2 2 3 2 4 2
1 3 2 3 3 3 4 3
1 4 2 4 3 4 4 4
1 2 2 1 3 1 4 1
1 3 2 3 3 2 4 2
1 4 2 4 3 4 4 3

Probability and Statistics Lesson 4: Probability Page 67
AIIF
SJ Page 34 Activity 3 What is the probability that you will find your way to the exit of the maze if you always follow these rules?
Rule 1: When you come to choice in the road, always take the left choice.
Rule 2: When you come to a dead end turn around. Note: The same affect will occur if you thought of this as a large maze to walk through and
you always kept your left hand in contact with the wall. Probability: The probability is 100%. A common way to get out of a maze is to always take a left hand turn at every choice. Draw your own maze on the lightly shaded grid. Do the rules work for your maze? Answers will vary.
Start
Exit

Page 68
AIIF
Teacher Reference Activity 4 You may need to help the students get started. One method to solve this is to label each intersection choice along the correct path and then state the outcome at that choice. See below. Extensions Give each group of students a coin or die and ask them to prove as best as they can if the coin or die is fair. Give them a few guidelines such as; they should define what they mean by fair specifically for that particular coin or die. They may also want to explain what it means for the coin to be unfair. They need to determine how they are going to prove the fairness of the object. Most students will run many experiments to determine if the experimental probability is the same as the theoretical probability. Some students may try to figure out if the coin or die is evenly (symmetrically) balanced. Use a rubric to assess this project. Make sure to pass out the rubric first so the students know the objectives to meet.
A
BC
Start
End

Probability and Statistics Lesson 4: Probability Page 69
AIIF
SJ Page 35 Activity 4 Another way to go through a maze is by randomly making a choice at each intersection. What is the probability that a person would make all the correct choices at each intersection to complete the maze on their first try? Assume the person is walking in this maze and cannot see the end or which paths lead to a dead end. Be prepared to explain how you determined the probability. Sample response: At choice A the theoretical outcome is half the people would chose to go straight and half would turn right. At choice B half of the remaining people may turn right and the other half may go straight. At choice C half of the remaining people may turn left and half may turn right. Thus, half of a half of a half is an eighth, therefore the probability is 1/8 that a person would make it through the first time with no mistakes. You can also think about each choice as ½ and multiply the three choices. Notice at choice A the people that turned right would eventually have to turn around.
Start
End

Page 70
AIIF
SJ Page 36 Practice Exercises 1. Cantrell thought that the probability of rolling a five with a die had a probability of 5 out of 6 while
rolling a three with die had a probability of 3 out of 6. Explain her misconception and write a short description of the correct way to determine the probability of rolling a five. Sample response: Cantrell thought the number on the die is the same as the number of times that number would occur out of 6 roles. Because there is only 1 five on a die, rolling a five would have the same probability as rolling 1 one or the probability of rolling 1 six.
2. In a game that Crystal was playing she had to role two dice. What is the probability that the numbers
facing up on the two dice would add to 9? Draw a diagram. The diagram below shows all the possible outcomes. The circled outcomes represent a sum of 9. There are 4 out of 36 possibilities which is the same result as 1 out of 9.
1, 1 2, 1 3, 1 4, 1 5, 1 6, 1 1, 2 2, 2 3, 2 4, 2 5, 2 6, 2 1, 3 2, 3 3, 3 4, 3 5, 3 6, 3 1, 4 2, 4 3, 4 4, 4 5, 4 6, 4 1, 5 2, 5 3, 5 4, 5 5, 5 6, 5 1, 6 2, 6 3, 6 4, 6 5, 6 6, 6
3. Because the probability of rolling a two with one die is 16
, Markov thought that with rolling one die six
times he would be guaranteed of getting at least 1 two, so he bet all of his money and lost. Explain Markov’s mistake. Sample response: The probability of rolling a two on each separate role is 1 out of 6. Theoretically this means that out of 6 roles a two should show up once but there is no guarantee. It may take twenty roles to see a two. You could also see many twos in only six roles.
4. In a game using two dice, Kantrell rolled a matching pair, which allowed him to roll again before
passing the dice to the player to his left. About how often should Kantrell expect to roll a matching pair? Explain your answer. Out of the 36 ways that two dice could roll there are six ways to roll a matching pair. The diagram on the next page shows all 36 outcomes with the six matching pairs circled.

Probability and Statistics Lesson 4: Probability Page 71
AIIF
1, 1 2, 1 3, 1 4, 1 5, 1 6, 1 1, 2 2, 2 3, 2 4, 2 5, 2 6, 2 1, 3 2, 3 3, 3 4, 3 5, 3 6, 3 1, 4 2, 4 3, 4 4, 4 5, 4 6, 4 1, 5 2, 5 3, 5 4, 5 5, 5 6, 5 1, 6 2, 6 3, 6 4, 6 5, 6 6, 6

Page 72
AIIF
SJ Page 37 Outcome Sentences The difference between experimental probability and theoretical probability is The similarity of experimental probability and theoretical probability is I didn’t realize that I am beginning to wonder why independent events I learned

Probability and Statistics Lesson 4: Probability Page 73
AIIF
Lesson 4 Quiz A Answers
1. Since there are 2 numbers that are divisible by 3 the probability is 2 1 33%6 3
= ≈ .
2. The list of possible cards is shown below with the pairs that sum to six circled. There are 5 out of 25
possibilities therefore the probability is 5 20%25
= .
1, 1 2, 1 3, 1 4, 1 5, 1 1, 2 2, 2 3, 2 4, 2 5, 2 1, 3 2, 3 3, 3 4, 3 5, 3 1, 4 2, 4 3, 4 4, 4 5, 4 1, 5 2, 5 3, 5 4, 5 5, 5 3. Answers will vary. Sample response: If there are 28 people in the room and 15 were female then the
probability would be 15 54%28
≈
Lesson 4 Quiz B Answers
1. Since there is only one number on a die that is divisible by 4, the probability is 1 17%6
≈ .
2. The list of possible cards is shown below with the pairs that sum to five circled. There are 4 out of 16
possibilities therefore the probability is 4 25%16
= .
1, 1 2, 1 3, 1 4, 1 1, 2 2, 2 3, 2 4, 2 1, 3 2, 3 3, 3 4, 3 1, 4 2, 4 3, 4 4, 4 3. Answers will vary. Sample response: If there are 28 people in the room and 13 were male then the
probability would be 13 46%28
≈

Page 74
AIIF
Lesson 4 Quiz A Name: 1. What is the probability of rolling a number that is divisible by 3 with a regular six-sided die? 2. Five cards numbered one through five were placed face down on a table. What is the probability that if
you choose two cards that the sum of the cards would be six? Hint: Draw a diagram that represents all of the possibilities.
3. What is the probability that if 1 person from this room where randomly chosen that the person would
be female?

Probability and Statistics Lesson 4: Probability Page 75
AIIF
Lesson 4 Quiz B Name: 1. What is the probability of rolling a number that is divisible by 4 with a regular six-sided die? 2. Four cards numbered one through four were placed face down on a table. What is the probability that
if you choose two cards that the sum of the cards would be five? Hint: Draw a diagram that represents all of the possibilities.
3. What is the probability that if 1 person from this room where randomly chosen that the person would
be male?

Page 76
AIIF
Lesson 5: Expected Winnings Objectives • Student will determine the expected winnings of different situations. Essential Question • How can probability be used to determine the expected winnings in various situations? Materials • Overhead • Blank Transparencies • Overhead Markers • Poster Paper (Optional) • Deck of Cards for each group • Calculator Warm Up • Problems of the Day Number of Days At least 1 block schedule Vocabulary Expected Winning
Probability and Statistics Lesson 5: Expected Winnings Page 77
AIIF
Teacher Reference Setting the Stage Would a Casino make a game that had a theoretical chance of winning 50% of the time? Discuss this with the students. Perhaps have half the class represent the players’ point of view and the other half represent the Casino owner’s point of view. Pre-Reading You may need to add the words Expected Winnings and Casino to your word wall. Activity 1 Have the students sit in pairs. Each set of pairs should have a set of cards numbered 1 to 10. One person is the dealer and the other person is the player. Randomly assign one of the four different games to the pairs. Have the pairs play their game at least ten times keeping track of the money. The partners could switch roles when they want. The dealers need to replace the card and shuffle before dealing each new card. After all the pairs have had a chance to record their findings, have a class discussion to determine which games tend to favor the dealer and which games tend to favor the player.
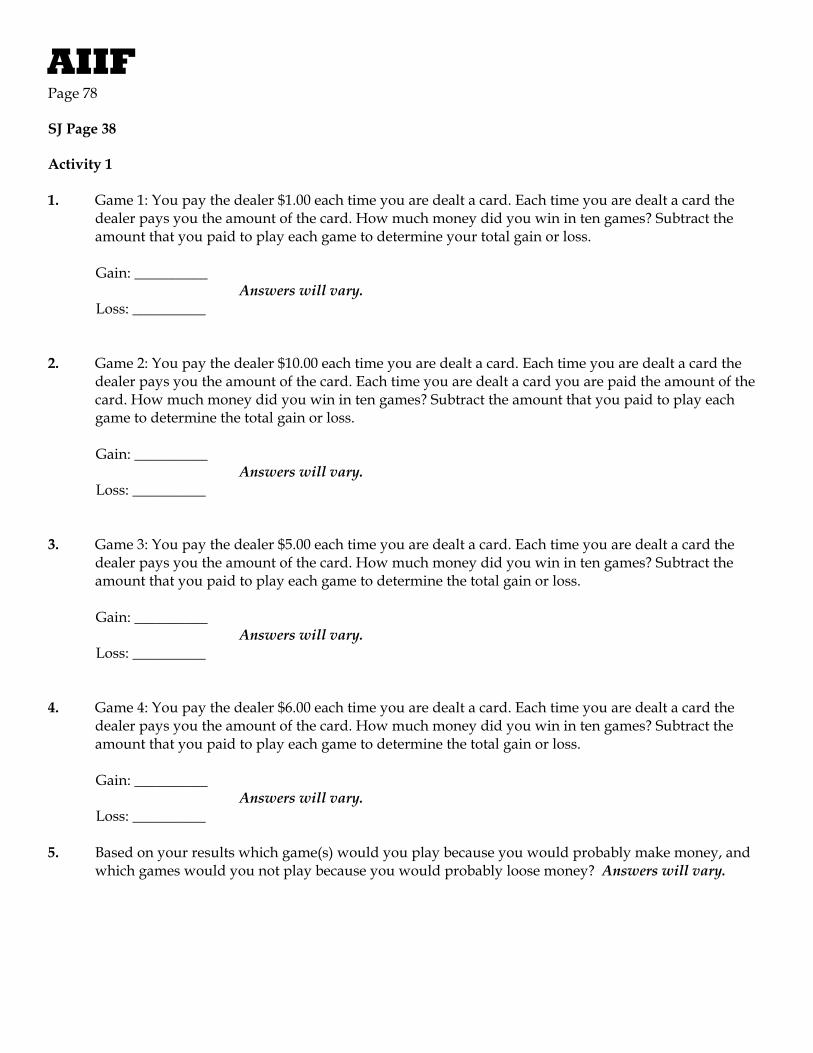
Page 78
AIIF
SJ Page 38 Activity 1 1. Game 1: You pay the dealer $1.00 each time you are dealt a card. Each time you are dealt a card the
dealer pays you the amount of the card. How much money did you win in ten games? Subtract the amount that you paid to play each game to determine your total gain or loss.
Gain: __________ Answers will vary. Loss: __________ 2. Game 2: You pay the dealer $10.00 each time you are dealt a card. Each time you are dealt a card the
dealer pays you the amount of the card. Each time you are dealt a card you are paid the amount of the card. How much money did you win in ten games? Subtract the amount that you paid to play each game to determine the total gain or loss.
Gain: __________ Answers will vary. Loss: __________ 3. Game 3: You pay the dealer $5.00 each time you are dealt a card. Each time you are dealt a card the
dealer pays you the amount of the card. How much money did you win in ten games? Subtract the amount that you paid to play each game to determine the total gain or loss.
Gain: __________ Answers will vary. Loss: __________ 4. Game 4: You pay the dealer $6.00 each time you are dealt a card. Each time you are dealt a card the
dealer pays you the amount of the card. How much money did you win in ten games? Subtract the amount that you paid to play each game to determine the total gain or loss.
Gain: __________ Answers will vary. Loss: __________ 5. Based on your results which game(s) would you play because you would probably make money, and
which games would you not play because you would probably loose money? Answers will vary.

Probability and Statistics Lesson 5: Expected Winnings Page 79
AIIF
SJ Page 39 Activity 2 One way to classify the payout of a game is to determine the expected winnings. The expected winnings give an estimate of how much money you would make on average for each play if you played the game over and over. To determine the expected winnings, sum the products of the individual probabilities of each event and their individual winnings and then subtract the amount paid to play the game. For example, if you were paid the amount on the face of a dice for each roll and you paid a dollar to roll the dice, then the expected winnings would be calculated as follows.
( ) ( ) ( ) ( ) ( ) ( )1 1 1 1 1 1$1.00 $2.00 $3.00 $4.00 $5.00 $6.00 1 $2.506 6 6 6 6 6
+ + + + + − =
You would expect to win on average $2.50 each time you played the game. 1. Determine the expected winnings for each game in Activity 1 exercises 1, 2, 3, and 4. Game 1: You would expect to win $4.50 on average.
( ) ( ) ( ) ( ) ( ) ( ) ( ) ( ) ( ) ( )1 1 1 1 1 1 1 1 1 1$1 $2 $3 $4 $5 $6 $7 $8 $9 $10 1 $4.5010 10 10 10 10 10 10 10 10 10
+ + + + + + + + + − =
Game 2: You would expect to lose $4.50 on average.
( ) ( ) ( ) ( ) ( ) ( ) ( ) ( ) ( ) ( )1 1 1 1 1 1 1 1 1 1$1 $2 $3 $4 $5 $6 $7 $8 $9 $10 10 $4.5010 10 10 10 10 10 10 10 10 10
+ + + + + + + + + − = −
Game 3: You would expect to win $0.50 on average.
( ) ( ) ( ) ( ) ( ) ( ) ( ) ( ) ( ) ( )1 1 1 1 1 1 1 1 1 1$1 $2 $3 $4 $5 $6 $7 $8 $9 $10 5 $0.5010 10 10 10 10 10 10 10 10 10
+ + + + + + + + + − =
Game 4: You would expect to lose $0.50 on average.
( ) ( ) ( ) ( ) ( ) ( ) ( ) ( ) ( ) ( )1 1 1 1 1 1 1 1 1 1$1 $2 $3 $4 $5 $6 $7 $8 $9 $10 6 $0.5010 10 10 10 10 10 10 10 10 10
+ + + + + + + + + − = −
2. Can the expected winning value actually be won in the games above? Sample response: No. It cannot,
it is the average of each game over time.

Page 80
AIIF
SJ Page 40 3. On which games would a player eventually make money? On which games would a player eventually
lose money? You may eventually make money on Game 1 and Game 3. You probably would lose money on Game 2 and Game 4 over time.
4. Compare the expected winnings in Activity 2 with the actual winnings that you recorded in Activity 1.
Hopefully, the actual winning values in Activity 1 are similar to the expected winnings. Discuss with the students why the winnings may or may not be similar.
5. What is the largest dollar value that you could gain on one play for each of the games. Game 1: $10.00−$1.00=$9.00 Game 2: $10.00−10.00=$0.00 Game 3: $10.00−$5.00=$5.00 Game 4: $10.00−$6.00=$4.00 6. Which of the four games would a casino more than likely use? Explain your answer. Answers will
vary. Sample response: A casino would either choose Game 2 or Game 4 because both of those games would tend to make money overtime for the casino. The casino would probably choose Game 4 over Game 2 because in Game 2 people would lose so much money, they may quit playing it.

Probability and Statistics Lesson 5: Expected Winnings Page 81
AIIF
Teacher Reference Activity 3 Have the groups of four complete these exercises. They should be prepared to discuss them in front of class. Extension Have the students determine the expected winnings of a local lottery game. Have them share their results with one of the following methods. A poster that represents their findings. A presentation in front of class. A newspaper article. A news video tape. The following is an example of the mathematics behind a local lottery that pays $100,000 to match 5 numbers drawn from 53 numbers if it costs $1.00 to play the game.
( ) ( )53 5
1 1$100, 000 $1.00 $100, 000 1.00 $0.972, 869, 685C
− = − ≈ −
A person would expect to, on average, lose $0.97 each time they play. In other words for each $1.00 you spend you only get back $0.03.

Page 82
AIIF
SJ Page 41 Activity 3 1. Would a casino make a game where the players
always make money on average? Explain your answer. Sample response: No. If the players made money on average then the Casino would have to close, because they wouldn’t make a profit.
2. Would a casino make a game where players always lose money on average? Explain your answer.
Sample response: Yes. This is what they have to do to stay in business. 3. A casino has a game that pays the dollar amount for the value shown on a dice. For example, if you roll
a dice and get a 3 the casino will pay you $3.00. It costs $4.00 to roll a dice. Determine the expected value. Explain why you would or wouldn’t want to play the game based on the expected value. Answers will vary. Sample response: I would not like to play, because I eventually will lose $0.50 on average each time I play.
( ) ( ) ( ) ( ) ( ) ( )1 1 1 1 1 1$1 $2 $3 $4 $5 $6 4 $0.506 6 6 6 6 6
+ + + + + − = −
4. Do you believe a casino would have a game that has a positive expected value for the players? Explain
your answer. Sample response: No. See answer for Exercise 1. 5. Create a casino game with cards that would bring in money for the casino. Show the expected
winnings. Answers will vary. Look for creativity. Give the students a rubric that will show them how they will be graded.

Probability and Statistics Lesson 5: Expected Winnings Page 83
AIIF
SJ Page 42 Practice Exercises 1. Determine the expected winnings of a local lottery game that pays out $25,000.00 to match 5 numbers
drawn from 45. It costs $1.00 to play the game.
( ) ( )45 5
1 1$25, 000 $1.00 $25, 000 1.00 $0.98C 1, 221, 759
− = − ≈ −
2. A local charity is raffling off a $300.00 gift certificate. All you have to do is place your name on a card
and pay $5.00 to enter the drawing. a. If you put one entry in the drawing and there are 499 other entries, what are your expected
winnings? ( )1 $300 $5.00 $4.40500
− = −
b. If you put one entry in the drawing and there are 29 other entries, what are your expected
winnings? ( )1 $300 $5.00 $5.0030
− =
c. If you put one entry in the drawing, how many other entries would need to occur for you to
have an expected winning of one dollar? There would need to be 49 other entries so that
( )1 $300 $5.00 $1.0050
− = .

Page 84
AIIF
SJ Page 43 Outcome Sentences I now understand why lottery I am beginning to wonder why expected winnings I was surprised I think I

Probability and Statistics Lesson 5: Expected Winnings Page 85
AIIF
Lesson 5 Quiz A Answers
1. ( )1 $250.00 $1.00 $0.50500
− = −
2. The highest expected winnings is game c.
a. ( ) ( )1 1$20.00 $5.00 $10.00 $2.502 2
+ − =
b. ( ) ( ) ( ) ( ) ( ) ( )1 1 1 1 1 1$1.00 $2.00 $3.00 $4.00 $5.00 $6.00 $1.00 $2.506 6 6 6 6 6
+ + + + + − =
c. ( ) ( )1 1$7.00 $0.00 $0.50 $3.002 2
+ − =
Lesson 5 Quiz B Answers
1. ( )5 $150.00 $5.00 $2.50300
− = −
2. The highest expected winnings is game b.
a. ( ) ( )1 1$12.00 $3.00 $5.00 $2.502 2
+ − =
b. ( ) ( ) ( ) ( ) ( ) ( )1 1 1 1 1 1$1.00 $2.00 $3.00 $4.00 $5.00 $6.00 $0.50 $3.006 6 6 6 6 6
+ + + + + − =
c. ( ) ( )1 1$2.00 $0.50 $1.00 $0.252 2
+ − =

Page 86
AIIF
Lesson 5 Quiz A Name: 1. During the first half of every a local basketball game the cheerleaders sell tickets for $1.00 each. During
half time, the cheerleaders draw one ticket and the winner of that ticket gets half the money they collected. If you buy one ticket and the cheerleaders sold 500 tickets, what are your expected winnings?
2. Which game described below has the highest expected winnings? a. You pay $10.00 to pick one card out of a twenty. The cards are numbered one through twenty. If
the card you draw is even you win $20.00 if the card is odd you win $5.00. b. You pay $1.00 to roll a regular six sided die. You win the dollar amount equal to what is on the
die. c. You pay $0.50 to toss a coin. If it is heads you win $7.00 and if it is tails you win zero dollars.

Probability and Statistics Lesson 5: Expected Winnings Page 87
AIIF
Lesson 5 Quiz B Name: 1. A local charity has a split-the-cash drawing. They sell each ticket for $1.00. At the end of the day they
will draw one ticket from all the tickets that they sold. The person holding the matching stub of that ticket will win half the money that they received that day. If you buy 5 tickets and they sell a total of 300 tickets, what are your expected winnings?
2. Which game described below has the highest expected winnings? a. You pay $5.00 to pick one card out of a ten. The cards are numbered one through ten. If the card
you draw is even you win $12.00 if the card is odd you win $3.00. b. You pay $0.50 to roll a regular six sided die. You win the dollar amount equal to what is on the
die. c. You pay $1.00 to toss a coin. If it is heads you win $2.00 and if it is tails you win $0.50.

Page 88
AIIF
Lesson 6: Parameters and Statistics Objectives • Students will determine the mean, median, mode, upper quartile, lower quartile, minimum, maximum, and
standard deviation of a set of data. • Students will draw a histogram. • Students will draw a box and whisker plot. • Students will investigate the difference between a population parameter and a sample statistic. • Students will investigate the relationship between a random sample and bias. • Students will investigate the spread of data and standard deviation. Essential Questions • How is data used to create histograms and box and whisker plots? • How are the various statistics used in real-world applications? Materials • Overhead • Blank transparencies • Overhead markers • Poster paper (Optional) • Pennies: enough for each group of four to have approximately 20 • Paper Bags: one for each group of four • Deck of cards for each group • Calculator Warm Up • Problems of the Day Number of Days At least 1 block schedule Vocabulary Population Parameter Sample Statistic Random Sample Characteristic Biased Mean Standard Deviation Lower quartile Upper quartile Minimum Maximum Mode Median 25th percentile 75th percentile Box and Whisker Plot

Probability and Statistics Lesson 6: Parameters and Statistics Page 89
AIIF
Teacher Reference Setting the Stage Place the Setting the Stage transparency on the overhead. (Note: A master copy of the transparency is on the next page. You can use any picture that is rich in detail.) First, have each student describe in writing three characteristics of the picture. After they have recorded the description, ask the following questions.
• Does one of the characteristics alone describe the whole picture? • Do all three characteristics together describe the whole picture? • What characteristics are still missing? • Could you ever list all the characteristics?
The goal with this Setting the Stage is to have student understand that a characteristic of a complicated picture does not describe everything in the picture but does let you know something about the picture. This same concept occurs when parameters and statistics describe a characteristic of a set of data; the parameter or statistic does not describe everything about the data. Note: If students later have trouble distinguishing a parameter from a statistics refer back to the Setting the Stage and explain that a parameter would be like describing something from the real setting that the picture was taken from and a statistic would be like describing something from the picture. Pre-Reading There are many statistical terms in this lesson: Population, Parameter, Population Parameter, Sample, Statistic, Sample Statistic, Random, Random Sample, Biased, Characteristic, Mean, Average, Standard Deviation, Median, Minimum, Maximum, Lower Quartile, 25th Percentile, Upper Quartile, 75th Percentile, and Box and Whisker Plot. It will be difficult to completely discuss each word before it is introduced in the lesson therefore the following suggestion is given as a method to use throughout the lesson. Suggestion: On a wall in the classroom place 10 fish cutouts of different lengths. It works best if you use construction paper to make a lake on the wall first then place the fish randomly on the lake. Cutouts are available at the end of the lesson. As the students work through the lesson you can refer to the 10 fish cutouts when describing a new word. For example, to help students understand population, you could refer to the lake on the wall and say that entire population of the fish in the lake is 10, there are only 10 fish no less and no more. Make sure to label the lake “Population.” To help students understand the terms sample and random, you could randomly pick five fish from the lake and tag them. Put a legend on the wall that explains the tagged fish are a random sample. After students work with the term mean, you could have them help you determine the population mean (which is a parameter) and sample mean (which is a statistic), place the calculations on a poster near the lake of fish on the wall. Continue placing calculations and terms on the wall as needed.

Page 90
AIIF
Setting the Stage – Transparency

Probability and Statistics Lesson 6: Parameters and Statistics Page 91
AIIF
Teacher Reference Activity 1 Before the students begin have a discussion around the term, characteristic. Pick an object such as shoes and discuss the various characteristics of the shoes in the room. For example, you may find that half the shoes in the room do not have shoe laces, or that 5 of the shoes are basketball shoes, or that the largest shoe is a size 13. Place approximately 20 pennies in as many bags as there are groups of 4 in your class. To begin the activity, read with the students the directions. Pass out the bags to each group and then let them work. After students have created a list of characteristics, have them share that information with class. The students will hopefully describe their set of pennies with some of the common descriptions such as total number of pennies, mean of year minted, median of the year minted, mode of the year minted, oldest year minted, youngest year minted, range of years minted, or even (but doubtful) standard deviation of the years minted. You may have students describe characteristics such as shinny or dull surfaces, Lincoln Memorial pennies (have Lincoln Memorial on reverse) or Lincoln pennies (have wheat straw on reverse), or from where they were minted such as Philadelphia or Denver. Make sure the students keep all of their information. You may want them to create posters of their information and place them around the room. They will use this information in Activity 2. If the students missed one of the common descriptions have them complete it first before they go on: total number of pennies, mean of year minted, median of the year minted, mode of the year minted, oldest year minted, youngest year minted, and range of years minted.

Page 92
AIIF
SJ Page 44 Activity 1: Using One Number to Describe Many Numbers
Pour the entire contents of your bag onto the table in front of you. With your group write as many descriptive characteristics that you can about the objects in front of you. Be creative. Be prepared to share all the characteristics that you can. Try to be the group with the most characteristics and with the most unique characteristics. Place your information on a transparency or poster paper. Note: Make sure to keep all of your information organized for later use. After you have presented your list, complete the following.
1. If you had to pick only one characteristic out of your list to describe all of your pennies which one would it be? Explain why you chose that characteristic. Answers will vary. Many students will probably pick the mean. Make sure to have students express why they chose their number.
2. Which group had the youngest set of pennies? How could you represent this mathematically? Answers
will vary depending upon how they described the group with the youngest set. Students may compare sets with the mean, median, or mode and get different answers. They may also try to describe the youngest group because it had more of the smaller values then any other group. Make sure each group gets to explain why they made their choice.
3. Which group had the oldest set of pennies? How could you represent this mathematically? Answers
will vary. 4. Would any of the characteristics in your list be a good representation of all the pennies in circulation in
the United States? Explain your answer. Answers may vary. Some characteristics may not be good representations such as the number of coins minted in Philadelphia. If you’re on the east coast there would be many of these coins. If you’re on the west coast there may be few. Some characteristics may be good representations such as the newest coin. All groups would probably have a coin that was minted this year or the year before.
5. Would any of the characteristics in your list be a good representation of all pennies minted in the
United States over the history of pennies? Explain your answer. Answers may vary. There would probably not be many characteristics that are good representations, because many coins older than the 1960’s are hardly in circulation anymore.
6. Would any of the characteristics in your list be a good representation of all the coins in circulation in
the United States? Explain your answer? Answers may vary. Pennies would not be a good representation of all other coins. For example, the number of quarters produced may not match the number of pennies produced.

Probability and Statistics Lesson 6: Parameters and Statistics Page 93
AIIF
SJ Page 45 When a characteristic is determined by using the whole population it is called a Population Parameter. 7. If we consider all the pennies that were minted in the United States over the history of pennies as the
population, do any of the characteristics from your set of pennies represent a population parameter? Explain why or why not? No. Sample response: Many older pennies are no longer in circulation and the twenty from our sample are fairly young.
When a characteristic is determined by using a sample from the population it is called a Sample Statistic. 8. Do any of the characteristics from your set of pennies represent a sample statistic of the entire
population of pennies minted? Explain why or why not? Yes. All of the characteristics come from a sample so they definitely represent a sample statistic.
A random sample is a sample of objects taken from the entire population with each object having the exact same chance of being drawn. 9. Describe whether your sample of pennies in the bag was a random sample or not of the entire
population of pennies minted. Sample response: No. This was not a random sample because the pennies were all obtain from a local bank, it doesn’t represent pennies from other parts of the United States or from all the pennies that are out of circulation.

Page 94
AIIF
SJ Page 46 A sample is biased if it does not represent a population that it is meant to describe because it was not randomly drawn from the whole population. 10. Describe why your sample would be biased or unbiased if the population we were trying to describe
was all minted pennies in the United States over the history of pennies. Sample response: It would be biased because it only represents young pennies. Many pennies from the early 1900’s and late 1800’s are not in circulation.
11. Describe why your sample would be biased or unbiased if the population we were trying to describe
was all the pennies currently in circulation in the United States. Sample response: It would be biased because it only represents pennies from the local area.
12. Describe why your sample would be biased or unbiased if the population we were trying to describe
was just the pennies in this classroom. Sample response: It would not be biased because the teacher randomly chose the twenty pennies for our groups out of all the pennies in the class.
13. Determine the age of all the pennies in your sample and create a list of those ages. Make sure to write
the age and not the year minted for each penny. For example, if the current year is 2009 and the date on the penny is 2002 then the approximate age is seven. Have each group create a list of the ages of their pennies.
Important!: Photocopy this list and give it to all the groups for Activity 2.

Probability and Statistics Lesson 6: Parameters and Statistics Page 95
AIIF
Teacher Reference Activity 2 This is an excellent opportunity to have students enter the data into a graphing calculator. Each group should have a list of all the pennies. (An alternative is to have the groups come to the board or make a poster of their pennies ages or the year they were minted.) This activity may be more of a guided activity. Allow students to work in their groups, but interact with the whole class as necessary.
Page 96
AIIF
SJ Page 47 Activity 2 Let’s assume that all the pennies the teacher passed out are the entire population. The mean (average) of a set of numbers is the sum of all the numbers divided by the number of numbers. 1. Determine the population mean of the age of all the pennies in the class. Answers will vary depending
on the penny population. It would take a long time for the students to add all the dates or ages of the pennies, so there is a quicker method. With most graphing calculators you can calculate the one-variable statistics such as mean, median, etc. by using a feature that gives results for a list. Show students how to do this with a graphing calculator to determine the population mean. This feature will also be valuable for later exercises.
2. Determine the sample mean of the age of pennies for your set of pennies. Share this information with
the class as the teacher directs. Answers will vary. Each group will have a sample mean. Have students place their sample means on the board or overhead.
3. Which group’s sample mean is the closest to the population mean? How close is it? Answers will vary
depending on the samples and population. Some sample means may be the same as the population mean.
4. Create a histogram, with intervals of five years, of the entire class penny population. A blank histogram
template is available on the next page. Answers will vary depending on the penny population. The goal with this exercise is to allow the students to describe spread in their own words. You may need to help guide students in creating a histogram. There should be more sample means close to the population mean than further away. It will take time to create the histogram but worth it for students to see the distribution. You may want to create a histogram on the overhead while students are creating one at their desks. A transparency is provided. Have different individuals or groups present their sample means on at the overhead.
a. Mark the population mean on the histogram. The students could put a vertical line on the
graph in the interval that contains the population mean. b. Describe the spread of the data. For example, is it all bunched up, is it evenly spread across all
ages, does it slowly or quickly spread out, etc. Answers will vary. c. Mark each group’s sample mean on the histogram. The students could put a vertical line on
the graph in the interval that contains their sample mean. Perhaps use a different color at this location.
d. Describe how the sample means fit with the histogram. Answers will vary. Hopefully more of
the sample means will be close to the population mean and only a few of the sample means will appear to be outliers. This helps solidify the concepts that most sample means taken from a population are fairly reasonable to use to describe the population, but sometimes the sample means are not accurate. Statistics such as a sample mean can be used to describe a population but they are only estimates and are not the true population mean, even though most sample means would be close to the true population mean.

Probability and Statistics Lesson 6: Parameters and Statistics Page 97
AIIF
SJ Page 48
Histogram Template for Age of Pennies We can represent some characteristics of the spread of data without drawing a picture by determining a number called standard deviation. Most graphing calculators have a feature that can calculate the standard deviation for you. Your teacher will describe how to determine this number. 5. Use a graphing calculator to determine the population standard deviation for the age of all the pennies.
Standard deviation is a very difficult thing to conceptually understand, so we will try to just link it to spread and not try to build a conceptual understanding. Most graphing calculators can determine one-variable statistics which include the mean and standard deviation from a list of numbers. It will be easier for students to enter the values into a list and use the one-variable statistics feature then to
100
or o
lder
95-9
9
90-9
4
85-8
9
80-8
4
75-7
9
70-7
4
65-6
9
60-6
4
55-5
9
50-5
4
45-4
9
40-4
4
35-3
9
30-3
4
25-2
9
20-2
4
15-1
9
10-1
4
5-9
0-4
0
10
20
30
40
50
60
70
80
90
100
Intervals of Age of Pennies in Years
Perc
ent

Page 98
AIIF
SJ Page 49 calculate the standard deviation by formula. The graphing calculator will probably give two standard
deviations: one will be for a population (generally represented as σx) and one will be for a sample (generally represented as Sx). Since we are assuming all the pennies are the population you will want to use the population standard deviation.
6. How many group’s sample mean of ages are within one population standard deviation of the
population mean of ages? Answers will vary. More than half of the sample means should fall within one-standard deviation of the population mean (approximately 67%), about 95% of the sample means should fall within two-standard deviations of the population mean, and about 99% of the sample means should fall within three standard deviations of the population mean.
Note: Approximately 68% of the sample means generally fall within one population standard deviation of the population mean.
7. How many group’s sample mean of ages are within two population standard deviations of the
population mean of ages? See answer for Exercise 6.
Note: Approximately 95% of the sample means generally fall within two population standard deviations of the population mean.

Probability and Statistics Lesson 6: Parameters and Statistics Page 99
AIIF
Teacher Reference Activity 3 The answers for Exercises 1 through 5 can all be calculated by one function on a graphing calculator if the set of data is in the calculator. You can use these feature to replace Exercises 1 through 5 if you wish. Extensions You can ask students question such as, • How many 1960 pennies would we have to add to our 20 sample pennies to make the mean age increase by
2 years? 5 years? 10 years? • What would you need to get on your next exam to pass with an A? Project Have each group of students generate a survey for which they gather numeric data from the whole class. The students should treat the math class as the population and their group of four as the sample. An example would be to gather the heights of all students. Note: The population data should include the groups sample data. Have each group create a presentation of their data. The presentation should be presented with transparencies or posters. The presentation should also include the following information:
• A description of why their group sample data was or was not biased. • A description of why their group sample data was or was not a random sample. • Population Mean • Sample Mean • Histogram of the Population with Standard Deviations marked • Median • Minimum • Maximum • Lower Quartile • Upper Quartile • Box and Whisker Plot

Page 100
AIIF
SJ Page 50 Activity 3 1. List your sample penny data by age from the youngest to the oldest. Answers will vary. It will take
some time for them to list them all out. They may want to list them in a graphing calculator. The median of a set of data is the middle number. If there is not an exact middle number then divide the sum of middle two numbers by 2. 2. Determine the median age of your sample penny data. Answers will vary. You may want to talk with
students about different methods they used to determine this value. 3. List the minimum age and maximum age of your sample penny data. Answers will vary. Students
should list the age of the youngest and oldest penny in their sample. The lower quartile of a set of data is the number that is at the 25th percentile. Find this number by determining the middle number between the minimum number and the median. 25% of the data should be below the lower quartile. 4. Determine the lower quartile of your sample penny data. Answers will vary. You may need to guide
students through this process. The upper quartile of a set of data is the number that is at the 75th percentile. Find this number by determining the middle number between the maximum number and the median. 75% of the data should be below the upper quartile. 5. Determine the upper quartile of your sample penny data. Answers will vary. You may need to guide students through this process.
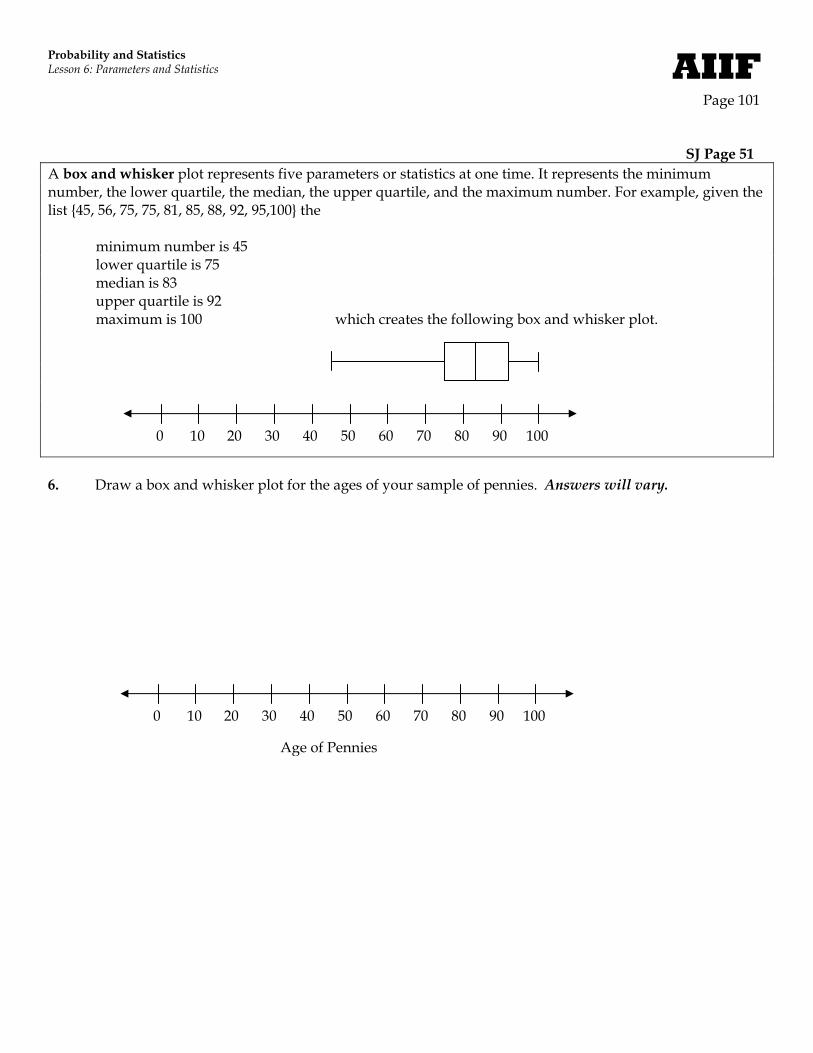
Probability and Statistics Lesson 6: Parameters and Statistics Page 101
AIIF
SJ Page 51 A box and whisker plot represents five parameters or statistics at one time. It represents the minimum number, the lower quartile, the median, the upper quartile, and the maximum number. For example, given the list {45, 56, 75, 75, 81, 85, 88, 92, 95,100} the minimum number is 45 lower quartile is 75 median is 83 upper quartile is 92 maximum is 100 which creates the following box and whisker plot. 6. Draw a box and whisker plot for the ages of your sample of pennies. Answers will vary.
0 10 20 30 40 50 60 70 80 90 100
0 10 20 30 40 50 60 70 80 90 100
Age of Pennies

Page 102
AIIF
SJ Page 52 7. Transfer your group’s box and whisker plot to the transparency provided by your teacher. Give the
teacher your transparency. After your teacher has placed all of the transparencies from the groups on the overhead, describe how the different box and whisker plots compare. Answers will vary. Try to get all of the box and whiskers on the overhead lined up to match the scale, you may have to experiment with different ways to accomplish this. Hopefully the students will be able to see that most of the boxes probably are in the same general area and that the whiskers extend out. It may be obvious if a group had a fairly different set of pennies either much older or much younger by its location to the other boxes. Placing them together should also show an outlier by a whisker that extends much further than other whiskers.
8. On the same graph draw a vertical line that represents the mean of the population. Describe what you
see. Answers will vary. Hopefully students see that most of the boxes probably contain the population mean. But if some boxes don’t then students can conclude that not all samples are a good representation of the population. If time allows, it may be valuable to create a box and whisker plot for the entire population and then compare it with the sample box and whisker plots.
Project Create a survey that your group can use to gather a set of numeric data as described by your teacher. Create a presentation of your data. The presentation should be presented with transparencies or posters. The presentation should also include the following information:
• A description of why your group sample data was or was not biased. • A description of why your group sample data was or was not a random sample. • Population Mean • Sample Mean • Histogram of the Population with Standard Deviations marked • Median • Minimum • Maximum • Lower Quartile • Upper Quartile • Box and Whisker Plot

Probability and Statistics Lesson 6: Parameters and Statistics Page 103
AIIF
Histogram Template for Age of Pennies – Transparency
100
or o
lder
95-9
9
90-9
4
85-8
9
80-8
4
75-7
9
70-7
4
65-6
9
60-6
4
55-5
9
50-5
4
45-4
9
40-4
4
35-3
9
30-3
4
25-2
9
20-2
4
15-1
9
10-1
4
5-9
0-4
0
10
20
30
40
50
60
70
80
90
100
Intervals of Age of Pennies in Years
Perc
ent

Page 104
AIIF
Box and Whisker - Transparency
0 10 20 30 40 50 60 70 80 90 100
Age of Pennies

Probability and Statistics Lesson 6: Parameters and Statistics Page 105
AIIF
SJ Page 53 Outcome Sentences The difference between a population parameter and sample statistic is I didn’t realize a random sample I now know that the upper quartile I rediscovered I would conclude that

Page 106
AIIF
Lesson 6 Quiz A Answers 1. a. minimum = 17 maximum = 35 median = 19 upper quartile = 20 lower quartile = 18 b. c. See Graph Lesson 6 Quiz B Answers 1. a. minimum = 25 maximum = 35 median = 30 upper quartile = 32 lower quartile = 29 b. c. See Graph
0 5 10 15 20 25 30 35
mean
0 5 10 15 20 25 30 35
mean

Probability and Statistics Lesson 6: Parameters and Statistics Page 107
AIIF
Lesson 6 Quiz A Name: 1. The list of data represents a sample of Freshman college student’s ages from a local college.
18, 17, 20, 18, 19, 19, 20, 28, 19, 35, 19
a. Determine the minimum, maximum, median, upper quartile, and lower quartile of the data. minimum = maximum = median = upper quartile = lower quartile = b. Create a box-and-whisker plot of the data. c. Determine the mean of the data and mark it on the box-and-whisker plot.

Page 108
AIIF
Lesson 6 Quiz B Name: 1. The list of data represents the number of individual candies in a sample of bags.
32, 29, 33, 30, 29, 30, 30, 31, 30, 35, 25
a. Determine the minimum, maximum, median, upper quartile, and lower quartile of the data. minimum = maximum = median = upper quartile = lower quartile = b. Create a box-and-whisker plot of the data. c. Determine the mean of the data and mark it on the box-and-whisker plot.

Probability and Statistics Lesson 6: Parameters and Statistics Page 109
AIIF
Probability & Statistics Assessment Names: Going Backwards In this assessment, you will be give the statistical values and will need to create the data. 1. Create a list of 10 different numbers that have a mean of 85. No number in the list of 10 can have the
same value. 2. Create a list of 10 numbers that have a mean of 85 and a median of 80. 3. Create a list of 10 numbers that have a mean of 85 and a mode of 90. The mode of a set of data is the
number that occurs the most frequently. 4. Create a list of 10 numbers that have a mean of 85, a median of 80, and a mode of 90.
Page 110
AIIF
Group Assessment Names: Help create the rules for a dice game. Here are some of the rules. A game with three dice is played. Each person gets to roll the set of dice once. There are four different types of roles. Three of a kind which is three dice with matching numbers. For example, the dice numbers could be 2,
2, and 2. Two of a kind which is two dice with matching numbers and one unmatched die. For example, the
dice numbers could be 4, 4, and 6. Straight which is three dice with numbers in consecutive sequence. For example, the dice numbers
could be 2, 3, and 4. No match which is dice with no matching numbers. By determining the probability of each possible four different roles, finish the rules by describing the rank of each roll. For example, you may find the probability that getting a straight is smaller than the probability of getting three of kind, so you would rank a straight higher than three of a kind. You can determine the probabilities theoretically or experimentally. You must prepare a poster and presentation that shows how you determined the ranking of the different rolls.
Probability and Statistics Lesson 6: Parameters and Statistics Page 111
AIIF
References & Resources The authors and contributors of Algebra II Foundations gratefully acknowledges the following resources: Donovan, Suzanne M.; Bransford, John D. How Students Learn Mathematics in the Classroom. Washington, DC: The
National Academies Press. 2005. Driscoll, Mark. Fostering Algebraic Thinking: A Guide for Teachers Grades 6-10. Portsmouth, NH: Heinemann, 1999. Eves, Howard. An Introduction to the History of Mathematics (5th Edition) Philadelphia, PA: Saunders College Publishing,
1983. Harmin, Merrill. Inspiring Active Learning: A Handbook for Teachers. Alexandria, VA: Association for Supervision and
Curriculum Development, 1994. Harshbarger , Ronald J. and Reynolds, James J., Mathematical Applications for the Management, Life, and Social
Sciences Eighth Edition, Houghton Mifflin Boston, MA 2007. Hoffman, Mark S, ed. The World Almanac and Book of Facts 1992. New York, NY: World Almanac. 1992. Kagan, Spencer. Cooperative Learning. San Clemente, CA: Resources for Teachers. 1994. Karush, William. Webster’s New World Dictionary of Mathematics. New York: Simon & Schuster. 1989. McIntosh, Alistair, Barbara Reys, and Robert Reys. Number Sense: Simple Effective Number Sense Experiences. Parsippany,
New Jersey: Dale Seymour Publications. 1997. McTighe, Jay; Wiggins, Grant. Understand by Design. Alexandria, VA: Association for Supervision and Curriculum
Development. 2004. Marzano, Robert J. Building Background Knowledge for Academic Achievement. Alexandria, VA: Association for
Supervision and Curriculum Development. 2004. Marzano, Robert J.; Pickering, Debra J.; Jane E. Pollock. Classroom Instruction that Works. Alexandria, VA:
Association for Supervision and Curriculum Development. 2001. National Research Council. Adding It Up: Helping Children Learn Mathematics. Washington, DC: National Academy Press.
2001. Ogle, D.M. (1986, February). “K-W-L: A Teaching Model That Develops Active Reading of Expository Text.” The Reading
Teacher, 39(6), 564–570. The National Council of Teachers of Mathematics. Principles and Standards for School Mathematics. Reston, VA: The
National Council of Teachers of Mathematics. 2000. Van de Walle, Jon A. Elementary and Middle School Mathematics: Teaching Developmentally (4th Edition). New York: Addison
Wesley Longman, Inc. 2001. The authors and contributors Algebra II Foundations gratefully acknowledges the following internet resources: http://www.metalprices.com/# http://nationalzoo.si.edu/Animals/AsianElephants/factasianelephant.cfm http://hypertextbook.com/facts/1998/JuanCancel.shtml http://www.conservationinstitute.org/ocean_change/predation/salmonsharks.htm http://blogs.payscale.com/ask_dr_salary/2007/03/starting_salari.html http://www.mpaa.org/FlmRat_Ratings.asp (December 2008) http://federaljobs.net/fbijobs.htm (December 2008) http://www-pao.ksc.nasa.gov/kscpao/release/2000/103-00.htm (December 2008) www.seaworld.org http://www.dailyherald.com/story/?id=92571 http://www.infoplease.com/ipa/A0004598.html http://www.washingtonpost.com/wp-dyn/content/article/2006/10/05/AR2006100501782.html http://www.dxing.com/frequenc.htm

Page 112
AIIF
http://www.wjhuradio.com/ http://www.wrko.com/ http://www.census.gov http://www.ehs.washington.edu/rso/calculator/chelpdk.shtm http://en.wikipedia.org/wiki/Petroleum http://en.wikipedia.org/wiki/2004_Indian_Ocean_earthquake http://www.fs.fed.us/gpnf/mshnvm/ http://www.popularmechanics.com/home_journal/workshop/4224738.html http://www.fitness.gov/exerciseweight.htm http://www.economagic.com/em-cgi/data.exe/cenc25/c25q07 http://www.ndbc.noaa.gov/hurricanes/1999/floyd.shtml http://www.fhwa.dot.gov