© 2014 pearson education, inc. ch. 2 population - key issues where is the world population...
TRANSCRIPT
© 2014 Pearson Education, Inc.
Ch. 2 Population - Key Issues
• Where is the world population distributed?
• Why is global population increasing?
• Why does population growth vary among regions?
• Why do some regions face health threats?

© 2014 Pearson Education, Inc.
Overpopulation
• How would you define overpopulation?
• How do geographers define overpopulation?– When an area’s
population exceeds the capacity of the environment to support it at an acceptable standard of living.
– What are the variables in this definition? 2
© 2014 Pearson Education, Inc.
• Population Concentrations– 2/3 of the world’s inhabitants are clustered in
four regions.• East Asia• South Asia• Southeast Asia• Europe
– Site and Situation of Population Clusters• Low-lying areas with fertile soil and temperate
climate• Near an ocean or near a river with easy access to
an ocean.
KI #1 Where Is the World’s Population Distributed?

© 2014 Pearson Education, Inc.
Virtually all population growth is occurring in LDCs (the poorest parts of the world)!!!
© 2014 Pearson Education, Inc.
#1 Population Concentration-East Asia
• ¼ of the world’s population
• E. China, Japan, Korea, Taiwan
• 5/6 of the population of the region is in China with ½ of that population being rural farmers
• In Japan and S. Korea, 40% of the population is in 3 cities-Tokyo, Osaka or Seoul which is 3% of the region’s land area. ¾ of the Japanese live in urban areas and work in industrial or service jobs
© 2014 Pearson Education, Inc.

© 2014 Pearson Education, Inc.
#2 Population Concentration-South Asia
• ¼ of the world’s population
• India, Pakistan, Bangladesh, Sri Lanka
• India is ¾ of S. Asia’s population
• Mostly farmers in rural areas
© 2014 Pearson Education, Inc.

© 2014 Pearson Education, Inc.
#3 Population Concentration-Europe
• Europe and Euro side of Russia• 48 countries• 1/9 of the world’s population• ¾ live in cities (urban areas)• Highest population concentration near the
coal fields of England, Germany, & Belgium (heavy manufacturing area)
• Europe doesn’t produce enough food for itself which is a reason it pushed for exploration
© 2014 Pearson Education, Inc.

© 2014 Pearson Education, Inc.
#4 Population Concentration-Southeast Asia
• 600 million people• Mostly islands between Indian and Pacific
Oceans• Largest concentration on Java (an island in
Indonesia) with 100 million—Indonesia has 13,677 islands
• Also a high concentration in the Philippines and Indochina (SE tip of Asian mainland)
• Mostly farmers in rural areas
© 2014 Pearson Education, Inc.

© 2014 Pearson Education, Inc.
Emerging Regions of Population
• Eastern North America– Boston to Newport News, VA to Chicago– 2% of the world’s population– 98% urban
• West Africa– ½ of W. African concentration is in Nigeria– 2% of the world’s population– Mostly farmers– 5 urban areas with 2+million
© 2014 Pearson Education, Inc.

© 2014 Pearson Education, Inc.
Where Is the World’s Population Distributed?
• Sparsely Populated Regions– Humans avoid clustering in certain physical
environments.• Dry Lands• Wet Lands• Cold Lands• High Lands
– Places considered too harsh for occupancy have diminished over time.
• Places of permanent human settlement are termed the ecumene.

© 2014 Pearson Education, Inc.
• Expansion of the Ecumene
5000 BC - AD 1900
75% live on only 5% of the Earth’s surface
Fig. 2-3 (pg. 50): The ecumene, or the portion of the earth with permanent human settlement, has expanded to cover most of the world’s land area. 11

© 2014 Pearson Education, Inc.
• Population Density– Density can be computed in up to three ways for
a place.1. Arithmetic Density
– Total number of objects in an area– Computation: Divide the population by the land area
2. Physiological Density– Number of people supported by a unit area of arable land– Computation: Divide the population by the arable land area
3. Agricultural Density– Ratio of the number of farmers to amount of arable land– Computation: Divide the population of farmers by the arable
land area
Where Is the World’s Population Distributed?

© 2014 Pearson Education, Inc.
Agricultural Density
• Agricultural Density: ratio of the number of farmers to the amount of arable land.– US and Canada have lower agric. densities
than India and Bangledesh.– Why would the US have fewer farmers per
acre of arable land? What is different about farming in the US vs. India or a more LDC?
13

© 2014 Pearson Education, Inc.
KI #2 Why Is Global Population Increasing?
• Components of Population Growth– Geographers measure population change in a
country or the world as a whole by using three measures:
• Crude Birth Rate (CBR) – total number of live birth in a year for every 1,000 people alive in society.
• Crude Death Rate (CDR) – total number of deaths in a year for every 1,000 people alive in society.
• Natural Increase Rate (NIR) – percentage by which a population grows in a year.
– Computation: CBR – CDR = NIR» Remember NIR is a percentage ( n per 100, while CBR
and CDR are expressed as n per 1,000)

© 2014 Pearson Education, Inc.
• Natural increase rate (NIR)– The percentage by which a population grows in a
year (NIR = CBR minus CDR)– Hit an all-time high of 2.2% in 1963, slowly fell
throughout the latter part of the century, and has declined sharply during the past decade
– Although the NIR is % is lower the number of people be added is higher. Why?
• Larger base!!!
15

© 2014 Pearson Education, Inc.
Why Is Global Population Increasing?
• Components of Population Growth– Natural Increase
• About 82 million people are added to the population of the world annually.
• Rate of natural increase affects the doubling time– number of years needed to double the population, assuming a constant rate of natural increase.
– Twenty-First Century Rate (1.2 percent): 54 years» Global population in 2100 would reach 24 billion.
– 1963 (2.2): 35 years» Global population in 2010 would have been 10 billion
instead of nearly 7 billion.
• More than 95 percent of the natural increase is clustered in LDC regions, esp. Sub-Saharan Africa and the Middle East.

© 2014 Pearson Education, Inc.
Why Is Global Population Increasing?
• Components of Population Growth– Mortality
• Infant Mortality Rate (IMR)– Measure used by geographers to better understand death
rates in a society– Defined as the annual number of deaths of infants under
one year of age, compared with total live births– Usually expressed per 1,000 births rather than a
percentage– IMR is 5 in developed countries and 80 in sub-Saharan
Africa.

© 2014 Pearson Education, Inc.
Why Is Global Population Increasing?• Components of Population Growth
– Fertility• Total Fertility Rate (TFR)
– Measure also used by geographers to measure number of births in a society.
– Defined as the average number of children a woman will have throughout her childbearing years (15–49)
– TFR for world is 2.5.– TFR exceeds 5 in sub-Saharan Africa, while 2 or less in
nearly all European countries.
http://www.ted.com/talks/hans_rosling_religions_and_babies

© 2014 Pearson Education, Inc.
Why Is Global Population Increasing?
• Summary of Spatial Patterns– Developed Countries
• Lower rates of… – Natural increase – Crude birth – Total fertility– Infant mortality
– Developing Countries• Higher rates of…
– Natural increase – Crude birth – Total fertility– Infant mortality

© 2014 Pearson Education, Inc.
Why Is Global Population Increasing?• Population Structure
– Fertility and mortality vary not only spatially but also temporarily within a country.
– A special bar graph known as a population pyramid can visually display a country’s distinctive population structure. Shape of the pyramid is determined by the CBR.
• X-axis– Percent male displayed to the left of zero– Percent female displayed to the right of zero
• Y-axis– Age cohorts typically grouped in 5-year intervals– Youngest displayed at bottom and oldest at top
© 2014 Pearson Education, Inc.
Why Is Global Population Increasing?
• Population Structure– Dependency Ratio
• Defined as the number of people who are too young or too old to work, compared to the number of people in their productive years.
– People aged 0 to 14 and over 65 years old are considered dependents.
– Larger dependency ratios imply greater financial burden on the working class.
» 85 percent in sub-Saharan Africa, while 47 percent in Europe.

© 2014 Pearson Education, Inc.
Why Is Global Population Increasing?
• Population Structure– Sex Ratio
• Defined as the number of males per 100 females in the population
– Developed countries have more females than males, because they tend to live 7 years longer.
– Where are you more likely to see more males than females? --LDCs and military bases
© 2014 Pearson Education, Inc.
• The Demographic Transition – (IMPORTANT!!)– It is a model consisting of four stages that helps to
explain the rising and falling of natural increase over time in a country.
– Historically, no country has ever reverted back to a previous stage.
• Thus, the model can be thought to have a beginning, middle, and an end.
KI #3 Why Does Population Growth Vary among Regions? IMPORTANT!!!!!

© 2014 Pearson Education, Inc.
© 2014 Pearson Education, Inc.
Why Does Population Growth Vary among Regions?
• The Demographic Transition– Stage 1: Low Growth
• Marked by very high birth and death rates. – No long-term natural increase (NIR is essentially zero)– No country presently is in Stage 1
– Stage 2: High Growth• Marked by rapidly declining death rates and very
high birth rates – High natural increase
– Europe and North America entered stage 2, as a result of the industrial revolution (~1750).
– Africa, Asia, and Latin America entered stage 2 around 1950, as a result of medical revolution-improved medical care.
© 2014 Pearson Education, Inc.
• The Demographic Transition– Stage 3: Moderate Growth
• Marked by rapid decline in birth rates and steady decline in death rates
– Natural increase is moderate.» Gap between CBR and CDR is narrower in stage 3
countries than stage 2 countries.
• Population grows, because CBR is still greater than CDR.
• Most European countries and North America transitioned to stage 3, during first half of twentieth century.
Why Does Population Growth Vary among Regions?

© 2014 Pearson Education, Inc.
• The Demographic Transition– Stage 4: Low Growth
• Marked by very low birth and death rates– No long-term natural increase and possibly a decrease
• Country reaches stage 4 when population gains by CBR are diminished by losses because of CDR.
– Condition known as zero population growth (ZPG)» Demographers more precisely define ZPG as the
TFR that produces no population change.
• Population change results from immigration.
Why Does Population Growth Vary among Regions?
© 2014 Pearson Education, Inc.
Why Does Population Growth Vary?
• The Demographic Transition– Proposed Stage 5 of DTM?
• European countries like Italy and Russia may be beyond Stage 4 of the DTM because they are going into negative population growth.
• Discussion has occurred as to whether a 5th stage should be added. . .

© 2014 Pearson Education, Inc.
• Declining Birth Rates– Two Successful Strategies for Lowering Birth
Rates1. Improving Education and Health Care
– Emphasizes improving local economic conditions so that increased wealth is allocated to education and health programs seeking to lower birth rates.
2. Contraception– More immediate results reaped than previous approach– Met with greater resistance, because it goes against
cultural or religious beliefs of some. » Roman Catholics, fundamentalist Protestants,
Muslims, and Hindus.
Why Does Population Growth Vary among Regions?

© 2014 Pearson Education, Inc.
Will the World Face an Overpopulation Problem?
• What is the most immediate challenge that overpopulation of the earth poses to mankind?
– Essay on the Principle of Population 1798 (time of Industrial Revolution population explosion) by Thomas Malthus
• Basic premise: The population is growing exponentially (geometrically), however, the food supply only increase arithmetically (linear)
© 2014 Pearson Education, Inc.
Why Does Population Growth Vary among Regions?
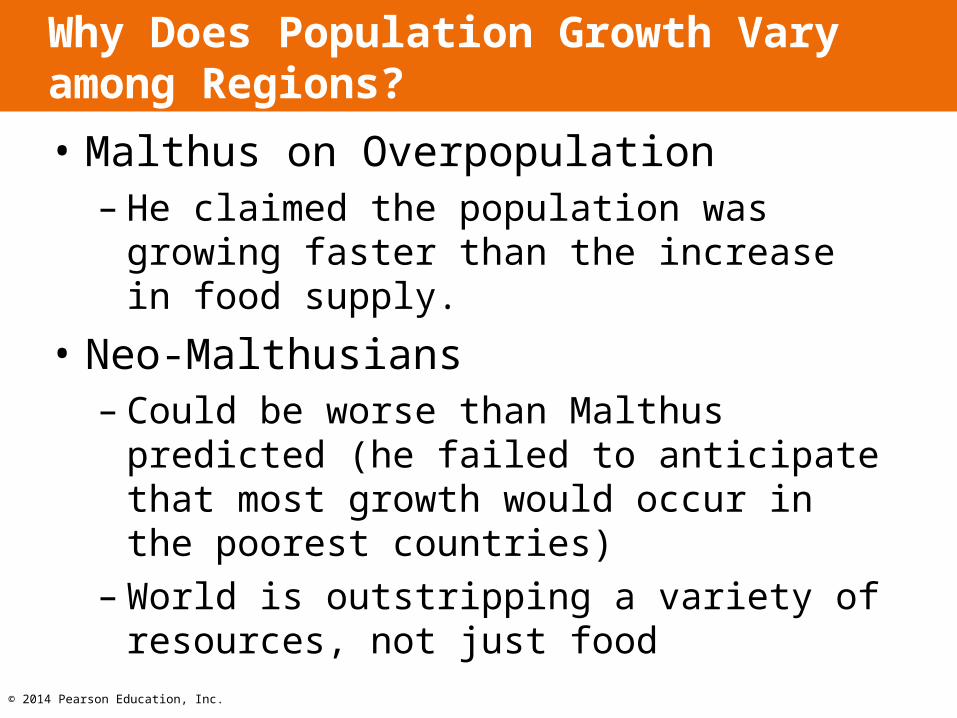
• Malthus on Overpopulation– He claimed the population was growing faster
than the increase in food supply.
• Neo-Malthusians– Could be worse than Malthus predicted (he
failed to anticipate that most growth would occur in the poorest countries)
– World is outstripping a variety of resources, not just food
Why Does Population Growth Vary among Regions?
© 2014 Pearson Education, Inc.
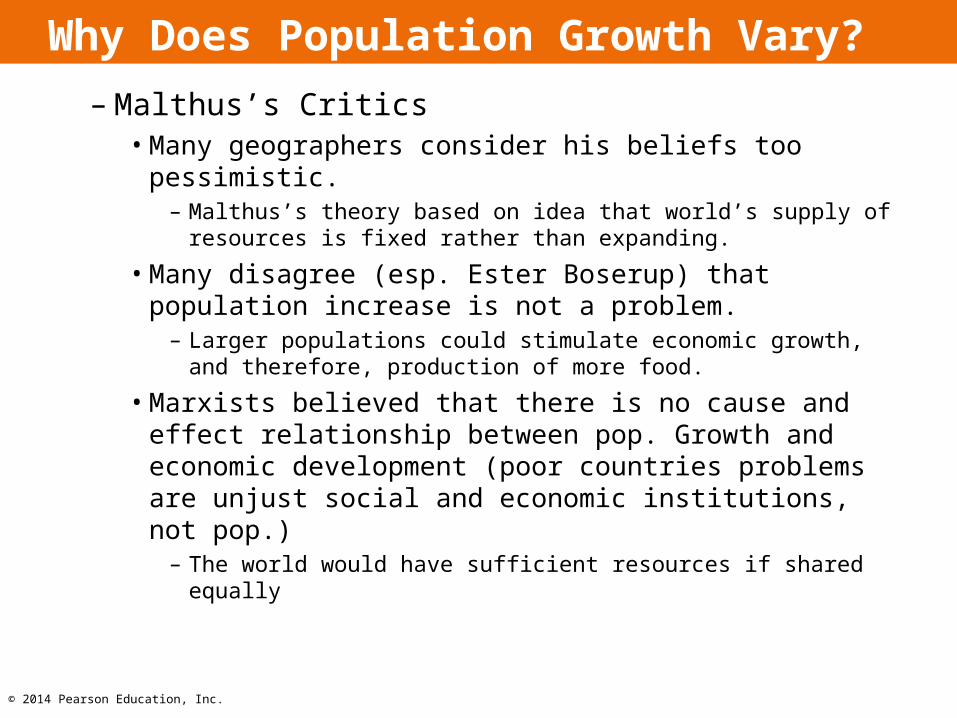
Why Does Population Growth Vary? Regions?– Malthus’s Critics
• Many geographers consider his beliefs too pessimistic.
– Malthus’s theory based on idea that world’s supply of resources is fixed rather than expanding.
• Many disagree (esp. Ester Boserup) that population increase is not a problem.
– Larger populations could stimulate economic growth, and therefore, production of more food.
• Marxists believed that there is no cause and effect relationship between pop. Growth and economic development (poor countries problems are unjust social and economic institutions, not pop.)
– The world would have sufficient resources if shared equally
© 2014 Pearson Education, Inc.
Why Does Population Growth Vary among Regions?
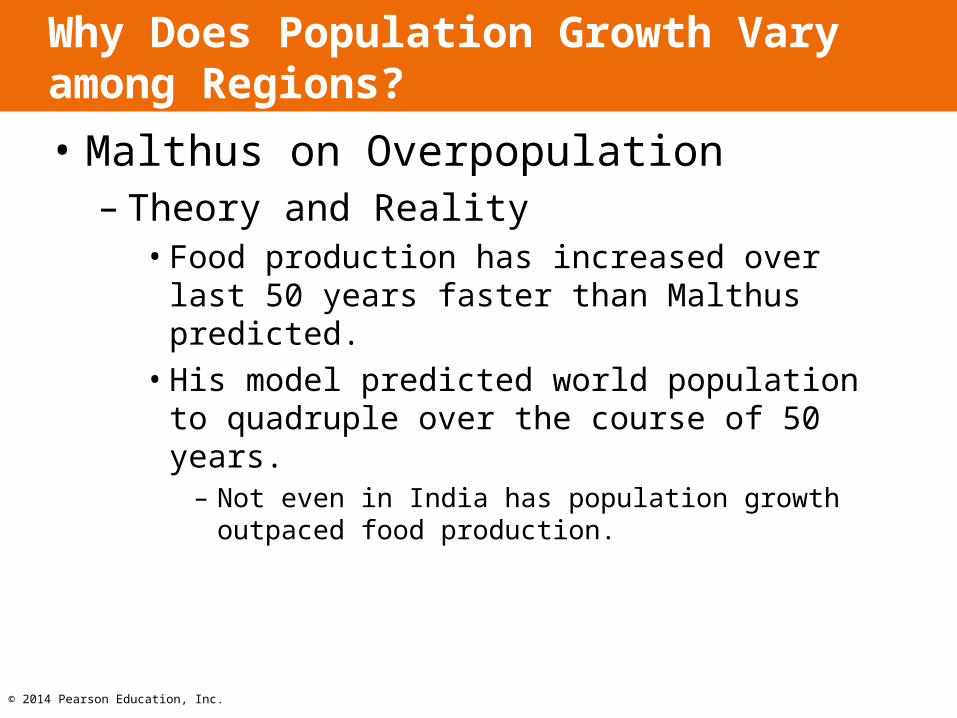
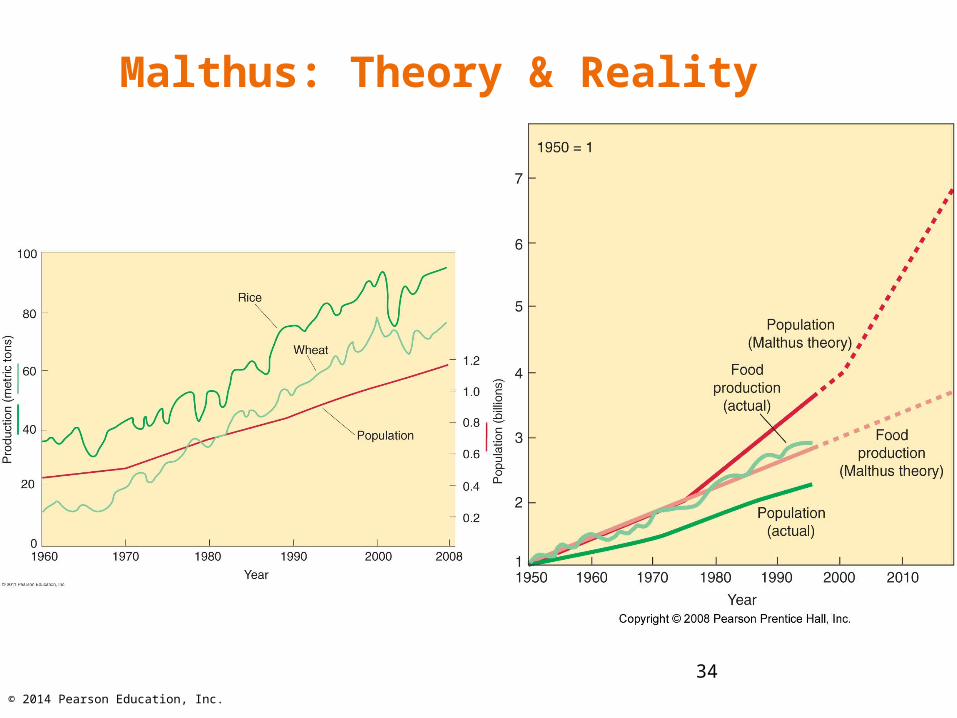
• Malthus on Overpopulation– Theory and Reality
• Food production has increased over last 50 years faster than Malthus predicted.
• His model predicted world population to quadruple over the course of 50 years.
– Not even in India has population growth outpaced food production.
Why Does Population Growth Vary among Regions?
© 2014 Pearson Education, Inc.
Malthus: Theory & Reality
Figure 2-25 34

© 2014 Pearson Education, Inc.
Why Does Population Growth Vary among Regions?
• Population Futures– Demographic Transition Possible Stage 5:
Decline• Characterized by…
– Very low CBR– Increasing CDR
» More elderly people than young persons– Negative NIR– Over time, few young women in child-bearing years
» Contributing to ever falling CBR
• Several European countries already have negative NIR.
– Russia is most notable hosting a negative NIR for 50 years.
Why Does Population Growth Vary among Regions?

© 2014 Pearson Education, Inc.
Types of Population Policies
Pro-natalist / Expansive
Anti-natalist / Restrictive

© 2014 Pearson Education, Inc.
U.S.S.R. - pro-natalist
Starting on July 8, 1944 the government of the U.S.S.R. began awarding medals to women in order to encourage a high fertility rate.

© 2014 Pearson Education, Inc.
China - anti-natalist
2 different programs in recent years
•Later, Longer, Fewer Policy
•One Child Policy
© 2014 Pearson Education, Inc.
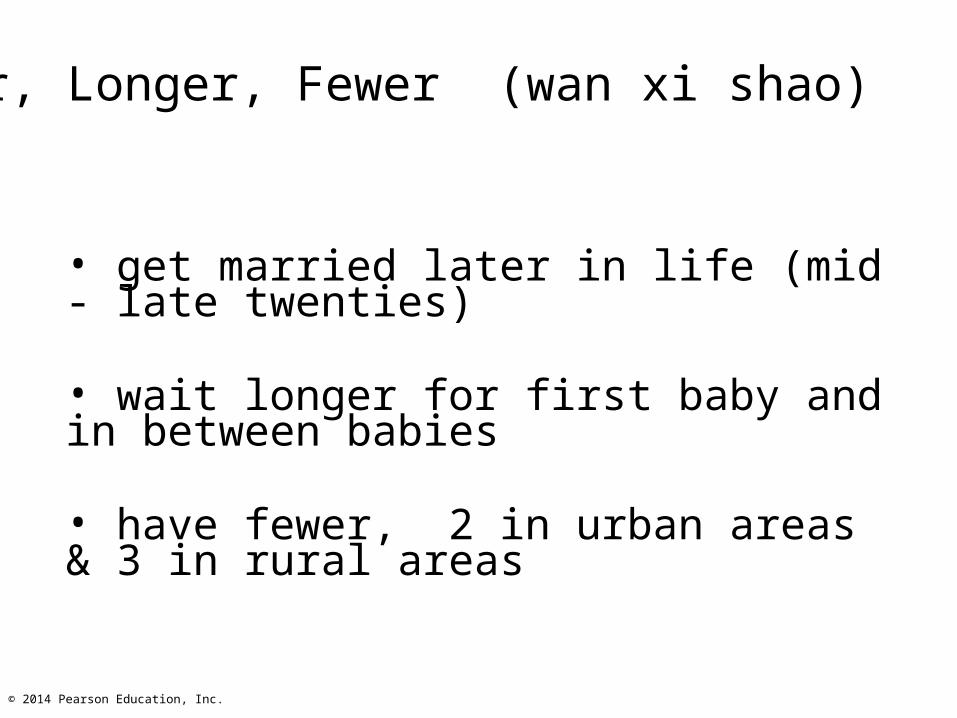
Later, Longer, Fewer (wan xi shao) 1971
• get married later in life (mid - late twenties)
• wait longer for first baby and in between babies
• have fewer, 2 in urban areas & 3 in rural areas
© 2014 Pearson Education, Inc.
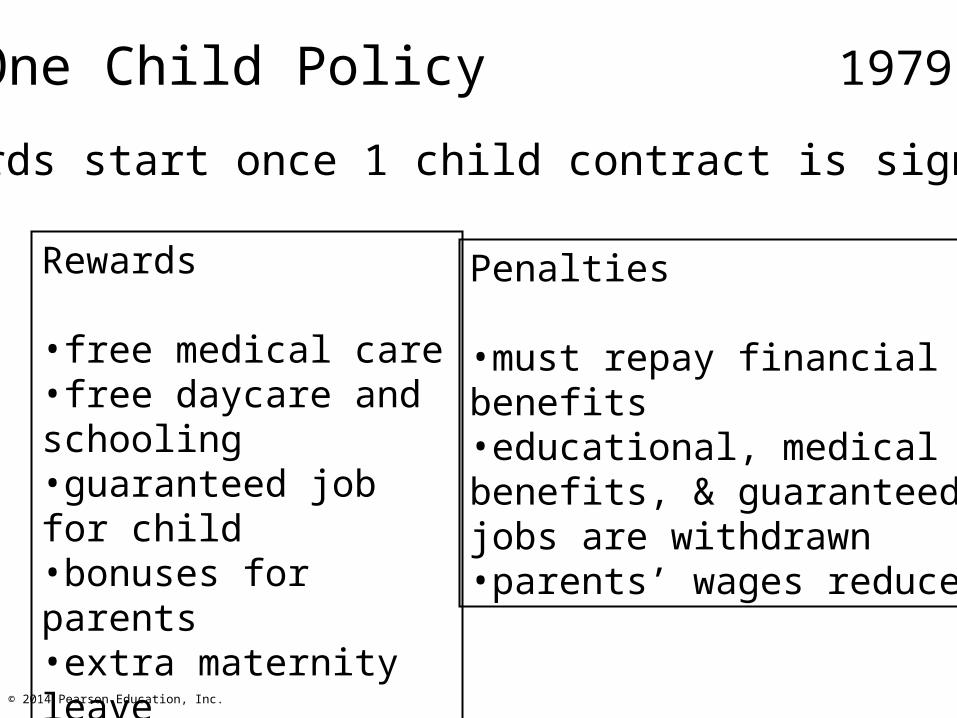
One Child Policy 1979
- rewards start once 1 child contract is signed
Rewards
•free medical care •free daycare and schooling•guaranteed job for child•bonuses for parents•extra maternity leave•better housing•bigger old age pension
Penalties
•must repay financial benefits•educational, medical benefits, & guaranteed jobs are withdrawn•parents’ wages reduced
© 2014 Pearson Education, Inc.
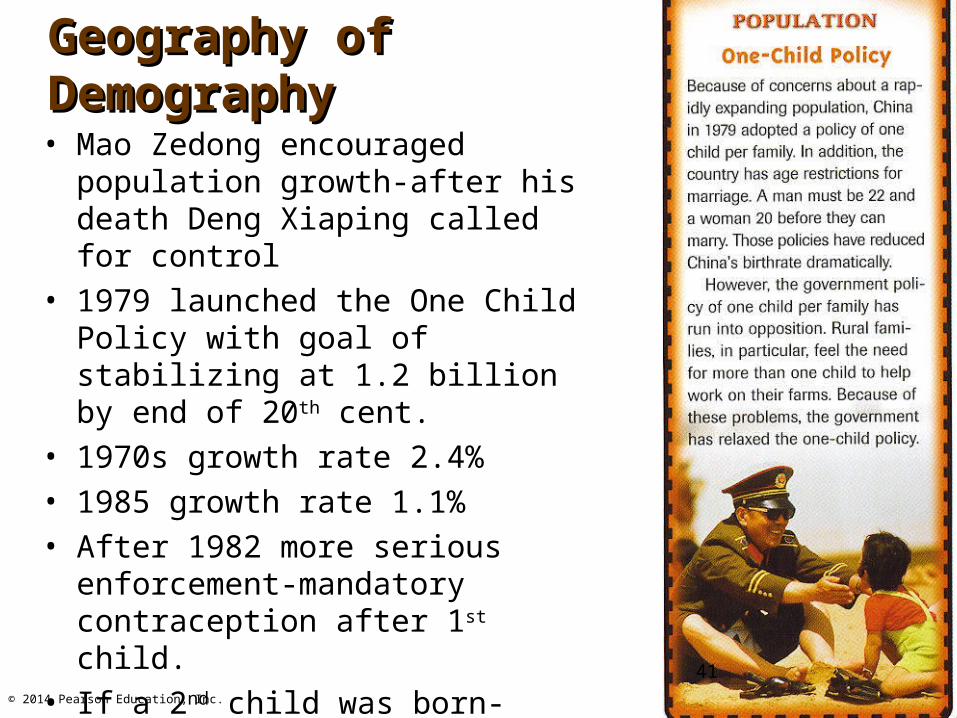
Geography of Geography of DemographyDemography• Mao Zedong encouraged
population growth-after his death Deng Xiaping called for control
• 1979 launched the One Child Policy with goal of stabilizing at 1.2 billion by end of 20th cent.
• 1970s growth rate 2.4%• 1985 growth rate 1.1%• After 1982 more serious
enforcement-mandatory contraception after 1st child.
• If a 2nd child was born-parents were sterilized.
41

© 2014 Pearson Education, Inc.
Geography of DemographyGeography of Demography
• Many rural Chinese defied rule, hid pregnant women, failed to register births, prevented inspectors from visiting rural villages.
• Government took drastic action:– Violators were fired– Land was confiscated– Lost all benefits– Pregnant women were
arrested & forced to have abortions
42

© 2014 Pearson Education, Inc.
Geography of DemographyGeography of Demography
• First 6 years 70 million abortions
• 1980s about 20 million sterilizations a year-3X as many women as men.
• Party Members were birth control police-got cash and promotion for enforcing the laws.
• 1984 One Child Policy was relaxed in the countryside-a couple with a daughter-2nd child after 4 years.
43
© 2014 Pearson Education, Inc.
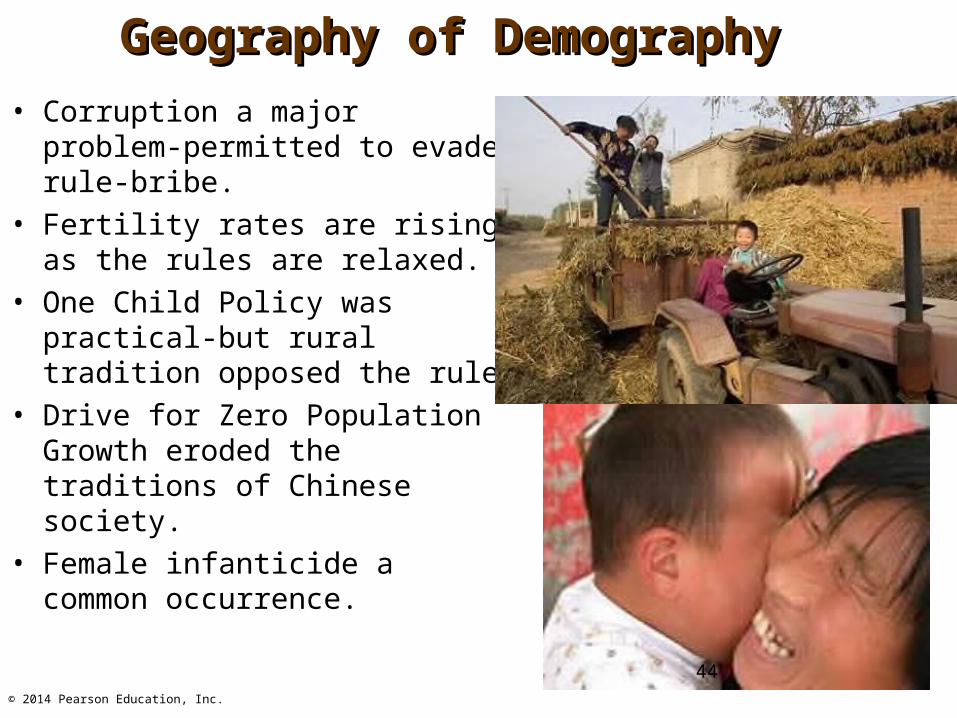
Geography of DemographyGeography of Demography
• Corruption a major problem-permitted to evade rule-bribe.
• Fertility rates are rising as the rules are relaxed.
• One Child Policy was practical-but rural tradition opposed the rule
• Drive for Zero Population Growth eroded the traditions of Chinese society.
• Female infanticide a common occurrence.
44

© 2014 Pearson Education, Inc.
KI #4 Why Do Some Regions Face Health Threats?
• Epidemiologic Transition– Medical researches have identified an
epidemiologic transition that focuses on distinct health threats in each stage of the demographic transition.
– Stage 1: Pestilence and Famine (High CDR)• Principal cause of death: infectious and parasitic
diseases– Ex. black plague (bubonic plague)

© 2014 Pearson Education, Inc.
Why Do Some Regions Face Health Threats?
• Epidemiologic Transition– Stage 2: Receding Pandemic (Rapidly
Declining CDR)• Pandemic is a disease that occurs over a wide
geographic area and affects a very high proportion of the population.
• Factors that reduced spread of disease, during the industrial revolution
– Improved sanitation– Improved nutrition– Improved medicine
• Famous cholera pandemic in London in mid nineteenth century.

© 2014 Pearson Education, Inc.
Why Do Some Regions Face Health Threats?
• Epidemiologic Transition– Stage 3: Degenerative Diseases (Moderately
Declining CDR)• Characterized by…
– Decrease in deaths from infectious diseases.– Increase in chronic disorders associated with aging.
» Cardiovascular diseases» Cancer
– Stage 4: Delayed Degenerative Diseases (Low but Increasing CDR)
• Characterized by…– Deaths caused by cardiovascular diseases and cancer delayed
because of modern medicine treatments.

© 2014 Pearson Education, Inc.
Why Do Some Regions Face Health Threats?
• Infectious Diseases– Reasons for Possible Stage 5
• Evolution– Infectious disease microbes evolve and establish a resistance to
drugs and insecticides.
– Antibiotics and genetic engineering contributes to the emergence of new strains of viruses and bacteria.
• Poverty– Infectious diseases are more prevalent in poor areas because of
presence of unsanitary conditions and inability to afford drugs needed for treatment.
• Increased Connections– Advancements in modes of transportation, especially air travel,
makes it easier for an individual infected in one country to be in another country before exhibiting symptoms.
© 2014 Pearson Education, Inc.
Why Do Some Regions Face Health Threats?
• Health Care– Health conditions vary around the world,
primarily, because countries possess different resources to care for people who are sick.
• Expenditures on Health Care– More than 15 percent of total government expenditures in
Europe and North America.– Less than 5 percent in sub-Saharan Africa and South Asia.
© 2014 Pearson Education, Inc.
Why Do Some Regions Face Health Threats?
• Health Care– Health Care Systems
• Developed Countries – Public service available at little or no cost.– Government pays more than 70 percent of health-care
costs in most European countries, and private individuals pay about 30 percent of the expense.
• Developing Countries– Private individuals must pay more than half of the cost of
health care.» U.S. is an exception to these generalizations, because private
individuals are required to pay about 55 percent of health care costs making it more closely resemble a developing country, in regards to health care.

© 2014 Pearson Education, Inc.
Summary
• Global population is concentrated in a few places that are not too wet, too dry, too cold, or too mountainous.
• Nearly all NIR is concentrated in developing countries.
• Developed countries have a stable population, if not slightly declining.
• Population growth varies among regions, because not all countries are in the same stage of the demographic transition model.
© 2014 Pearson Education, Inc.
Summary
• Intimately connected to the demographic transition model is the epidemiologic transition model that helps to explain why different regions face varying health threats.