© 2012 ernst & young, australia. all rights reserved. liability limited by a scheme approved...
TRANSCRIPT

© 2012 Ernst & Young, Australia. All Rights Reserved. Liability limited by a scheme approved under Professional Standards Legislation.
Tidying up to be NEAT
Clair Sullivan
Princess Alexandra Hospital
QuICR

© 2012 Ernst & Young, Australia. All Rights Reserved. Liability limited by a scheme approved under Professional Standards Legislation.
NEAT Team
• Dr Judy Flores – Chair, Division of Medicine• A/Prof Ian Scott – Director, Internal Medicine• Dr Andrew Staib – Deputy Director, Emergency
Medicine• Dr James Collier – Deputy Director, Emergency
Medicine• Dr Leena Aggarwal – Director, MAPU• Mr Alan Scanlon - Clinical Data Support, Patient
Flow Unit• Dr Georga Cooke - Medical Admin Registrar
© 2012 Ernst & Young, Australia. All Rights Reserved. Liability limited by a scheme approved under Professional Standards Legislation.
Background

© 2012 Ernst & Young, Australia. All Rights Reserved. Liability limited by a scheme approved under Professional Standards Legislation.
What is NEAT?
• National Emergency Access Target
• Aim to have people discharged from hospital or admitted to the ward within 4 hrs of triage
• Goal is 77% this year
• We started off at 33%....

© 2012 Ernst & Young, Australia. All Rights Reserved. Liability limited by a scheme approved under Professional Standards Legislation.
Wooden spoon
Courier Mail14/12/12
NHPA report2011-12
© 2012 Ernst & Young, Australia. All Rights Reserved. Liability limited by a scheme approved under Professional Standards Legislation.
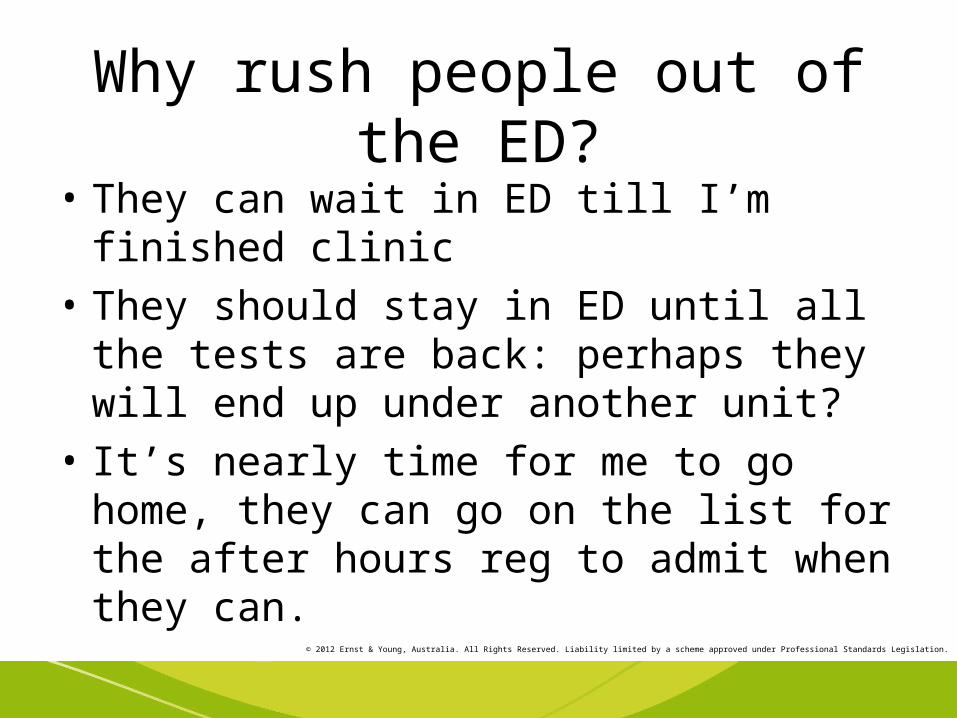
Why rush people out of the ED?
• They can wait in ED till I’m finished clinic
• They should stay in ED until all the tests are back: perhaps they will end up under another unit?
• It’s nearly time for me to go home, they can go on the list for the after hours reg to admit when they can.

© 2012 Ernst & Young, Australia. All Rights Reserved. Liability limited by a scheme approved under Professional Standards Legislation.
• I might miss something if I accept them from ED without all the tests back

© 2012 Ernst & Young, Australia. All Rights Reserved. Liability limited by a scheme approved under Professional Standards Legislation.
Cautionary tales
• Time to disposition plan <4 h associated with 57% increase in mortality in general medicine patients, corrected for age, gender and triage category– No increased risk with ED LOS <8 h
» Mitra et al Intern Med J 2012
• Increase in proportion of admitted GM patients– lower triage score (ATS 4) (29.2% vs 21.9%; p<0.001).– aged less than 50 years (9.4% vs 7.8%; p=0.01)– patients with low triage scores (ATS 4 and 5) increased LOS
• Adjusted median 6.0 days vs 5.2 days (p=0.008)» Nash et al RMH 2013

© 2012 Ernst & Young, Australia. All Rights Reserved. Liability limited by a scheme approved under Professional Standards Legislation.
Harms of ED access block and overcrowding
• Length of ED stay independently predicts inpatient LOS.
– Average excess LOS for inpatients: 0.39 days for ED LOS ≤4 hrs; 2.35 days for ED LOS >12 hrs
» Liew et al Med J Aust 2003
• 34% increase in risk of death at 10 days among admitted patients presenting during periods of ED overcrowding
» Richardson Med J Aust 2006
• ED overcrowding in Perth’s three tertiary hospitals associated with an estimated excess 120 deaths in 2003
» Sprivulis et al Med J Aust 2006
• Among patients well enough to leave ED after being seen, longer ED LOS (≥6 hrs) compared to shorter LOS (<1 hr) resulted in 80% increase in death and 100% increase in admission at 7 days in high acuity patients
» Guttmann et al BMJ 2011
• Increased readmissions and ED return visits; inappropriate follow up care (discharge planning)
» Forero & Hillman, ‘Access block and overcrowding: A literature review’, Prepared for Australasian College of Emergency Medicine
• Prolonged pain, patient/carer dissatisfaction, violence, ambulance diversions/ramping, reduced efficiency
» Derlet & Richards Ann Emerg Med 2000
© 2012 Ernst & Young, Australia. All Rights Reserved. Liability limited by a scheme approved under Professional Standards Legislation.
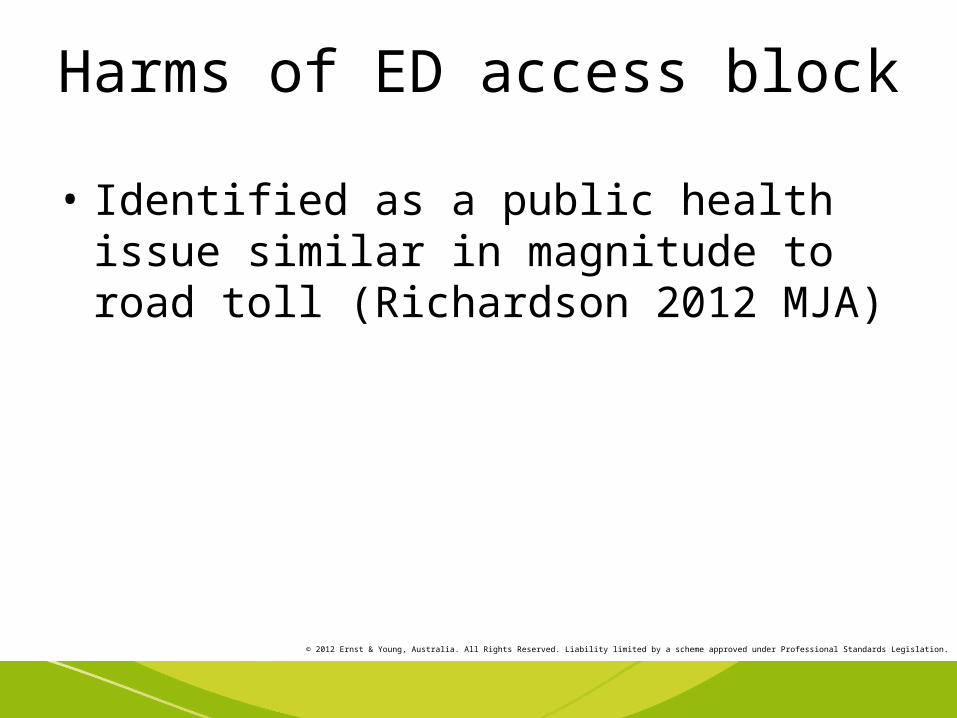
Harms of ED access block
• Identified as a public health issue similar in magnitude to road toll (Richardson 2012 MJA)

© 2012 Ernst & Young, Australia. All Rights Reserved. Liability limited by a scheme approved under Professional Standards Legislation.
Clinical Access and Redesign Unit Queensland Institute of Clinical Redesign
Existing Patient Journey
© 2012 Ernst & Young, Australia. All Rights Reserved. Liability limited by a scheme approved under Professional Standards Legislation.
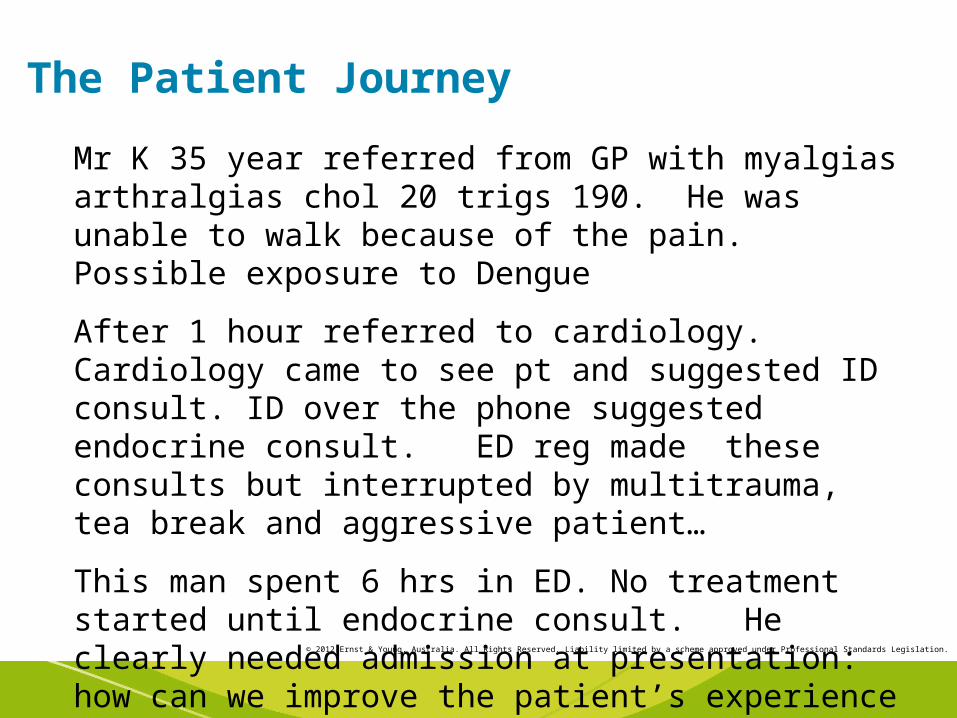
The Patient Journey
Mr K 35 year referred from GP with myalgias arthralgias chol 20 trigs 190. He was unable to walk because of the pain. Possible exposure to Dengue
After 1 hour referred to cardiology. Cardiology came to see pt and suggested ID consult. ID over the phone suggested endocrine consult. ED reg made these consults but interrupted by multitrauma, tea break and aggressive patient…
This man spent 6 hrs in ED. No treatment started until endocrine consult. He clearly needed admission at presentation: how can we improve the patient’s experience and our efficiency?
© 2012 Ernst & Young, Australia. All Rights Reserved. Liability limited by a scheme approved under Professional Standards Legislation.
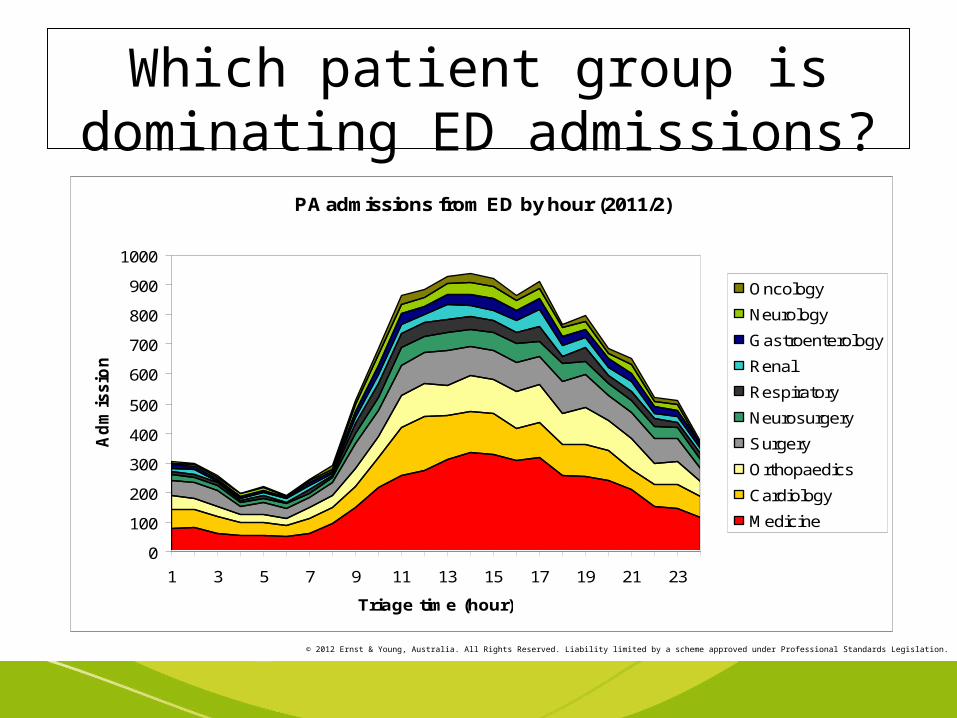
Which patient group is dominating ED admissions?PA admissions from ED by hour (2011/2)
0
100
200
300
400
500
600
700
800
900
1000
1 3 5 7 9 11 13 15 17 19 21 23
Triage time (hour)
Ad
mis
sio
ns
Oncology
Neurology
Gastroenterology
Renal
Respiratory
Neurosurgery
Surgery
Orthopaedics
Cardiology
Medicine

© 2012 Ernst & Young, Australia. All Rights Reserved. Liability limited by a scheme approved under Professional Standards Legislation.
Start with the patient journey

© 2012 Ernst & Young, Australia. All Rights Reserved. Liability limited by a scheme approved under Professional Standards Legislation.
Factors causing NEAT non-compliance for admissions

© 2012 Ernst & Young, Australia. All Rights Reserved. Liability limited by a scheme approved under Professional Standards Legislation.
The POO index: PAH occupancy correlates with NEAT Non-compliance
© 2012 Ernst & Young, Australia. All Rights Reserved. Liability limited by a scheme approved under Professional Standards Legislation.
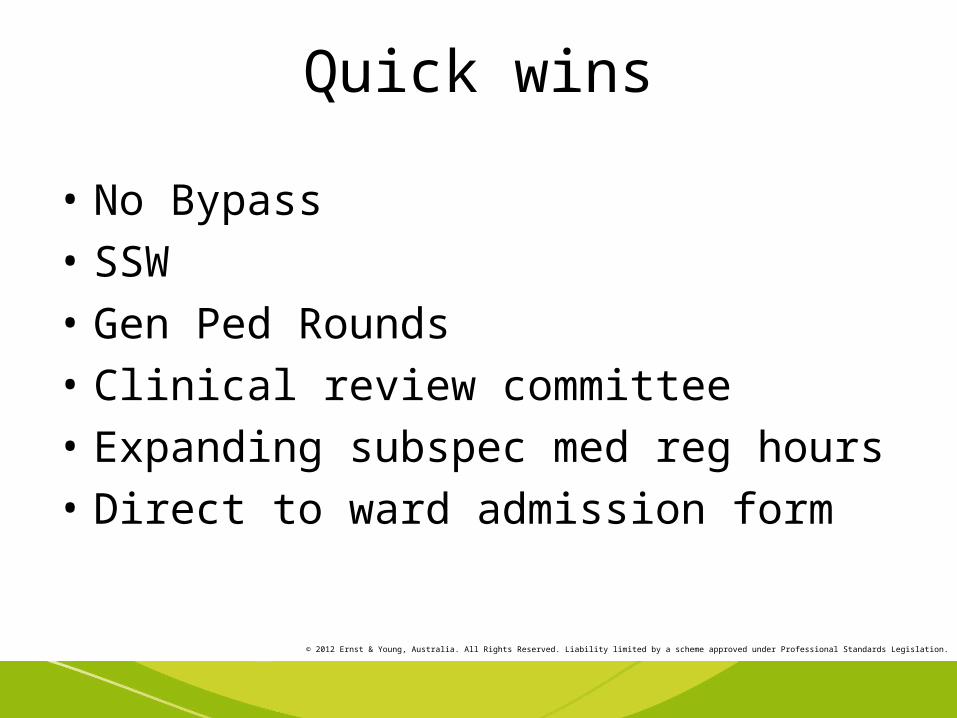
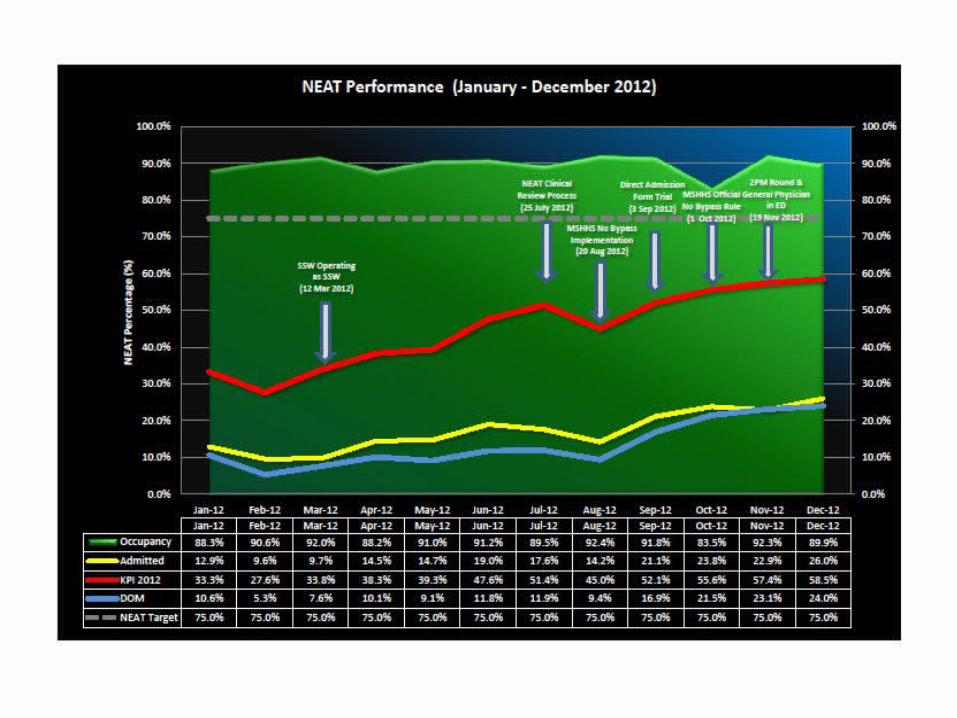
Quick wins
• No Bypass
• SSW
• Gen Ped Rounds
• Clinical review committee
• Expanding subspec med reg hours
• Direct to ward admission form

© 2012 Ernst & Young, Australia. All Rights Reserved. Liability limited by a scheme approved under Professional Standards Legislation.
© 2012 Ernst & Young, Australia. All Rights Reserved. Liability limited by a scheme approved under Professional Standards Legislation.
Direct to ward admission form
• Adopted at MCH RBH
© 2012 Ernst & Young, Australia. All Rights Reserved. Liability limited by a scheme approved under Professional Standards Legislation.
© 2012 Ernst & Young, Australia. All Rights Reserved. Liability limited by a scheme approved under Professional Standards Legislation.
Obviously a complex issue..
Problem
• Innovations required to improve NEAT performance previously substantially hindered due to differing opinions among clinical areas
Solution
• Objective data: enlist a data analyst and a love of graphs

© 2012 Ernst & Young, Australia. All Rights Reserved. Liability limited by a scheme approved under Professional Standards Legislation.
Safety reviews
• Weekly NEAT review meetings– DOM chair– Director of Internal
Medicine– Director, MAPU– Deputy Director, ED– Senior medical
registrar– ADON
© 2012 Ernst & Young, Australia. All Rights Reserved. Liability limited by a scheme approved under Professional Standards Legislation.
Analysis of Key Issues and Causes
© 2012 Ernst & Young, Australia. All Rights Reserved. Liability limited by a scheme approved under Professional Standards Legislation.
• So what are the characteristics of those patients who are breaching NEAT?
• Can we predict their NEAT risk at triage and expedite their journey? (save time, lives and money)
© 2012 Ernst & Young, Australia. All Rights Reserved. Liability limited by a scheme approved under Professional Standards Legislation.
PAN-C study
• Princess Alexandra Hospital NEAT Compliance Study
• Funded by MACRO Neat

© 2012 Ernst & Young, Australia. All Rights Reserved. Liability limited by a scheme approved under Professional Standards Legislation.
PAN-C Aim
• To identify predictors of NEAT non-compliance in patients being admitted to DOM via ED
© 2012 Ernst & Young, Australia. All Rights Reserved. Liability limited by a scheme approved under Professional Standards Legislation.
PAN-C Methods
• Real time chart audit
• Experienced practising clinician auditing

© 2012 Ernst & Young, Australia. All Rights Reserved. Liability limited by a scheme approved under Professional Standards Legislation.
PAN-C Results
• 38 admissions analysed (full 24hours quota of DOM admissions)
• 9 of 38 compliant
• 29 were noncompliant

© 2012 Ernst & Young, Australia. All Rights Reserved. Liability limited by a scheme approved under Professional Standards Legislation.
9
29
NEAT Compliance of DOM inpatients
Neat Compliant
Non-Neat Compliant
© 2012 Ernst & Young, Australia. All Rights Reserved. Liability limited by a scheme approved under Professional Standards Legislation.
• chest pain and SOB account for half these patients

© 2012 Ernst & Young, Australia. All Rights Reserved. Liability limited by a scheme approved under Professional Standards Legislation.
Where in the Patient Journey is NEAT being Breached?
0
1
2
3
4
5
6
7
8
9
10
ED Rev to Med Ref Med Ref to Med Rev Med Rev to Bed Req Bed Req to Dep
Time point in Journey that NEAT is breached
Num
ber o
f Pat
ient
s
DOM inpatients n=29
© 2012 Ernst & Young, Australia. All Rights Reserved. Liability limited by a scheme approved under Professional Standards Legislation.
PAN-C Results
• Mean age both groups 65 years
• No sig differences (p>0.1) between groups according to age, number of comorbidities, number of drugs, residential care status or mobility impairment

© 2012 Ernst & Young, Australia. All Rights Reserved. Liability limited by a scheme approved under Professional Standards Legislation.
Multiple Inpatient Referrals
• In NC group: 1 of 9 11%
• In NNC group: 7 of 19 37%

© 2012 Ernst & Young, Australia. All Rights Reserved. Liability limited by a scheme approved under Professional Standards Legislation.
QAS and NEAT Compliance
• Association with NEAT compliance was significant for arrival by non-QAS means (p=0.04)

© 2012 Ernst & Young, Australia. All Rights Reserved. Liability limited by a scheme approved under Professional Standards Legislation.
Factors causing NEAT non-compliance for admissions
Preliminary data from PAN-C study chart review (n=38; 29 non-compliant; 9 compliant)• Mean age both groups 65 years• No sig. differences (p>0.1) between groups according to
age, number of co-morbidities, number of drugs, residential care status or mobility impairment
Factor Compliant Non-compliant p
Inpatient team aware of referral
33% 7% 0.08
Non-QAS arrival 67% 25% 0.04
Referral to ED 39% 78% 0.06
© 2012 Ernst & Young, Australia. All Rights Reserved. Liability limited by a scheme approved under Professional Standards Legislation.
PAN-C Discussion
Interesting association of multiple inpatient referrals with NNC
© 2012 Ernst & Young, Australia. All Rights Reserved. Liability limited by a scheme approved under Professional Standards Legislation.
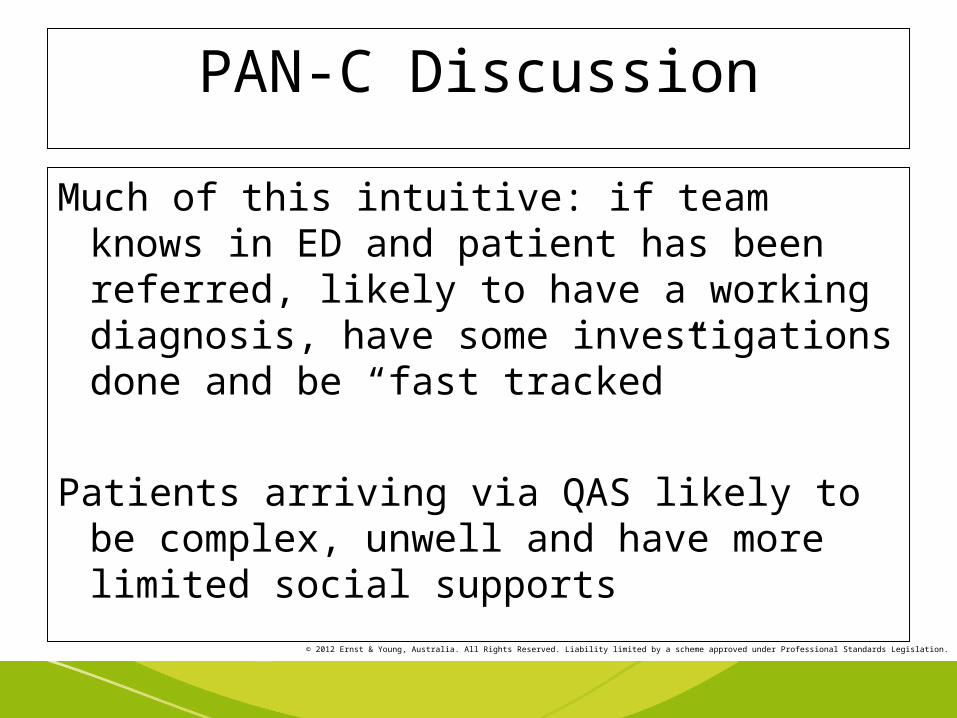
PAN-C Discussion
Much of this intuitive: if team knows in ED and patient has been referred, likely to have a working diagnosis, have some investigations done and be “fast tracked”
Patients arriving via QAS likely to be complex, unwell and have more limited social supports

© 2012 Ernst & Young, Australia. All Rights Reserved. Liability limited by a scheme approved under Professional Standards Legislation.
PAN-C
• More data and multivariate analysis to identify more predicators of NEAT non-compliance
• Analysis of those breaching early and those with extended stays
• Analysis of large diagnoses groups (chest pain and SOB account for half these patients)
• Considering the process of multiple inpatient referrals
• Verifying the model• Applying the model
© 2012 Ernst & Young, Australia. All Rights Reserved. Liability limited by a scheme approved under Professional Standards Legislation.
Have our quick wins been safe?

© 2012 Ernst & Young, Australia. All Rights Reserved. Liability limited by a scheme approved under Professional Standards Legislation.
Safety indicators
√ MRSA infection rates unchanged√ Sentinel events unchanged? Unplanned transfers to ICU <24 hrs ED admission√ Did not wait - 6% to 1%

© 2012 Ernst & Young, Australia. All Rights Reserved. Liability limited by a scheme approved under Professional Standards Legislation.
Have our quick wins saved us any money?
© 2012 Ernst & Young, Australia. All Rights Reserved. Liability limited by a scheme approved under Professional Standards Legislation.
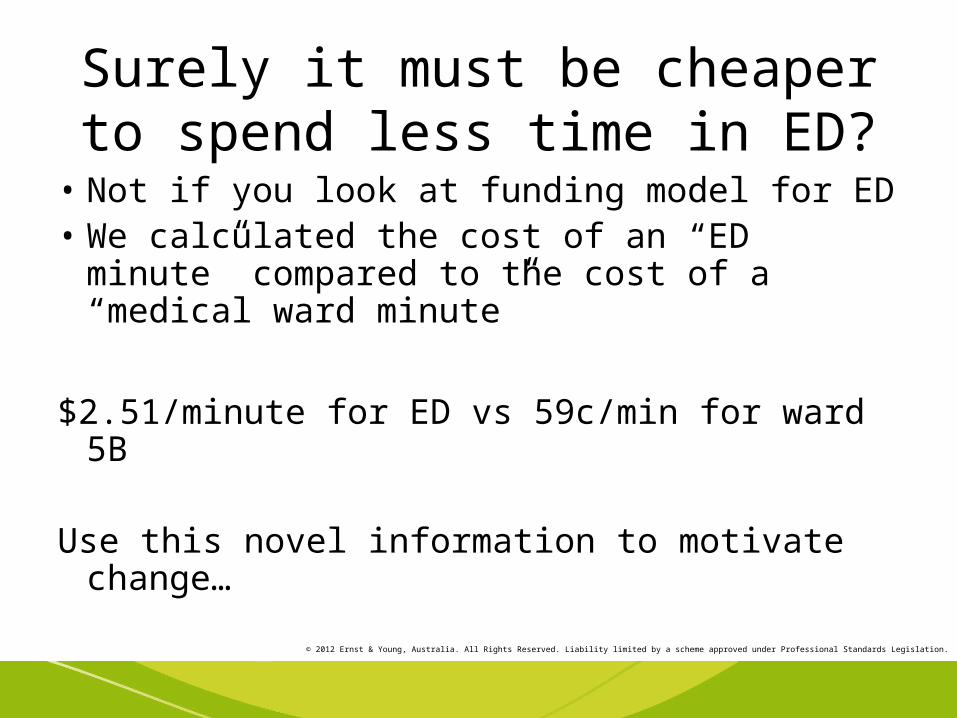
Surely it must be cheaper to spend less time in ED?
• Not if you look at funding model for ED• We calculated the cost of an “ED minute”
compared to the cost of a “medical ward minute”
$2.51/minute for ED vs 59c/min for ward 5B
Use this novel information to motivate change…
© 2012 Ernst & Young, Australia. All Rights Reserved. Liability limited by a scheme approved under Professional Standards Legislation.
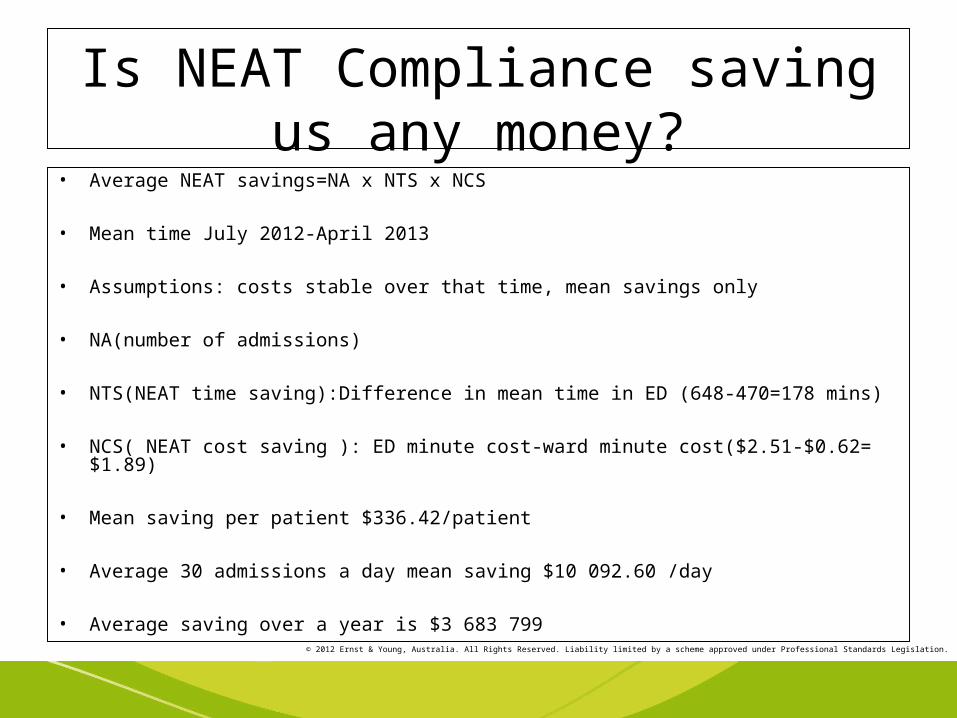
Is NEAT Compliance saving us any money?
• Average NEAT savings=NA x NTS x NCS
• Mean time July 2012-April 2013
• Assumptions: costs stable over that time, mean savings only
• NA(number of admissions)
• NTS(NEAT time saving):Difference in mean time in ED (648-470=178 mins)
• NCS( NEAT cost saving ): ED minute cost-ward minute cost($2.51-$0.62= $1.89)
• Mean saving per patient $336.42/patient
• Average 30 admissions a day mean saving $10 092.60 /day
• Average saving over a year is $3 683 799
© 2012 Ernst & Young, Australia. All Rights Reserved. Liability limited by a scheme approved under Professional Standards Legislation.
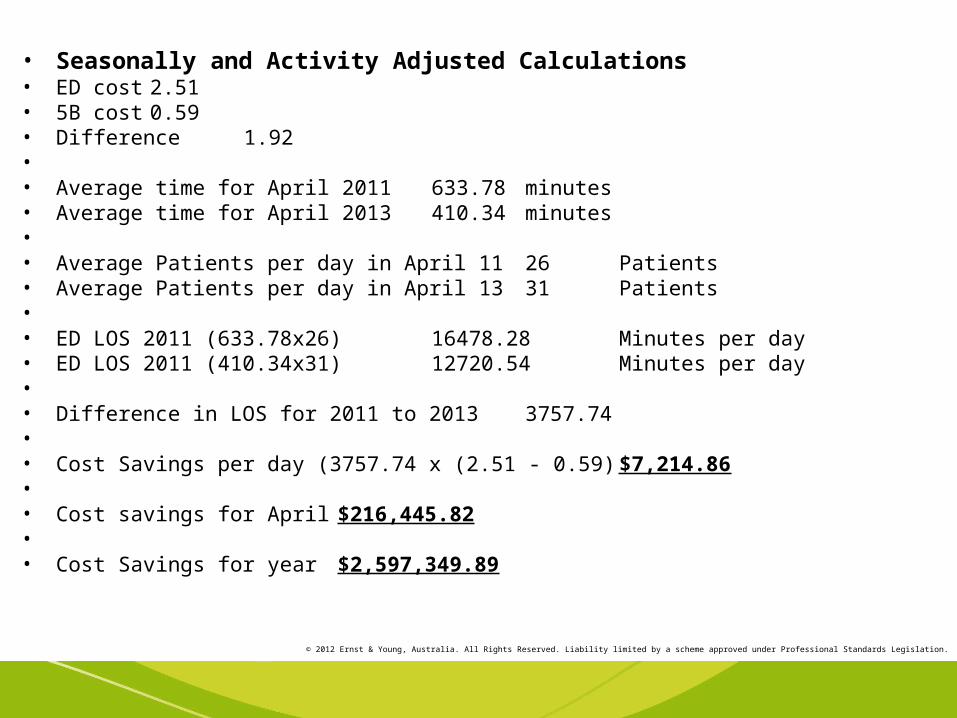
• Seasonally and Activity Adjusted Calculations• ED cost 2.51• 5B cost 0.59• Difference 1.92•• Average time for April 2011 633.78 minutes• Average time for April 2013 410.34 minutes•• Average Patients per day in April 11 26 Patients• Average Patients per day in April 13 31 Patients•• ED LOS 2011 (633.78x26) 16478.28 Minutes per day• ED LOS 2011 (410.34x31) 12720.54 Minutes per day•• Difference in LOS for 2011 to 2013 3757.74•• Cost Savings per day (3757.74 x (2.51 - 0.59) $7,214.86•• Cost savings for April $216,445.82•• Cost Savings for year $2,597,349.89
© 2012 Ernst & Young, Australia. All Rights Reserved. Liability limited by a scheme approved under Professional Standards Legislation.
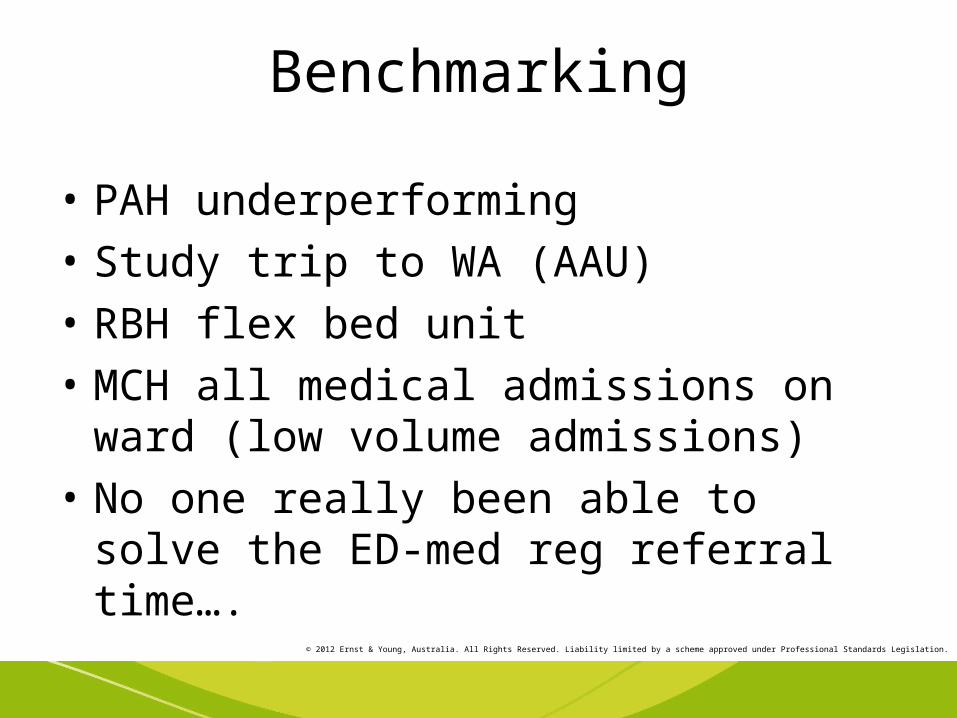
Benchmarking
• PAH underperforming
• Study trip to WA (AAU)
• RBH flex bed unit
• MCH all medical admissions on ward (low volume admissions)
• No one really been able to solve the ED-med reg referral time….
© 2012 Ernst & Young, Australia. All Rights Reserved. Liability limited by a scheme approved under Professional Standards Legislation.
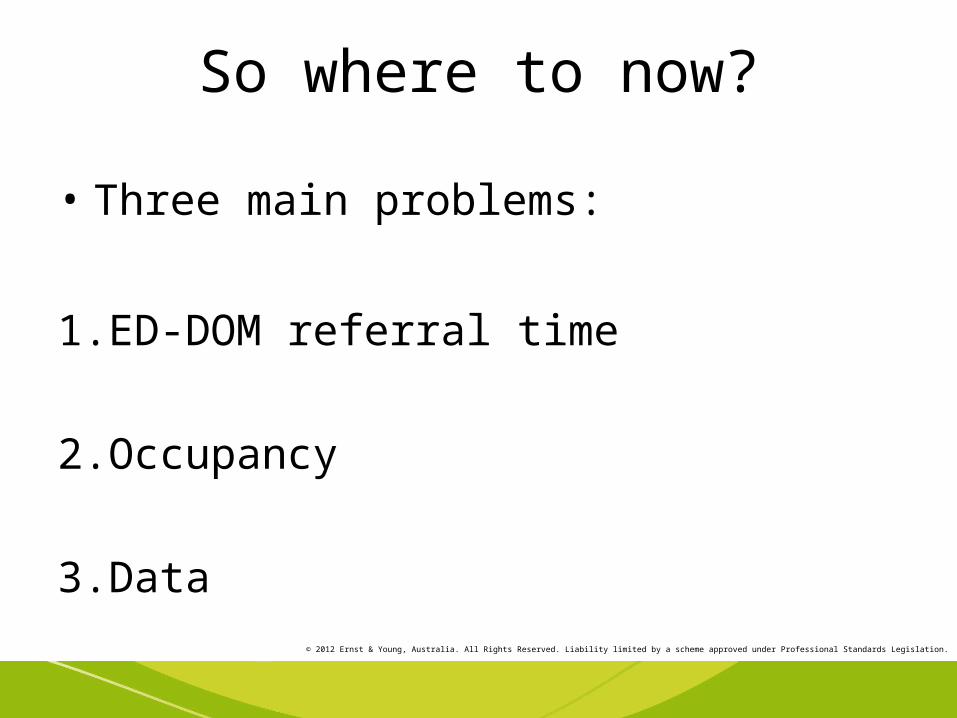
So where to now?
• Three main problems:
1.ED-DOM referral time
2.Occupancy
3.Data

© 2012 Ernst & Young, Australia. All Rights Reserved. Liability limited by a scheme approved under Professional Standards Legislation.
Agreed Principles for Solution Design
• Keep the patient at the centre of our solution
• Evidence based
• Efficient (training, financial consideration)
• Ongoing review and safety monitoring
© 2012 Ernst & Young, Australia. All Rights Reserved. Liability limited by a scheme approved under Professional Standards Legislation.
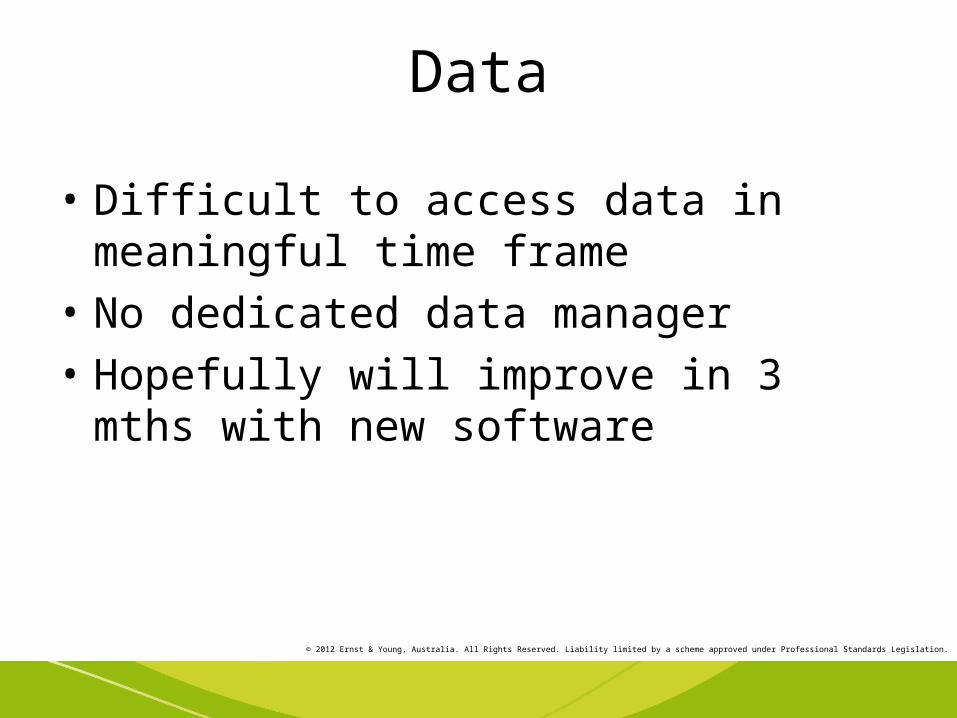
Data
• Difficult to access data in meaningful time frame
• No dedicated data manager
• Hopefully will improve in 3 mths with new software
© 2012 Ernst & Young, Australia. All Rights Reserved. Liability limited by a scheme approved under Professional Standards Legislation.
Occupancy
• Strategies underway to improve patient discharges
• Difficult because of tension between NEAT and NEST
Strategies include:
HITH, public private partnerships, predictive bed management and the “stranded patient” project

© 2012 Ernst & Young, Australia. All Rights Reserved. Liability limited by a scheme approved under Professional Standards Legislation.
ED-DOM referral time
• Median approx 200mins
• This makes med reg review and bed allocation within 240 mins unlikely
• Difficult to improve this time without major ED process changes (“process mapped to death at RBH)
• MAZE (Medical Admission Zone)

© 2012 Ernst & Young, Australia. All Rights Reserved. Liability limited by a scheme approved under Professional Standards Legislation.
MAZE
What?
• Patients likely to need ED admission are admitted to MAZE to continue ED review and refer to med reg
• PANC data used to help identify early
• MAZE cleaved from MAPU
• MAZE beds have same priority as ED for bed booking
© 2012 Ernst & Young, Australia. All Rights Reserved. Liability limited by a scheme approved under Professional Standards Legislation.
• A recent innovation at RBH is the introduction of flex beds (8 beds 3 trolleys)in an area similar to a transit lounge where patients who have been referred to the medical registrar await admission (under the governance of the inpatient unit). A similar unit at GCH has attracted recent negative media exposure although the true nature of issues there remain unclear.
© 2012 Ernst & Young, Australia. All Rights Reserved. Liability limited by a scheme approved under Professional Standards Legislation.
MAZE
• Cost?
• Minimal mostly related to increased bed turnover (cleaning etc)
© 2012 Ernst & Young, Australia. All Rights Reserved. Liability limited by a scheme approved under Professional Standards Legislation.
MAZE
How?
• Pilot study: convert 4 MAPU beds to MAZE then review after 6 weeks
• Priority area (radiology, pathology, beds)
• Strict safety monitoring
• ED-MAZE vs DOM-MAZE

© 2012 Ernst & Young, Australia. All Rights Reserved. Liability limited by a scheme approved under Professional Standards Legislation.
ED-MAZE
• There would be no change in the governance of the patients moved to this unit until seen and accepted by the medical registrar (exactly the same process as now).
• The beds would be staffed by MAPU or ED nurses and the patients cared for by the ED medical team until seen by the medical registrar.
• It is imperative that beds booked from MAZE have precedence for allocation or the proposal will fail. It is anticipated most patients will remain in MAZE for 2-3 hours

© 2012 Ernst & Young, Australia. All Rights Reserved. Liability limited by a scheme approved under Professional Standards Legislation.
Risks of ED-MAZE
• Loss of MAPU beds for other purposes (although 84% occupancy much of the time currently)
• Bed block in MAZE
• Need to be clear about governance

© 2012 Ernst & Young, Australia. All Rights Reserved. Liability limited by a scheme approved under Professional Standards Legislation.
Benefits of ED-MAZE
• Improved time-motion for admitting after hours med reg
• Improved medical inpatient NEAT performance

© 2012 Ernst & Young, Australia. All Rights Reserved. Liability limited by a scheme approved under Professional Standards Legislation.
DOM-MAZE
• In this model the MAPU will be converted to an Acute Admitting Unit similar to those we have reviewed in WA. ED would decide that a patient is likely to need medical admission and transfer to DOM-MAZE. It is likely only basic investigations would be undertaken in ED prior to transfer to DOM-MAZE.
© 2012 Ernst & Young, Australia. All Rights Reserved. Liability limited by a scheme approved under Professional Standards Legislation.
DOM-MAZE
• Part time or full time?
• Once transferred to DOM-MAZE, the patients would become the responsibility of DOM. This would require an increase in DOM resources.
© 2012 Ernst & Young, Australia. All Rights Reserved. Liability limited by a scheme approved under Professional Standards Legislation.
Risks of DOM-MAZE
• Loss of MAPU beds for other purposes (although 84% occupancy much of the time currently)
• Bed block in DOM- MAZE • Need to be clear about governance• Loss of continuity for patients admitted by one registrar than cared
for by another (although this is usual currently for those admitted outside business hours). This could be minimised by calling subspec registrars for admissions to their unit to be done in DOM-MAZE or the patient being transferred from DOM-MAZE to the appropriate inpatient ward.
• Potential confusion regarding subspecialty vs gen med admission for some patients
• Very sick or non-medical patients being transferred to DOM-MAZE by ED
© 2012 Ernst & Young, Australia. All Rights Reserved. Liability limited by a scheme approved under Professional Standards Legislation.
Benefits of DOM-MAZE
• Patients receive DOM care earlier
• Improved time-motion for admitting after hours med reg
• Improved medical inpatient NEAT performance
• New resources for DOM
• Research and teaching opportunities for DOM
© 2012 Ernst & Young, Australia. All Rights Reserved. Liability limited by a scheme approved under Professional Standards Legislation.
Critical Success Factors
• Support from team
• Support from exec
• Maintaining patient safety
• Budget
• Remaining patient focussed
• Good communication and engagement with our team

© 2012 Ernst & Young, Australia. All Rights Reserved. Liability limited by a scheme approved under Professional Standards Legislation.
Potential Problems
• Understand a complex problem and reaching consensus for action
• Budget (our cost benefit analysis may help here)
• Accessible and timely data to assess performance
• Initiating and maintaining change
© 2012 Ernst & Young, Australia. All Rights Reserved. Liability limited by a scheme approved under Professional Standards Legislation.
Next Steps
• PANC risk generation engine• MAZE pilot • Data management• Occupancy strategies• Patient experiences
• Ongoing weekly review safety and costs analysis
© 2012 Ernst & Young, Australia. All Rights Reserved. Liability limited by a scheme approved under Professional Standards Legislation.
The Patient Journey
Mr K 35 year referred from GP with myalgias arthralgias chol 20 trigs 190. He was unable to walk because of the pain. Possible exposure to Dengue
After 1 hour and basic bloods the decision made by ED that he will likely need admission.
Discharged to MAZE and med reg reviews within 2 hours and treatment commenced.

© 2012 Ernst & Young, Australia. All Rights Reserved. Liability limited by a scheme approved under Professional Standards Legislation.
Onwards and Upwards…
© 2012 Ernst & Young, Australia. All Rights Reserved. Liability limited by a scheme approved under Professional Standards Legislation.
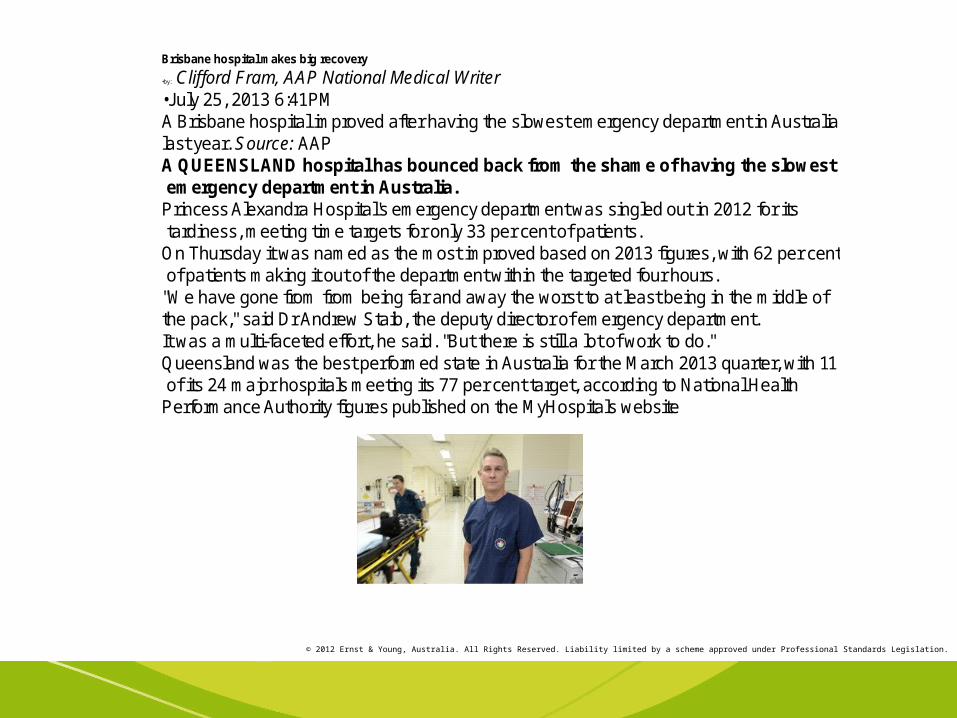
Brisbane hospital makes big recovery
•by: Clifford Fram, AAP National Medical Writer•July 25, 2013 6:41PM A Brisbane hospital improved after having the slowest emergency department in Australia last year. Source: AAP A QUEENSLAND hospital has bounced back from the shame of having the slowestemergency department in Australia.
Princess Alexandra Hospital's emergency department was singled out in 2012 for itstardiness, meeting time targets for only 33 per cent of patients.
On Thursday it was named as the most improved based on 2013 figures, with 62 per centof patients making it out of the department within the targeted four hours.
"We have gone from from being far and away the worst to at least being in the middle of the pack," said Dr Andrew Staib, the deputy director of emergency department.It was a multi-faceted effort, he said. "But there is still a lot of work to do."Queensland was the best performed state in Australia for the March 2013 quarter, with 11of its 24 major hospitals meeting its 77 per cent target, according to National Health
Performance Authority figures published on the MyHospitals website