© 2011 pearson education, inc. t3/5/2014 variances in development (ch. 9.1 – pp. 272-281)
TRANSCRIPT
© 2011 Pearson Education, Inc.
T3/5/2014
Variances in Development
(Ch. 9.1 – pp. 272-281)

© 2011 Pearson Education, Inc.
Intro• Development = The process of improving
the material conditions of people through the diffusion of knowledge and technology
• More developed countries (MDCs)– aka developed countries
• Lesser developed countries (LDCs)– aka emerging or developing countries

© 2011 Pearson Education, Inc.
I. Economic Indicators of Development
A. The Human Development Index (HDI)– U.N. uses four (4) factors to assess a country’s
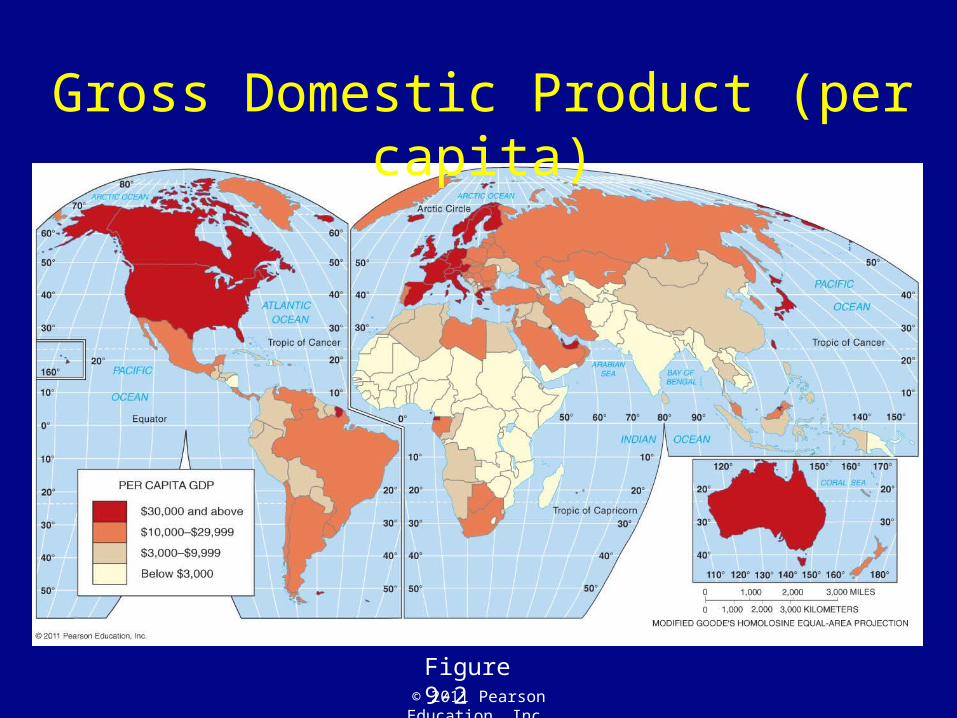
level of development:• Economic = (1) gross domestic product (GDP) per
capita – – total output of goods for country– measures relative wealth of country
• Social = (2) literacy and (3) amount of education
• Demographic = (4) life expectancy

© 2011 Pearson Education, Inc.
Human Development Index
Figure 9-1

© 2011 Pearson Education, Inc.
I. Economic Indicators of Development (cont.)
– B. Types of jobs• Primary sector – extraction of materials (agric.)• Secondary sector – manufacturing • Tertiary sector – services
– more tertiary jobs, more likely to be MDC
– C. Productivity• Measured by the value added per capita
– gross value minus costs of raw material & energy
– measures production costs
• MDCs are more productive than LDCs
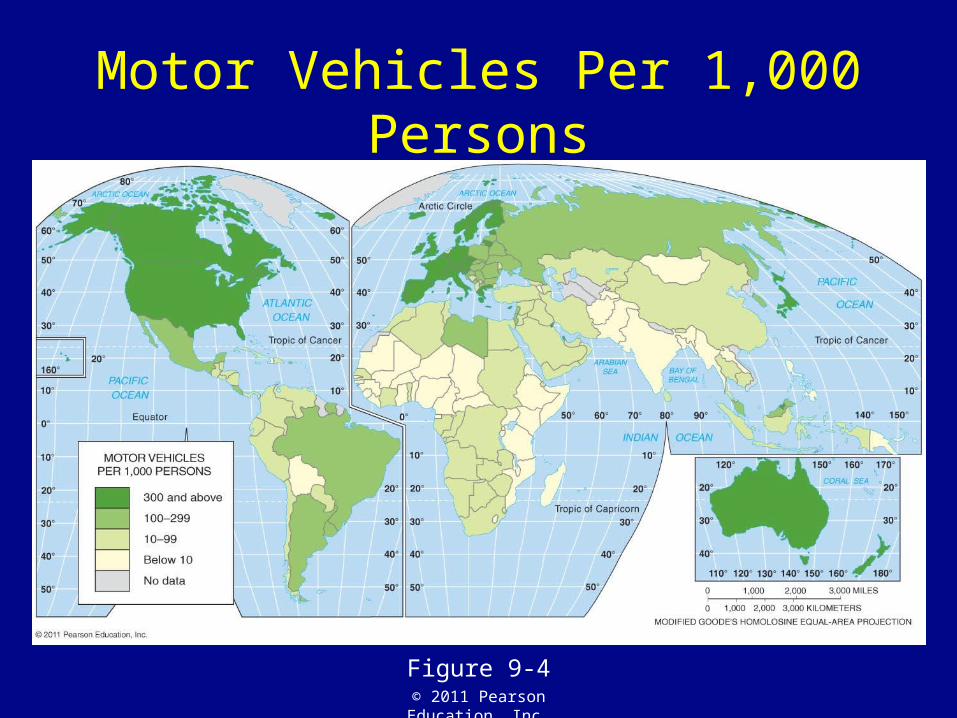
– D. Consumer Goods• More accessible in MDCs
– Esp. transportation (cars) and communication (phones, computers)
© 2011 Pearson Education, Inc.
Figure 9-2
Gross Domestic Product (per capita)
© 2011 Pearson Education, Inc.
Motor Vehicles Per 1,000 Persons
Figure 9-4

© 2011 Pearson Education, Inc.
II. Social Indicators of Development
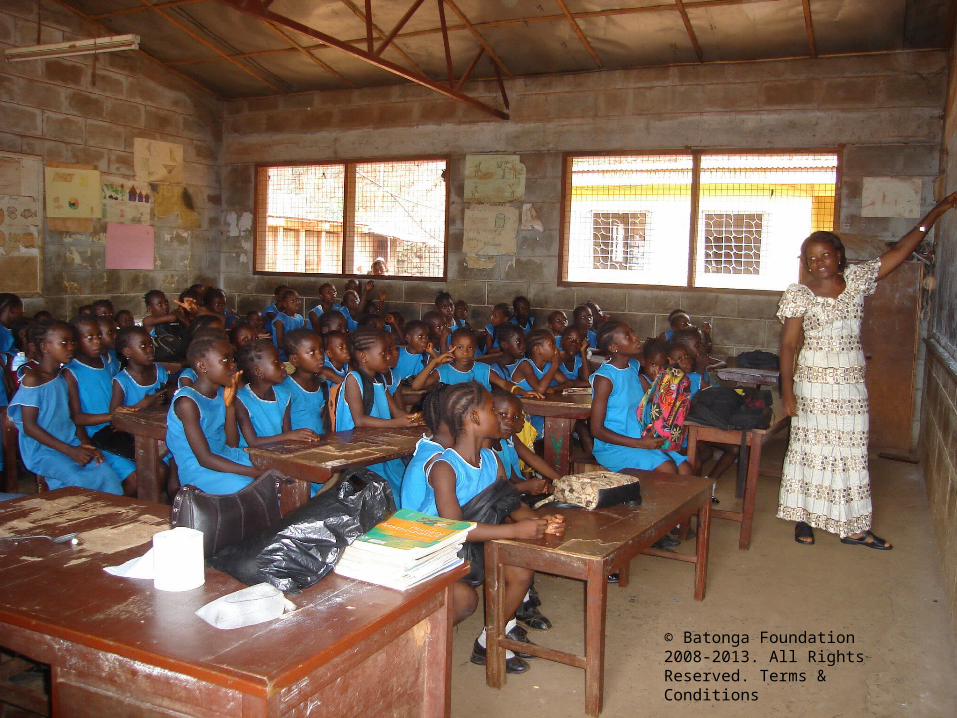
• A. Education and Literacy• Education rate = number of pupils per teacher
– lower ratio in MDC (usually ≤ 20); LDCs higher (often ≥ 30)
• The literacy rate = %of people who can read & write– Higher % in MDC (usually ≥ 98% in MDC; 60% in LDC)
• Greater educational access usually equals greater wealth (MDCs)

© 2011 Pearson Education, Inc.
Students Per Teacher, Primary School
Figure 9-6
© 2011 Pearson Education, Inc.
© Batonga Foundation 2008-2013. All Rights Reserved. Terms & Conditions

© 2011 Pearson Education, Inc.

© 2011 Pearson Education, Inc.
II. Social Indicators of Development (cont.)
• B. Health and Welfare• Diet (adequate calories & proteins)
– MDCs receive more than daily requirement – LDCs receive less than daily minimum
• Access to health care– Most MDCs have cheap public healthcare
» Paid through taxes– One exception: USA
• Welfare programs– Geared toward elderly, sick, poor, disabled, unemployed– Expensive b/c based on taxes– More common in MDCs
© 2011 Pearson Education, Inc.
III. Demographic Indicators of Development
– Life expectancy• Babies born today in MDCs have a life expectancy in
the 70s; babies born in LDCs, in the 60s
– Other demographic indicators:• Natural increase

© 2011 Pearson Education, Inc.
At Each Station…
1. Examine the data provided…what patterns are you seeing?
2. Which countries have higher numbers at this particular station?
1. Do you think these countries are MDCs or LDCs?
3. Why are the numbers higher for these countries?
© 2011 Pearson Education, Inc.
Infant Mortality Rate
Higher in LDCs
Why?https://www.cia.gov/library/publications/the-world-factbook/rankorder/2091rank.html

© 2011 Pearson Education, Inc.
Crude Birth Rate
All lower in MDCs
Why? https://www.cia.gov/library/publications/the-world-factbook/rankorder/2054rank.html

© 2011 Pearson Education, Inc.
Crude Death Rate
Higher in MDCs
Why?https://www.cia.gov/library/publications/the-world-factbook/rankorder/2066rank.html
© 2011 Pearson Education, Inc.
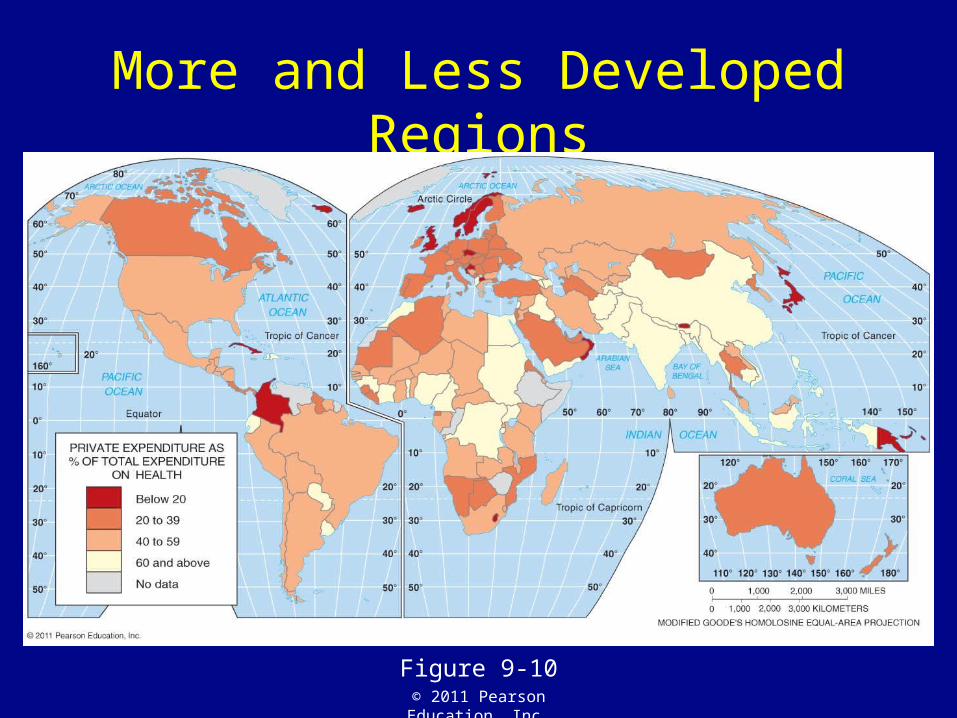
More and Less Developed Regions
Figure 9-10