© 2010 sri international - company confidential and proprietary information quantitative...
TRANSCRIPT

© 2010 SRI International - Company Confidential and Proprietary Information
Quantitative Proteomics: Approaches and Current Capabilities
Pathway Tools Workshop Chris BeckerPhysical Sciences DivisionOctober 27, 2010
© 2010 SRI International - Company Confidential and Proprietary Information
There have been and can still be problems with large
scale genomic and metabolomic measurements.
What about proteomics?
© 2010 SRI International - Company Confidential and Proprietary Information
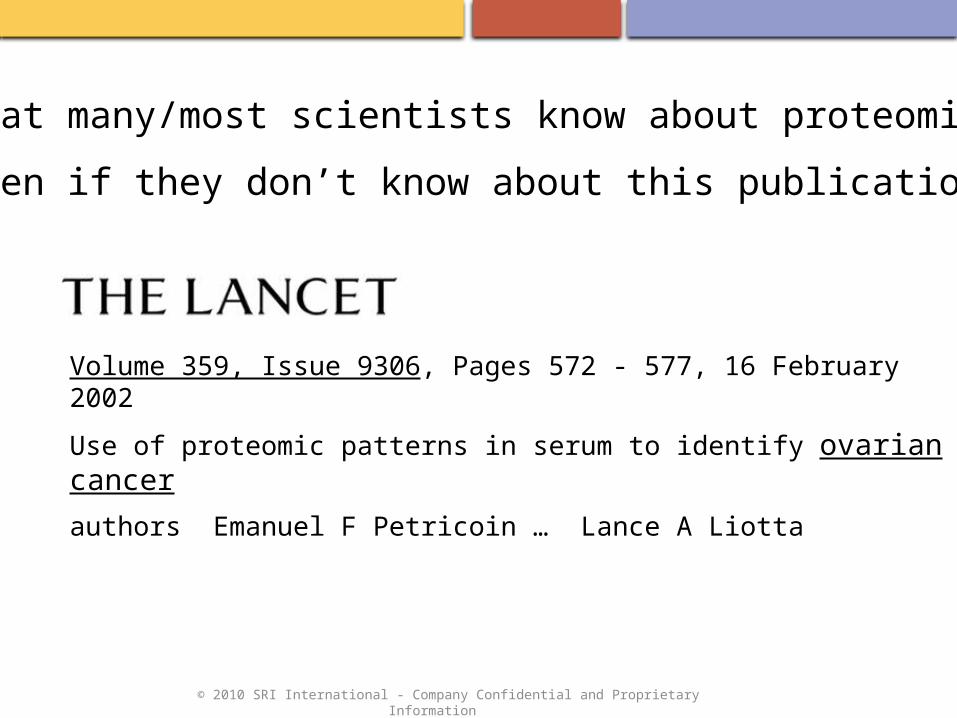
Volume 359, Issue 9306, Pages 572 - 577, 16 February 2002
Use of proteomic patterns in serum to identify ovarian cancer
authors Emanuel F Petricoin … Lance A Liotta
What many/most scientists know about proteomics,
even if they don’t know about this publication.

© 2010 SRI International - Company Confidential and Proprietary Information
How do researchers differentially quantify proteins?
• 2-D Gels
• Isotopic labeling
– iTraq (commercial reagent for tagging amine groups on lysine; read-out via
MS/MS)
– SILAC (stable isotope labeling with amino acids in cell culture)
• Label-free quantification

© 2010 SRI International - Company Confidential and Proprietary Information
Label-Free Differential Profiling
• Two types of label-free quantification:
– Intensity based or MS1 or MS-only
– Spectral counting (some minor variations; must re-ID each sample)
• Our research group provided an early description of the approach of using signal
intensities of label-free peptides and metabolites for LC-MS for quantification, including
normalization.
– ASMS 2002 Meeting– Wang et al. Analytical Chemistry 75:4818-4826 (2003)
• Overcame a bias that only isotopic labeling or gel imaging could provide a quantification
basis. Worry was matrix effects; the answer was to use significant chromatography times
and comparing similar samples.

© 2010 SRI International - Company Confidential and Proprietary Information
Label-Free Differential Profiling: easy to understand
Sample A
Sample B
What’s different between these two samples?
© 2010 SRI International - Company Confidential and Proprietary Information
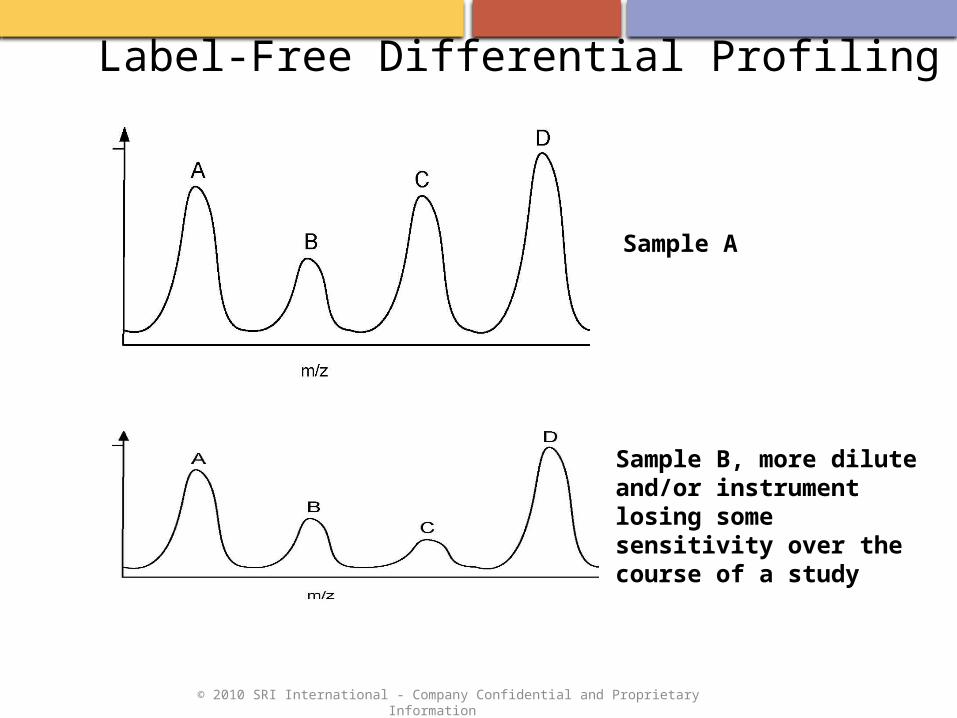
Label-Free Differential Profiling
Sample A
Sample B, more dilute and/or instrument losing some sensitivity over the course of a study

© 2010 SRI International - Company Confidential and Proprietary Information
Typical spectral complexity: 1 sample in 2 minutes
Scans separated by 30 sec
050108-103
m/z400 405 410 415 420 425 430 435 440 445 450 455 460 465 470 475 480 485 490 495 500
%
0
100
%
0
100
%
0
100
%
4
LCT427_092208_IQC03 775 (25.846) Cm (770:775) TOF MS ES+ 396419.6420
407.1441 410.6188
431.6610
420.6443
438.7919 463.1574
443.1240
447.1326
456.1486
479.1483 492.1199
480.1478
491.6035
481.6388
492.6159
497.1432
LCT427_092208_IQC03 745 (24.846) Cm (745:750) TOF MS ES+ 704466.1288442.1834423.6487
418.0884402.1325 417.1749
438.1288425.8080
426.1444
431.6320
459.7661442.6830
447.4577
447.7927
448.1179
477.6205
467.1347
468.1115
478.1193
479.1177494.1365
LCT427_092208_IQC03 725 (24.178) Cm (720:725) TOF MS ES+ 753423.1121412.6123
401.6470
415.7778
450.1016428.6090431.1193
435.0929
435.5884
440.1098
450.6056
452.1194462.1057 484.7508
473.1123 483.1117
490.1487 497.1017
LCT427_092208_IQC03 705 (23.511) Cm (700:705) TOF MS ES+ 536472.4035401.1152 409.6191
408.6301456.4271423.1216410.1094
411.6197
426.6444449.0846
442.6046429.7860
456.7554
457.1138462.6264
476.6134
477.6103488.1094 493.6191
Narrow 100 m/z range
© 2010 SRI International - Company Confidential and Proprietary Information
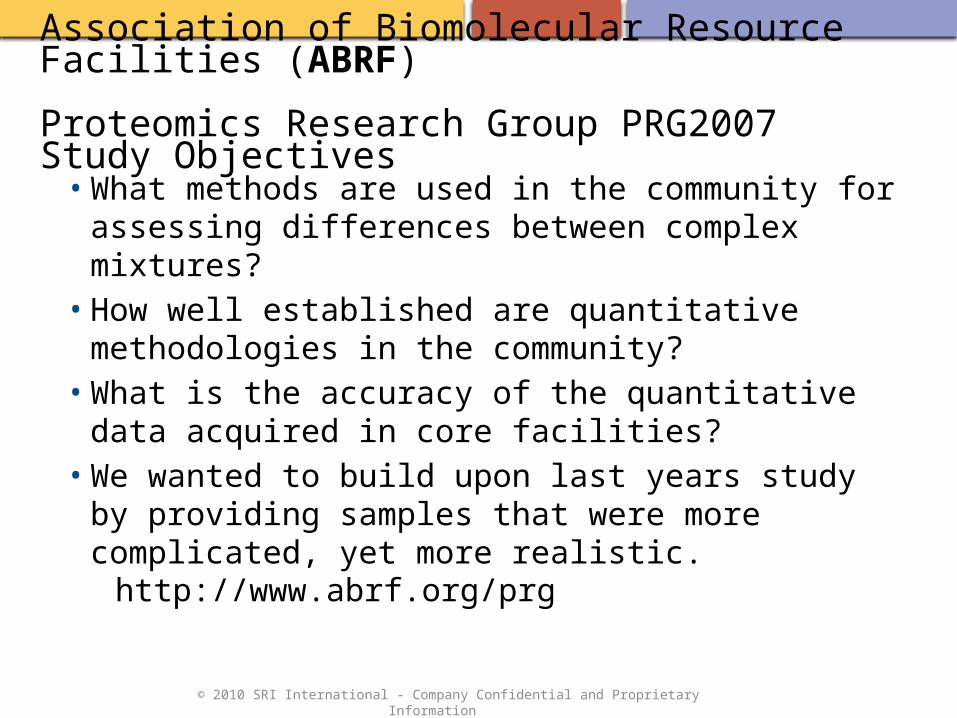
Association of Biomolecular Resource Facilities (ABRF)
Proteomics Research Group PRG2007 Study Objectives
• What methods are used in the community for assessing differences between complex mixtures?
• How well established are quantitative methodologies in the community?
• What is the accuracy of the quantitative data acquired in core facilities?
• We wanted to build upon last years study by providing samples that were more complicated, yet more realistic.
http://www.abrf.org/prg
© 2010 SRI International - Company Confidential and Proprietary Information
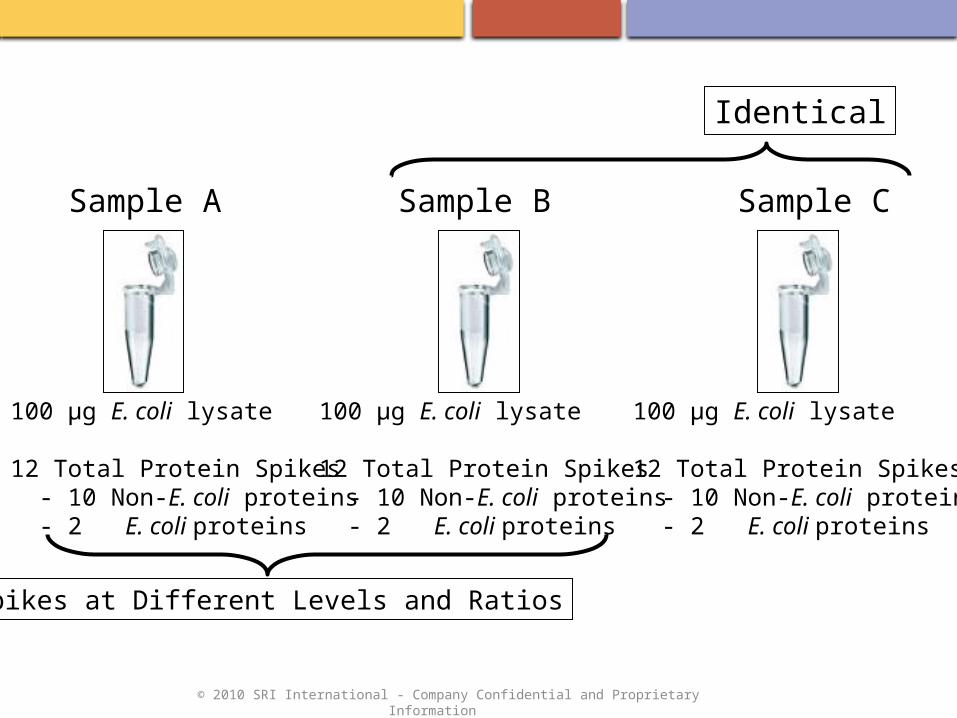
Sample Design:
Sample A Sample B Sample C
100 µg E. coli lysate
12 Total Protein Spikes - 10 Non-E. coli proteins - 2 E. coli proteins
100 µg E. coli lysate
12 Total Protein Spikes - 10 Non-E. coli proteins - 2 E. coli proteins
100 µg E. coli lysate
12 Total Protein Spikes - 10 Non-E. coli proteins - 2 E. coli proteins
Spikes at Different Levels and Ratios
Identical

© 2010 SRI International - Company Confidential and Proprietary Information
Techniques Applied
5 (14%)
5 (14%)
6 (17%)
2 (5.6%)
1 (2.8%)
1 (2.8%)
16 (44%)
iTRAQ ICPL ICAT 18O-Labeling Label Free 2D Gels (nonDIGE) 2D DIGE

© 2010 SRI International - Company Confidential and Proprietary Information
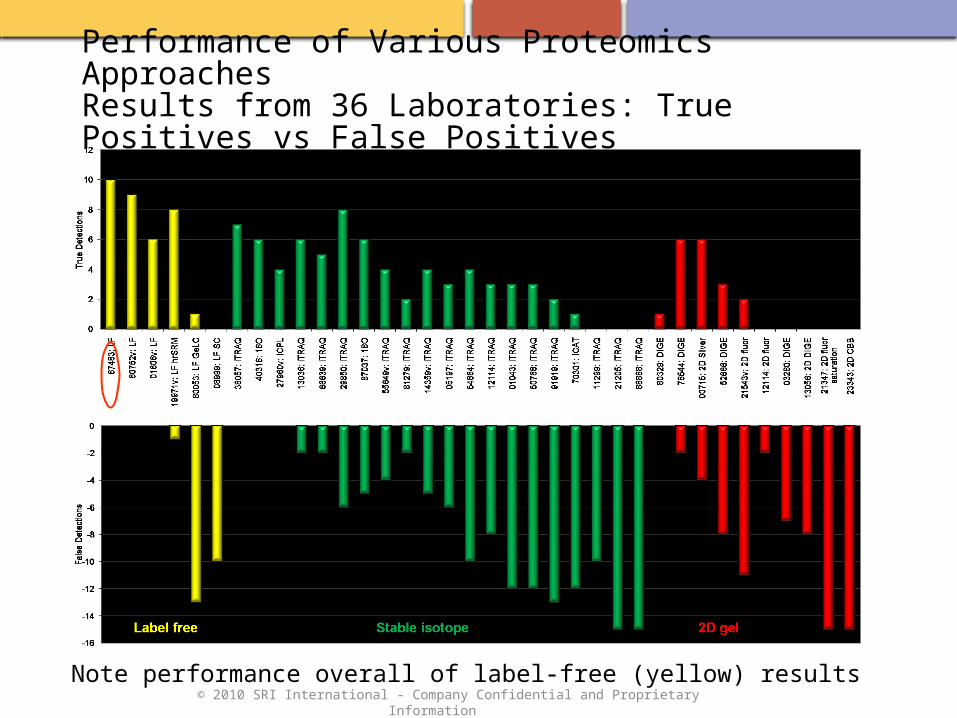
Performance of Various Proteomics ApproachesResults from 36 Laboratories: True Positives vs False Positives
Note performance overall of label-free (yellow) results
Beckerlab
© 2010 SRI International - Company Confidential and Proprietary Information
Performance of Various Proteomics ApproachesResults from 36 Laboratories: True Positives vs False Positives
Note performance overall of label-free (yellow) results

© 2010 SRI International - Company Confidential and Proprietary Information
Quantitative Accuracy: Ubiquitin
Color Indicates Method UsediTRAQICPLICAT18O LabelingLabel FreeLabel Free + targeted SRM2D-Gels (nonDIGE)2D-DIGE
B/A
Ratio
8
2D Gels Label-FreeStable Isotope Labeling
Anticipated Mole Ratio 4.6
6
2
0
4
A = 5 pmolB = 23 pmol

© 2010 SRI International - Company Confidential and Proprietary Information
Quantitative Accuracy: Glucose Oxidase
Color Indicates Method Used
iTRAQICPLICAT18O LabelingLabel FreeLabel Free + targeted SRM2D-Gels (nonDIGE)2D-DIGE
B/A
Ratio
1
2D Gels Label FreeStable Isotope Labeling
Anticipated Mole Ratio 0.67
0.8
0.4
0.2
0.6
0
A = 0.5 pmolB = 0.33 pmol

© 2010 SRI International - Company Confidential and Proprietary Information
Reproducibility Testing:Process and Instrument Variation Workflow
Pooled human serum
1
2
3
4
5
n
Sample aliquots are processed
Processed samples are pooled beforeanalysis and replicates are run
IQC –Instrument QCVariation due to the LC and Mass Spec
Processed samples are run individually
PQC –Process QCVariation due to sampleprocessing in addition tothe LC and Mass Spec
Sample Processing LC-MS
© 2010 SRI International - Company Confidential and Proprietary Information
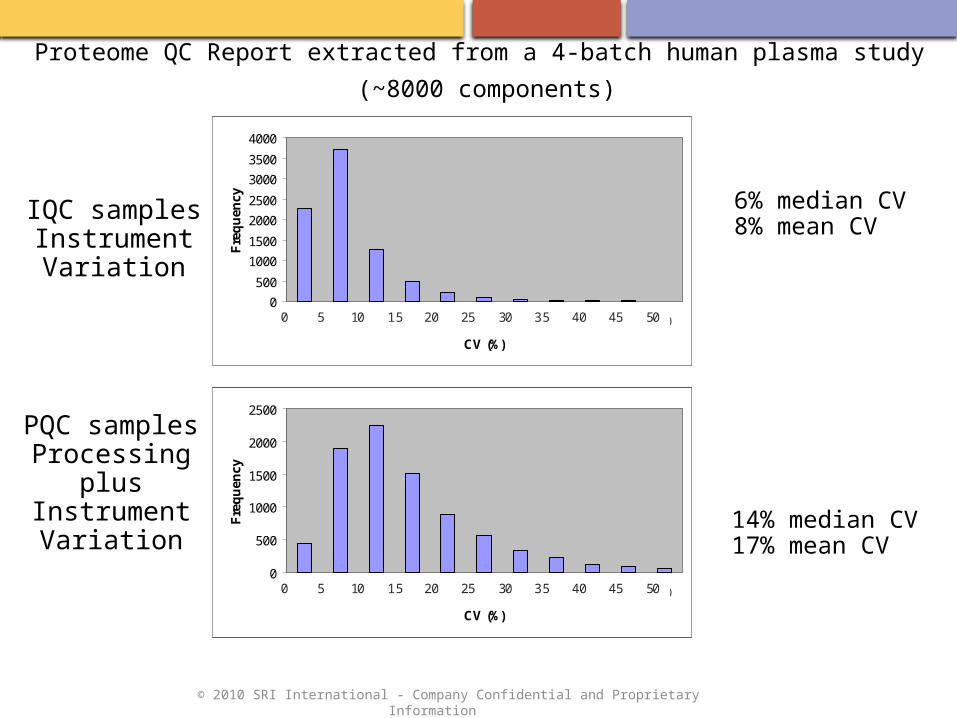
6% median CV8% mean CV
14% median CV17% mean CV
IQC samplesInstrumentVariation
PQC samplesProcessing
plusInstrumentVariation
Proteome QC Report extracted from a 4-batch human plasma study
(~8000 components)
0
500
1000
1500
2000
2500
3000
3500
4000
0 5 10 15 20 25 30 35 40 45 50
CV (%)
Fre
qu
ency
0 5 10 15 20 25 30 35 40 45 500
500
1000
1500
2000
2500
3000
3500
4000
0 5 10 15 20 25 30 35 40 45 50
CV (%)
Fre
qu
ency
0 5 10 15 20 25 30 35 40 45 50
0
500
1000
1500
2000
2500
0 5 10 15 20 25 30 35 40 45 50
CV (%)
Fre
qu
ency
0 5 10 15 20 25 30 35 40 45 500
500
1000
1500
2000
2500
0 5 10 15 20 25 30 35 40 45 50
CV (%)
Fre
qu
ency
0 5 10 15 20 25 30 35 40 45 50

© 2010 SRI International - Company Confidential and Proprietary Information
Example of quantification and the effect of a PTM, oxidation. In CSF.

© 2010 SRI International - Company Confidential and Proprietary Information
Typical Metrics for Proteomics• Coefficients of variations ~ 20%
• Accuracy ~ 20%
• One-dimensional (1D) analysis
– Track, identify and quantify approximately 1,000 proteins.
• Two-dimensional (2D) analysis
– Track, identify and quantify approximately 2,000 proteins.
• False discovery rate < 1% for identification (decoy database)
• False discovery rate p-value < 0.01 for differential expression (Benjamini
Hochberg, Storey)