© 2008 prentice hall, inc.6 – 1 managing quality
TRANSCRIPT
© 2008 Prentice Hall, Inc. 6 – 1
Managing QualityManaging Quality
© 2008 Prentice Hall, Inc. 6 – 2
Quality and StrategyQuality and Strategy
Defining QualityDefining Quality Implications of QualityImplications of Quality
Cost of Quality (COQ)Cost of Quality (COQ)
Ethics and Quality ManagementEthics and Quality Management
© 2008 Prentice Hall, Inc. 6 – 3
International Quality StandardsInternational Quality Standards ISO 9000ISO 9000
ISO14000ISO14000
Think!! Think!! Why Quality StandardsWhy Quality Standards
Are Important ? Are Important ?
© 2008 Prentice Hall, Inc. 6 – 4
Total Quality ManagementTotal Quality Management Continuous ImprovementContinuous Improvement
Six SigmaSix Sigma
Employee EmpowermentEmployee Empowerment
BenchmarkingBenchmarking
Just-in-Time (JIT)Just-in-Time (JIT)
Taguchi ConceptsTaguchi Concepts
Knowledge of TQM ToolsKnowledge of TQM Tools
You should have done couple of them in prerequisite! You should have done couple of them in prerequisite!
© 2008 Prentice Hall, Inc. 6 – 5
Tools of TQMTools of TQM Check SheetsCheck Sheets
Scatter Diagrams Scatter Diagrams
Cause-and-Effect DiagramsCause-and-Effect Diagrams
Pareto ChartsPareto Charts
FlowchartsFlowcharts
HistogramsHistograms
Statistical Process Control (SPC)Statistical Process Control (SPC)
Distinguish! What falls under TQM and What are tools for TQM (last Distinguish! What falls under TQM and What are tools for TQM (last slide & this slide) – Midterm slide & this slide) – Midterm
© 2008 Prentice Hall, Inc. 6 – 6
The Role of InspectionThe Role of Inspection When and Where to InspectWhen and Where to Inspect
Source InspectionSource Inspection
Service Industry InspectionService Industry Inspection
Inspection of Attributes versus Inspection of Attributes versus VariablesVariables
TQM in ServicesTQM in Services
Is inspection important? Remember the discussion we had in class Is inspection important? Remember the discussion we had in class as you go through this slide – Midterm as you go through this slide – Midterm
© 2008 Prentice Hall, Inc. 6 – 7
Google these concepts – read around them !! Please! Link with class Discussion! Google these concepts – read around them !! Please! Link with class Discussion!
Define quality and TQMDefine quality and TQM
Describe the ISO international Describe the ISO international quality standardsquality standards
Explain how benchmarking is used Explain how benchmarking is used
Use the seven tools of TQMUse the seven tools of TQM
© 2008 Prentice Hall, Inc. 6 – 8
Quality and Strategy – Quality and Strategy – Remember the Remember the
strategy discussion we had in class – Midterm strategy discussion we had in class – Midterm
Managing quality supports Managing quality supports differentiation, low cost, and differentiation, low cost, and response strategiesresponse strategies
Quality helps firms increase sales Quality helps firms increase sales and reduce costsand reduce costs
Building a quality organization is Building a quality organization is a demanding taska demanding task
© 2008 Prentice Hall, Inc. 6 – 9
Strategic Implications Strategic Implications of TQMof TQM
• Strong leadershipStrong leadership
• Goals, vision, or missionGoals, vision, or mission
• Operational plans and policiesOperational plans and policies
• Mechanism for feedbackMechanism for feedback
© 2008 Prentice Hall, Inc. 6 – 10
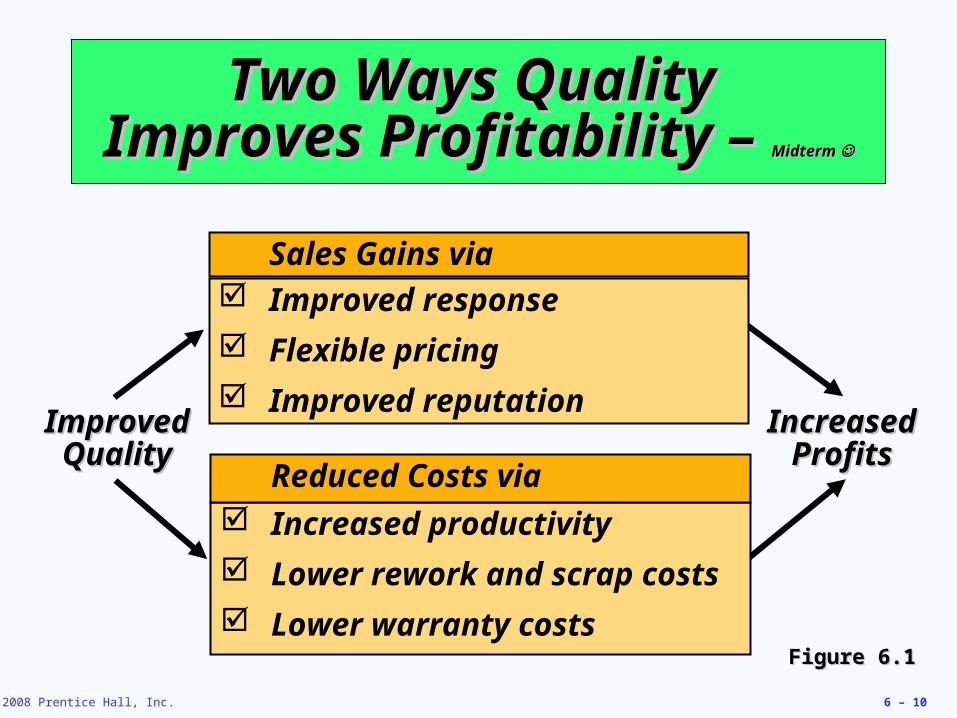
Two Ways Quality Two Ways Quality Improves Profitability – Improves Profitability – Midterm Midterm
Improved Improved QualityQuality
Increased Increased ProfitsProfits
Increased productivity
Lower rework and scrap costs
Lower warranty costs
Reduced Costs via
Improved response
Flexible pricing
Improved reputation
Sales Gains via
Figure 6.1Figure 6.1
© 2008 Prentice Hall, Inc. 6 – 11
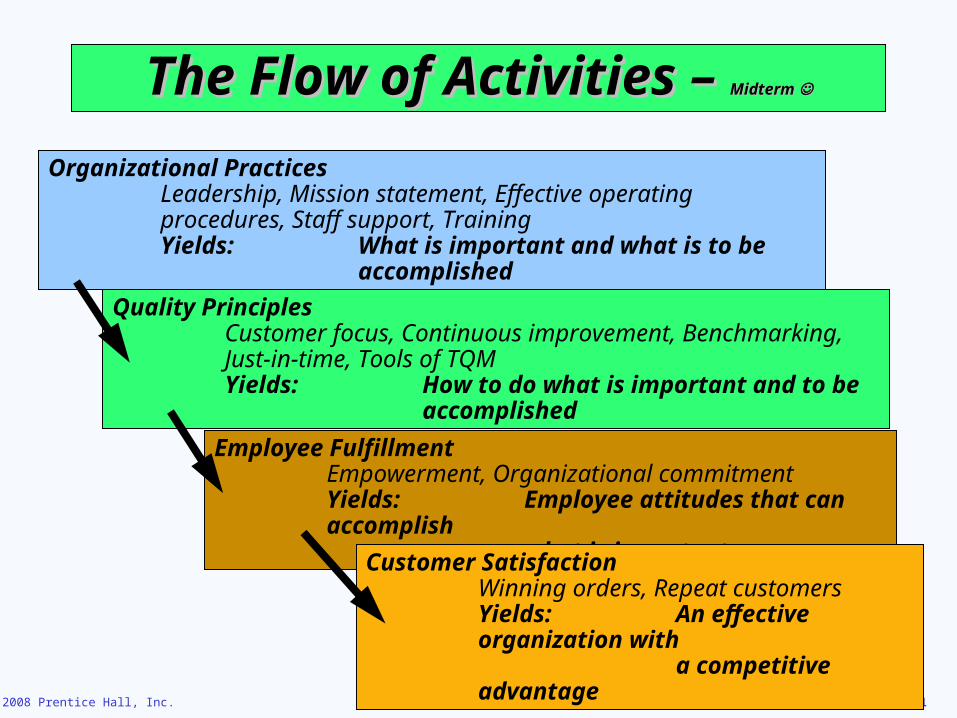
The Flow of Activities – The Flow of Activities – Midterm Midterm
Organizational PracticesLeadership, Mission statement, Effective operating procedures, Staff support, TrainingYields: What is important and what is to be
accomplished
Quality PrinciplesCustomer focus, Continuous improvement, Benchmarking, Just-in-time, Tools of TQMYields: How to do what is important and to be
accomplished
Employee FulfillmentEmpowerment, Organizational commitmentYields: Employee attitudes that can accomplish
what is importantCustomer SatisfactionWinning orders, Repeat customersYields: An effective organization with
a competitive advantage
© 2008 Prentice Hall, Inc. 6 – 12
Defining Quality – Defining Quality – You guys defined it well in class!! You guys defined it well in class!!
The totality of features and The totality of features and characteristics of a product or characteristics of a product or
service that bears on its ability to service that bears on its ability to satisfy stated or implied needssatisfy stated or implied needs
American Society for QualityAmerican Society for Quality
© 2008 Prentice Hall, Inc. 6 – 13
Different Views – Different Views – Think why conformance is important – Think why conformance is important –
link with next slide!!link with next slide!!
User-based – better performance, User-based – better performance, more featuresmore features
Manufacturing-based – Manufacturing-based – conformance to standards, conformance to standards, making it right the first timemaking it right the first time
© 2008 Prentice Hall, Inc. 6 – 14
Quality of ConformanceQuality of Conformance
Making sure a product or service is Making sure a product or service is produced according to designproduced according to design
if new tires do not conform to if new tires do not conform to specifications, they wobblespecifications, they wobble
if a hotel room is not clean when a if a hotel room is not clean when a guest checks in, the hotel is not guest checks in, the hotel is not functioning according to functioning according to specifications of its designspecifications of its design
© 2008 Prentice Hall, Inc. 6 – 153-15
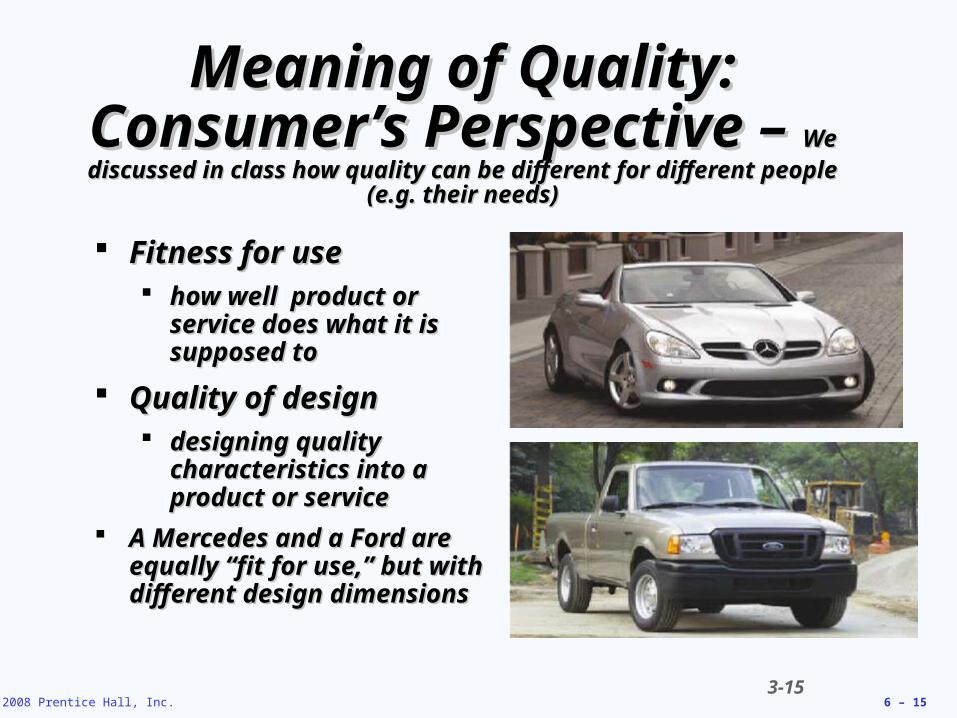
Meaning of Quality:Meaning of Quality:Consumer’s Perspective – Consumer’s Perspective – We discussed in class how quality can be different for different We discussed in class how quality can be different for different
people (e.g. their needs)people (e.g. their needs)
Fitness for useFitness for use how well product or how well product or
service does what it is service does what it is supposed tosupposed to
Quality of designQuality of design designing quality designing quality
characteristics into a characteristics into a product or serviceproduct or service
A Mercedes and a Ford are A Mercedes and a Ford are equally “fit for use,” but equally “fit for use,” but with different design with different design dimensionsdimensions
© 2008 Prentice Hall, Inc. 6 – 16
Implications of Quality – Implications of Quality – You guys You guys
identified many implications during class discussion – well done identified many implications during class discussion – well done
1.1. Company reputationCompany reputation Perception of new productsPerception of new products
Employment practicesEmployment practices
Supplier relationsSupplier relations
2.2. Global implicationsGlobal implications Improved ability to competeImproved ability to compete
© 2008 Prentice Hall, Inc. 6 – 17
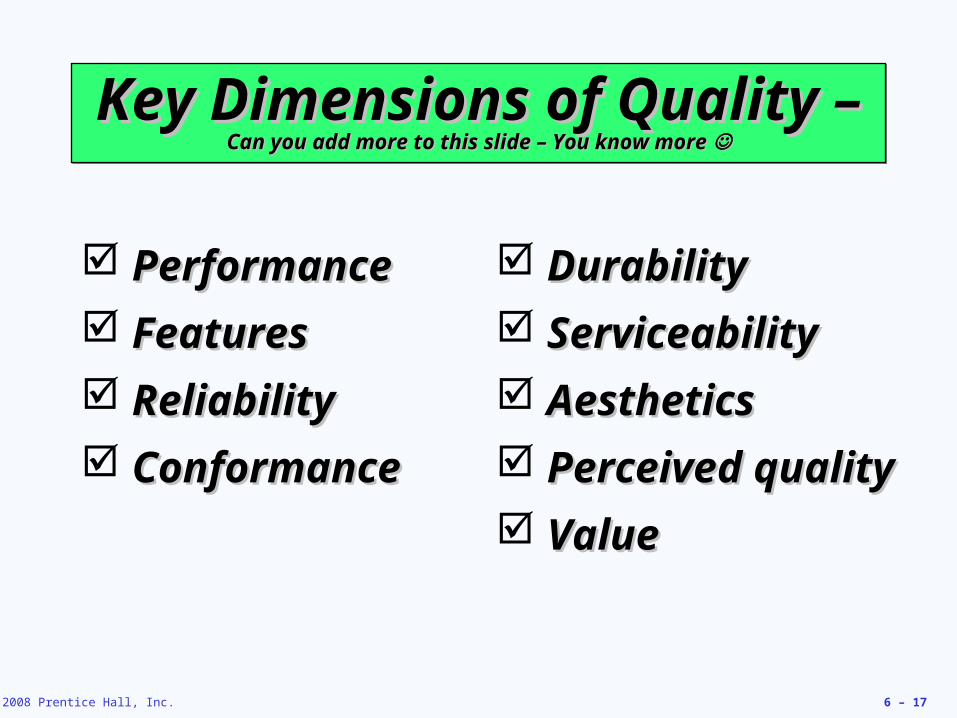
Key Dimensions of Quality – Key Dimensions of Quality – Can you add more to this slide – You know more Can you add more to this slide – You know more
Key Dimensions of Quality – Key Dimensions of Quality – Can you add more to this slide – You know more Can you add more to this slide – You know more
PerformancePerformance
FeaturesFeatures
ReliabilityReliability
ConformanceConformance
DurabilityDurability
ServiceabilityServiceability
AestheticsAesthetics
Perceived qualityPerceived quality
ValueValue
© 2008 Prentice Hall, Inc. 6 – 18
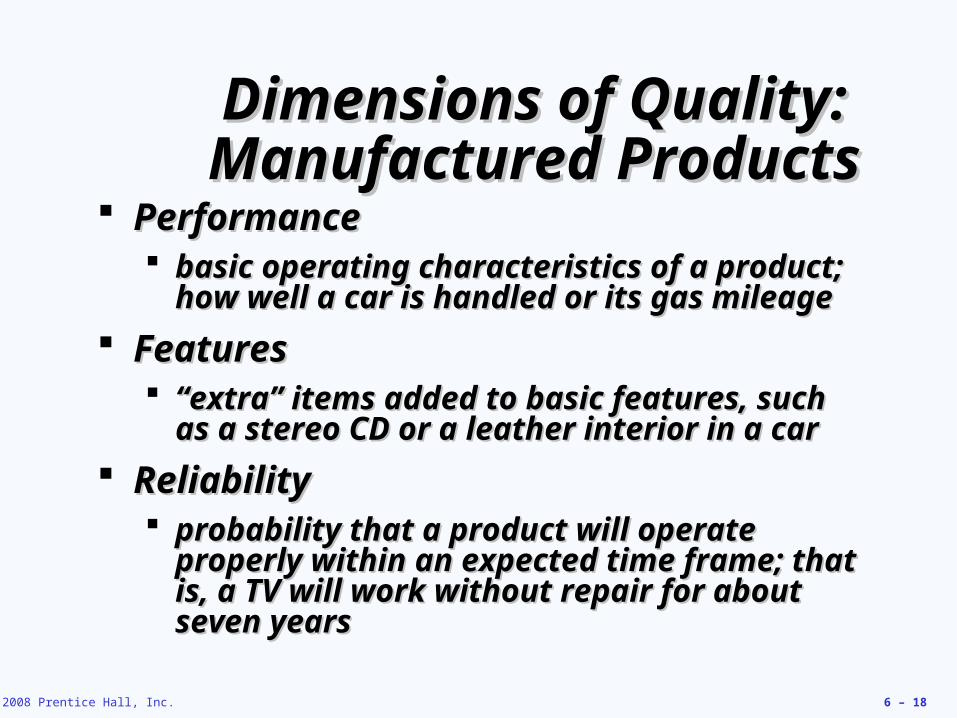
Dimensions of Quality:Dimensions of Quality:Manufactured ProductsManufactured Products
Performance Performance basic operating characteristics of a product; basic operating characteristics of a product;
how well a car is handled or its gas mileagehow well a car is handled or its gas mileage
Features Features ““extra” items added to basic features, such extra” items added to basic features, such
as a stereo CD or a leather interior in a caras a stereo CD or a leather interior in a car
ReliabilityReliability probability that a product will operate probability that a product will operate
properly within an expected time frame; that properly within an expected time frame; that is, a TV will work without repair for about is, a TV will work without repair for about seven yearsseven years
© 2008 Prentice Hall, Inc. 6 – 19
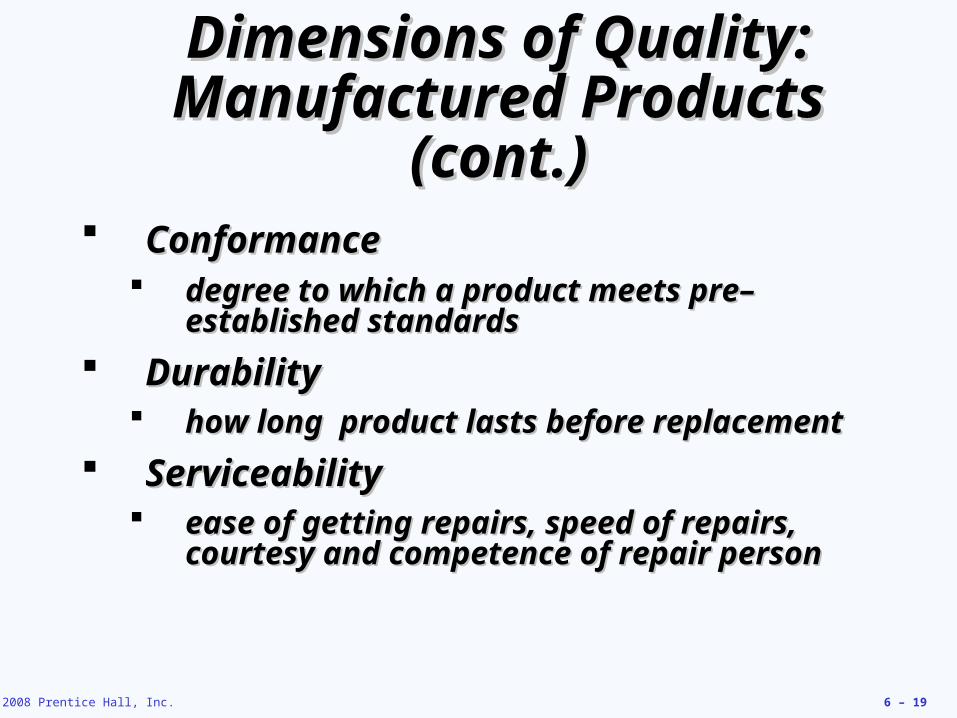
ConformanceConformance degree to which a product meets pre–degree to which a product meets pre–
established standardsestablished standards
DurabilityDurability how long product lasts before replacementhow long product lasts before replacement
ServiceabilityServiceability ease of getting repairs, speed of repairs, ease of getting repairs, speed of repairs,
courtesy and competence of repair personcourtesy and competence of repair person
Dimensions of Quality:Dimensions of Quality:Manufactured Products Manufactured Products
(cont.)(cont.)
© 2008 Prentice Hall, Inc. 6 – 20
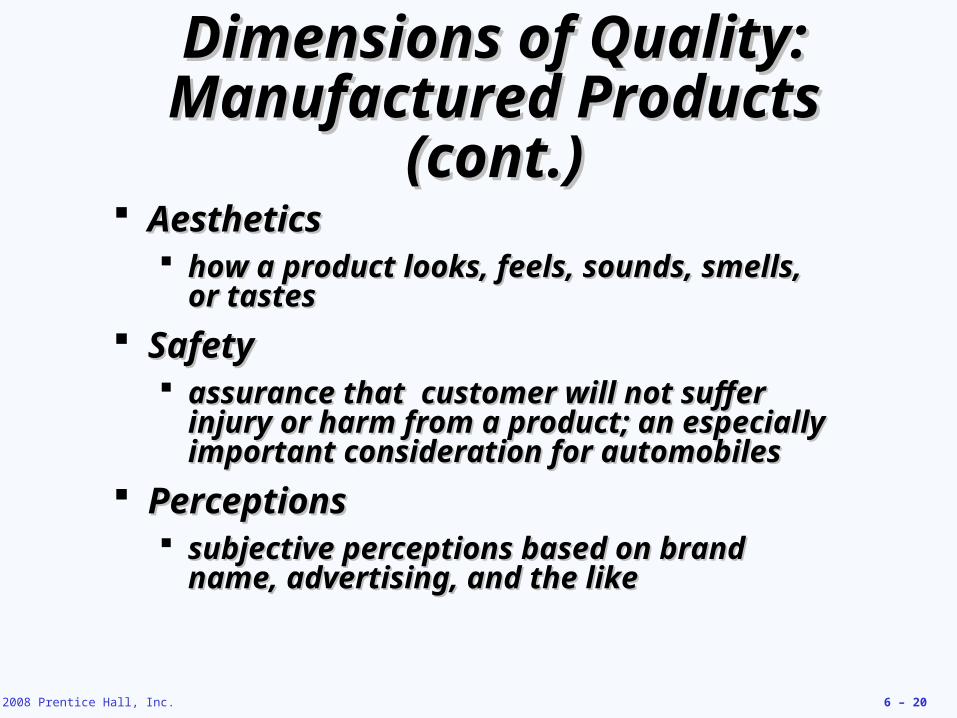
AestheticsAesthetics how a product looks, feels, sounds, smells, how a product looks, feels, sounds, smells,
or tastesor tastes
Safety Safety assurance that customer will not suffer assurance that customer will not suffer
injury or harm from a product; an especially injury or harm from a product; an especially important consideration for automobilesimportant consideration for automobiles
PerceptionsPerceptions subjective perceptions based on brand subjective perceptions based on brand
name, advertising, and the likename, advertising, and the like
Dimensions of Quality:Dimensions of Quality:Manufactured Products Manufactured Products
(cont.)(cont.)
© 2008 Prentice Hall, Inc. 6 – 21
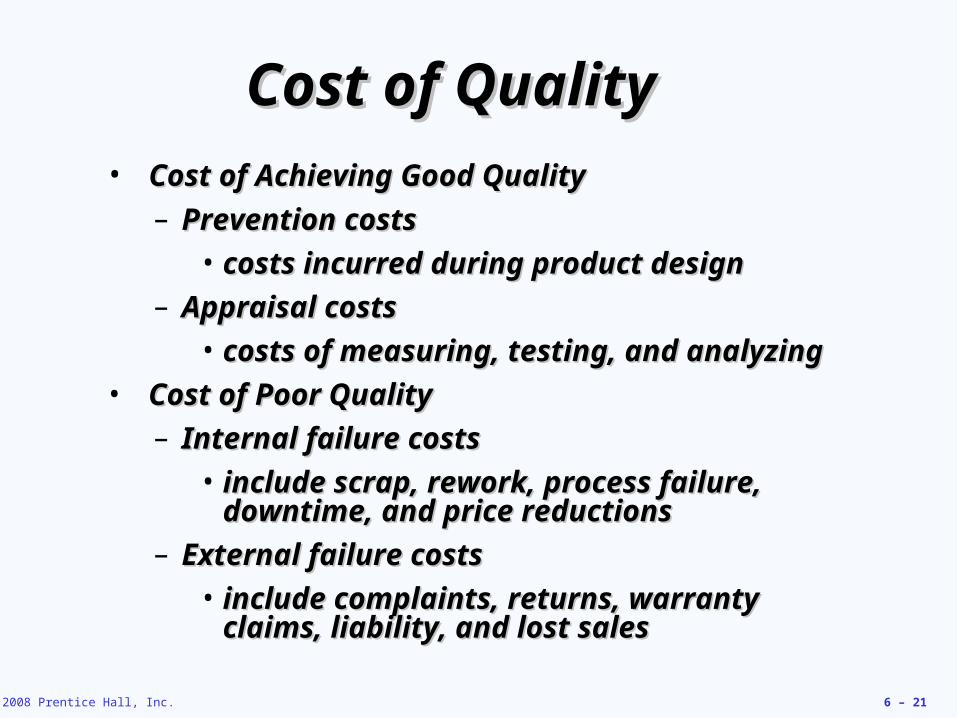
Cost of QualityCost of Quality• Cost of Achieving Good QualityCost of Achieving Good Quality
– Prevention costsPrevention costs
• costs incurred during product designcosts incurred during product design
– Appraisal costsAppraisal costs
• costs of measuring, testing, and costs of measuring, testing, and analyzinganalyzing
• Cost of Poor QualityCost of Poor Quality
– Internal failure costsInternal failure costs
• include scrap, rework, process failure, include scrap, rework, process failure, downtime, and price reductionsdowntime, and price reductions
– External failure costsExternal failure costs
• include complaints, returns, warranty include complaints, returns, warranty claims, liability, and lost salesclaims, liability, and lost sales
© 2008 Prentice Hall, Inc. 6 – 223-22
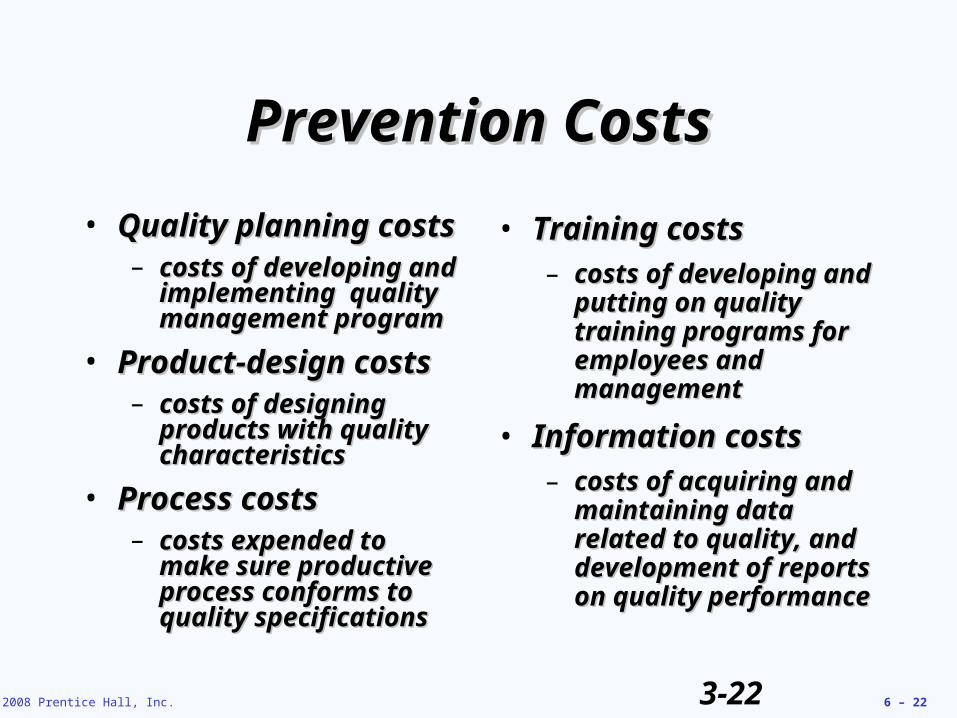
Prevention CostsPrevention Costs
• Quality planning costsQuality planning costs– costs of developing and costs of developing and
implementing quality implementing quality management programmanagement program
• Product-design costsProduct-design costs– costs of designing costs of designing
products with quality products with quality characteristicscharacteristics
• Process costsProcess costs– costs expended to costs expended to
make sure productive make sure productive process conforms to process conforms to quality specificationsquality specifications
• Training costsTraining costs– costs of developing costs of developing
and putting on quality and putting on quality training programs for training programs for employees and employees and managementmanagement
• Information costsInformation costs– costs of acquiring and costs of acquiring and
maintaining data maintaining data related to quality, and related to quality, and development of reports development of reports on quality performanceon quality performance
© 2008 Prentice Hall, Inc. 6 – 233-23
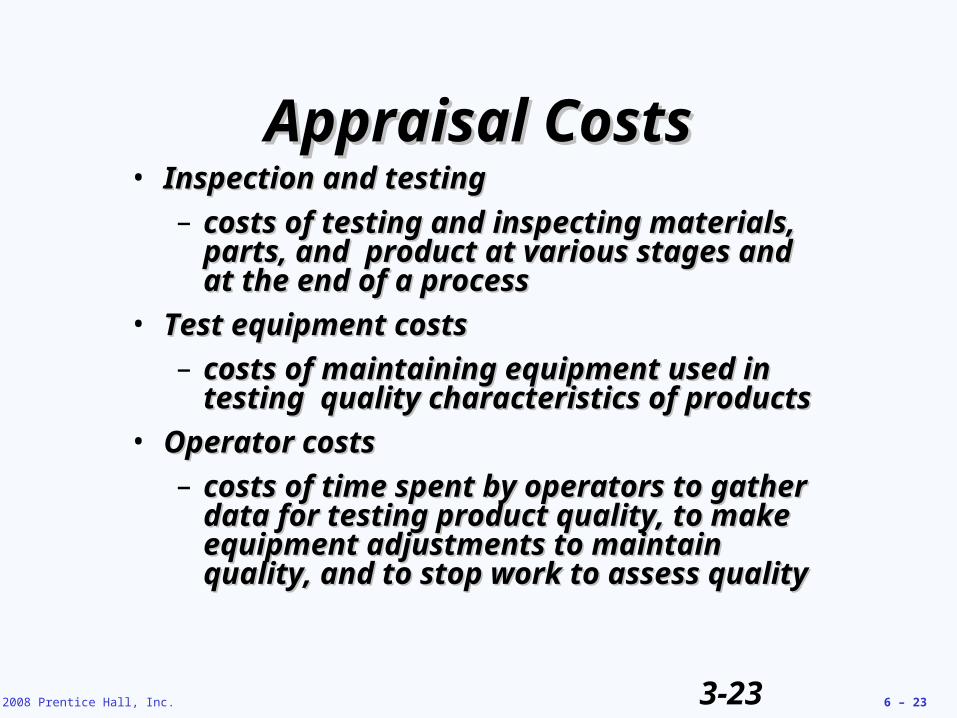
Appraisal CostsAppraisal Costs• Inspection and testingInspection and testing
– costs of testing and inspecting materials, costs of testing and inspecting materials, parts, and product at various stages and parts, and product at various stages and at the end of a processat the end of a process
• Test equipment costsTest equipment costs
– costs of maintaining equipment used in costs of maintaining equipment used in testing quality characteristics of productstesting quality characteristics of products
• Operator costsOperator costs
– costs of time spent by operators to gather costs of time spent by operators to gather data for testing product quality, to make data for testing product quality, to make equipment adjustments to maintain equipment adjustments to maintain quality, and to stop work to assess qualityquality, and to stop work to assess quality
© 2008 Prentice Hall, Inc. 6 – 243-24
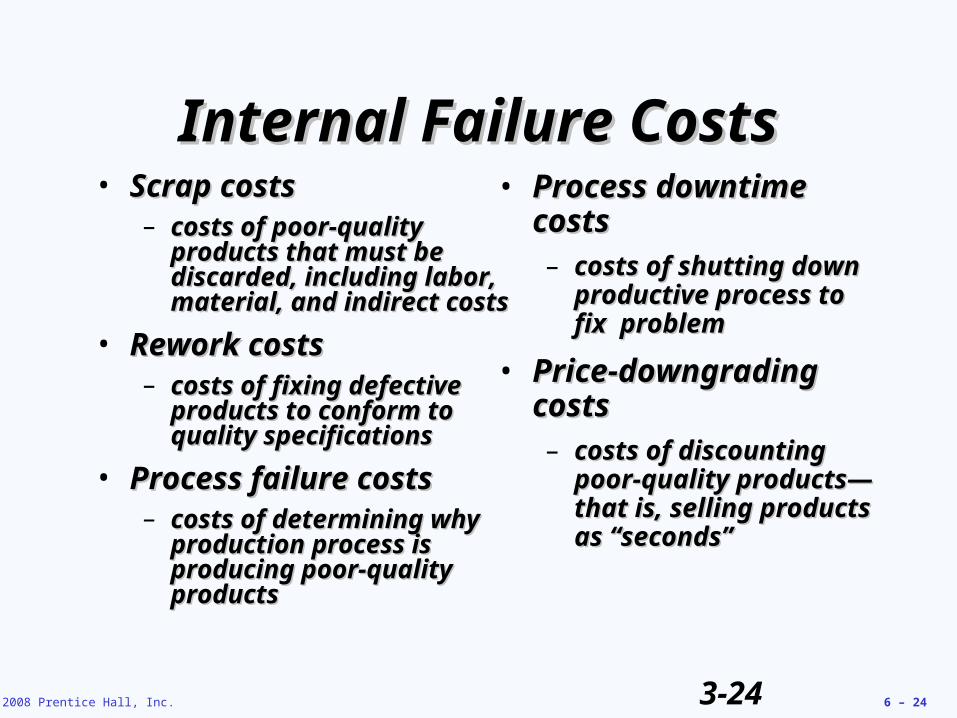
Internal Failure CostsInternal Failure Costs• Scrap costsScrap costs
– costs of poor-quality costs of poor-quality products that must be products that must be discarded, including discarded, including labor, material, and labor, material, and indirect costsindirect costs
• Rework costsRework costs– costs of fixing defective costs of fixing defective
products to conform to products to conform to quality specificationsquality specifications
• Process failure costsProcess failure costs– costs of determining why costs of determining why
production process is production process is producing poor-quality producing poor-quality productsproducts
• Process downtime Process downtime costscosts– costs of shutting down costs of shutting down
productive process to productive process to fix problemfix problem
• Price-downgrading Price-downgrading costscosts– costs of discounting costs of discounting
poor-quality productspoor-quality products—that is, selling —that is, selling products as “seconds”products as “seconds”
© 2008 Prentice Hall, Inc. 6 – 253-25
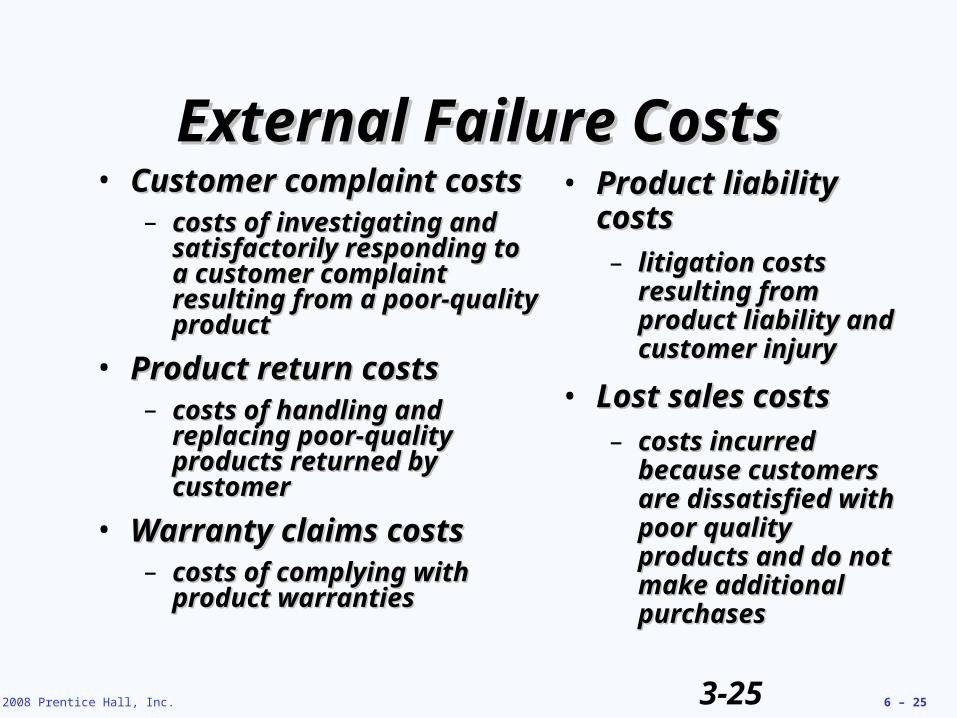
External Failure CostsExternal Failure Costs• Customer complaint costsCustomer complaint costs
– costs of investigating and costs of investigating and satisfactorily responding to satisfactorily responding to a customer complaint a customer complaint resulting from a poor-quality resulting from a poor-quality productproduct
• Product return costsProduct return costs– costs of handling and costs of handling and
replacing poor-quality replacing poor-quality products returned by products returned by customercustomer
• Warranty claims costsWarranty claims costs– costs of complying with costs of complying with
product warrantiesproduct warranties
• Product liability Product liability costscosts– litigation costs litigation costs
resulting from resulting from product liability and product liability and customer injurycustomer injury
• Lost sales costsLost sales costs– costs incurred costs incurred
because customers because customers are dissatisfied with are dissatisfied with poor quality poor quality products and do not products and do not make additional make additional purchasespurchases
© 2008 Prentice Hall, Inc. 6 – 26
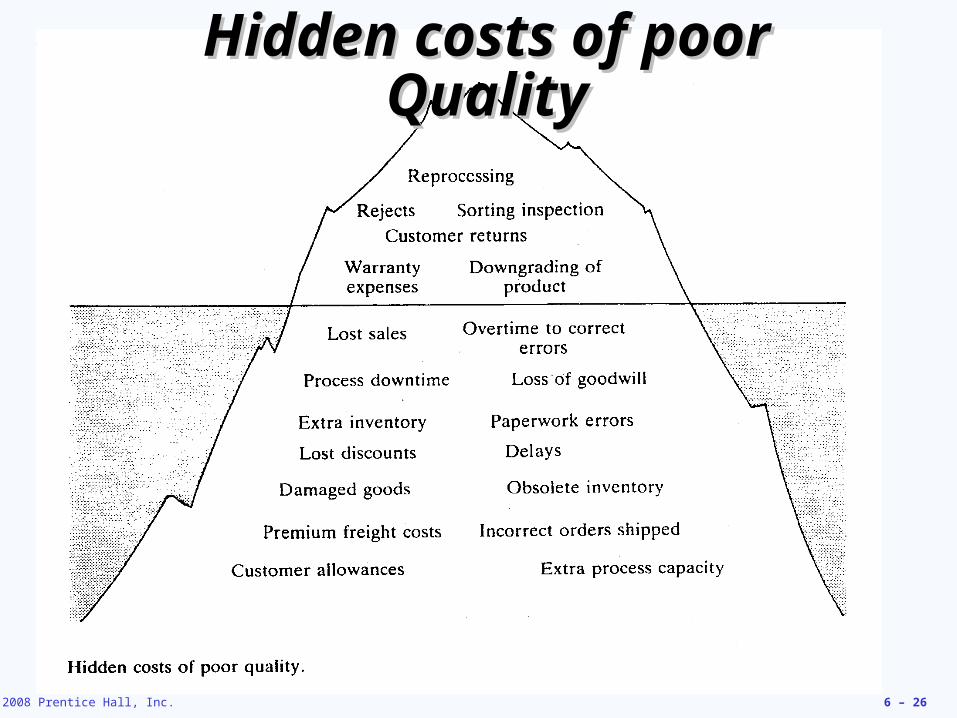
Hidden costs of poor Hidden costs of poor QualityQuality
© 2008 Prentice Hall, Inc. 6 – 27
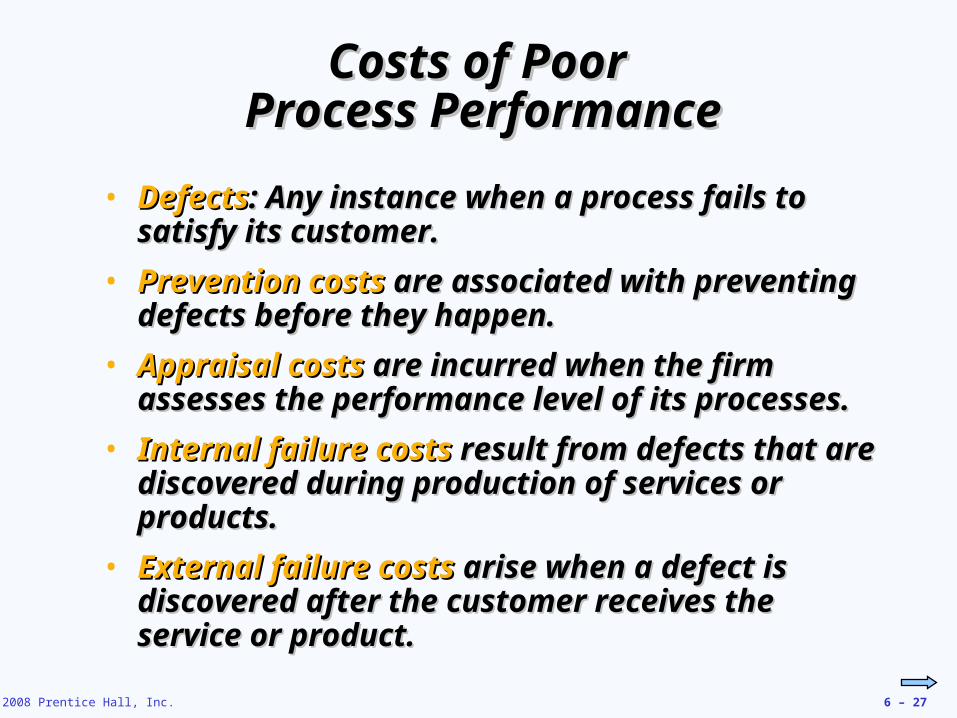
Costs of Poor Costs of Poor Process PerformanceProcess Performance
• DefectsDefects: Any instance when a process fails to : Any instance when a process fails to satisfy its customer.satisfy its customer.
• Prevention costsPrevention costs are associated with preventing are associated with preventing defects before they happen.defects before they happen.
• Appraisal costsAppraisal costs are incurred when the firm are incurred when the firm assesses the performance level of its processes.assesses the performance level of its processes.
• Internal failureInternal failure costscosts result from defects that are result from defects that are discovered during production of services or discovered during production of services or products.products.
• External failureExternal failure costscosts arise when a defect is arise when a defect is discovered after the customer receives the discovered after the customer receives the service or product.service or product.
© 2008 Prentice Hall, Inc. 6 – 28
How can we Improve a How can we Improve a Process? Process?
• Reduce errorsReduce errors
• Meet or exceed expectations of Meet or exceed expectations of internal/external customersinternal/external customers
• Make the process saferMake the process safer
• Make the process more satisfying to Make the process more satisfying to the person doing it.the person doing it.
© 2008 Prentice Hall, Inc. 6 – 29
© 2008 Prentice Hall, Inc. 6 – 30
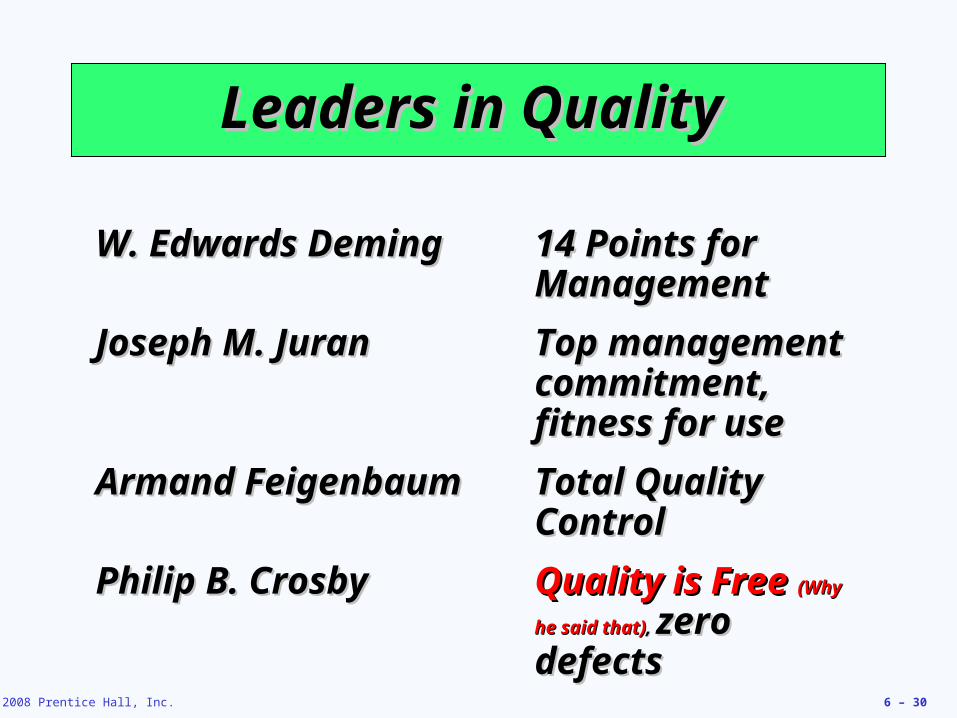
Leaders in Quality Leaders in Quality
W. Edwards DemingW. Edwards Deming 14 Points for 14 Points for ManagementManagement
Joseph M. JuranJoseph M. Juran Top management Top management commitment, commitment, fitness for usefitness for use
Armand FeigenbaumArmand Feigenbaum Total Quality Total Quality ControlControl
Philip B. CrosbyPhilip B. Crosby Quality is Free Quality is Free (Why (Why
he said that)he said that), , zero zero defectsdefects
© 2008 Prentice Hall, Inc. 6 – 31
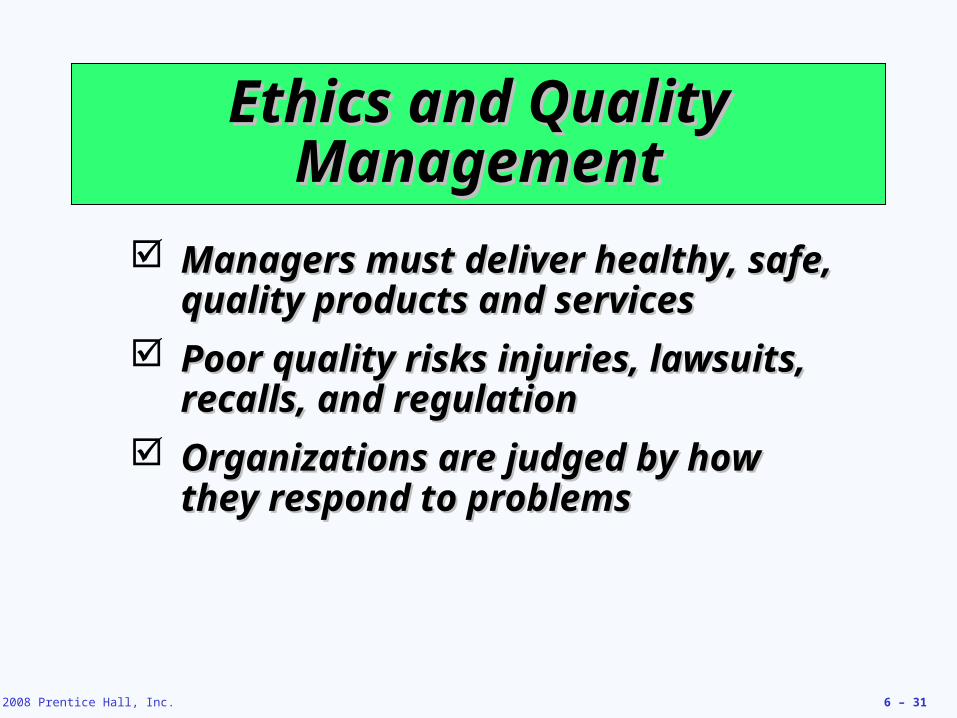
Ethics and Quality Ethics and Quality ManagementManagement
Managers must deliver healthy, safe, Managers must deliver healthy, safe, quality products and servicesquality products and services
Poor quality risks injuries, lawsuits, Poor quality risks injuries, lawsuits, recalls, and regulationrecalls, and regulation
Organizations are judged by how Organizations are judged by how they respond to problemsthey respond to problems
© 2008 Prentice Hall, Inc. 6 – 32
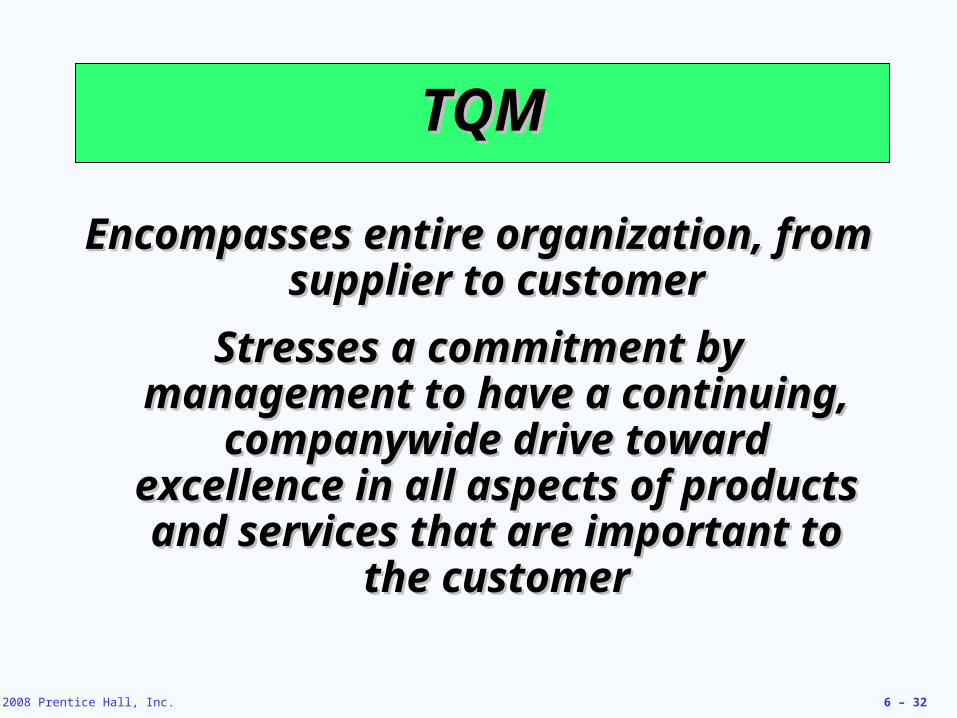
TQMTQM
Encompasses entire organization, Encompasses entire organization, from supplier to customerfrom supplier to customer
Stresses a commitment by Stresses a commitment by management to have a continuing, management to have a continuing,
companywide drive toward companywide drive toward excellence in all aspects of products excellence in all aspects of products
and services that are important to and services that are important to the customerthe customer
© 2008 Prentice Hall, Inc. 6 – 33
Seven Concepts of TQMSeven Concepts of TQM
Continuous improvementContinuous improvement
Six SigmaSix Sigma
Employee empowermentEmployee empowerment
BenchmarkingBenchmarking
Just-in-time (JIT)Just-in-time (JIT)
Taguchi conceptsTaguchi concepts
Knowledge of TQM toolsKnowledge of TQM tools
© 2008 Prentice Hall, Inc. 6 – 34
Continuous ImprovementContinuous Improvement
Represents continual Represents continual improvement of all processes improvement of all processes
Involves all operations and work Involves all operations and work centers including suppliers and centers including suppliers and customerscustomersPeople, Equipment, Materials, People, Equipment, Materials,
ProceduresProcedures
© 2008 Prentice Hall, Inc. 6 – 35
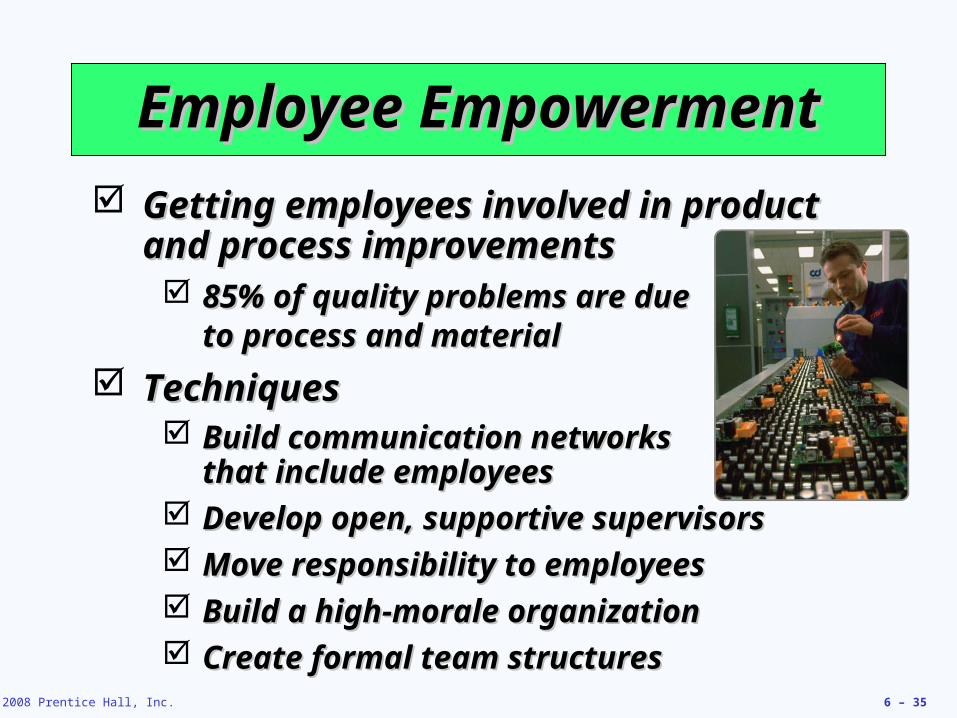
Employee EmpowermentEmployee Empowerment
Getting employees involved in product Getting employees involved in product and process improvementsand process improvements 85% of quality problems are due 85% of quality problems are due
to process and materialto process and material TechniquesTechniques
Build communication networks Build communication networks that include employeesthat include employees
Develop open, supportive supervisorsDevelop open, supportive supervisors Move responsibility to employeesMove responsibility to employees Build a high-morale organizationBuild a high-morale organization Create formal team structuresCreate formal team structures
© 2008 Prentice Hall, Inc. 6 – 36
BenchmarkingBenchmarking
Selecting best practices to use as a Selecting best practices to use as a standard for performancestandard for performance
Determine what to Determine what to benchmarkbenchmark
Collect and analyze benchmarking Collect and analyze benchmarking informationinformation
Take action to match or exceed the Take action to match or exceed the benchmarkbenchmark
© 2008 Prentice Hall, Inc. 6 – 37
Is Resolving Customer Is Resolving Customer Complaints Important ? Complaints Important ?
Some best practices! Some best practices! (Can you think of any other (Can you think of any other ?) ?)
Make it easy for clients to complainMake it easy for clients to complain
Respond quickly to complaintsRespond quickly to complaints
Resolve complaints on first contactResolve complaints on first contact
Use computers to manage Use computers to manage complaintscomplaints
Recruit the best for customer Recruit the best for customer service jobsservice jobs
© 2008 Prentice Hall, Inc. 6 – 38
Just-in-Time (JIT)Just-in-Time (JIT)
Relationship to quality?Relationship to quality?
© 2008 Prentice Hall, Inc. 6 – 39
Just-in-Time (JIT)Just-in-Time (JIT)
Allows reduced inventory levelsAllows reduced inventory levels Inventory costs money and hides process Inventory costs money and hides process
and material problemsand material problems
Encourages improved process and Encourages improved process and product qualityproduct quality
© 2008 Prentice Hall, Inc. 6 – 40
Tools of TQM – Tools of TQM – Midterm Midterm
Tools for Generating IdeasTools for Generating IdeasCheck sheetsCheck sheetsScatter diagramsScatter diagramsCause-and-effect diagramsCause-and-effect diagrams
Tools to Organize the DataTools to Organize the DataPareto chartsPareto chartsFlowchartsFlowcharts
Tools for Identifying ProblemsTools for Identifying ProblemsHistogramHistogramStatistical process control chartStatistical process control chart
© 2008 Prentice Hall, Inc. 6 – 41
Statistical Process Control Statistical Process Control (SPC) (SPC) (Midterm (Midterm ))
Uses statistics and control charts to Uses statistics and control charts to tell when to take corrective actiontell when to take corrective action
Drives process improvementDrives process improvement
© 2008 Prentice Hall, Inc. 6 – 42
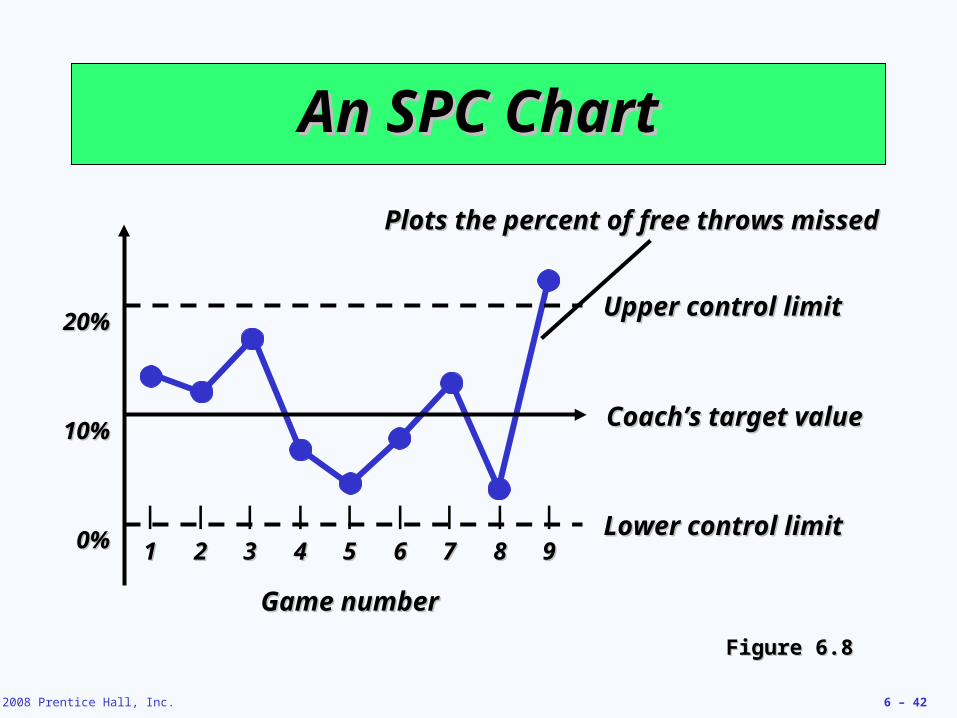
An SPC ChartAn SPC Chart
Upper control limitUpper control limit
Coach’s target valueCoach’s target value
Lower control limitLower control limit
Game numberGame number
| | | | | | | | |
11 22 33 44 55 66 77 88 99
20%20%
10%10%
0%0%
Plots the percent of free throws missedPlots the percent of free throws missed
Figure 6.8Figure 6.8
© 2008 Prentice Hall, Inc. 6 – 43
InspectionInspection
Involves examining items to see if Involves examining items to see if an item is good or defectivean item is good or defective
Detect a defective productDetect a defective product Does not correct deficiencies in Does not correct deficiencies in
process or productprocess or product It is expensiveIt is expensive
IssuesIssues When to inspectWhen to inspect Where in process to inspectWhere in process to inspect
© 2008 Prentice Hall, Inc. 6 – 44
When and Where to InspectWhen and Where to Inspect
1.1. At the supplier’s plant while the supplier is At the supplier’s plant while the supplier is producingproducing
2.2. At your facility upon receipt of goods from At your facility upon receipt of goods from the supplierthe supplier
3.3. Before costly or irreversible processesBefore costly or irreversible processes
4.4. During the step-by-step production During the step-by-step production processprocess
5.5. When production or service is completeWhen production or service is complete
6.6. Before delivery to your customerBefore delivery to your customer
7.7. At the point of customer contactAt the point of customer contact
© 2008 Prentice Hall, Inc. 6 – 45
Source Inspection Source Inspection (You guys made good comments here! )(You guys made good comments here! )
Also known as source controlAlso known as source control
The next step in the process is The next step in the process is your customeryour customer
Ensure perfect product Ensure perfect product to your customerto your customer
© 2008 Prentice Hall, Inc. 6 – 46
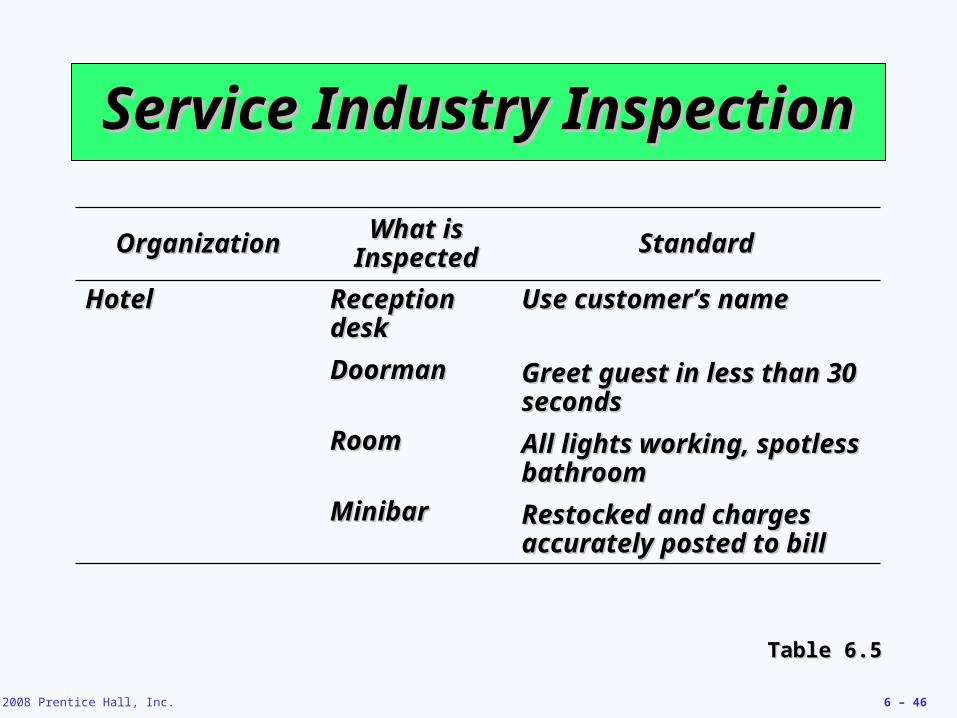
Service Industry InspectionService Industry Inspection
OrganizationOrganization What is What is InspectedInspected StandardStandard
Hotel Hotel Reception Reception deskdesk
DoormanDoorman
RoomRoom
MinibarMinibar
Use customer’s nameUse customer’s name
Greet guest in less than 30 Greet guest in less than 30 secondsseconds
All lights working, spotless All lights working, spotless bathroombathroom
Restocked and charges Restocked and charges accurately posted to billaccurately posted to bill
Table 6.5Table 6.5
© 2008 Prentice Hall, Inc. 6 – 47
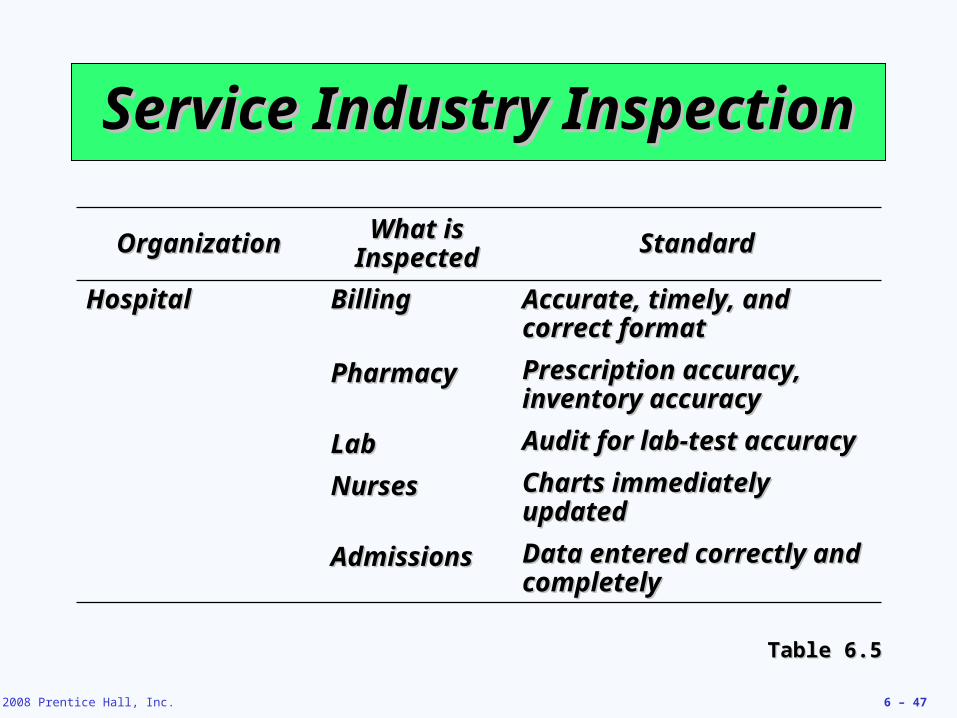
Service Industry InspectionService Industry Inspection
OrganizationOrganization What is What is InspectedInspected StandardStandard
HospitalHospital BillingBilling
PharmacyPharmacy
LabLab
NursesNurses
AdmissionsAdmissions
Accurate, timely, and Accurate, timely, and correct formatcorrect format
Prescription accuracy, Prescription accuracy, inventory accuracyinventory accuracy
Audit for lab-test accuracyAudit for lab-test accuracy
Charts immediately Charts immediately updatedupdated
Data entered correctly and Data entered correctly and completelycompletely
Table 6.5Table 6.5
© 2008 Prentice Hall, Inc. 6 – 48
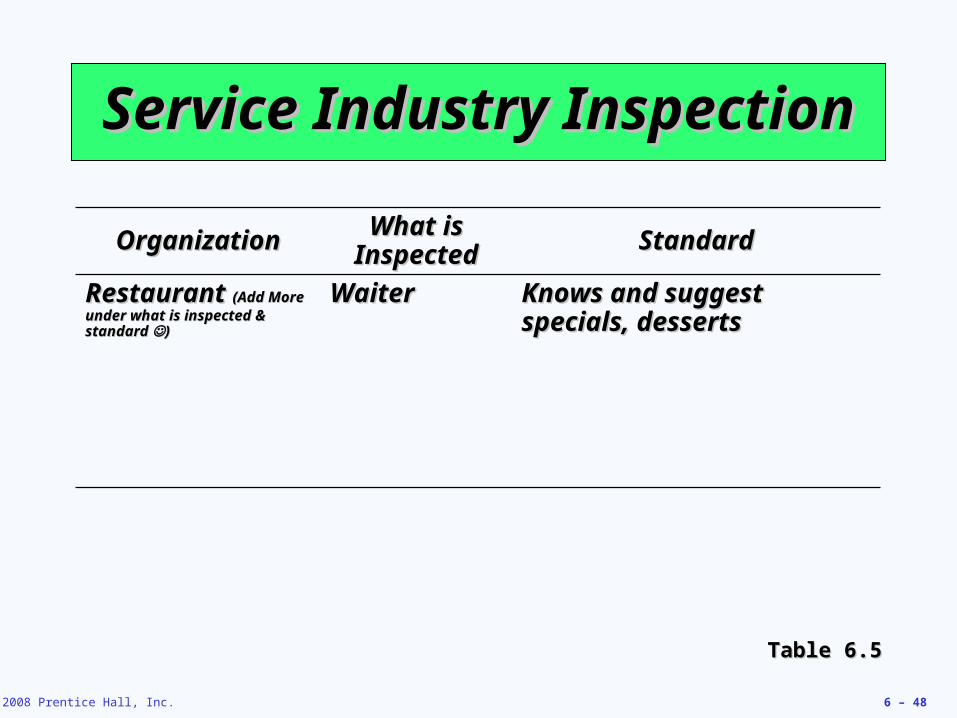
Service Industry InspectionService Industry Inspection
OrganizationOrganization What is What is InspectedInspected StandardStandard
Restaurant Restaurant (Add More (Add More under what is inspected & under what is inspected & standard standard ))
WaiterWaiter Knows and suggest Knows and suggest specials, dessertsspecials, desserts
Table 6.5Table 6.5
© 2008 Prentice Hall, Inc. 6 – 49
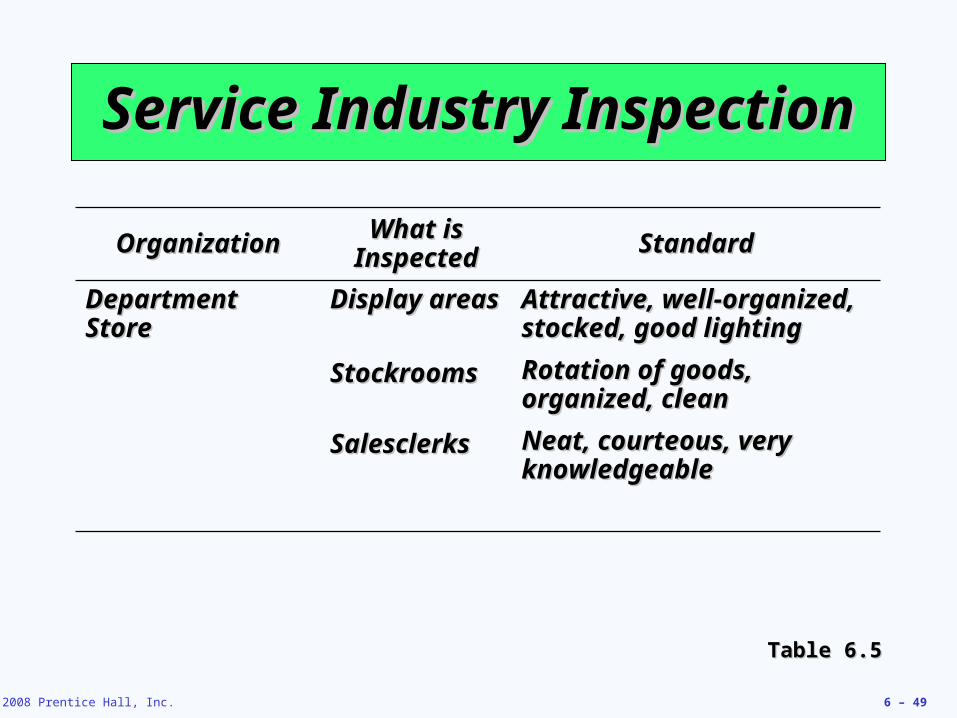
Service Industry InspectionService Industry Inspection
OrganizationOrganization What is What is InspectedInspected StandardStandard
Department Department StoreStore
Display areasDisplay areas
StockroomsStockrooms
SalesclerksSalesclerks
Attractive, well-organized, Attractive, well-organized, stocked, good lightingstocked, good lighting
Rotation of goods, Rotation of goods, organized, cleanorganized, clean
Neat, courteous, very Neat, courteous, very knowledgeableknowledgeable
Table 6.5Table 6.5
© 2008 Prentice Hall, Inc. 6 – 50
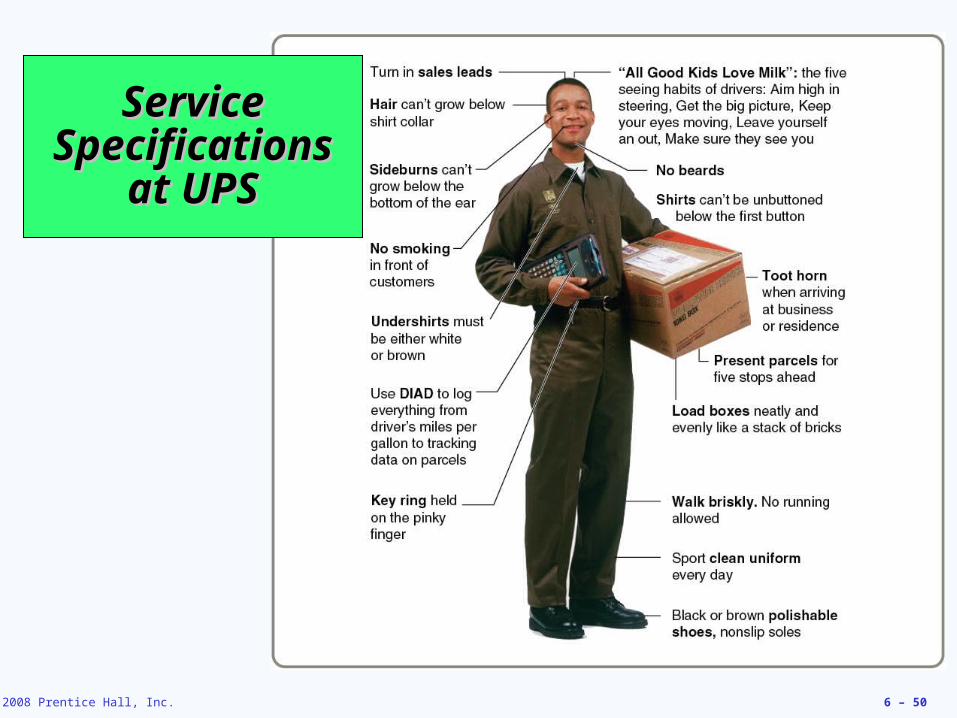
ServiceServiceSpecificationsSpecifications
at UPSat UPS
© 2008 Prentice Hall, Inc. 6 – 51© 2011 Pearson Education, Inc. publishing as Prentice Hall
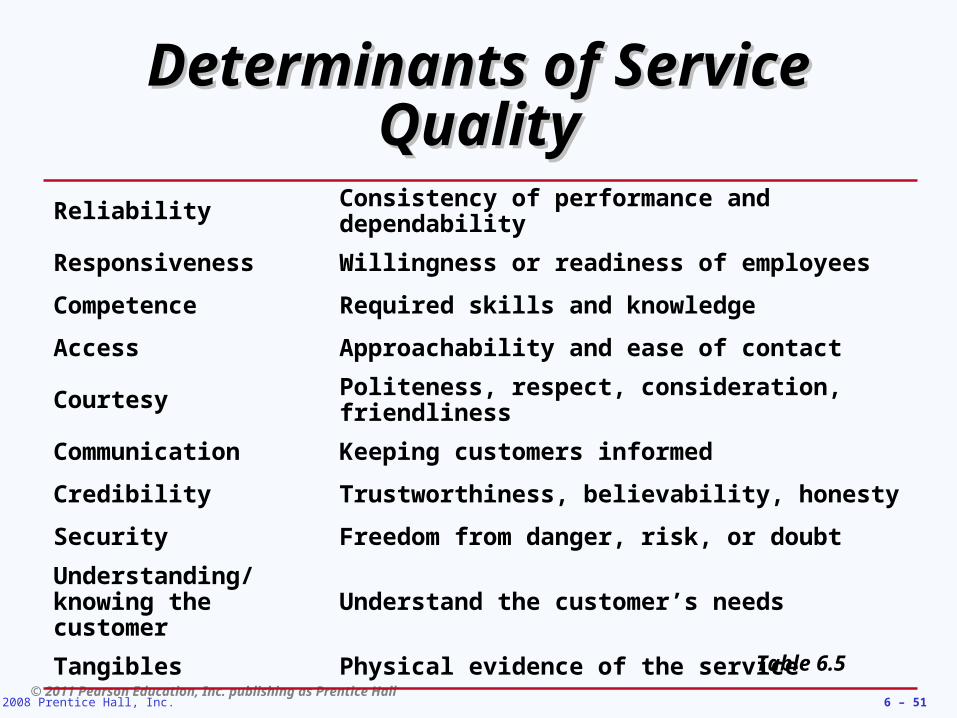
Determinants of Service Determinants of Service QualityQuality
Reliability Consistency of performance and dependability
Responsiveness Willingness or readiness of employees
Competence Required skills and knowledge
Access Approachability and ease of contact
Courtesy Politeness, respect, consideration, friendliness
Communication Keeping customers informed
Credibility Trustworthiness, believability, honesty
Security Freedom from danger, risk, or doubt
Understanding/ knowing the customer Understand the customer’s needs
Tangibles Physical evidence of the service
Table 6.5
© 2008 Prentice Hall, Inc. 6 – 52
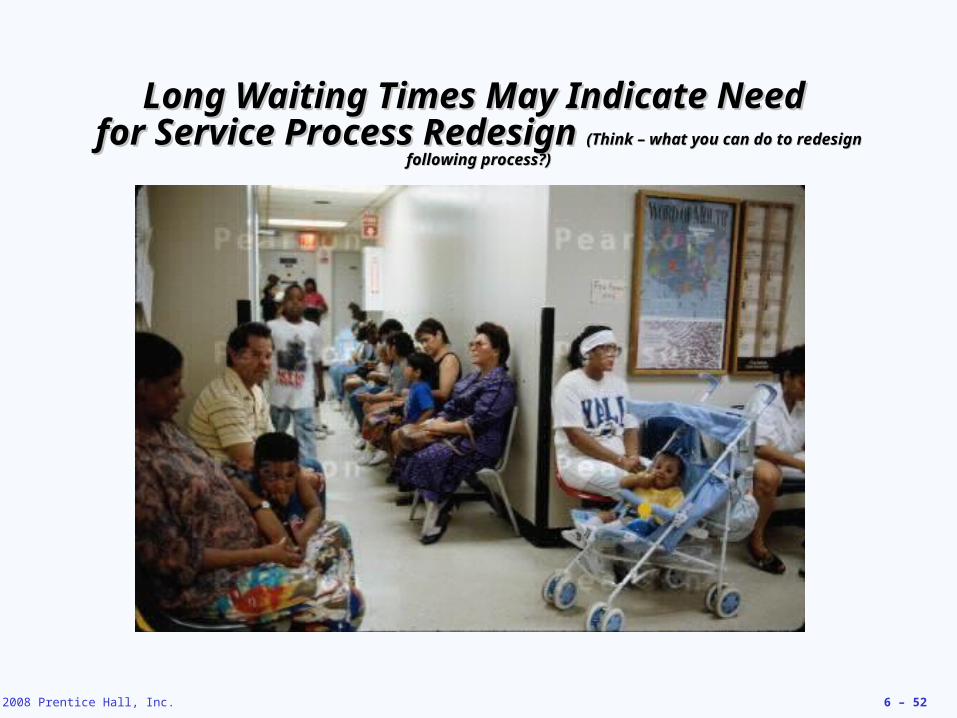
Long Waiting Times May Indicate Need Long Waiting Times May Indicate Need for Service Process Redesign for Service Process Redesign (Think – what you can do to (Think – what you can do to
redesign following process?)redesign following process?)
© 2008 Prentice Hall, Inc. 6 – 53
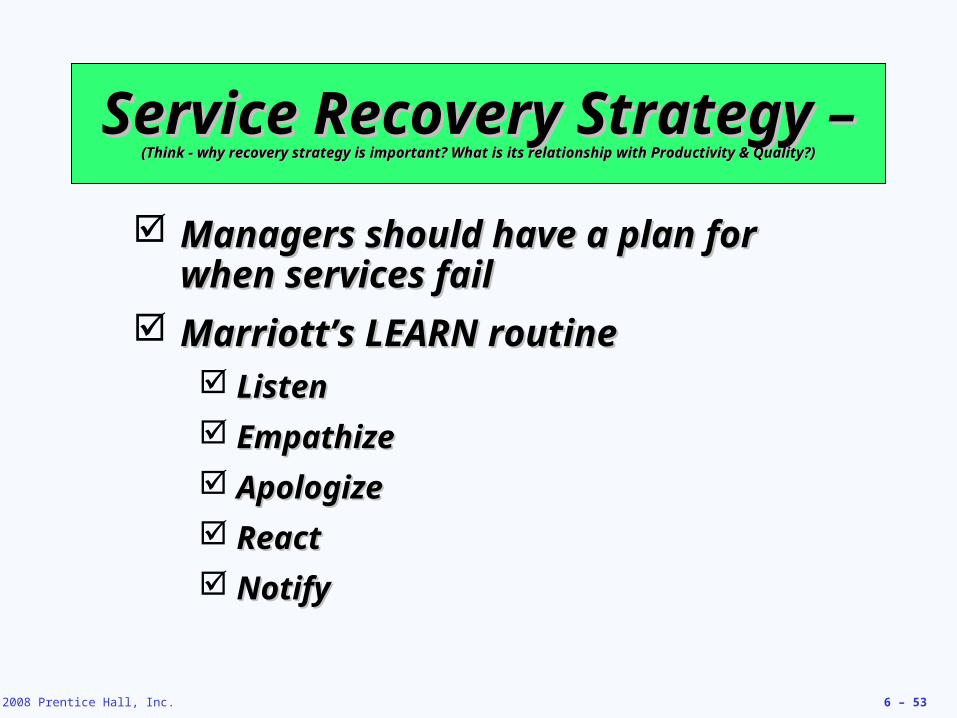
Service Recovery Strategy – Service Recovery Strategy – (Think - why recovery strategy is important? What is its relationship with Productivity & Quality?)(Think - why recovery strategy is important? What is its relationship with Productivity & Quality?)
Managers should have a plan for Managers should have a plan for when services failwhen services fail
Marriott’s LEARN routineMarriott’s LEARN routine ListenListen
EmpathizeEmpathize
ApologizeApologize
ReactReact
NotifyNotify
© 2008 Prentice Hall, Inc. 6 – 54
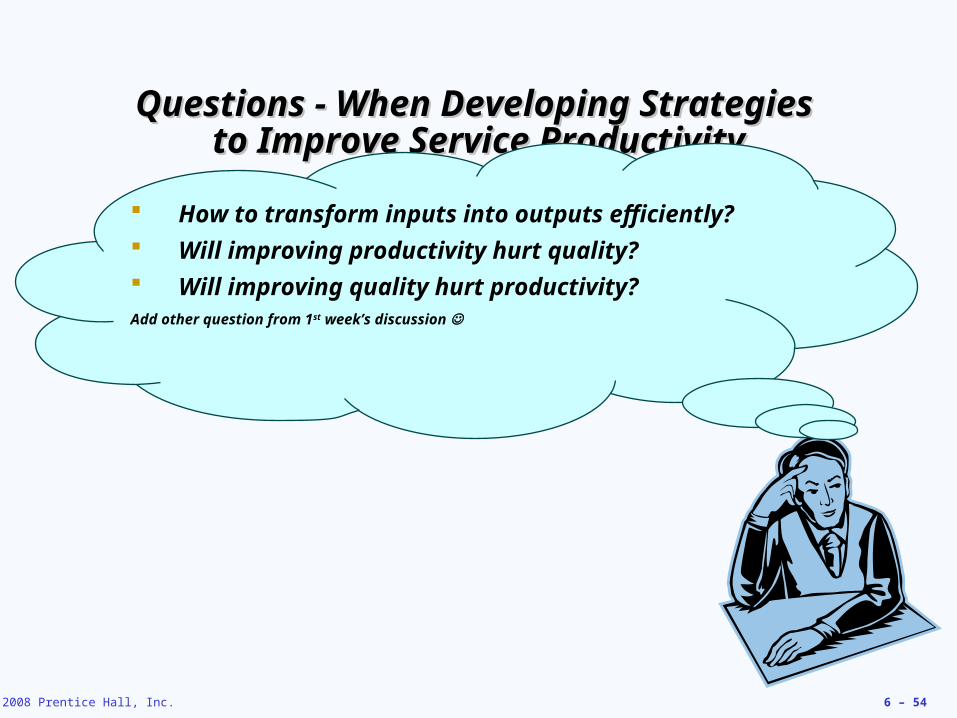
Questions - When Developing Strategies Questions - When Developing Strategies to Improve Service Productivityto Improve Service Productivity
How to transform inputs into outputs efficiently? Will improving productivity hurt quality? Will improving quality hurt productivity?Add other question from 1st week’s discussion
© 2008 Prentice Hall, Inc. 6 – 55
You guys start great debate there!! Quanity vs Quality & linking it You guys start great debate there!! Quanity vs Quality & linking it with market dynamics! Well done with market dynamics! Well done
© 2008 Prentice Hall, Inc. 6 – 56
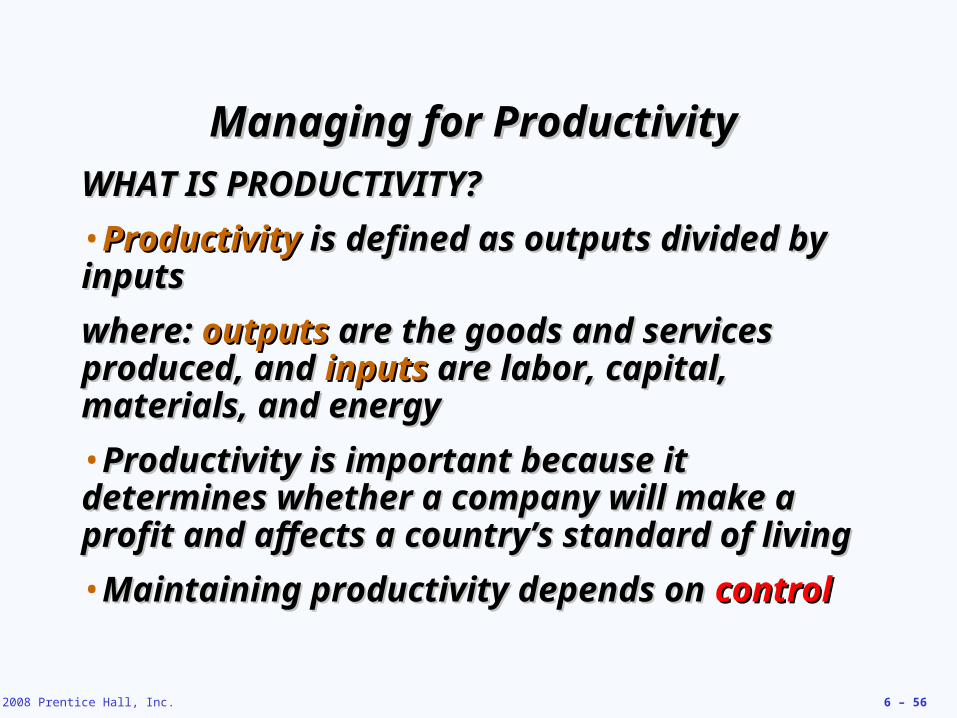
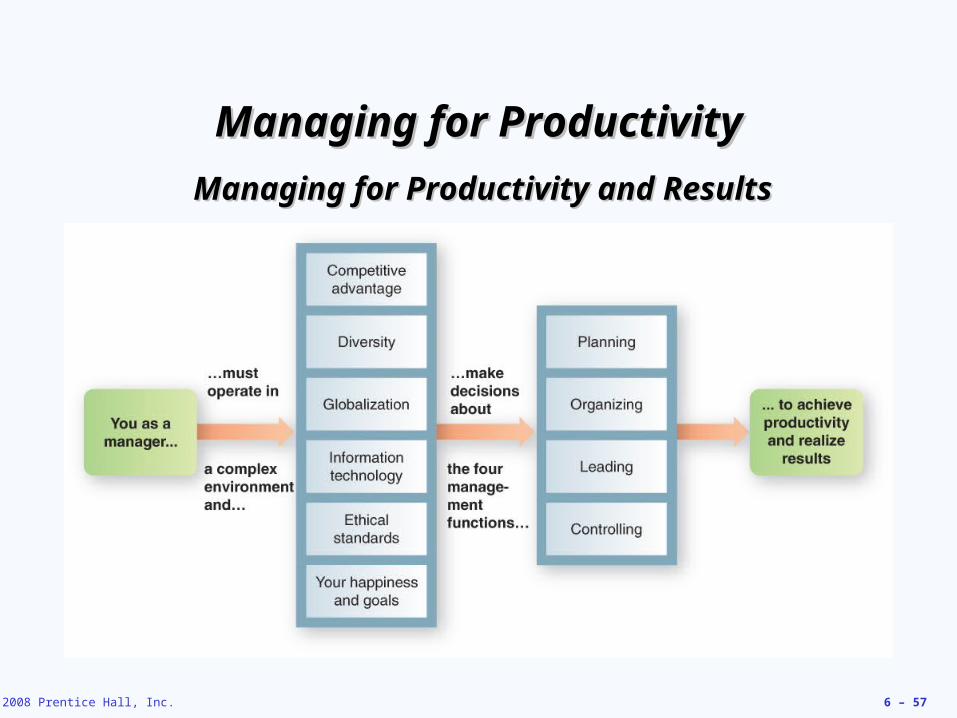
Managing for Productivity Managing for Productivity
WHAT IS PRODUCTIVITY?WHAT IS PRODUCTIVITY?
•ProductivityProductivity is defined as outputs divided by is defined as outputs divided by inputsinputs
where: where: outputsoutputs are the goods and services are the goods and services produced, and produced, and inputsinputs are labor, capital, are labor, capital, materials, and energymaterials, and energy
•Productivity is important because it determines Productivity is important because it determines whether a company will make a profit and whether a company will make a profit and affects a country’s standard of livingaffects a country’s standard of living
•Maintaining productivity depends on Maintaining productivity depends on controlcontrol
© 2008 Prentice Hall, Inc. 6 – 57
Managing for ProductivityManaging for Productivity
Managing for Productivity and ResultsManaging for Productivity and Results
© 2008 Prentice Hall, Inc. 6 – 58
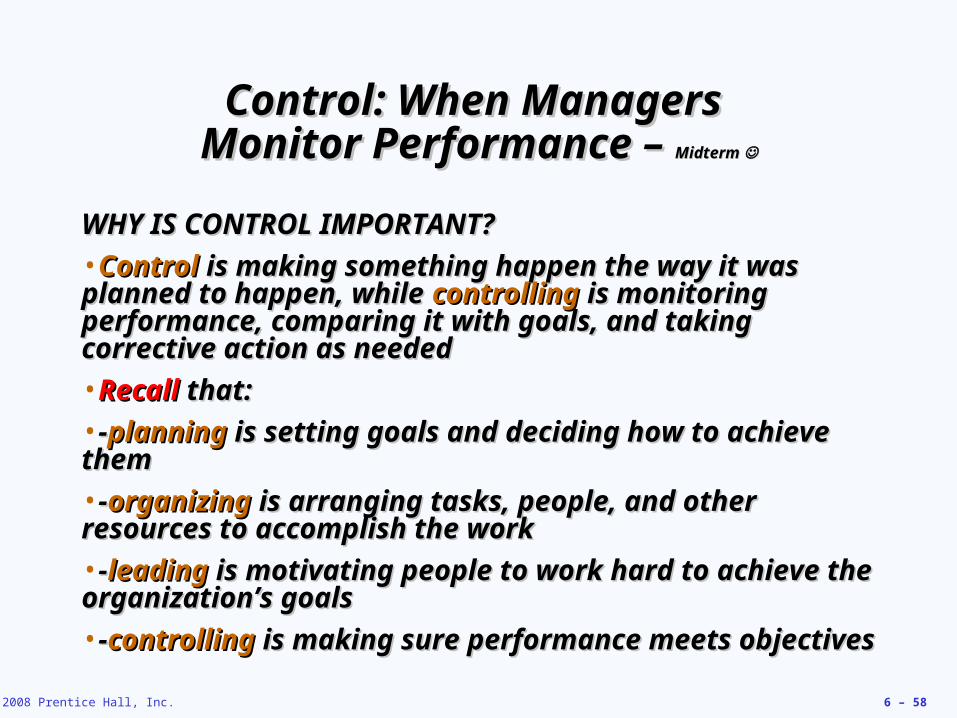
Control: When Managers Control: When Managers Monitor Performance – Monitor Performance – Midterm Midterm
WHY IS CONTROL IMPORTANT?WHY IS CONTROL IMPORTANT?
•Control Control is making something happen the way it was is making something happen the way it was planned to happen, while planned to happen, while controlling controlling is monitoring is monitoring performance, comparing it with goals, and taking performance, comparing it with goals, and taking corrective action as needed corrective action as needed
•RecallRecall that: that:
•--planningplanning is setting goals and deciding how to achieve is setting goals and deciding how to achieve themthem
•--organizingorganizing is arranging tasks, people, and other is arranging tasks, people, and other resources to accomplish the workresources to accomplish the work
•--leadingleading is motivating people to work hard to achieve is motivating people to work hard to achieve the organization’s goalsthe organization’s goals
•--controllingcontrolling is making sure performance meets is making sure performance meets objectivesobjectives
© 2008 Prentice Hall, Inc. 6 – 59
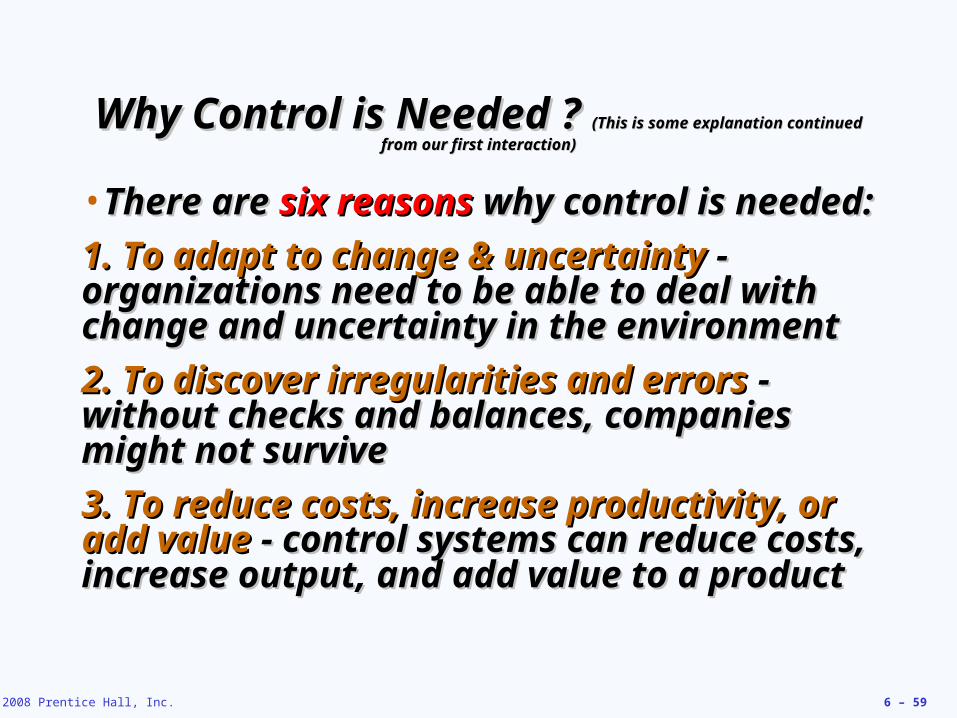
Why Control is Needed ? Why Control is Needed ? (This is some explanation continued (This is some explanation continued
from our first interaction)from our first interaction)
•There are There are six reasons six reasons why control is needed:why control is needed:
1.1. To adapt to change & uncertaintyTo adapt to change & uncertainty - - organizations need to be able to deal with organizations need to be able to deal with change and uncertainty in the environmentchange and uncertainty in the environment
2. To discover irregularities and errors2. To discover irregularities and errors - - without checks and balances, companies without checks and balances, companies might not survivemight not survive
3. To reduce costs, increase productivity, or 3. To reduce costs, increase productivity, or add valueadd value - control systems can reduce costs, - control systems can reduce costs, increase output, and add value to a productincrease output, and add value to a product
© 2008 Prentice Hall, Inc. 6 – 60
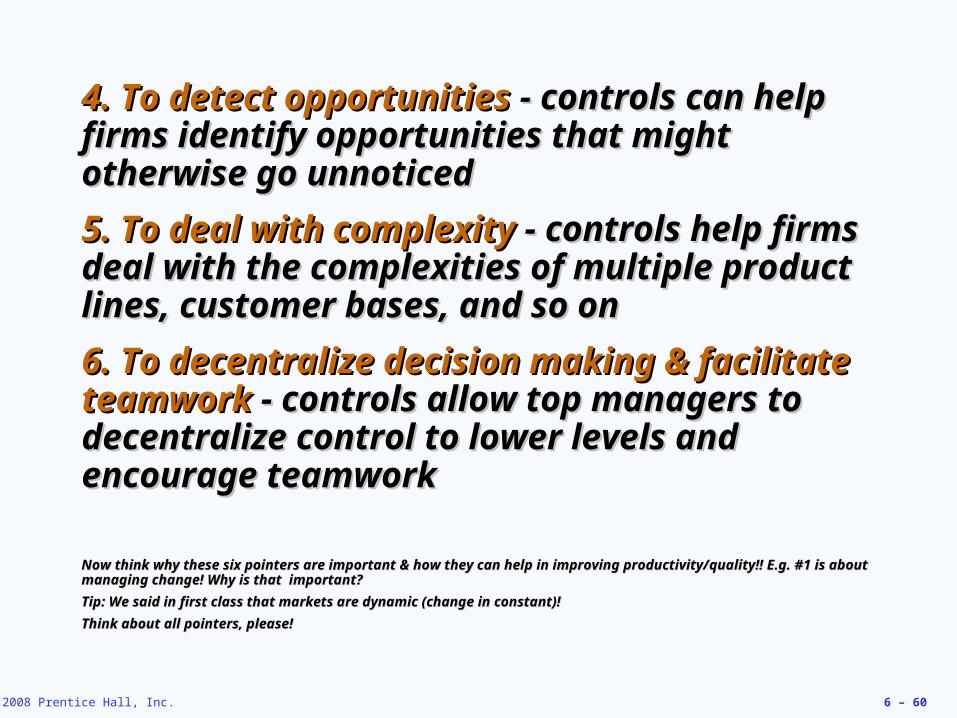
4. To detect opportunities4. To detect opportunities - controls can help - controls can help firms identify opportunities that might firms identify opportunities that might otherwise go unnoticedotherwise go unnoticed
5. To deal with complexity5. To deal with complexity - controls help - controls help firms deal with the complexities of multiple firms deal with the complexities of multiple product lines, customer bases, and so onproduct lines, customer bases, and so on
6. To decentralize decision making & facilitate 6. To decentralize decision making & facilitate teamworkteamwork - controls allow top managers to - controls allow top managers to decentralize control to lower levels and decentralize control to lower levels and encourage teamworkencourage teamwork
Now think why these six pointers are important & how they can help in improving productivity/quality!! E.g. #1 is Now think why these six pointers are important & how they can help in improving productivity/quality!! E.g. #1 is about managing change! Why is that important? about managing change! Why is that important?
Tip: We said in first class that markets are dynamic (change in constant)! Tip: We said in first class that markets are dynamic (change in constant)!
Think about all pointers, please! Think about all pointers, please!
© 2008 Prentice Hall, Inc. 6 – 61
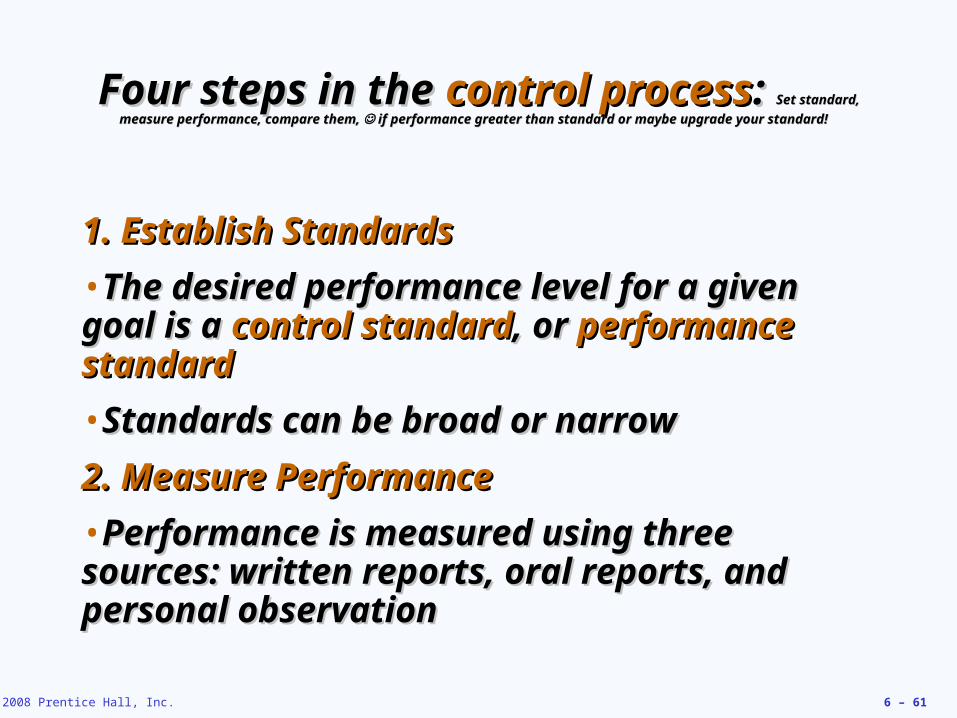
Four steps in the Four steps in the control processcontrol process: : Set standard, Set standard,
measure performance, compare them, measure performance, compare them, if performance greater than standard or maybe upgrade your standard! if performance greater than standard or maybe upgrade your standard!
1. Establish Standards1. Establish Standards
•The desired performance level for a given The desired performance level for a given goal is a goal is a control standardcontrol standard, or , or performance performance standardstandard
•Standards can be broad or narrow Standards can be broad or narrow
2. Measure Performance2. Measure Performance
•Performance is measured using three Performance is measured using three sources: written reports, oral reports, and sources: written reports, oral reports, and personal observationpersonal observation
© 2008 Prentice Hall, Inc. 6 – 62
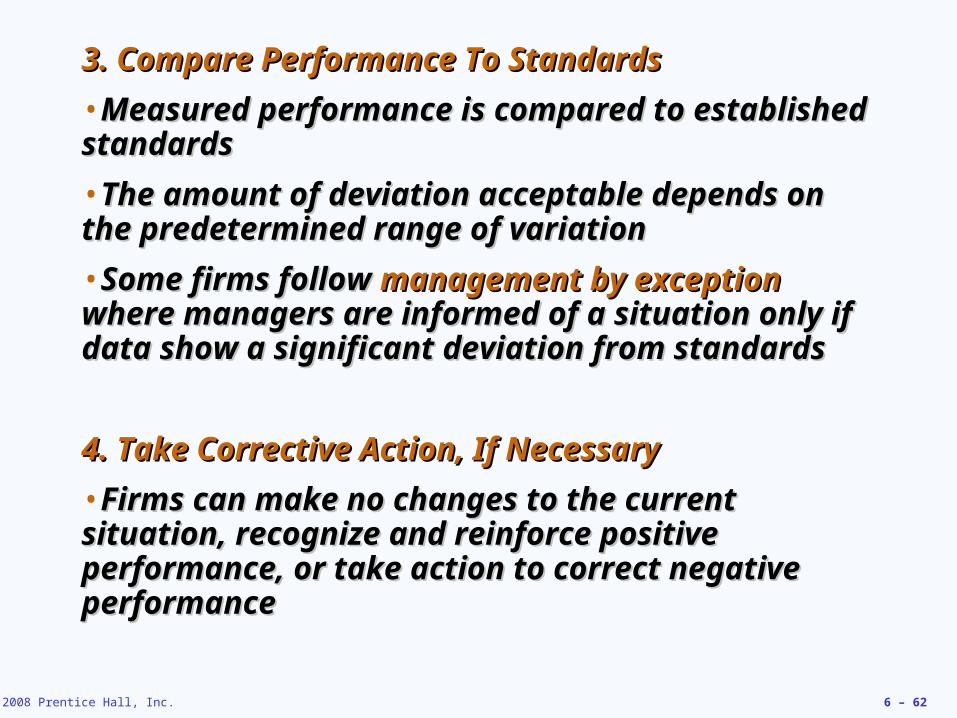
3. Compare Performance To Standards3. Compare Performance To Standards
•Measured performance is compared to established Measured performance is compared to established standardsstandards
•The amount of deviation acceptable depends on The amount of deviation acceptable depends on the predetermined range of variationthe predetermined range of variation
•Some firms follow Some firms follow management by exceptionmanagement by exception where managers are informed of a situation only if where managers are informed of a situation only if data show a significant deviation from standards data show a significant deviation from standards
4. Take Corrective Action, If Necessary4. Take Corrective Action, If Necessary
•Firms can make no changes to the current Firms can make no changes to the current situation, recognize and reinforce positive situation, recognize and reinforce positive performance, or take action to correct negative performance, or take action to correct negative performanceperformance
© 2008 Prentice Hall, Inc. 6 – 63
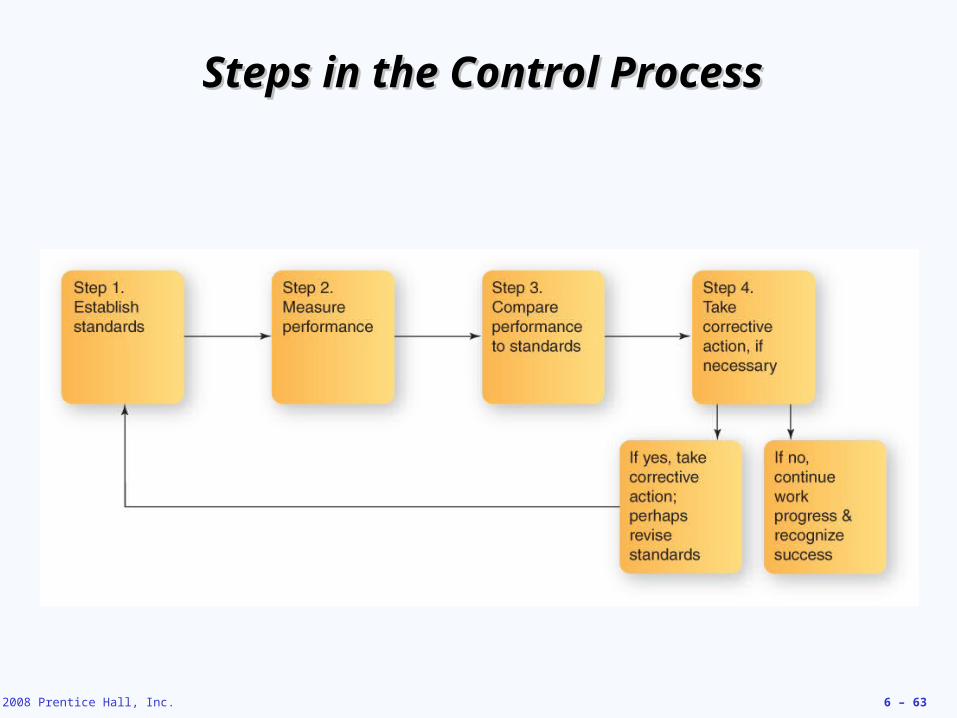
Steps in the Control ProcessSteps in the Control Process
© 2008 Prentice Hall, Inc. 6 – 64
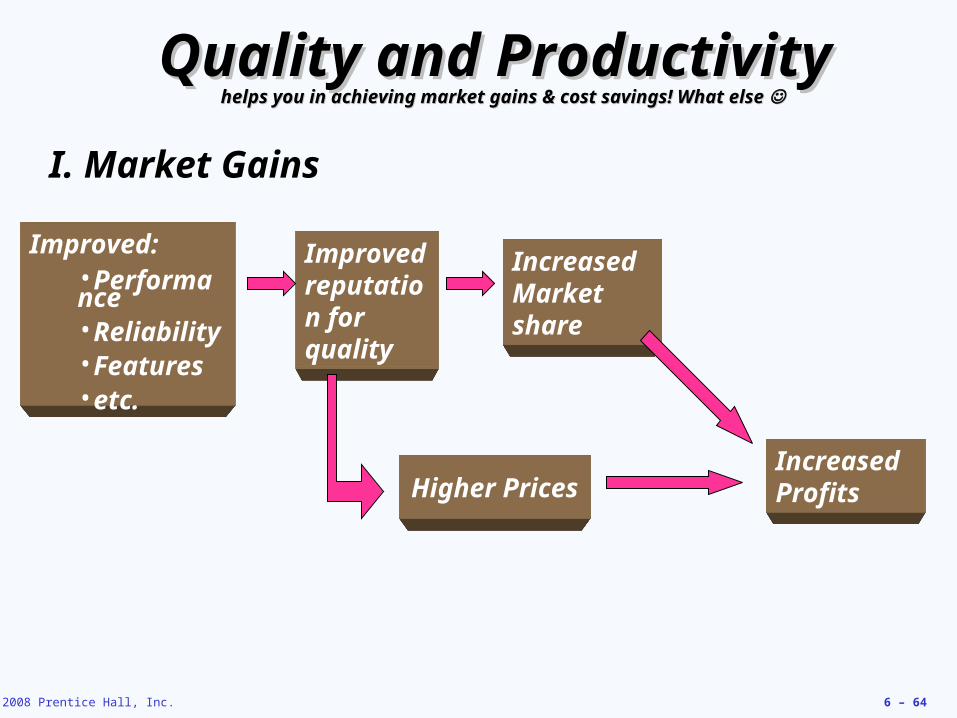
Quality and Productivity Quality and Productivity helps you in achieving market gains & cost savings! What else helps you in achieving market gains & cost savings! What else
Improved:•Performance•Reliability•Features•etc.
Improved reputation for quality
Increased Market share
Higher PricesIncreased Profits
I. Market Gains
© 2008 Prentice Hall, Inc. 6 – 65
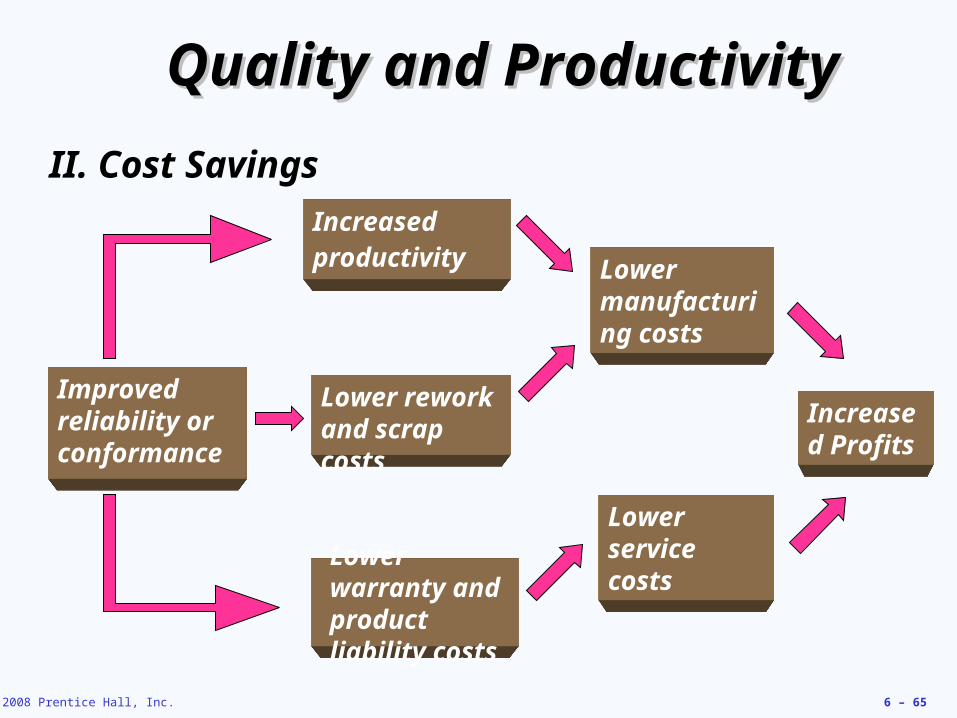
Quality and ProductivityQuality and Productivity
Improved reliability or conformance
Increasedproductivity Lower
manufacturing costs
Lower service costs
Lower warranty and product liability costs
Increased Profits
II. Cost Savings
Lower rework and scrap costs
© 2008 Prentice Hall, Inc. 6 – 66
Not just Quality but Manage Total Quality (TQM)Not just Quality but Manage Total Quality (TQM)I hope we got fair overview of Productivity & Quality ManagementI hope we got fair overview of Productivity & Quality Management
PleasePlease read around the concepts read around the concepts