© 2008 prentice hall, inc.15 – 1 operations management chapter 15 – short-term scheduling...
Post on 22-Dec-2015
371 views
TRANSCRIPT

© 2008 Prentice Hall, Inc. 15 – 1
Operations ManagementOperations ManagementChapter 15 – Chapter 15 – Short-Term SchedulingShort-Term Scheduling
PowerPoint presentation to accompany PowerPoint presentation to accompany Heizer/Render Heizer/Render Principles of Operations Management, 7ePrinciples of Operations Management, 7eOperations Management, 9e Operations Management, 9e

© 2008 Prentice Hall, Inc. 15 – 2
OutlineOutline
Global Company Profile: Global Company Profile: Delta Air LinesDelta Air Lines
The Strategic Importance of Short-The Strategic Importance of Short-Term SchedulingTerm Scheduling
Scheduling IssuesScheduling Issues Forward and Backward SchedulingForward and Backward Scheduling
Scheduling CriteriaScheduling Criteria

© 2008 Prentice Hall, Inc. 15 – 3
Outline – ContinuedOutline – Continued
Scheduling Process-Focused Scheduling Process-Focused FacilitiesFacilities
Loading JobsLoading Jobs Input-Output ControlInput-Output Control
Gantt ChartsGantt Charts
Assignment MethodAssignment Method

© 2008 Prentice Hall, Inc. 15 – 4
Outline – ContinuedOutline – Continued
Sequencing JobsSequencing Jobs Priority Rules for Dispatching JobsPriority Rules for Dispatching Jobs
Critical RatioCritical Ratio
Sequencing N Jobs on Two Sequencing N Jobs on Two Machines: Johnson’s RuleMachines: Johnson’s Rule
Limitations of Rule-Based Limitations of Rule-Based Dispatching SystemsDispatching Systems
Finite Capacity Scheduling (FCS)Finite Capacity Scheduling (FCS)

© 2008 Prentice Hall, Inc. 15 – 5
Outline – ContinuedOutline – Continued
Theory of ConstraintsTheory of Constraints BottlenecksBottlenecks
Drum, Buffer, RopeDrum, Buffer, Rope
Scheduling Repetitive FacilitiesScheduling Repetitive Facilities
Scheduling ServicesScheduling Services Scheduling Service Employees with Scheduling Service Employees with
Cyclical SchedulingCyclical Scheduling

© 2008 Prentice Hall, Inc. 15 – 6
Learning ObjectivesLearning Objectives
When you complete this chapter you When you complete this chapter you should be able to:should be able to:
1.1. Explain the relationship between short-Explain the relationship between short-term scheduling, capacity planning, term scheduling, capacity planning, aggregate planning, and a master aggregate planning, and a master scheduleschedule
2.2. Draw Gantt loading and scheduling Draw Gantt loading and scheduling chartscharts
3.3. Apply the assignment method for Apply the assignment method for loading jobsloading jobs
© 2008 Prentice Hall, Inc. 15 – 7
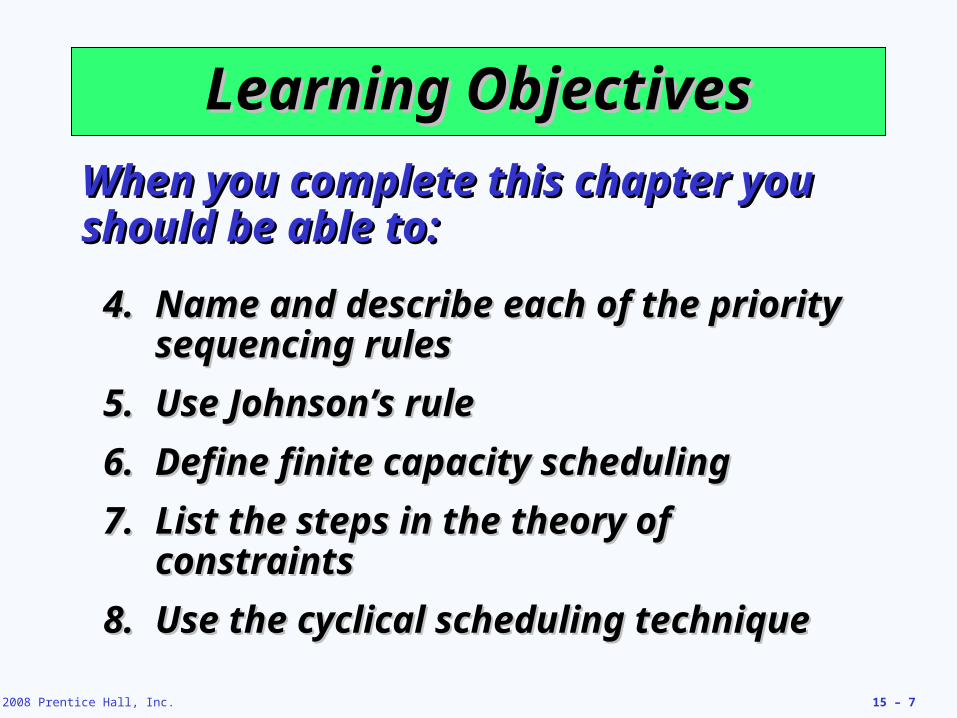
Learning ObjectivesLearning Objectives
When you complete this chapter you When you complete this chapter you should be able to:should be able to:
4.4. Name and describe each of the priority Name and describe each of the priority sequencing rulessequencing rules
5.5. Use Johnson’s ruleUse Johnson’s rule
6.6. Define finite capacity schedulingDefine finite capacity scheduling
7.7. List the steps in the theory of List the steps in the theory of constraintsconstraints
8.8. Use the cyclical scheduling techniqueUse the cyclical scheduling technique

© 2008 Prentice Hall, Inc. 15 – 8
Delta AirlinesDelta Airlines
About 10% of Delta’s flights are About 10% of Delta’s flights are disrupted per year, half because of disrupted per year, half because of weatherweather
Cost is $440 million in lost revenue, Cost is $440 million in lost revenue, overtime pay, food and lodging overtime pay, food and lodging vouchersvouchers
The $33 million Operations Control The $33 million Operations Control Center adjusts to changes and keeps Center adjusts to changes and keeps flights flowingflights flowing
Saves Delta $35 million per yearSaves Delta $35 million per year

© 2008 Prentice Hall, Inc. 15 – 9
Strategic Importance of Strategic Importance of Short-Term SchedulingShort-Term Scheduling
Effective and efficient scheduling Effective and efficient scheduling can be a competitive advantagecan be a competitive advantage Faster movement of goods through a Faster movement of goods through a
facility means better use of assets facility means better use of assets and lower costsand lower costs
Additional capacity resulting from Additional capacity resulting from faster throughput improves customer faster throughput improves customer service through faster deliveryservice through faster delivery
Good schedules result in more Good schedules result in more dependable deliveriesdependable deliveries

© 2008 Prentice Hall, Inc. 15 – 10
Scheduling IssuesScheduling Issues
Scheduling deals with the timing of Scheduling deals with the timing of operationsoperations
The task is the allocation and The task is the allocation and prioritization of demandprioritization of demand
Significant issues areSignificant issues are The type of scheduling, forward or The type of scheduling, forward or
backwardbackward
The criteria for prioritiesThe criteria for priorities

© 2008 Prentice Hall, Inc. 15 – 11
Scheduling DecisionsScheduling Decisions
OrganizationOrganization Managers Must Schedule the FollowingManagers Must Schedule the Following
Arnold Palmer Arnold Palmer HospitalHospital
Operating room useOperating room usePatient admissionsPatient admissionsNursing, security, maintenance staffsNursing, security, maintenance staffsOutpatient treatmentsOutpatient treatments
University of University of MissouriMissouri
Classrooms and audiovisual equipmentClassrooms and audiovisual equipmentStudent and instructor schedulesStudent and instructor schedulesGraduate and undergraduate coursesGraduate and undergraduate courses
Lockheed Martin Lockheed Martin factoryfactory
Production of goodsProduction of goodsPurchases of materialsPurchases of materialsWorkersWorkers
Hard Rock CafeHard Rock Cafe Chef, waiters, bartendersChef, waiters, bartendersDelivery of fresh foodsDelivery of fresh foodsEntertainersEntertainersOpening of dining areasOpening of dining areas
Delta Air LinesDelta Air Lines Maintenance of aircraftMaintenance of aircraftDeparture timetablesDeparture timetablesFlight crews, catering, gate, ticketing personnelFlight crews, catering, gate, ticketing personnelTable 15.1Table 15.1

© 2008 Prentice Hall, Inc. 15 – 12
Figure 15.1Figure 15.1
Scheduling Scheduling FlowFlow

© 2008 Prentice Hall, Inc. 15 – 13
Forward and Backward Forward and Backward SchedulingScheduling
Forward scheduling starts as soon Forward scheduling starts as soon as the requirements are knownas the requirements are known
Produces a feasible schedule Produces a feasible schedule though it may not meet due datesthough it may not meet due dates
Frequently results in Frequently results in buildup of work-in-buildup of work-in-process inventoryprocess inventory
Due Due DateDateNowNow

© 2008 Prentice Hall, Inc. 15 – 14
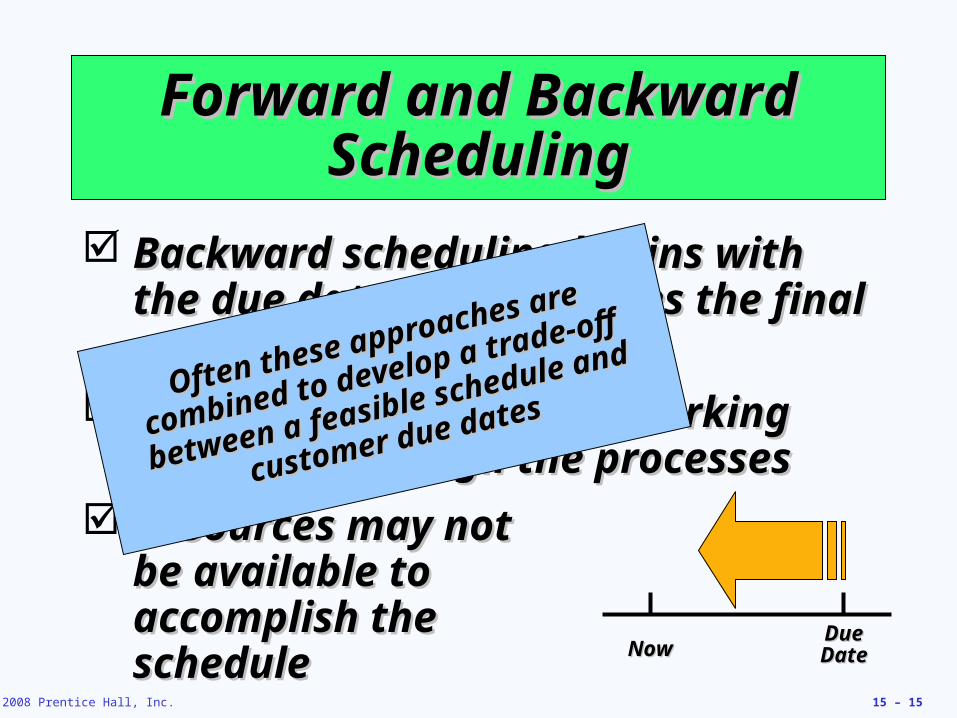
Forward and Backward Forward and Backward SchedulingScheduling
Backward scheduling begins with Backward scheduling begins with the due date and schedules the final the due date and schedules the final operation firstoperation first
Schedule is produced by working Schedule is produced by working backwards though the processesbackwards though the processes
Resources may not Resources may not be available to be available to accomplish the accomplish the scheduleschedule
Due Due DateDateNowNow
© 2008 Prentice Hall, Inc. 15 – 15
Forward and Backward Forward and Backward SchedulingScheduling
Backward scheduling begins with Backward scheduling begins with the due date and schedules the final the due date and schedules the final operation firstoperation first
Schedule is produced by working Schedule is produced by working backwards though the processesbackwards though the processes
Resources may not Resources may not be available to be available to accomplish the accomplish the scheduleschedule
Due Due DateDateNowNow
Often these approaches are
Often these approaches are
combined to develop a trade-off
combined to develop a trade-off
between a feasible schedule and
between a feasible schedule and
customer due dates
customer due dates

© 2008 Prentice Hall, Inc. 15 – 16
Different Processes/ Different Processes/ Different ApproachesDifferent Approaches
Process-focused Process-focused facilitiesfacilities
Forward-looking schedulesForward-looking schedulesMRP due datesMRP due datesFinite capacity schedulingFinite capacity scheduling
Work cellsWork cells Forward-looking schedulesForward-looking schedulesMRP due datesMRP due datesDetailed schedule done using work cell Detailed schedule done using work cell priority rulespriority rules
Repetitive facilitiesRepetitive facilities Forward-looking schedule with a Forward-looking schedule with a balanced linebalanced linePull techniques for schedulingPull techniques for scheduling
Product-focused Product-focused facilitiesfacilities
Forward-looking schedule with stable Forward-looking schedule with stable demand and fixed capacitydemand and fixed capacityCapacity, set-up, and run times knownCapacity, set-up, and run times knownCapacity limited by long-term capital Capacity limited by long-term capital investmentinvestmentTable 15.2Table 15.2

© 2008 Prentice Hall, Inc. 15 – 17
Scheduling CriteriaScheduling Criteria
1.1. Minimize completion timeMinimize completion time
2.2. Maximize utilization of facilitiesMaximize utilization of facilities
3.3. Minimize work-in-process (WIP) Minimize work-in-process (WIP) inventoryinventory
4.4. Minimize customer waiting timeMinimize customer waiting time
Optimize the use of resources so Optimize the use of resources so that production objectives are metthat production objectives are met

© 2008 Prentice Hall, Inc. 15 – 18
Scheduling Process-Scheduling Process-Focused FacilitiesFocused Facilities
1.1. Schedule incoming orders without Schedule incoming orders without violating capacity constraintsviolating capacity constraints
2.2. Check availability of tools and materials Check availability of tools and materials before releasing an orderbefore releasing an order
3.3. Establish due dates for each job and Establish due dates for each job and check progresscheck progress
4.4. Check work in progressCheck work in progress
5.5. Provide feedbackProvide feedback
6.6. Provide work efficiency statistics and Provide work efficiency statistics and monitor timesmonitor times

© 2008 Prentice Hall, Inc. 15 – 19
Planning and Control FilesPlanning and Control Files
1.1. An item master file contains information about An item master file contains information about each componenteach component
2.2. A routing file indicates each component’s flow A routing file indicates each component’s flow through the shopthrough the shop
3.3. A work-center master file contains information A work-center master file contains information about the work centerabout the work center
Planning FilesPlanning Files
Control FilesControl Files
Track the actual progress made against Track the actual progress made against the planthe plan

© 2008 Prentice Hall, Inc. 15 – 20
Loading JobsLoading Jobs
Assign jobs so that costs, idle Assign jobs so that costs, idle time, or completion time are time, or completion time are minimizedminimized
Two forms of loadingTwo forms of loading Capacity orientedCapacity oriented
Assigning specific jobs to work Assigning specific jobs to work centerscenters

© 2008 Prentice Hall, Inc. 15 – 21
Input-Output ControlInput-Output Control
Identifies overloading and Identifies overloading and underloading conditionsunderloading conditions
Prompts managerial action to Prompts managerial action to resolve scheduling problemsresolve scheduling problems
Can be maintained using ConWIP Can be maintained using ConWIP cards that control the scheduling cards that control the scheduling of batchesof batches
© 2008 Prentice Hall, Inc. 15 – 22
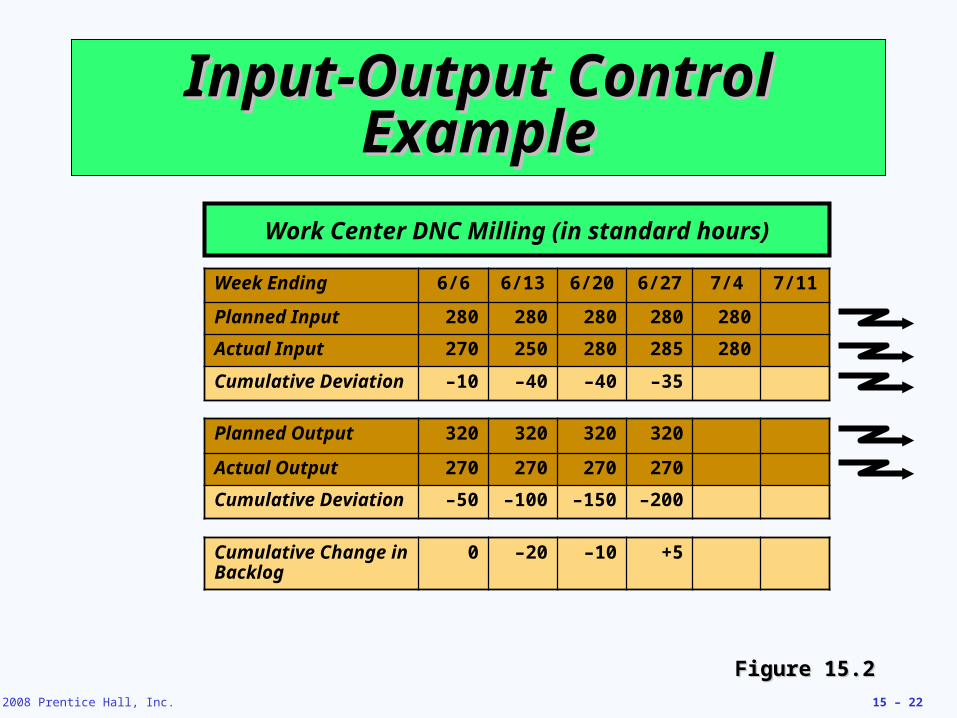
Input-Output Control Input-Output Control ExampleExample
Week Ending 6/6 6/13 6/20 6/27 7/4 7/11
Planned Input 280 280 280 280 280
Actual Input 270 250 280 285 280
Cumulative Deviation –10 –40 –40 –35
Planned Output 320 320 320 320
Actual Output 270 270 270 270
Cumulative Deviation –50 –100 –150 –200
Cumulative Change in Backlog
0 –20 –10 +5
Figure 15.2Figure 15.2
Work Center DNC Milling (in standard hours)

© 2008 Prentice Hall, Inc. 15 – 23
Input-Output Control Input-Output Control ExampleExample
Work Center DNC Milling (in standard hours)
Week Ending 6/6 6/13 6/20 6/27 7/4 7/11
Planned Input 280 280 280 280 280
Actual Input 270 250 280 285 280
Cumulative Deviation –10 –40 –40 –35
Planned Output 320 320 320 320
Actual Output 270 270 270 270
Cumulative Deviation –50 –100 –150 –200
Cumulative Change in Backlog
0 –20 –10 +5
Explanation:270 input, 270 output implies 0 change
Explanation: 250 input,270 output implies –20 change
Figure 15.2Figure 15.2

© 2008 Prentice Hall, Inc. 15 – 24
Input-Output Control Input-Output Control ExampleExample
Options available to operations Options available to operations personnel include:personnel include:
1.1. Correcting performancesCorrecting performances
2.2. Increasing capacityIncreasing capacity
3.3. Increasing or reducing input to Increasing or reducing input to the work centerthe work center

© 2008 Prentice Hall, Inc. 15 – 25
Gantt ChartsGantt Charts
Load chart shows the loading and Load chart shows the loading and idle times of departments, machines, idle times of departments, machines, or facilitiesor facilities
Displays relative workloads over Displays relative workloads over timetime
Schedule chart monitors jobs in Schedule chart monitors jobs in processprocess
All Gantt charts need to be updated All Gantt charts need to be updated frequently to account for changesfrequently to account for changes

© 2008 Prentice Hall, Inc. 15 – 26
Gantt Load Chart ExampleGantt Load Chart Example
Figure 15.3Figure 15.3
Day Monday Tuesday Wednesday Thursday FridayWork Center
Metalworks
Mechanical
Electronics
Painting
Job 349
Job 349
Job 349
Job 408
Job 408
Job 408
ProcessingProcessing UnscheduledUnscheduled Center not availableCenter not available
Job 350
Job 349
Job 295

© 2008 Prentice Hall, Inc. 15 – 27
Gantt Schedule Chart Gantt Schedule Chart ExampleExample
Figure 15.4Figure 15.4
Job Day 1
Day 2
Day 3
Day 4
Day 5
Day 6
Day 7
Day 8
A
B
C
NowNow
Maintenance
Start of an Start of an activityactivity
End of an End of an activityactivity
Scheduled Scheduled activity time activity time allowedallowed
Actual work Actual work progressprogress
Nonproduction Nonproduction timetime
Point in time Point in time when chart is when chart is reviewedreviewed

© 2008 Prentice Hall, Inc. 15 – 28
Assignment MethodAssignment Method
A special class of linear A special class of linear programming models that assign programming models that assign tasks or jobs to resourcestasks or jobs to resources
Objective is to minimize cost or Objective is to minimize cost or timetime
Only one job (or worker) is Only one job (or worker) is assigned to one machine (or assigned to one machine (or project)project)
© 2008 Prentice Hall, Inc. 15 – 29
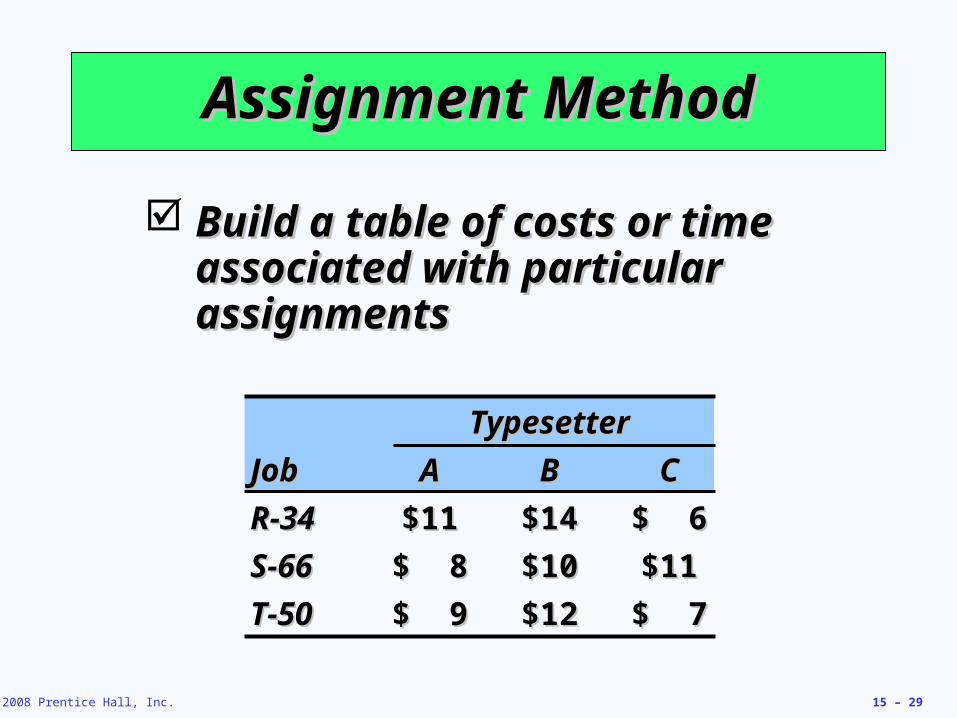
Assignment MethodAssignment Method
Build a table of costs or time Build a table of costs or time associated with particular associated with particular assignmentsassignments
TypesetterTypesetter
JobJob AA BB CC
R-34R-34 $11$11 $14$14 $ 6$ 6
S-66S-66 $ 8$ 8 $10$10 $11$11
T-50T-50 $ 9$ 9 $12$12 $ 7$ 7

© 2008 Prentice Hall, Inc. 15 – 30
Assignment MethodAssignment Method
1.1. Create zero opportunity costs by Create zero opportunity costs by repeatedly subtracting the lowest costs repeatedly subtracting the lowest costs from each row and columnfrom each row and column
2.2. Draw the minimum number of vertical Draw the minimum number of vertical and horizontal lines necessary to cover and horizontal lines necessary to cover all the zeros in the table. If the number all the zeros in the table. If the number of lines equals either the number of of lines equals either the number of rows or the number of columns, rows or the number of columns, proceed to step 4. Otherwise proceed to proceed to step 4. Otherwise proceed to step 3.step 3.
© 2008 Prentice Hall, Inc. 15 – 31
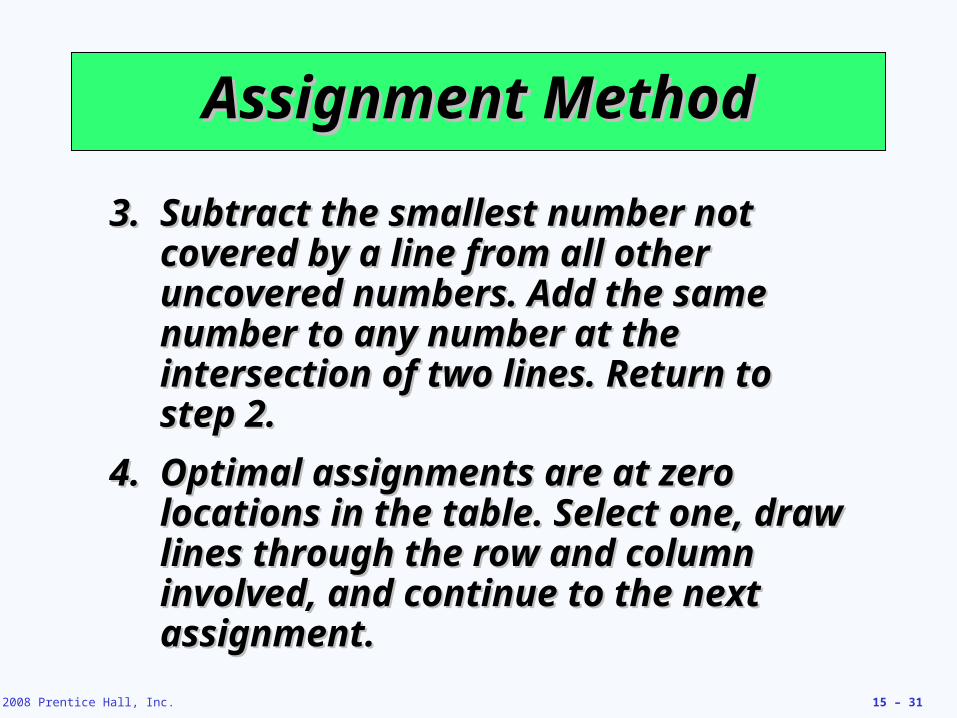
Assignment MethodAssignment Method
3.3. Subtract the smallest number not Subtract the smallest number not covered by a line from all other covered by a line from all other uncovered numbers. Add the same uncovered numbers. Add the same number to any number at the number to any number at the intersection of two lines. Return to intersection of two lines. Return to step 2.step 2.
4.4. Optimal assignments are at zero Optimal assignments are at zero locations in the table. Select one, draw locations in the table. Select one, draw lines through the row and column lines through the row and column involved, and continue to the next involved, and continue to the next assignment.assignment.

© 2008 Prentice Hall, Inc. 15 – 32
Assignment ExampleAssignment Example
AA BB CCJobJob
R-34R-34 $11$11 $14$14 $ 6$ 6
S-66S-66 $ 8$ 8 $10$10 $11$11
T-50T-50 $ 9$ 9 $12$12 $ 7$ 7
TypesetterTypesetter
AA BB CCJobJob
R-34R-34 $ 5$ 5 $ 8$ 8 $ 0$ 0
S-66S-66 $ 0$ 0 $ 2$ 2 $ 3$ 3
T-50T-50 $ 2$ 2 $ 5$ 5 $ 0$ 0
TypesetterTypesetter
Step 1a - RowsStep 1a - Rows
AA BB CCJobJob
R-34R-34 $ 5$ 5 $ 6$ 6 $ 0$ 0
S-66S-66 $ 0$ 0 $ 0$ 0 $ 3$ 3
T-50T-50 $ 2$ 2 $ 3$ 3 $ 0$ 0
TypesetterTypesetter
Step 1b - ColumnsStep 1b - Columns

© 2008 Prentice Hall, Inc. 15 – 33
Assignment ExampleAssignment Example
Step 2 - LinesStep 2 - Lines
AA BB CCJobJob
R-34R-34 $ 5$ 5 $ 6$ 6 $ 0$ 0
S-66S-66 $ 0$ 0 $ 0$ 0 $ 3$ 3
T-50T-50 $ 2$ 2 $ 3$ 3 $ 0$ 0
TypesetterTypesetter
Because only two lines Because only two lines are needed to cover all are needed to cover all the zeros, the solution the zeros, the solution is not optimalis not optimal
Step 3 - SubtractionStep 3 - Subtraction
AA BB CCJobJob
R-34R-34 $ 3$ 3 $ 4$ 4 $ 0$ 0
S-66S-66 $ 0$ 0 $ 0$ 0 $ 5$ 5
T-50T-50 $ 0$ 0 $ 1$ 1 $ 0$ 0
TypesetterTypesetter
The smallest uncovered The smallest uncovered number is 2 so this is number is 2 so this is subtracted from all other subtracted from all other uncovered numbers and uncovered numbers and added to numbers at the added to numbers at the intersection of linesintersection of lines

© 2008 Prentice Hall, Inc. 15 – 34
Assignment ExampleAssignment Example
Because three lines are Because three lines are needed, the solution is needed, the solution is optimal and optimal and assignments can be assignments can be mademade
Step 2 - LinesStep 2 - Lines
AA BB CCJobJob
R-34R-34 $ 3$ 3 $ 4$ 4 $ 0$ 0
S-66S-66 $ 0$ 0 $ 0$ 0 $ 5$ 5
T-50T-50 $ 0$ 0 $ 1$ 1 $ 0$ 0
TypesetterTypesetter
Start by assigning R-34 to Start by assigning R-34 to worker C as this is the only worker C as this is the only possible assignment for possible assignment for worker C.worker C.
Step 4 - AssignmentsStep 4 - Assignments
AA BB CCJobJobR-34 $ 3$ 3 $ 4$ 4 $ 0S-66 $ 0$ 0 $ 0 $ 5$ 5T-50 $ 0 $ 1$ 1 $ 0$ 0
TypesetterTypesetter
Job T-50 must Job T-50 must go to worker A as worker C go to worker A as worker C is already assigned. This is already assigned. This leaves S-66 for worker B.leaves S-66 for worker B.

© 2008 Prentice Hall, Inc. 15 – 35
Assignment ExampleAssignment Example
From the original cost table
Minimum cost = $6 + $10 + $9 = $25
Step 4 - AssignmentsStep 4 - Assignments
AA BB CCJobJobR-34 $ 3$ 3 $ 4$ 4 $ 0S-66 $ 0$ 0 $ 0 $ 5$ 5T-50 $ 0 $ 1$ 1 $ 0$ 0
TypesetterTypesetterAA BB CC
JobJob
R-34R-34 $11$11 $14$14 $ 6$ 6
S-66S-66 $ 8$ 8 $10$10 $11$11
T-50T-50 $ 9$ 9 $12$12 $ 7$ 7
TypesetterTypesetter

© 2008 Prentice Hall, Inc. 15 – 36
Sequencing JobsSequencing Jobs
Specifies the order in which jobs Specifies the order in which jobs should be performed at work centersshould be performed at work centers
Priority rules are used to dispatch or Priority rules are used to dispatch or sequence jobssequence jobs FCFS: First come, first servedFCFS: First come, first served
SPT: Shortest processing timeSPT: Shortest processing time
EDD: Earliest due dateEDD: Earliest due date
LPT: Longest processing timeLPT: Longest processing time

© 2008 Prentice Hall, Inc. 15 – 37
Sequencing ExampleSequencing Example
JobJob
Job Work Job Work (Processing) Time(Processing) Time
(Days)(Days)
Job Due Job Due DateDate
(Days)(Days)
AA 66 88
BB 22 66
CC 88 1818
DD 33 1515
EE 99 2323
Apply the four popular sequencing rules Apply the four popular sequencing rules to these five jobsto these five jobs

© 2008 Prentice Hall, Inc. 15 – 38
Sequencing ExampleSequencing Example
Job Job SequenceSequence
Job Work Job Work (Processing) (Processing)
TimeTimeFlow Flow TimeTime
Job Due Job Due DateDate
Job Job LatenessLateness
AA 66 66 88 00
BB 22 88 66 22
CC 88 1616 1818 00
DD 33 1919 1515 44
EE 99 2828 2323 55
2828 7777 1111
FCFS: Sequence A-B-C-D-EFCFS: Sequence A-B-C-D-E

© 2008 Prentice Hall, Inc. 15 – 39
Sequencing ExampleSequencing Example
Job Job SequenceSequence
Job Work Job Work (Processing) (Processing)
TimeTimeFlow Flow TimeTime
Job Due Job Due DateDate
Job Job LatenessLateness
AA 66 66 88 00
BB 22 88 66 22
CC 88 1616 1818 00
DD 33 1919 1515 44
EE 99 2828 2323 55
2828 7777 1111
FCFS: Sequence A-B-C-D-EFCFS: Sequence A-B-C-D-E
Average completion time = = 77/5 = 15.4 daysSum of total flow time
Number of jobs
Utilization = = 28/77 = 36.4%Total job work time
Sum of total flow time
Average number of jobs in the system = = 77/28 = 2.75 jobs
Sum of total flow timeTotal job work time
Average job lateness = = 11/5 = 2.2 daysTotal late daysNumber of jobs

© 2008 Prentice Hall, Inc. 15 – 40
Sequencing ExampleSequencing Example
Job Job SequenceSequence
Job Work Job Work (Processing) (Processing)
TimeTimeFlow Flow TimeTime
Job Due Job Due DateDate
Job Job LatenessLateness
BB 22 22 66 00
DD 33 55 1515 00
AA 66 1111 88 33
CC 88 1919 1818 11
EE 99 2828 2323 55
2828 6565 99
SPT: Sequence B-D-A-C-ESPT: Sequence B-D-A-C-E

© 2008 Prentice Hall, Inc. 15 – 41
Sequencing ExampleSequencing Example
Job Job SequenceSequence
Job Work Job Work (Processing) (Processing)
TimeTimeFlow Flow TimeTime
Job Due Job Due DateDate
Job Job LatenessLateness
BB 22 22 66 00
DD 33 55 1515 00
AA 66 1111 88 33
CC 88 1919 1818 11
EE 99 2828 2323 55
2828 6565 99
SPT: Sequence B-D-A-C-ESPT: Sequence B-D-A-C-E
Average completion time = = 65/5 = 13 daysSum of total flow time
Number of jobs
Utilization = = 28/65 = 43.1%Total job work time
Sum of total flow time
Average number of jobs in the system = = 65/28 = 2.32 jobs
Sum of total flow timeTotal job work time
Average job lateness = = 9/5 = 1.8 daysTotal late daysNumber of jobs

© 2008 Prentice Hall, Inc. 15 – 42
Sequencing ExampleSequencing Example
Job Job SequenceSequence
Job Work Job Work (Processing) (Processing)
TimeTimeFlow Flow TimeTime
Job Due Job Due DateDate
Job Job LatenessLateness
BB 22 22 66 00
AA 66 88 88 00
DD 33 1111 1515 00
CC 88 1919 1818 11
EE 99 2828 2323 55
2828 6868 66
EDD: Sequence B-A-D-C-EEDD: Sequence B-A-D-C-E

© 2008 Prentice Hall, Inc. 15 – 43
Sequencing ExampleSequencing Example
Job Job SequenceSequence
Job Work Job Work (Processing) (Processing)
TimeTimeFlow Flow TimeTime
Job Due Job Due DateDate
Job Job LatenessLateness
BB 22 22 66 00
AA 66 88 88 00
DD 33 1111 1515 00
CC 88 1919 1818 11
EE 99 2828 2323 55
2828 6868 66
EDD: Sequence B-A-D-C-EEDD: Sequence B-A-D-C-E
Average completion time = = 68/5 = 13.6 daysSum of total flow time
Number of jobs
Utilization = = 28/68 = 41.2%Total job work time
Sum of total flow time
Average number of jobs in the system = = 68/28 = 2.43 jobs
Sum of total flow timeTotal job work time
Average job lateness = = 6/5 = 1.2 daysTotal late daysNumber of jobs

© 2008 Prentice Hall, Inc. 15 – 44
Sequencing ExampleSequencing Example
Job Job SequenceSequence
Job Work Job Work (Processing) (Processing)
TimeTimeFlow Flow TimeTime
Job Due Job Due DateDate
Job Job LatenessLateness
EE 99 99 2323 00
CC 88 1717 1818 00
AA 66 2323 88 1515
DD 33 2626 1515 1111
BB 22 2828 66 2222
2828 103103 4848
LPT: Sequence E-C-A-D-BLPT: Sequence E-C-A-D-B

© 2008 Prentice Hall, Inc. 15 – 45
Sequencing ExampleSequencing Example
Job Job SequenceSequence
Job Work Job Work (Processing) (Processing)
TimeTimeFlow Flow TimeTime
Job Due Job Due DateDate
Job Job LatenessLateness
EE 99 99 2323 00
CC 88 1717 1818 00
AA 66 2323 88 1515
DD 33 2626 1515 1111
BB 22 2828 66 2222
2828 103103 4848
LPT: Sequence E-C-A-D-BLPT: Sequence E-C-A-D-B
Average completion time = = 103/5 = 20.6 daysSum of total flow time
Number of jobs
Utilization = = 28/103 = 27.2%Total job work time
Sum of total flow time
Average number of jobs in the system = = 103/28 = 3.68 jobs
Sum of total flow timeTotal job work time
Average job lateness = = 48/5 = 9.6 daysTotal late daysNumber of jobs

© 2008 Prentice Hall, Inc. 15 – 46
Sequencing ExampleSequencing Example
RuleRule
Average Average Completion Completion Time (Days)Time (Days)
Utilization Utilization (%)(%)
Average Number Average Number of Jobs in of Jobs in
SystemSystem
Average Average Lateness Lateness
(Days)(Days)
FCFSFCFS 15.415.4 36.436.4 2.752.75 2.22.2
SPTSPT 13.013.0 43.143.1 2.322.32 1.81.8
EDDEDD 13.613.6 41.241.2 2.432.43 1.21.2
LPTLPT 20.620.6 27.227.2 3.683.68 9.69.6
Summary of RulesSummary of Rules
© 2008 Prentice Hall, Inc. 15 – 47
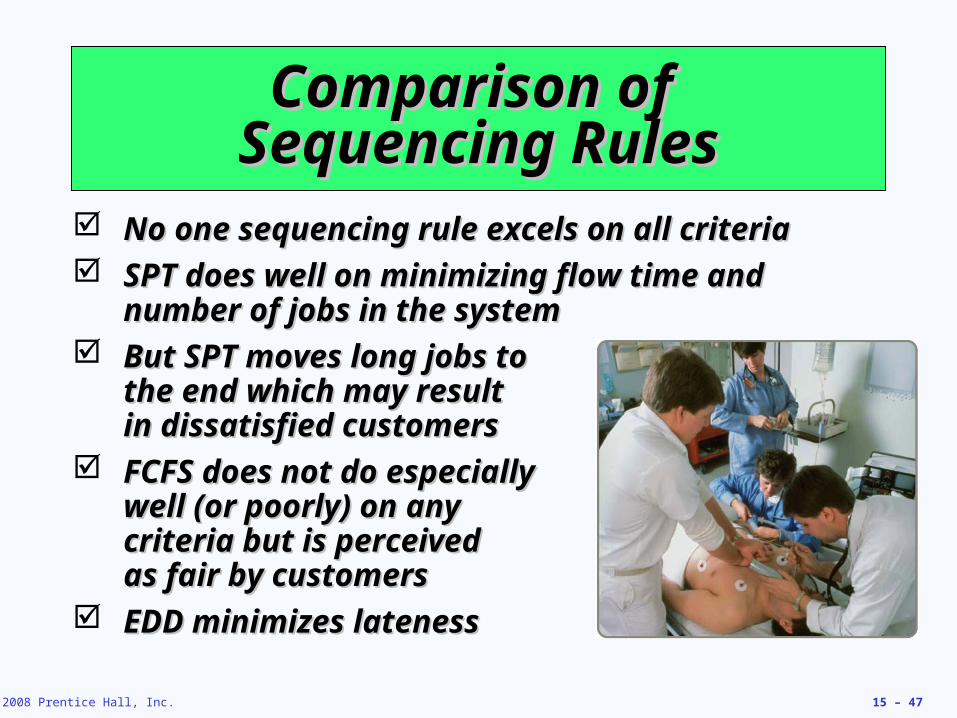
Comparison of Comparison of Sequencing RulesSequencing Rules
No one sequencing rule excels on all criteriaNo one sequencing rule excels on all criteria SPT does well on minimizing flow time and SPT does well on minimizing flow time and
number of jobs in the systemnumber of jobs in the system But SPT moves long jobs to But SPT moves long jobs to
the end which may result the end which may result in dissatisfied customersin dissatisfied customers
FCFS does not do especially FCFS does not do especially well (or poorly) on any well (or poorly) on any criteria but is perceived criteria but is perceived as fair by customersas fair by customers
EDD minimizes latenessEDD minimizes lateness

© 2008 Prentice Hall, Inc. 15 – 48
Critical Ratio (CR)Critical Ratio (CR)
An index number found by dividing the An index number found by dividing the time remaining until the due date by the time remaining until the due date by the work time remaining on the jobwork time remaining on the job
Jobs with low critical ratios are Jobs with low critical ratios are scheduled ahead of jobs with higher scheduled ahead of jobs with higher critical ratioscritical ratios
Performs well on average job lateness Performs well on average job lateness criteriacriteria
CR = =CR = =Due date - Today’s dateDue date - Today’s date
Work (lead) time remainingWork (lead) time remaining
Time remainingTime remaining
Workdays remainingWorkdays remaining

© 2008 Prentice Hall, Inc. 15 – 49
Critical Ratio ExampleCritical Ratio Example
JobJobDue Due DateDate
Workdays Workdays RemainingRemaining Critical RatioCritical Ratio
Priority Priority OrderOrder
AA 3030 44 (30 - 25)/4 = 1.25(30 - 25)/4 = 1.25 33
BB 2828 55 (28 - 25)/5 = .60(28 - 25)/5 = .60 11
CC 2727 22 (27 - 25)/2 = 1.00(27 - 25)/2 = 1.00 22
Currently Day Currently Day 2525
With CR < 1, Job B is late. Job C is just on schedule With CR < 1, Job B is late. Job C is just on schedule and Job A has some slack time.and Job A has some slack time.

© 2008 Prentice Hall, Inc. 15 – 50
Critical Ratio TechniqueCritical Ratio Technique
1.1. Helps determine the status of specific Helps determine the status of specific jobsjobs
2.2. Establishes relative priorities among Establishes relative priorities among jobs on a common basisjobs on a common basis
3.3. Relates both stock and make-to-order Relates both stock and make-to-order jobs on a common basisjobs on a common basis
4.4. Adjusts priorities automatically for Adjusts priorities automatically for changes in both demand and job changes in both demand and job progressprogress
5.5. Dynamically tracks job progressDynamically tracks job progress

© 2008 Prentice Hall, Inc. 15 – 51
Sequencing N Jobs on Two Sequencing N Jobs on Two Machines: Johnson’s RuleMachines: Johnson’s Rule
Works with two or more jobs that Works with two or more jobs that pass through the same two pass through the same two machines or work centersmachines or work centers
Minimizes total production time and Minimizes total production time and idle timeidle time

© 2008 Prentice Hall, Inc. 15 – 52
Johnson’s RuleJohnson’s Rule
1.1. List all jobs and times for each work List all jobs and times for each work centercenter
2.2. Choose the job with the shortest activity Choose the job with the shortest activity time. If that time is in the first work center, time. If that time is in the first work center, schedule the job first. If it is in the second schedule the job first. If it is in the second work center, schedule the job last.work center, schedule the job last.
3.3. Once a job is scheduled, it is eliminated Once a job is scheduled, it is eliminated from the list from the list
4.4. Repeat steps 2 and 3 working toward the Repeat steps 2 and 3 working toward the center of the sequencecenter of the sequence

© 2008 Prentice Hall, Inc. 15 – 53
Johnson’s Rule ExampleJohnson’s Rule Example
JobJobWork Center 1 Work Center 1
(Drill Press)(Drill Press)Work Center 2 Work Center 2
(Lathe)(Lathe)
AA 55 22
BB 33 66
CC 88 44
DD 1010 77
EE 77 1212

© 2008 Prentice Hall, Inc. 15 – 54
BB EE DD CC AA
Johnson’s Rule ExampleJohnson’s Rule Example
JobJobWork Center 1 Work Center 1
(Drill Press)(Drill Press)Work Center 2 Work Center 2
(Lathe)(Lathe)
AA 55 22
BB 33 66
CC 88 44
DD 1010 77
EE 77 1212

© 2008 Prentice Hall, Inc. 15 – 55
Johnson’s Rule ExampleJohnson’s Rule Example
JobJobWork Center 1 Work Center 1
(Drill Press)(Drill Press)Work Center 2 Work Center 2
(Lathe)(Lathe)
AA 55 22
BB 33 66
CC 88 44
DD 1010 77
EE 77 1212
TimeTime 00 33 1010 2020 2828 3333
B ACDEWC 1
WC 2
BB AACCDDEE

© 2008 Prentice Hall, Inc. 15 – 56
Johnson’s Rule ExampleJohnson’s Rule Example
JobJobWork Center 1 Work Center 1
(Drill Press)(Drill Press)Work Center 2 Work Center 2
(Lathe)(Lathe)
AA 55 22
BB 33 66
CC 88 44
DD 1010 77
EE 77 1212
TimeTime 00 33 1010 2020 2828 3333
TimeTime 0 0 11 33 55 77 99 1010 1111 1212 1313 1717 1919 21 22 2321 22 232525 2727 2929 3131 33333535
B ACDE
B ACDE
WC 1
WC 2
BB EE DD CC AA
BB AACCDDEE

© 2008 Prentice Hall, Inc. 15 – 57
Limitations of Rule-Based Limitations of Rule-Based Dispatching SystemsDispatching Systems
1.1. Scheduling is dynamic and rules Scheduling is dynamic and rules need to be revised to adjust to need to be revised to adjust to changeschanges
2.2. Rules do not look upstream or Rules do not look upstream or downstreamdownstream
3.3. Rules do not look beyond due Rules do not look beyond due datesdates

© 2008 Prentice Hall, Inc. 15 – 58
Finite Capacity SchedulingFinite Capacity Scheduling
Overcomes disadvantages of rule-based Overcomes disadvantages of rule-based systems by providing an interactive, systems by providing an interactive, computer-based graphical systemcomputer-based graphical system
May include rules and expert systems or May include rules and expert systems or simulation to allow real-time response to simulation to allow real-time response to system changessystem changes
Initial data often from an MRP systemInitial data often from an MRP system
FCS allows the balancing of delivery FCS allows the balancing of delivery needs and efficiencyneeds and efficiency

© 2008 Prentice Hall, Inc. 15 – 59
Finite Capacity SchedulingFinite Capacity Scheduling
MRP Data• Master
schedule• BOM• Inventory
Priority rules
• Expert systems
• Simulation models
• Routing files• Work center
information
Tooling and other resources
Setups and run time
Figure 15.5Figure 15.5
Interactive Finite Capacity SchedulingInteractive Finite Capacity Scheduling

© 2008 Prentice Hall, Inc. 15 – 60
Finite Capacity SchedulingFinite Capacity Scheduling

© 2008 Prentice Hall, Inc. 15 – 61
Theory of ConstraintsTheory of Constraints
Throughput is the number of units Throughput is the number of units processed through the facility and soldprocessed through the facility and sold
TOC deals with the limits an organization TOC deals with the limits an organization faces in achieving its goalsfaces in achieving its goals
1.1. Identify the constraintsIdentify the constraints
2.2. Develop a plan for overcoming the constraintsDevelop a plan for overcoming the constraints
3.3. Focus resources on accomplishing the planFocus resources on accomplishing the plan
4.4. Reduce the effects of constraints by off-Reduce the effects of constraints by off-loading work or increasing capacityloading work or increasing capacity
5.5. Once successful, return to step 1 and identify Once successful, return to step 1 and identify new constraintsnew constraints

© 2008 Prentice Hall, Inc. 15 – 62
BottlenecksBottlenecks
Bottleneck work centers are constraints Bottleneck work centers are constraints that limit outputthat limit output Common occurrence due to frequent changesCommon occurrence due to frequent changes
Management techniques include:Management techniques include: Increasing the capacity of the constraintIncreasing the capacity of the constraint
Cross-trained employees and maintenanceCross-trained employees and maintenance
Alternative routings, procedures, or Alternative routings, procedures, or subcontractorssubcontractors
Moving inspection and testMoving inspection and test
Scheduling throughput to match bottleneck Scheduling throughput to match bottleneck capacitycapacity
© 2008 Prentice Hall, Inc. 15 – 63
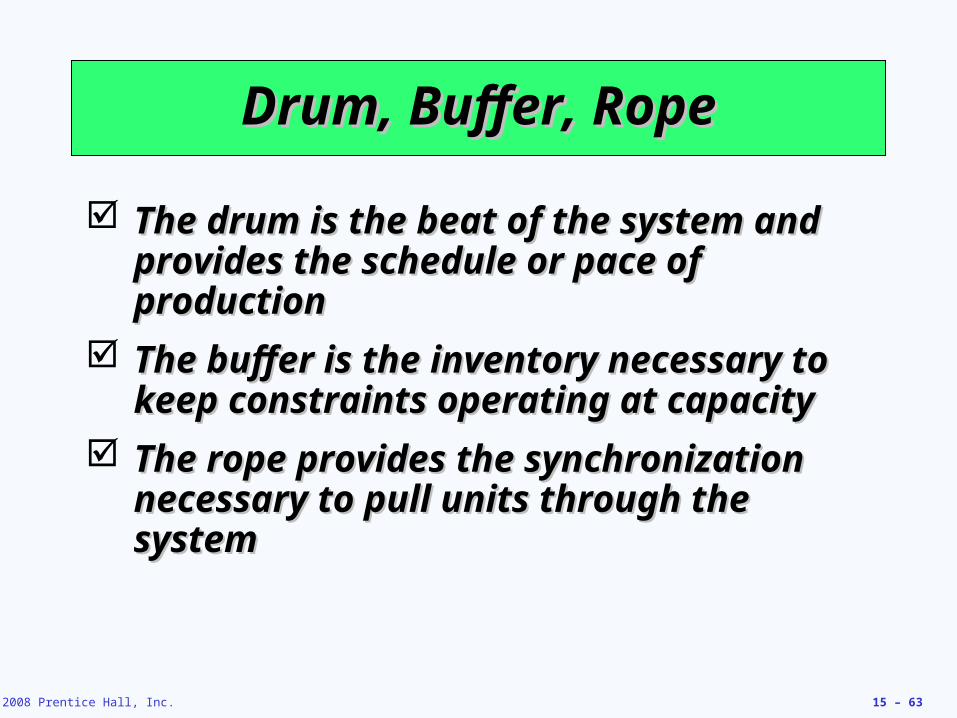
Drum, Buffer, RopeDrum, Buffer, Rope
The drum is the beat of the system and The drum is the beat of the system and provides the schedule or pace of provides the schedule or pace of productionproduction
The buffer is the inventory necessary to The buffer is the inventory necessary to keep constraints operating at capacitykeep constraints operating at capacity
The rope provides the synchronization The rope provides the synchronization necessary to pull units through the necessary to pull units through the systemsystem

© 2008 Prentice Hall, Inc. 15 – 64
Scheduling Repetitive Scheduling Repetitive FacilitiesFacilities
Level material use can help Level material use can help repetitive facilities repetitive facilities Better satisfy customer Better satisfy customer
demanddemand
Lower inventory Lower inventory investmentinvestment
Reduce batch sizeReduce batch size
Better utilize equipment Better utilize equipment and facilitiesand facilities
© 2008 Prentice Hall, Inc. 15 – 65
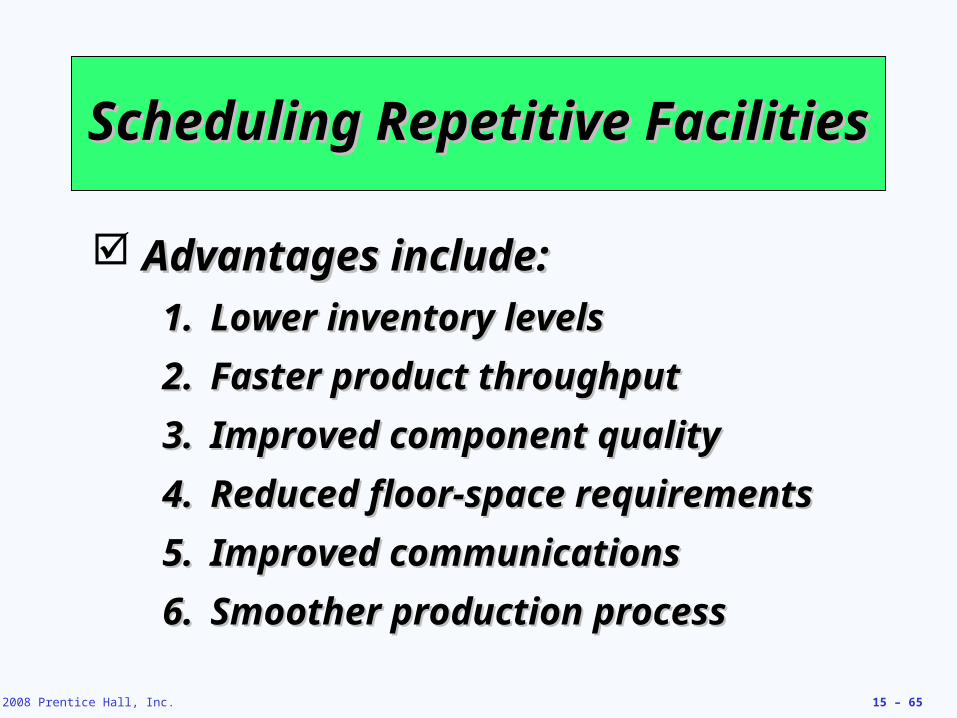
Scheduling Repetitive Scheduling Repetitive FacilitiesFacilities
Advantages include:Advantages include:
1.1. Lower inventory levelsLower inventory levels
2.2. Faster product throughputFaster product throughput
3.3. Improved component qualityImproved component quality
4.4. Reduced floor-space requirementsReduced floor-space requirements
5.5. Improved communicationsImproved communications
6.6. Smoother production processSmoother production process

© 2008 Prentice Hall, Inc. 15 – 66
Scheduling ServicesScheduling Services
Service systems differ from manufacturingService systems differ from manufacturing
ManufacturingManufacturing ServicesServices
Schedules machines Schedules machines and materialsand materials
Schedule staffSchedule staff
Inventories used to Inventories used to smooth demandsmooth demand
Seldom maintain Seldom maintain inventoriesinventories
Machine-intensive and Machine-intensive and demand may be smoothdemand may be smooth
Labor-intensive and Labor-intensive and demand may be variabledemand may be variable
Scheduling may be bound Scheduling may be bound by union contractsby union contracts
Legal issues may constrain Legal issues may constrain flexible schedulingflexible scheduling
Few social or behavioral Few social or behavioral issuesissues
Social and behavioral Social and behavioral issues may be quite issues may be quite importantimportant

© 2008 Prentice Hall, Inc. 15 – 67
Scheduling ServicesScheduling Services
Hospitals have complex scheduling Hospitals have complex scheduling system to handle complex processes system to handle complex processes and material requirementsand material requirements
Banks use a cross-trained and flexible Banks use a cross-trained and flexible workforce and part-time workersworkforce and part-time workers
Retail stores use scheduling Retail stores use scheduling optimization systems that track sales, optimization systems that track sales, transactions, and customer traffic to transactions, and customer traffic to create work schedules in less time and create work schedules in less time and with improved customer satisfactionwith improved customer satisfaction

© 2008 Prentice Hall, Inc. 15 – 68
Scheduling ServicesScheduling Services
Airlines must meet complex FAA and Airlines must meet complex FAA and union regulations and often use linear union regulations and often use linear programming to develop optimal programming to develop optimal schedulesschedules
24/7 operations like police/fire 24/7 operations like police/fire departments, emergency hot lines, and departments, emergency hot lines, and mail order businesses use flexible mail order businesses use flexible workers and variable schedules, often workers and variable schedules, often created using computerized systemscreated using computerized systems

© 2008 Prentice Hall, Inc. 15 – 69
Demand ManagementDemand Management
Appointment or reservation Appointment or reservation systemssystems
FCFS sequencing rulesFCFS sequencing rules
Discounts or other promotional Discounts or other promotional schemesschemes
When demand management is not When demand management is not feasible, managing capacity feasible, managing capacity through staffing flexibility may be through staffing flexibility may be usedused

© 2008 Prentice Hall, Inc. 15 – 70
Scheduling Service Employees Scheduling Service Employees With Cyclical SchedulingWith Cyclical Scheduling
Objective is to meet staffing Objective is to meet staffing requirements with the minimum requirements with the minimum number of workersnumber of workers
Schedules need to be smooth and Schedules need to be smooth and keep personnel happykeep personnel happy
Many techniques exist from simple Many techniques exist from simple algorithms to complex linear algorithms to complex linear programming solutionsprogramming solutions

© 2008 Prentice Hall, Inc. 15 – 71
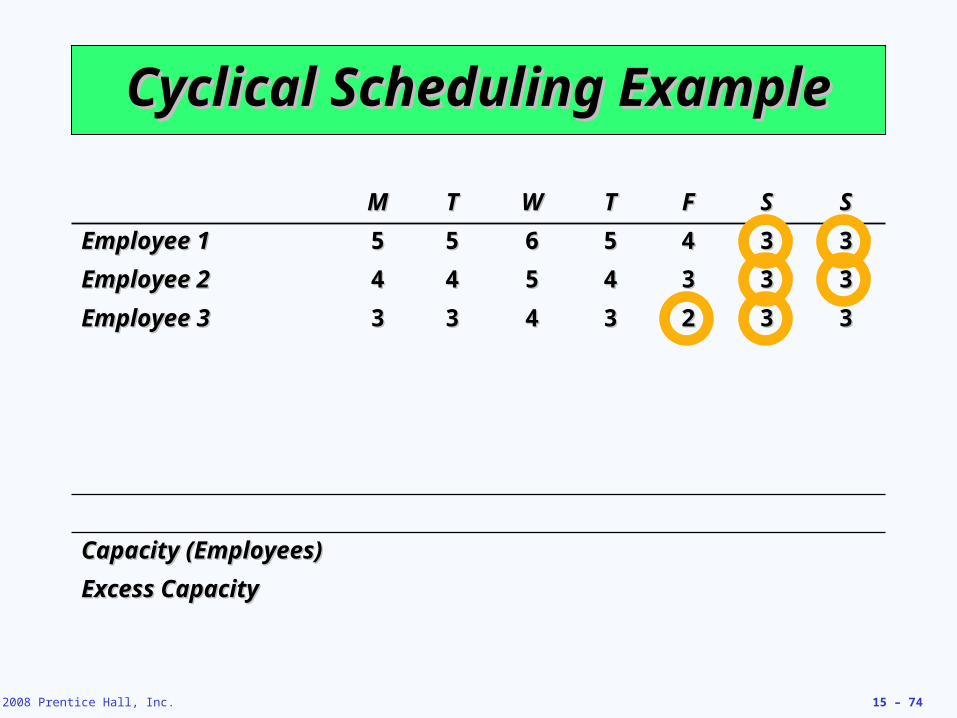
Cyclical Scheduling ExampleCyclical Scheduling Example
1.1. Determine the staffing requirementsDetermine the staffing requirements
2.2. Identify two consecutive days with the Identify two consecutive days with the lowest total requirements and assign lowest total requirements and assign these as days offthese as days off
3.3. Make a new set of requirements Make a new set of requirements subtracting the days worked by the first subtracting the days worked by the first employeeemployee
4.4. Apply step 2 to the new row Apply step 2 to the new row
5.5. Repeat steps 3 and 4 until all Repeat steps 3 and 4 until all requirements have been metrequirements have been met

© 2008 Prentice Hall, Inc. 15 – 72
Cyclical Scheduling ExampleCyclical Scheduling Example
MM TT WW TT FF SS SS
Employee 1Employee 1 55 55 66 55 44 33 33
Capacity (Employees)Capacity (Employees)
Excess CapacityExcess Capacity

© 2008 Prentice Hall, Inc. 15 – 73
Cyclical Scheduling ExampleCyclical Scheduling Example
MM TT WW TT FF SS SS
Employee 1Employee 1 55 55 66 55 44 33 33
Employee 2Employee 2 44 44 55 44 33 33 33
Capacity (Employees)Capacity (Employees)
Excess CapacityExcess Capacity
© 2008 Prentice Hall, Inc. 15 – 74
Cyclical Scheduling ExampleCyclical Scheduling Example
MM TT WW TT FF SS SS
Employee 1Employee 1 55 55 66 55 44 33 33
Employee 2Employee 2 44 44 55 44 33 33 33
Employee 3Employee 3 33 33 44 33 22 33 33
Capacity (Employees)Capacity (Employees)
Excess CapacityExcess Capacity

© 2008 Prentice Hall, Inc. 15 – 75
Cyclical Scheduling ExampleCyclical Scheduling Example
MM TT WW TT FF SS SS
Employee 1Employee 1 55 55 66 55 44 33 33
Employee 2Employee 2 44 44 55 44 33 33 33
Employee 3Employee 3 33 33 44 33 22 33 33
Employee 4Employee 4 22 22 33 22 22 33 22
Capacity (Employees)Capacity (Employees)
Excess CapacityExcess Capacity
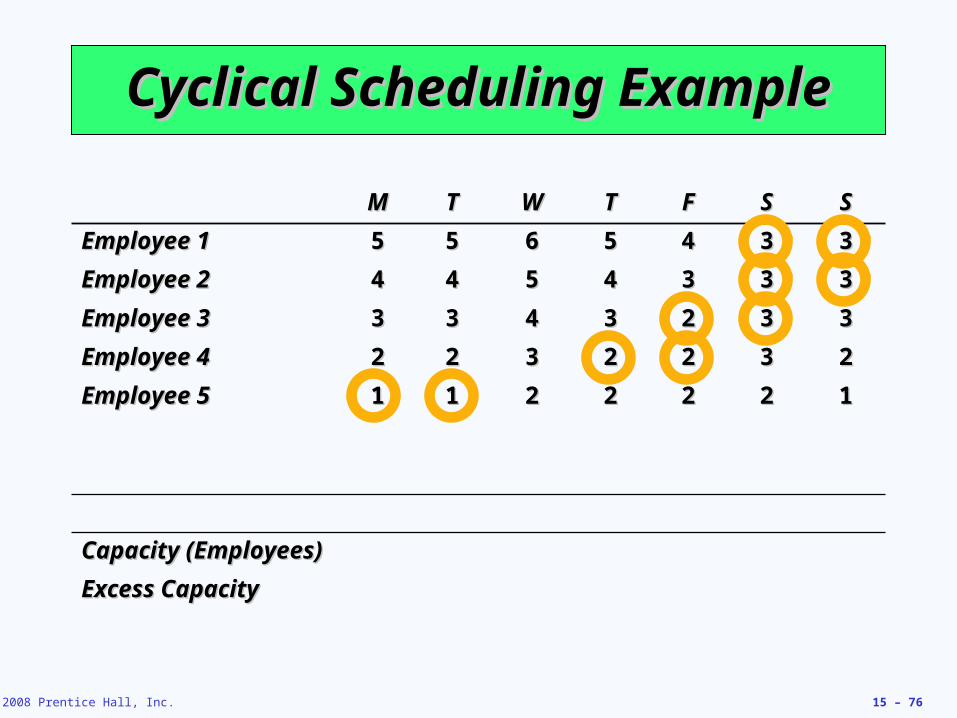
© 2008 Prentice Hall, Inc. 15 – 76
Cyclical Scheduling ExampleCyclical Scheduling Example
MM TT WW TT FF SS SS
Employee 1Employee 1 55 55 66 55 44 33 33
Employee 2Employee 2 44 44 55 44 33 33 33
Employee 3Employee 3 33 33 44 33 22 33 33
Employee 4Employee 4 22 22 33 22 22 33 22
Employee 5Employee 5 11 11 22 22 22 22 11
Capacity (Employees)Capacity (Employees)
Excess CapacityExcess Capacity

© 2008 Prentice Hall, Inc. 15 – 77
Cyclical Scheduling ExampleCyclical Scheduling Example
MM TT WW TT FF SS SS
Employee 1Employee 1 55 55 66 55 44 33 33
Employee 2Employee 2 44 44 55 44 33 33 33
Employee 3Employee 3 33 33 44 33 22 33 33
Employee 4Employee 4 22 22 33 22 22 33 22
Employee 5Employee 5 11 11 22 22 22 22 11
Employee 6Employee 6 11 11 11 11 11 11 00
Capacity (Employees)Capacity (Employees)
Excess CapacityExcess Capacity

© 2008 Prentice Hall, Inc. 15 – 78
Cyclical Scheduling ExampleCyclical Scheduling Example
MM TT WW TT FF SS SS
Employee 1Employee 1 55 55 66 55 44 33 33
Employee 2Employee 2 44 44 55 44 33 33 33
Employee 3Employee 3 33 33 44 33 22 33 33
Employee 4Employee 4 22 22 33 22 22 33 22
Employee 5Employee 5 11 11 22 22 22 22 11
Employee 6Employee 6 11 11 11 11 11 11 00
Employee 7Employee 7 11
Capacity (Employees)Capacity (Employees)
Excess CapacityExcess Capacity

© 2008 Prentice Hall, Inc. 15 – 79
Cyclical Scheduling ExampleCyclical Scheduling Example
MM TT WW TT FF SS SS
Employee 1Employee 1 55 55 66 55 44 33 33
Employee 2Employee 2 44 44 55 44 33 33 33
Employee 3Employee 3 33 33 44 33 22 33 33
Employee 4Employee 4 22 22 33 22 22 33 22
Employee 5Employee 5 11 11 22 22 22 22 11
Employee 6Employee 6 11 11 11 11 11 11 00
Employee 7Employee 7 11
Capacity (Employees)Capacity (Employees) 55 55 66 55 44 33 33
Excess CapacityExcess Capacity 00 00 00 00 00 11 00