© 2008 by john ward made available under the epl v1.0 | date | other information, if necessary...
TRANSCRIPT

© 2008 by John Ward made available under the EPL v1.0 | Date | Other Information, if necessary
Basic BIRT Report Development
John Ward, Innovent Solutions
Basic BIRT | Report Design | © 2008 by John Ward made available under the EPL v1.022
BIRT and us – Who are I? Who are you?
Who are we? John Ward, BIRT user
Innovent Solutions
Author: Practical Data Analysis and Reporting with BIRT
Who are you? Name, Company, technical background (C, SQL, Java,
reporting…)
Experience with BIRT
What are you hoping to get out of today’s presentation?
Basic BIRT | Report Design | © 2008 by John Ward made available under the EPL v1.03
Agenda
BIRT Overview Lesson 1 – Simple Reports Lesson 2 – Charting in Reports Lesson 3 – BIRT Scripting Lesson 4 – Report Libraries and Templates Lesson 5 – Deploying with the Web Viewer

Basic BIRT | Report Design | © 2008 by John Ward made available under the EPL v1.04
Objectives
Become Familiar with BIRT Designer Know how to create and design BIRT reports and projects Access Data in BIRT Reports Report Layout and Formatting Using Styles Sort, Group Data Use Report Parameters Create and Format Charts Write Expressions Using Scripting Creating and Using Libraries and Templates Deploy BIRT Reports

Basic BIRT | Report Design | © 2008 by John Ward made available under the EPL v1.055
Easy
Hard
Presentation
Focus
BIRT Tasks – Audience
BIRT Report Developers
Advanced BIRT Developers
Deploy Experts
Reporting Integration
BIRT Extension
BIRT Core Development
Drag & Drop, Charting, Properties
BIRT Scripting
BIRT Viewer
Design Engine API
BIRT Extension Points
Eclipse Development

Basic BIRT | Report Design | © 2008 by John Ward made available under the EPL v1.06
BIRT Target Users & Benefits
Embed pre-designed reports in application Designs reports using Eclipse-based designer Creates report libraries & templates
Powerful and easy to use report designer Creates & uses report libraries & templates
Focused on $, developer productivity End user satisfaction
Quick availability of reports Reports that also look good Content as HTML and PDF
Reports that support business activities Ever changing business requirements
Minimizes Eclipse developer training Increase developer productivity Lower costs
Saves calories vs. JSP/Java Minutes vs. days for HTML, vs. weeks for PDF Minutes to modify as user requirements change Iterative development gets the right reports quicker
ManagersManagers
End UsersEnd Users
ReportDevelopers
ReportDevelopers
JavaDevelopers
JavaDevelopers
Flexible, web page design metaphor Ability to leverage complex components

Basic BIRT | Report Design | © 2008 by John Ward made available under the EPL v1.07
Report Designer
High Level BIRT Architecture
Report Engine
PresentationServicesReport Design Engine
XMLReportDesign
ReportDocument
HTMLPDFPrint
EclipseReportDesigner
GenerationServices
DataTransform.Services
ChartingEngine
Data
Data
ChartDesigner
Eclipse DTPODA
CustomDesigner

© 2008 by John Ward made available under the EPL v1.0 | Date | Other Information, if necessary
Reporting
Objectives: Become Familiar with BIRT WorkbenchTo create a BIRT Reporting ProjectTo create a BIRT ReportIntroduce the BIRT WorkbenchCreate a simple Product Profitability & Inventory ReportEnd User Customizing via Report Parameters

Basic BIRT | Report Design | © 2008 by John Ward made available under the EPL v1.099
The Quick Tour
The BIRT Perspective Data View, Palette, Outline View, Layout, Code, Preview
BIRT Data Data Sources, Data Sets, Parameters
BIRT Layout Grids, Tables, Controls, Data Binding
BIRT Code Expression Builders vs. Code Pages
BIRT Preview HTML View, BIRT Viewer, PDF Viewer
Basic BIRT | Report Design | © 2008 by John Ward made available under the EPL v1.010
Birt Designer
Graphical report designer, similar to web development applications such as Dreamweaver or Nvu
Provides visual environment to quickly “draw” reports
Provides mechanisms to quickly create data connections
Provides Project Management

Basic BIRT | Report Design | © 2008 by John Ward made available under the EPL v1.011
Workbench

Basic BIRT | Report Design | © 2008 by John Ward made available under the EPL v1.0
Navigator Navigates through Eclipse projects and
files under those projects Allows user to run report inside of BIRT

Basic BIRT | Report Design | © 2008 by John Ward made available under the EPL v1.0
Outline Provides hierarchy of current report Allows for easy navigation of report
elements to change properties in the property pane
When selecting libraries, use the outline to copy non-visual components such as data sources and sets

Basic BIRT | Report Design | © 2008 by John Ward made available under the EPL v1.0
Palette Contains a number of visual elements
used in BIRT report designs Similar to Toolboxes in MS Visual
Studio and other visual IDE

Basic BIRT | Report Design | © 2008 by John Ward made available under the EPL v1.0
Data Explorer Contains.
Data Sources: Connections to database.Data Sets: Same as a Recordset. Allows users to navigate through Query Results.Report Parameters: Used as the interface for report parameters that will be passed to a Data Set.

Basic BIRT | Report Design | © 2008 by John Ward made available under the EPL v1.0
Report Designer
Area where report layout is designed, previews of the report are seen, scripts and events are coded, and XML source for report can be viewed.

Basic BIRT | Report Design | © 2008 by John Ward made available under the EPL v1.0
Areas of the BIRT Workspace (Cont.)
Properties Pane. Properties for BIRT objects can be modified, such as Data Set Binding, Font
information, formatting for Data Set returns such as Row Highlighting and Color Alternation.

Basic BIRT | Report Design | © 2008 by John Ward made available under the EPL v1.018
Top Level Report Layout
Master Pages Contains elements visible on every page, such as page headers
Grids Used to position elements on page
Contains no Data Bindings
Tables Grids with Data Binding
Has Header, Detail, and Footer bands
Lists Single Column Tables

Basic BIRT | Report Design | © 2008 by John Ward made available under the EPL v1.019
Demo – Static Report
Background: Our Manager, Mr Ernie, wants a generic letterhead.
Build a letter head for Classic Cars using containers to format the layout.
Objectives: Familiarize you with the concept of containers for Report Elements

Basic BIRT | Report Design | © 2008 by John Ward made available under the EPL v1.0
Setting up a Project BIRT uses the eclipse paradigm of using
projects File/new/project From the project wizard, select report
project from under BIRT Set project name Projects are shown in the eclipse navigator

Basic BIRT | Report Design | © 2008 by John Ward made available under the EPL v1.0
Setting up a Report With eclipse project open
From file menu
File/new/report From navigator
Right-mouse click on report project, new/report
Select project to associate report with and give file name

Basic BIRT | Report Design | © 2008 by John Ward made available under the EPL v1.022
Containers

Basic BIRT | Report Design | © 2008 by John Ward made available under the EPL v1.023
Data Access
Data Sources Handled data connections
Data Sets Defined Data to be used in Report
Parameters Used for User Interaction to Filter Data
Cascading Parameters
Parameter Binding

Basic BIRT | Report Design | © 2008 by John Ward made available under the EPL v1.0
Setting up JDBC
Setup is done via the Data Explorer when setting up a new data source.
Click on the “manage drivers” button. Point to JDBC ZIP/JAR file. In order to set up connection, you must know the
JDBC URL. Can set a template of the JDBC URL format for
future use of driver. This makes it easier for future connections.
Datasources can be added to libraries for report projects that use consistent datasources.

Basic BIRT | Report Design | © 2008 by John Ward made available under the EPL v1.0
Creating a Data Set With data source(s) created, right-click
on data set and chose new. Type in SQL query. Can create Joined Data Sets to
combine 2 or more data sources. Here I am using a questionmark, which
will bind a report parameter to a query. Datasets can be added to libraries. http://birtworld.blogspot.com/2006/05/
joined-data-sets-with-birt-21.html

Basic BIRT | Report Design | © 2008 by John Ward made available under the EPL v1.0
Report Parameters Used to create dynamic result sets
from queries Binds user input to filter results sets Parameters get assigned in sequential
order, first parameter gets assigned to first bind variable in query
Report Parameters get stored as global variables in reports, accessible in scripts and expressions in addition to data.

Basic BIRT | Report Design | © 2008 by John Ward made available under the EPL v1.027
Tables
Slots Header
Detail
Footer Data Binding
Makes table/list aware of values in Data Set Grouping
Group on value in Data Set Sorting
Sort on value in Data Set

Basic BIRT | Report Design | © 2008 by John Ward made available under the EPL v1.028
Styles
Built In
CSS
Themes

Basic BIRT | Report Design | © 2008 by John Ward made available under the EPL v1.029
Aggregates
Aggregate operations Sum
Avg
Count Done at the binding level

Basic BIRT | Report Design | © 2008 by John Ward made available under the EPL v1.030
Viewing Reports
Preview
Web Viewer
Emitters

Basic BIRT | Report Design | © 2008 by John Ward made available under the EPL v1.0
Report Run
Can Run from Navigator or from File Menu Reports that get run open in separate browser window. Results can be saved. Option to view as HTML, Word, Excel, PDF

Basic BIRT | Report Design | © 2008 by John Ward made available under the EPL v1.032
Demo – Building Reports - Product Profitability Report
Scenario: You work for the Classic Cars company. Your boss, Mr Ernie, wants a report that is a simple listing of all product sales in the database, with the total costs and total profits for each product arranged by State and City, sorted in order of decreasing amounts of total profits. Provide a report parameter to limit the listing to just 1 state. Make sure that the parameter only lists those states already in the database.
Objective: To Familiarize ourselves with building reports with Data awareness and work with data.

Basic BIRT | Report Design | © 2008 by John Ward made available under the EPL v1.033
Demo – Product Profitability Report
1. Bring up Eclipse2. Open the BIRT Perspective3. In the Navigator View create a BIRT Report Project4. In the Project create a BIRT Report5. Add a data source to the Classic Models Sample database6. Add a data set to list products, total costs, total profits7. Add report items8. Format report9. Group items10.Sort items11.Add report parameters12.Add data set parameters13.Preview

© 2008 by John Ward made available under the EPL v1.0 | Date | Other Information, if necessary
Lesson 2 – Charting in Reports

Basic BIRT | Report Design | © 2008 by John Ward made available under the EPL v1.035
Basic Concepts – Charting in Reports
Charts integrated with BIRT Report Designer
Charts can be used standalone as a library
Wide variety of chart types
Many formatting options
Charts are extensible to include more types

Basic BIRT | Report Design | © 2008 by John Ward made available under the EPL v1.03636
Pie Charts
2D, 2D with depth Ratio, Explode slices, Min Slice

Basic BIRT | Report Design | © 2008 by John Ward made available under the EPL v1.03737
Bar Charts
Horizontal, Vertical 2D, 2D w/depth, 3D Stacked, Side-by-side Percent, Logarithmic

Basic BIRT | Report Design | © 2008 by John Ward made available under the EPL v1.038
Bar Charts
38

Basic BIRT | Report Design | © 2008 by John Ward made available under the EPL v1.039
Cones – Tubes – Pyramids
39

Basic BIRT | Report Design | © 2008 by John Ward made available under the EPL v1.04040
Line Charts
Horizontal, Vertical 2D, 3D Various types of markers Line styles, thicknesses Drawn as Line, Curve

Basic BIRT | Report Design | © 2008 by John Ward made available under the EPL v1.04141
Stock Charts
CandleStick / Bar Stick Horizontal, Vertical 2D Formatting control

Basic BIRT | Report Design | © 2008 by John Ward made available under the EPL v1.04242
Scatter Charts
Horizontal, Vertical 2D Various types of markers Line styles, thicknesses Drawn as Line, Curve

Basic BIRT | Report Design | © 2008 by John Ward made available under the EPL v1.04343
Area Charts
Horizontal, Vertical 2D, 2D w/depth, 3D Stacked, Side-by-side Percent, Logarithmic Drawn as Line, Curve

Basic BIRT | Report Design | © 2008 by John Ward made available under the EPL v1.044
Difference/Range Charts
44
2D. Curve or Straight lines. New Negative/Positive Fill also works for other types.

Basic BIRT | Report Design | © 2008 by John Ward made available under the EPL v1.04545
Meter Charts
2D, formatting control Regions, Needle styles, thicknesses

Basic BIRT | Report Design | © 2008 by John Ward made available under the EPL v1.046
Gantt Charts
46
2D. Custom Bar width Custom Start/End Markers Data : Task ID / Start Date, End Date, Task Name

Basic BIRT | Report Design | © 2008 by John Ward made available under the EPL v1.047
Bubble Charts
2D Custom Bubble shape – Square, triangle, diamond, star, icon…
47

Basic BIRT | Report Design | © 2008 by John Ward made available under the EPL v1.048
Data Binding in Charts Bind through Data Set
Bind through Report Element

Basic BIRT | Report Design | © 2008 by John Ward made available under the EPL v1.049
Interactivity in Charts
Can jump to anchor points
Drill Through to other Reports
Interactivity through Javascript

Basic BIRT | Report Design | © 2008 by John Ward made available under the EPL v1.050
Demo – Charting in Your Report
Scenario: Mr. Ernie wants a report that is a simple listing of all products in the database, with the number of units in stock. Arrange the products for each Product Line and sorted the products in each product line in decreasing order of total inventory. Your boss would also like to only list those products with a minimum quantity in stock. Provide a report parameter to limit the output to those products with a quantity in stock greater than that specified in the report parameter.
Add a Pie chart to this report to list products and their inventory.

Basic BIRT | Report Design | © 2008 by John Ward made available under the EPL v1.051
Demo – Charting in Your Report
1. Start with the Product Listing report. 2. Select Product Line grouping row3. Insert row below titles4. Merge cells5. Insert chart6. Select Pie chart, SVG output7. Inherit data from container8. Category – Product Name, group; Value – Quantity In Stock,
aggregate by Sum()9. Format chart

Basic BIRT | Report Design | © 2008 by John Ward made available under the EPL v1.052
Demo – Charting in Your Report Final Output

© 2008 by John Ward made available under the EPL v1.0 | Date | Other Information, if necessary
Lesson 3 – Scripting in a BIRT Report
Objectives: To build simple expressions for highlighting To build JavaScript scripts

Basic BIRT | Report Design | © 2008 by John Ward made available under the EPL v1.0
Scripting
For some logical calculations and report-centric tasks, a JavaScript based scripting engine has been embedded into BIRT.
Report events can be overridden to implement custom actions, such as creating calculated fields on row retrieval from a dataset.
Variables can be declared and used persistently throughout reports through scripting mechanism.
http://birtworld.blogspot.com/2006/03/java-and-session-objects-in-birt.html
Later presentation more focused on Scripting: “Advanced BIRT Report Customization” tell Virgil and Jason that I sent you ;)

Basic BIRT | Report Design | © 2008 by John Ward made available under the EPL v1.055
Scripting Background
Do you know Javascript?
Do you know Java?

Basic BIRT | Report Design | © 2008 by John Ward made available under the EPL v1.056
• BIRT Utilizes the Mozilla Rhino Javascript engine.
• All the features of JavaScript 1.5
• BIRT Script allows for use of Java classes and methods (regular expression, searches, etc) as well as custom Java objects
• Event Handlers can be external Java objects, not just Javascript
BIRT
Awesome!

© 2008 by John Ward made available under the EPL v1.0 | Date | Other Information, if necessary
•Simple, 1 line expressions
•Used in data elements to return single result
•Used in visual elements as a simple condition or to retrieve display values
•Triggered by Events in BIRT
•onOpen
•onRender
•Fetch
•Complex, multi line statements
•Contain advanced logic to manipulate BIRT elements
•Can reference and set external elements
•Can invoke external Java objects

Basic BIRT | Report Design | © 2008 by John Ward made available under the EPL v1.058
Demo – Expressions
Scenario: Ernie wants a Employee Sales Performance Report. Have a chart to show employee sales against a quota, and create a computed column for grouping.
Objective: Demonstrate basic expression in Data Elements, complex expressions in the computed column and groupings.

Basic BIRT | Report Design | © 2008 by John Ward made available under the EPL v1.059
Scripting/Event Handling (Simplified)
•Handlers are called for particular events
•Handlers are methods
•Code to do task is placed in the method
•Can be externalized in Java objects
•http://www.eclipse.org/birt/phoenix/deploy/reportScripting.php#javaevents

Basic BIRT | Report Design | © 2008 by John Ward made available under the EPL v1.060
Demo – Using Java Scripted Data Source
Scenario: A request has come through from the Java developers to create a method to list all the Java environment variables to assist in application development.
Objective: Give a quick overview of the Scripting event model by creating a scripted data source.

Basic BIRT | Report Design | © 2008 by John Ward made available under the EPL v1.061
Demo – Using Java Scripted Data Source
Create a scripted data source object Create a scripted data set
3 data fields: Name, Value, Type In Open Method
Assign the Packages.java.lang.System.getProperties() to a variable. Get iterator from the entrySet().iterator() method.
In Fetch Methodwhile (propIter.hasNext()) {
entry = propIter.next();row['propName'] = entry.getKey();row['propValue'] = entry.getValue();return true;
}
return false; Add data grid

© 2008 by John Ward made available under the EPL v1.0 | Date | Other Information, if necessary
Lesson 4 – Libraries and Templates
Objectives: To use & build BIRT Report Libraries in building reportsTo use & build BIRT Report Templates

Basic BIRT | Report Design | © 2008 by John Ward made available under the EPL v1.063
Basic Concepts - Libraries
Enables collaboration in report development, speeds up report design Large #’s of report developers, or, large #’s of reports
Many designs use same elements, or layouts Stores report items shared between multiple developers/reports Use multiple libraries in a report design Changes to report items in library reflected in all report designs
Open design in designer
Generate report Group related styles into a theme Can convert a report design into a report library File extension - .rptlibrary Define resource folder location in Window->Preferences->Report
Design->Resource

Basic BIRT | Report Design | © 2008 by John Ward made available under the EPL v1.064
Demo – Using a BIRT Library
1. Create BIRTLib.rptlibrary to Workspace2. Refresh project3. Open BIRTLib.rptlibrary4. Publish library to resource folder5. Copy visual items to report editor6. Copy data sets to report Outline view7. Preview8. Change a report item in library9. Preview

Basic BIRT | Report Design | © 2008 by John Ward made available under the EPL v1.065
Basic Concepts – Templates
Serve as starting points for speedy report development Template captures visual relationships of report items Degree of completed template depends on requirements Can use report libraries in template Design of template is similar to report design Define template location in Window->Preferences->Report
Design->Template

Basic BIRT | Report Design | © 2008 by John Ward made available under the EPL v1.066
Demo – Creating a Template
1. Create New Template in similar fashion to a report design2. Specify display name, description, image3. Design template just as a report design4. Register Template with New Report wizard
5. Open existing report.6. Save as Template.

© 2008 by John Ward made available under the EPL v1.0 | Date | Other Information, if necessary
Lesson 5 – Deploying with the Web Viewer
Objectives: To deploy BIRT Reports in TomcatDiscuss other Deployment Options

Basic BIRT | Report Design | © 2008 by John Ward made available under the EPL v1.068
Traditional Report Deployment Strategies
Burst reports Took lots of resources
Online Reports None BI based solutions
Cumbersome and time consuming to develop Error prone No consistent interfaces

Basic BIRT | Report Design | © 2008 by John Ward made available under the EPL v1.069
Online Report Deployment
Using BI Based Solutions Rapid Deployment
Available to global audience
Ability to deploy to a number of commonly used formats

Basic BIRT | Report Design | © 2008 by John Ward made available under the EPL v1.070
BIRT Deployment Capabilities
From the Designer HTML
MS Office Formats (Note: Excel not yet included)
Postscript From the web viewer
HTML Real-time navigation
CSV

Basic BIRT | Report Design | © 2008 by John Ward made available under the EPL v1.071
More advanced Deployment Options
Beyond scope of this class Report Engine embedding into Java applications
See later tutorial: “Integrating Reporting into your Application” and tell Scott I said Hi.
Chart Engine Navigation See tomorrows talk: “BIRT Chart APIs”
Advanced Report Design Retrieval methods Retrieve from archive Retrieve from Database Remote File System Retrieval
SSH FTP SMB/CIFS

Basic BIRT | Report Design | © 2008 by John Ward made available under the EPL v1.072
The BIRT Web Viewer Example Application
Good starting point for deploying online applications Does most of the important functions that online report viewers
need
Table of Contents Pagination and Navigation Export for Print, PDF, Word, Excel Export to CSV for resorting and manipulation of numbers Parameters through internal and external parameter pages
Deploys to J2EE containers

Basic BIRT | Report Design | © 2008 by John Ward made available under the EPL v1.073
BIRT Web Viewer Available From
BIRT Runtime Package Contains all libraries already
BIRT Eclipse Designer Contains all packages needed for web viewer
Needs to be copied among different packages Compiled from Source
Download Source from CVS
Modify source as needed and compile to deploy New in BIRT 2.2, New Project

Basic BIRT | Report Design | © 2008 by John Ward made available under the EPL v1.074
Deploying Reports to the Web Viewer application
Copy files over to the Documents folder Accessed using the “__report” URL parameter Subsequent parameters can be called via the parameter dialog,
URL parameter passing, or through external FORMS

Basic BIRT | Report Design | © 2008 by John Ward made available under the EPL v1.075
Demo – Deploying to the Web Viewer application
Deploying Report Copy report into working directory
Run the example report
Basic BIRT | Report Design | © 2008 by John Ward made available under the EPL v1.076
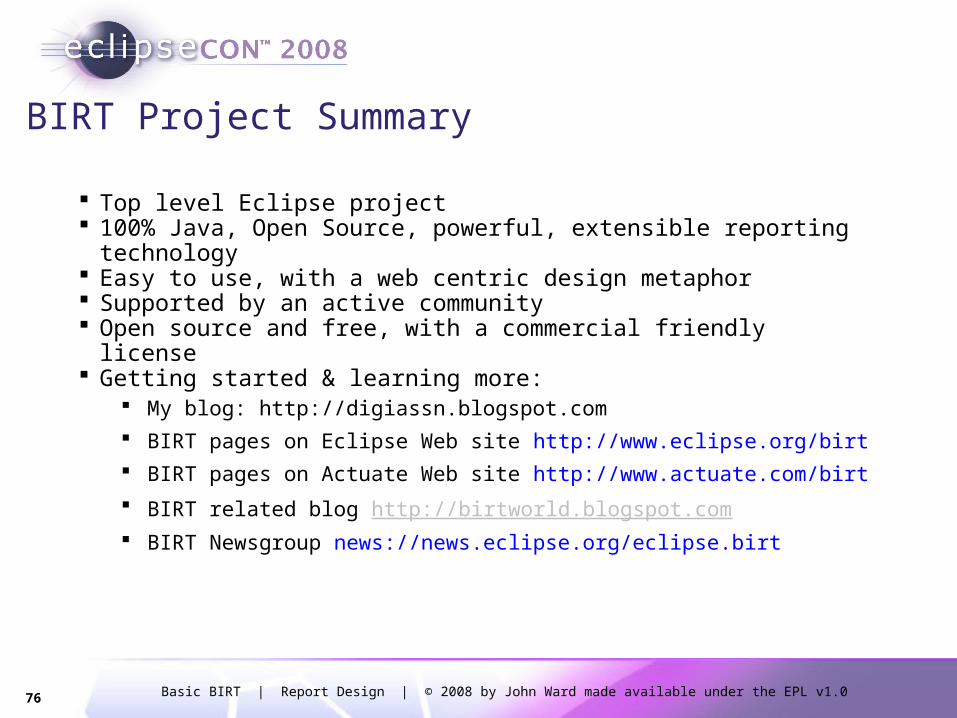
BIRT Project Summary
Top level Eclipse project 100% Java, Open Source, powerful, extensible reporting
technology Easy to use, with a web centric design metaphor Supported by an active community Open source and free, with a commercial friendly license Getting started & learning more:
My blog: http://digiassn.blogspot.com
BIRT pages on Eclipse Web site http://www.eclipse.org/birt
BIRT pages on Actuate Web site http://www.actuate.com/birt
BIRT related blog http://birtworld.blogspot.com
BIRT Newsgroup news://news.eclipse.org/eclipse.birt

© 2008 by John Ward made available under the EPL v1.0 | Date | Other Information, if necessary
Q/A