© 2006 the curators of the university of missouri1 providing accountability through data and...
TRANSCRIPT

© 2006 The Curators of the University of Missouri 1
Providing Accountability Through Data and Process –
The Program Audit
Robert Mullen, Associate Director, Institutional Research and Planning, UM–SystemCuba Plain, Director of Budget Planning and Development, UM-SystemTara Warne, Associate Research Analyst, UM-SystemLarry Westermeyer, Director of Institutional Research, UM–St. Louis
Accountability and Assessment: Measuring What Matters in Higher EducationMidAIR Annual Conference
Kansas City, MissouriNovember 9, 20062:15 pm – 3:05 pm

© 2006 The Curators of the University of Missouri 2
Session Overview
• Introduction of Panelists
• Background and Concepts
• Panelist Perspectives
• Methodology and Example
• Uses and Limitations
• Questions and Answers

© 2006 The Curators of the University of Missouri 3
What is the Program Audit?
• Program Audit -- ... The purpose of a program audit is to determine if a selected degree program or academic unit should be modified, consolidated with another degree program and/or academic unit, suspended, or discontinued. The Chancellor or her or his designee will determine which programs or academic units should undergo a program audit.

© 2006 The Curators of the University of Missouri 4
What is a Program Audit(cont.)
• Program Audit Procedures • Role of Campus Standing Committees
– Campus Committee Conducts Audits:(1) Faculty and Student Quality
(2) Instruction, Research, and Service Outcomes(3) Student Demand and State Need(4) Centrality to the Campus and System Missions(5) Comparative Advantage or Uniqueness(6) Resource Adequacy

© 2006 The Curators of the University of Missouri 5
What is a Program Audit(cont.)
• Committee Makes Recommendations to Chancellor
• Suspended Programs may not Admit Students
• Chancellor is Final Arbiter
• VP for Academic Affairs Submits Report to President

© 2006 The Curators of the University of Missouri 6
What the Program Audit Process is Not
• Not Part of the Missouri CBHE’s Five-Year Program Review
• Not Part of the University of Missouri’s Program Review Process
• Not System Office “Hit-list”

© 2006 The Curators of the University of Missouri 7
Development Process – System Perspective
• Identified Measures of Success
• Identified Data Sources
• Assess Applicability to the Goals
• System and Campus IR Iterations to come to a Usable, Meaningful Product
• Collaborations
• No Hidden Data or Agenda’s
© 2006 The Curators of the University of Missouri 8
Development Process – Campus Perspective
• Collaborative and Iterative• System IR Produced Draft• Campus IR Reviewed/Suggested Changes• Campus Administrators Reviewed

© 2006 The Curators of the University of Missouri 9
Development Process – Campus Perspective
• Original Data Consisted of “Bookends”
• Provided Additional Data to Fill in the Gaps
• Additional Campus Data

© 2006 The Curators of the University of Missouri 10
Building the Profile: Cost Data Department Profile Sample August, 2006 Campus: Campus Name School/College: COLLEGE OF ARTS & SCIENCES Department: Department Name Departmental Cost Data based on School/College Cost Study (FY2004) Tier 1 - Direct and Allocated Primary Program Costs less Total Income (T1 Subsidy) $610,441 Tier 2 - Tier 1 plus Allocated Student Aid & Support Costs less Total Income (T2 Subsidy) $1,055,060 Tier 3 - Tier 2 plus Campus Support Costs less Total Income (T3 Subsidy) $1,677,186 Tier 4 - Tier 3 plus System Overhead & Depreciation less Total Income (T4 Subsidy) $1,823,093 School/College Full Cost of Instruction per SCH $402 Departmental Data Based on Delaware Costs & Productivity (FY2004): Direct Instructional Costs per SCH: $395 Total: $2,098,579 Costs Less Gross Student Fees per SCH: $125 Total: $664,186 Percent of Direct Instructional Costs Covered by Gross Fees: 68% Compared to National Data By Discipline (FY2004) Unit National (Median) Percent of National Departmental Average Cost per SCH: $395 $239 165% School/College Average Cost per SCH: $185 Fall SCH per Total Faculty FTE: 112 237 47% Research/Service per Ranked Regular Faculty FTE: $65,330 $201,594 32% Departmental Information: FY2006 Full-Time Ranked Regular Faculty: 15 Percent Tenured: 73% SCH Degrees Majors FY01 FY02 FY03 FY04 FY05 5-YR FY01 FY02 FY03 FY04 FY05 5-YR FS00 FS01 FS02 FS03 FS04 5-YR _________________________________________ _______________________________________ _______________________________________ Department Total 5,107 5,109 5,495 5,607 5,792 13% 30 36 39 20 31 3% 160 138 141 128 159 ( 1%) Percent Service 70% 71% 72% 75% 73% Program Degree ___________________ ___________________ Program Name BACHELOR OF ARTS 4 9 13 4 7 75% 27 26 31 24 25 ( 7%) BACHELOR OF SCIENCE 11 10 10 5 6 ( 45%) 69 60 60 53 85 23% MASTER OF SCIENCE 11 9 11 6 14 27% 26 18 18 23 18 ( 31%) DOCTOR OF PHILOSOPHY 4 8 5 5 4 0% 38 29 32 28 31 ( 18%) MINOR . . . . . . . 5 . . . .

© 2006 The Curators of the University of Missouri 11
Cost Study
• Purpose: Determine for each cost center– Historical Full Cost of the unit
– Full cost of instruction and research/public service of the unit
– Unit’s average cost per credit hour
– Unit’s average cost per credit hour by student level
– Income attributable to the unit
– Student aid attributable to the unit

© 2006 The Curators of the University of Missouri 12
Cost Study
• Scope– Operations and Continuing Education Funds
• Goal– To appropriately match costs and revenues– To appropriately match credit hours produced
with the costs of producing those credit hours

© 2006 The Curators of the University of Missouri 13
Cost Study
• General Methodology
– Designate specific cost centers– Identify consistent categories of cost– Use tier costing methods to further categorize
and allocate costs– Development of unit costs

© 2006 The Curators of the University of Missouri 14
Cost Study - Allocation of Costs to Cost Centers
1. Direct expenditures of the cost center are allocated to the cost center. This includes both primary program costs and support costs paid by the cost center.
© 2006 The Curators of the University of Missouri 15
Cost Study - Allocation of Costs to Cost Centers
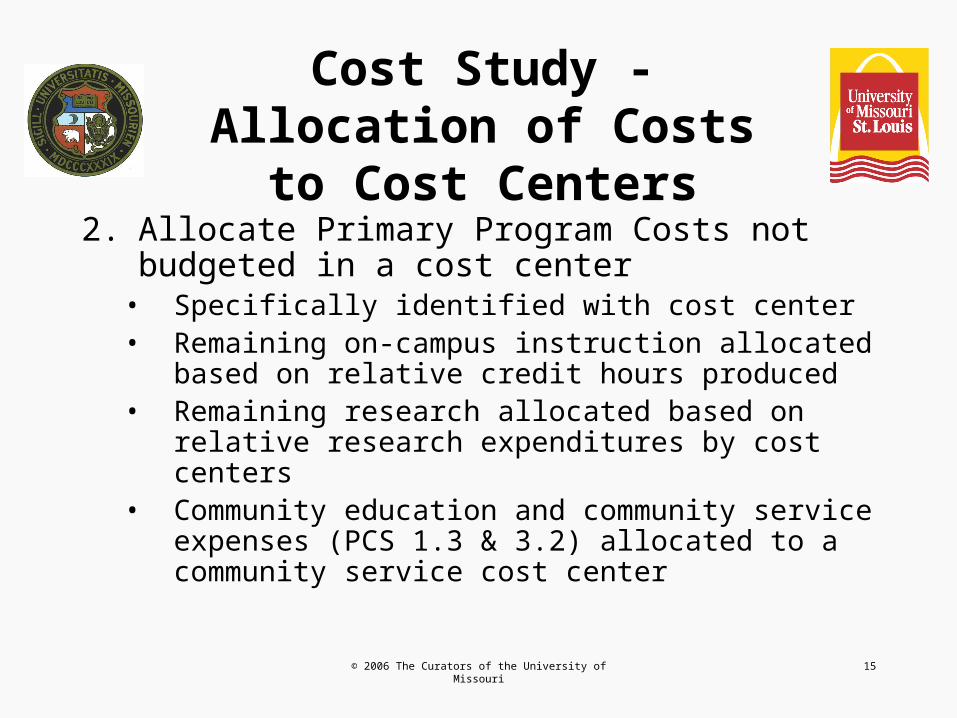
2. Allocate Primary Program Costs not budgeted in a cost center
• Specifically identified with cost center• Remaining on-campus instruction allocated based on
relative credit hours produced• Remaining research allocated based on relative
research expenditures by cost centers• Community education and community service
expenses (PCS 1.3 & 3.2) allocated to a community service cost center

© 2006 The Curators of the University of Missouri 16
Cost Study - Allocation of Costs to Cost Centers
3. Allocate Scholarship/Fellowship Expenses
– Student aid expenses directly identified with a cost center allocated to that cost center
– All other student aid expenses are allocated to the cost centers based on student credit hours generated, by student level and residency

© 2006 The Curators of the University of Missouri 17
Cost Study - Allocation of Costs to Cost Centers
4. Allocate System Overhead & Depreciation
– System administration and university-wide overhead expenditures and depreciation are allocated to the campus cost centers, campus overhead units, and UM Extension based on direct and allocated primary program expenditures and student aid.

© 2006 The Curators of the University of Missouri 18
Cost Study - Allocation of Costs to Cost Centers
5. Allocate Campus Depreciation
– Campus depreciation is allocated to the cost centers and campus overhead units based on assignable square footage of physical plant space.

© 2006 The Curators of the University of Missouri 19
Cost Study - Allocation of Costs to Cost Centers
6. Allocate Operation & Maintenance of Physical Plant
– Operation & maintenance of physical plant is allocated to the cost centers and campus overhead units based on assignable square footage of physical plant space.

© 2006 The Curators of the University of Missouri 20
Cost Study - Allocation of Costs to Cost Centers
7. Allocate Institutional Support, Student Services, and Academic Support
– Institutional support costs are allocated based on direct and allocated primary program expenses plus direct support expenses for academic support and student services.

© 2006 The Curators of the University of Missouri 21
Cost Study - Allocation of Costs to Cost Centers
– Student service support costs are allocated on the basis of headcount student majors.
– Academic administration costs are allocated on relative primary program expenditures.
– Library expenditures are allocated on the basis of headcount majors and teaching and research faculty.
– All other academic support expenses are allocated on the basis of headcount majors.

© 2006 The Curators of the University of Missouri 22
Cost Study
• Allocation of Full Costs Between Primary Programs– Full cost of instruction and research/public service
• Direct and allocated instruction or research/public service expenses plus their share of system overhead & depreciation
• Proportionate share of the cost of libraries, academic administration, institutional support, plant operation and maintenance, and campus depreciation plus their share of system overhead and depreciation
• Direct and allocated expenditures for student aid, student services, and other academic support plus their share of system overhead & depreciation are allocated only to instruction.

© 2006 The Curators of the University of Missouri 23
Cost Study
• Unit Cost Calculations
– Instructional cost per credit hour produced by academic cost center
– Weighted costs developed to determine relative cost by student level
• Weights of 1.0, 3.0, 4.5, & 7.0 were used for undergraduate, masters, professional and doctoral

© 2006 The Curators of the University of Missouri 24
Cost Study
• Income Calculations– Tuition is calculated based on the student credit hours
produced by academic cost center by student level and residency
– Instructional computing fees allocated on proportional student credit hours produced
– All other fees and other income that is identifiable with an academic unit is allocated to the unit
– Gross income is reduced by student aid to determine net income by academic unit

© 2006 The Curators of the University of Missouri 25
Department Profiles Tier Costs
• Tier 1 – Direct and Allocated Primary Program Costs less Total Income Generated
• Tier 2 – Direct and Allocated Primary Program Costs plus Allocated Student Aid, Building Maintenance, and 10% of Allocated Academic Support and Student Services less Total Income
• Tier 3 - Full Cost of Instruction Excluding Depreciation and System Overhead less Total Income
• Tier 4 – Full Cost of Instruction less Total Income

© 2006 The Curators of the University of Missouri 26
Building the Profile: Delaware Data
Department Profile Sample August, 2006 Campus: Campus Name School/College: COLLEGE OF ARTS & SCIENCES Department: Department Name Departmental Cost Data based on School/College Cost Study (FY2004) Tier 1 - Direct and Allocated Primary Program Costs less Total Income (T1 Subsidy) $610,441 Tier 2 - Tier 1 plus Allocated Student Aid & Support Costs less Total Income (T2 Subsidy) $1,055,060 Tier 3 - Tier 2 plus Campus Support Costs less Total Income (T3 Subsidy) $1,677,186 Tier 4 - Tier 3 plus System Overhead & Depreciation less Total Income (T4 Subsidy) $1,823,093 School/College Full Cost of Instruction per SCH $402 Departmental Data Based on Delaware Costs & Productivity (FY2004): Direct Instructional Costs per SCH: $395 Total: $2,098,579 Costs Less Gross Student Fees per SCH: $125 Total: $664,186 Percent of Direct Instructional Costs Covered by Gross Fees: 68% Compared to National Data By Discipline (FY2004) Unit National (Median) Percent of National Departmental Average Cost per SCH: $395 $239 165% School/College Average Cost per SCH: $185 Fall SCH per Total Faculty FTE: 112 237 47% Research/Service per Ranked Regular Faculty FTE: $65,330 $201,594 32% Departmental Information: FY2006 Full-Time Ranked Regular Faculty: 15 Percent Tenured: 73% SCH Degrees Majors FY01 FY02 FY03 FY04 FY05 5-YR FY01 FY02 FY03 FY04 FY05 5-YR FS00 FS01 FS02 FS03 FS04 5-YR _________________________________________ _______________________________________ _______________________________________ Department Total 5,107 5,109 5,495 5,607 5,792 13% 30 36 39 20 31 3% 160 138 141 128 159 ( 1%) Percent Service 70% 71% 72% 75% 73% Program Degree ___________________ ___________________ Program Name BACHELOR OF ARTS 4 9 13 4 7 75% 27 26 31 24 25 ( 7%) BACHELOR OF SCIENCE 11 10 10 5 6 ( 45%) 69 60 60 53 85 23% MASTER OF SCIENCE 11 9 11 6 14 27% 26 18 18 23 18 ( 31%) DOCTOR OF PHILOSOPHY 4 8 5 5 4 0% 38 29 32 28 31 ( 18%) MINOR . . . . . . . 5 . . . .

© 2006 The Curators of the University of Missouri 27
Delaware StudyNational Study for Instructional Costs and Productivity
• The DE Study Responds to Public Perceptions about Faculty Productivity
• Establishes Productivity and Cost Benchmarks
• Costs driven by disciplinary mix

© 2006 The Curators of the University of Missouri 28
Delaware StudyNational Study for Instructional Costs and Productivity
• Data Collected by CIP-4
• Participation is Voluntary: nearly 200 Institutions with Varying Missions in 2005– UM compares only to other research
institutions (68)
• Only Includes Direct Costs

© 2006 The Curators of the University of Missouri 29
Delaware StudyNational Study for Instructional Costs and Productivity
Caveats
• Time lag
• Must be able to Link Students to Faculty to Dollars
• Lose Interdepartmental Productivity and Instructional Costs Attributed to
Administrative Units

© 2006 The Curators of the University of Missouri 30
Instructional Productivity Defined
• Various Measures of SCH and Sections
• FTE Faculty by Type
• FTE Students, Majors, and Degrees
• Each have National Norms as Benchmarks

© 2006 The Curators of the University of Missouri 31
Costs Defined
• Include only Direct Instructional Costs—a Subset of Tier 1 Costs from the Cost Study
• Expenditures per SCH and per FTE Student
• Expenditures for Instruction, Research, and Service
© 2006 The Curators of the University of Missouri 32
Delaware and the Department Profiles
• Department Profiles Combine Data from Three Areas:– School and College Cost Study
– DE Costs and Productivity
– Departmental Information

© 2006 The Curators of the University of Missouri 33
Building the Profile: Putting it Together
Department Profile Sample August, 2006 Campus: Campus Name School/College: COLLEGE OF ARTS & SCIENCES Department: Department Name Departmental Cost Data based on School/College Cost Study (FY2004) Tier 1 - Direct and Allocated Primary Program Costs less Total Income (T1 Subsidy) $610,441 Tier 2 - Tier 1 plus Allocated Student Aid & Support Costs less Total Income (T2 Subsidy) $1,055,060 Tier 3 - Tier 2 plus Campus Support Costs less Total Income (T3 Subsidy) $1,677,186 Tier 4 - Tier 3 plus System Overhead & Depreciation less Total Income (T4 Subsidy) $1,823,093 School/College Full Cost of Instruction per SCH $402 Departmental Data Based on Delaware Costs & Productivity (FY2004): Direct Instructional Costs per SCH: $395 Total: $2,098,579 Costs Less Gross Student Fees per SCH: $125 Total: $664,186 Percent of Direct Instructional Costs Covered by Gross Fees: 68% Compared to National Data By Discipline (FY2004) Unit National (Median) Percent of National Departmental Average Cost per SCH: $395 $239 165% School/College Average Cost per SCH: $185 Fall SCH per Total Faculty FTE: 112 237 47% Research/Service per Ranked Regular Faculty FTE: $65,330 $201,594 32% Departmental Information: FY2006 Full-Time Ranked Regular Faculty: 15 Percent Tenured: 73% SCH Degrees Majors FY01 FY02 FY03 FY04 FY05 5-YR FY01 FY02 FY03 FY04 FY05 5-YR FS00 FS01 FS02 FS03 FS04 5-YR _________________________________________ _______________________________________ _______________________________________ Department Total 5,107 5,109 5,495 5,607 5,792 13% 30 36 39 20 31 3% 160 138 141 128 159 ( 1%) Percent Service 70% 71% 72% 75% 73% Program Degree ___________________ ___________________ Program Name BACHELOR OF ARTS 4 9 13 4 7 75% 27 26 31 24 25 ( 7%) BACHELOR OF SCIENCE 11 10 10 5 6 ( 45%) 69 60 60 53 85 23% MASTER OF SCIENCE 11 9 11 6 14 27% 26 18 18 23 18 ( 31%) DOCTOR OF PHILOSOPHY 4 8 5 5 4 0% 38 29 32 28 31 ( 18%) MINOR . . . . . . . 5 . . . .

© 2006 The Curators of the University of Missouri 34
Uses and Limitations – System Perspective
• Department versus Program
• The Chainsaw versus the Scalpel
• Interdisciplinary/Interdepartmental Work
• Statewide Programs
• Timely Data? Using FY2004 Data
• Data Acceptance – Painting the Picture

© 2006 The Curators of the University of Missouri 35
T1 Subsidy per SCH
-100
-50
0
50
100
150
200
250

© 2006 The Curators of the University of Missouri 36
T1 Subsidy
-3,000,000
-2,000,000
-1,000,000
0
1,000,000
2,000,000
3,000,000

© 2006 The Curators of the University of Missouri 37
T1 Percent Recouped
0%20%40%60%80%
100%120%140%160%180%

© 2006 The Curators of the University of Missouri 38
Relative Productivity Graph
ANTH
EDUC
NURSARHA
COMM
BUSPHILFORN
PHY&AST ENGL
MTH&CMPSOC
SOCWK
MUSI
HIST
BIOL
PSY
CRIMJU
PUBPOL
CHEM
POLSC
0%
20%
40%
60%
80%
100%
120%
140%
160%
0% 20% 40% 60% 80% 100% 120% 140% 160% 180%
Relative Research and Service Productivity
Rela
tiv
e Instr
uctional P
rod
uctivity
High
Low Productivity
Instruction Emphasis
Research

© 2006 The Curators of the University of Missouri 39
Uses and Limitations – Campus Perspective
• VPAA and Provost Review Goals and Data Provost Identifies Units Committee of Faculty Conducts Audits

© 2006 The Curators of the University of Missouri 40
Uses and Limitations – Campus Perspective
• Units Report Addressed:– Quality– Outcomes– Demand– Relation to Campus Mission– Comparative Advantages– Adequacy of Resources
© 2006 The Curators of the University of Missouri 41
Uses and Limitations – Campus Perspective
• Results
• Stressful and Emotional Process
• FY2005 – Colleges of Education
• FY2006 In Process

© 2006 The Curators of the University of Missouri 42
Questions and Further Discussions
Additional Information:
Delaware Study - http://www.udel.edu/IR/cost/Program Audits -
http://www.umsystem.edu/ums/departments/gc/rules/administration/20/035.shtml
Cost Study - http://www.umsystem.edu/ums/departments/fa/budget/UMSL IR Office - http://www.umsl.edu/%7Eir/UMSa IR Office - http://www.umsystem.edu/ums/departments/fa/planning/

© 2006 The Curators of the University of Missouri 43
Contact Information
Cuba Plain Bob MullenDirector of Budget Planning & Development Associate DirectorUniversity of Missouri System Institutional Research & Planning 104 University Hall University of Missouri SystemColumbia, MO 65211 731 Lewis Hall(573) 882-3400 Columbia, MO [email protected] (573) 882-0004
Lawrence W. Westermeyer Tara WarneDirector, Institutional Research Associate Research AnalystUniversity of Missouri – St. Louis Institutional Research & PlanningOne University Boulevard University of Missouri SystemSt. Louis, MO 63121-4400 714 Lewis Hall(314) 516-4010 Columbia, MO [email protected] (573) 884-6674

© 2006 The Curators of the University of Missouri 44
Thank You for Your Time