> 2004 annual report...such as fountain set (holdings) ltd., a leading textile manufacturer....
TRANSCRIPT

> 2 0 0 4 A N N U A L R E P O R T

> B U S I N E S S L I N E H I G H L I G H T S
In each of our bus iness l ines , we have focused on deve lop ing deeper customer
re lat ionsh ips , opt imiz ing prof i tab i l i t y and performance, and bui ld ing on our core
strengths. Our successes demonstrate th is s t rategy i s a sound one, and i t wi l l
cont inue to gu ide our pr ior i t ies in 2005.
> Clients such as Cara Operations Ltd. can look toScotia Capital for customized financial solutions.Here, Scotia Capital’s Nick Roustas (left), KathleenCoulson (centre) and Greg Rudka (right) meet withMichael Forsayeth (second from left) and GabrielTsampalieros (second from right) from Cara.
> With years of experience throughout Asia,Scotiabank has supported long-standing customerssuch as Fountain Set (Holdings) Ltd., a leading textilemanufacturer. Lawrence Lau of Fountain Set is shownhere with Kitty Lu from Scotiabank (Hong Kong) Ltd.on the Bund in Shanghai, China.
> At Scotiabank, our core purpose is to help ourcustomers become financially better off. Last fall,customers and potential customers across Canadaattended free seminars hosted by internationalbest-selling author and financial advisor David Bach.Scotiabank has teamed up with Bach to help them“Find the Money.”
Domest ic BankingReta i l and Smal l Bus iness Bank ing IWeal th Management I Commerc ia l Bank ing
Domestic Banking provides a full range of banking and investment
services to retail, small business, commercial and wealth management
customers across Canada. These services are delivered through a national
network of more than 950 branches, more than 2,500 ABMs, call centres,
plus telephone, wireless and Internet banking. Among the investment and
advisory services offered by the Wealth Management group are full-service
brokerage, direct investing, mutual funds and private client services.
International Banking
Scotiabank has built on more than a century of international experience,
and today serves close to three million customers in the Caribbean,
Latin America and Asia. Our broad multinational network – unparalleled
by other Canadian banks – provides a complete range of financial services
to both local and international customers in more than 40 countries.
International Banking serves customers through a network of more than
770 branches and offices, 1,655 ABMs and expanding Internet
banking services.
Scotia Capital
The Scotiabank Group’s corporate and investment banking operations
focus on client relationships and provide specialized solutions to
corporate, institutional and government clients in Canada, the United
States, and Europe, and select services to clients in Mexico and Asia.
Scotia Capital has recognized strengths in specialized and syndicated
lending, corporate debt and equity underwriting, mergers and acquisi-
tions, derivatives, fixed income, foreign exchange and precious metals,
as well as equity sales, trading and research.

> TABLE OF CONTENTS
At Scotiabank, we define “success” in broad terms,
incorporating and balancing the interests of all of our
major stakeholders. This means excelling in customer
satisfaction, providing rewarding careers for our
employees, contributing to the overall well-being of the
communities we serve – and, of course, creating solid,
long-term value for our shareholders. We aspire to be
the best Canadian-based international financial services
company – a goal we aim to reach through our relentless
focus on exceeding our stakeholders’ expectations.
2 Message from the Chairmanof the Board
3 Message from the Presidentand Chief Executive Officer
4 Executive Officers
7 Performance Highlights8 Customers
10 Financial12 Operational14 People
16 Corporate Governance
16 Board of Directors
18 Glossary
19 Report on Business Lines
29 Management’s Discussionand Analysis
83 2004 Consolidated FinancialStatements
125 Principal Subsidiaries
126 Shareholder Information
2004 Scot iabank Annual Report 1
> WHO WE ARE
> Front Cover PhotoThanks to innovative products and excellent customer service, Enrique Samperio and his wife,Angeles (shown here with daughter, Daniela, and son, Enrique, and the family dog, Samy),chose Scotiabank Inverlat for the mortgage on their Mexico City home.
2 2004 Scot iabank Annual Report
> Arthur R.A. Scace
> MESSAGE FROM THE CHA IRMAN OF THE BOARD
“I ’ve been impressed by the people
and cu l ture of th i s organizat ion, i t s
va lues and commitment to do ing what
i s r ight”
It is with great pride that I report to you for the first time
as Chairman of Scotiabank. Since joining the Board in
1997, I’ve been impressed by the people and culture of
this organization, its values and commitment to doing
what is right – all of which have contributed to the
Bank’s outstanding record of performance.
Each of the 16 members of your Bank’s Board of
Directors provides a critical level of oversight to ensure
that the Bank continues to be managed for the benefit of
all its stakeholders – shareholders, customers, employ-
ees and the communities we serve. As one
of the most widely-held public companies in Canada,
Scotiabank has long understood that sound corporate
governance is essential to the Bank’s success – particu-
larly given the significant fiduciary responsibility we
have in managing other people’s money and the high lev-
els of trust that involves.
During the past year, a number of initiatives
were implemented to further strengthen Scotiabank’s
governance and compliance practices and maintain the
independence of the Board and its ability to effectively
supervise management’s operation of the Bank:
• The roles of chairman and chief executive officer
were split and a non-executive chairman appointed.
• Representation of women on the Board was increased
to 25 per cent.
• The minimum value of the common shares or
deferred stock units to be held by directors was
increased in March 2004 to $300,000 (directors will
be expected to reach this level within five years of
being elected to the Board).
• Distribution of stock options to directors was
discontinued.
With change a constant feature of the current
governance environment, Scotiabank continuously
devotes resources to evaluating not only the regulatory
landscape and its impact on the Bank’s operations, but
also the evolving needs of various stakeholders. We are
confident our policies and procedures will continue to
reflect best practices in governance.
Scotiabank’s Board of Directors, executive
management team and more than 48,000 employees,
including affiliates, are committed to working together to
achieve success for the Bank – and for all our stakehold-
ers. On behalf of the Board, it is my privilege to extend
sincere thanks to the entire Scotiabank team for their con-
tribution to the Bank’s success in 2004, in particular, their
unswerving dedication to helping our customers. The
team’s efforts are evident not only in our strong financial
performance, but also in the awards and recognition the
Bank has received from numerous external sources.
Finally, I would like to take this opportunity to
welcome Barbara Thomas to the Board. I would also like
to extend thanks to Peter Godsoe, who retired as CEO in
December 2003 and as Chairman in March 2004 after
37 years of dedicated service to your Bank, including
22 years as a member of the Board of Directors.
In addition, I would like to acknowledge the dedicated
service to the Bank and its shareholders of Sir Graham Day
and Pierre Jeanniot, who did not stand for re-election to the
Board at the annual meeting in March 2004. Both of these
individuals served the Bank and the Board with distinction
and made important contributions to our organization.
Arthur R.A. Scace
Chairman of the Board

2004 Scot iabank Annual Report 3
Achieving record financial resultsThis year, the Bank achieved excellent results, and we
once again met all of our objectives. Net income for the
year was a record $2,931 million, up $454 million or
18% over 2003. This continues a trend which has seen
earnings grow by 13.6% annually over the past five
years. Earnings per share (diluted) were $2.82, an
increase of 20.5%, and return on equity was an excellent
19.9%, versus 17.6% last year.
We also continued to reward shareholders. In 2004,
we increased dividends to common shareholders twice.
As a result, dividends rose by 31% to $1.10. In fact, the
dividend per common share has more than tripled since
1998. Strong dividends and gains in the Bank’s share price
resulted in a total return to shareholders of 25% in 2004.
The compound annual total return to shareholders has
averaged 23% over the past 10 years.
Our performance this past year was once again driven
by our three core businesses, each of which made a solid
contribution. Domestic Banking and International
Banking – our personal, small business and commercial
banking and wealth management activities in Canada and
more than 40 countries worldwide – provided 42% and
27%, respectively, to net income in 2004. Scotia Capital –
our capital markets and wholesale lending group –
accounted for 31% of earnings.
Our success was also driven by a significant improvement
in credit quality, as well as strong securities gains. The
specific provision for credit losses was $490 million, a
substantial decline from $893 million in 2003, with a
solid improvement in U.S. corporate lending. This suc-
cess was due, in part, to several efforts to further
enhance our credit risk management by reducing single
name exposures, underwriting and hold limits.
In 2004, our capital position strengthened further.
At year-end, our tangible common equity ratio – the
most effective measure of our available capital – was the
highest among the major Canadian banks. The Bank
generated $1.8 billion in capital internally this year, and
$7.1 billion over the past five years, driven by our strong
growth in net income. Our strong capital base gives us a
number of growth options, while providing a significant
cushion to handle unforeseen risks and to consider share
buybacks or dividend increases.
In recognition of this capital strength, as well as the
high quality, diversity and consistency of our earnings,
one of the main credit rating agencies in North America,
Standard & Poor’s, upgraded the Bank’s senior long-term
debt rating to AA- in 2004.
> MESSAGE FROM THE PRES IDENT AND CH I E F EXECUT IVE OFF ICER
At Scotiabank, we have always sought to manage our Bank in a careful and balanced
way. Throughout this annual report we talk about our goals and objectives across four
broad areas: meeting our customers’ needs; achieving our financial and operational
goals; and creating a rewarding environment for our people, which also involves sup-
porting the many communities we serve.
> Rick Waugh
“We remain conf ident that we have
the r ight people and the r ight
s t rateg ies in p lace to mainta in our
long record of growth, and that our
Bank wi l l cont inue to successfu l l y
de l i ver so l id resu l t s”

4 2004 Scot iabank Annual Report
Continuing challenges
Although we achieved good success this year, there are a
number of challenges facing the Scotiabank Group as we
move forward.
First, there is the challenge of achieving continued
growth – growth that is prudent, profitable and sustain-
able. In mature markets, such as Canada’s retail banking
and wealth management sectors, there continues to be
fierce competition, with relatively few opportunities to
gain significant market share through acquisitions.
In addition, in rapidly consolidating global markets, we
must achieve the necessary scale to continue to compete
effectively against very large, well-capitalized internation-
al competitors. We anticipate further consolidation in
financial services markets around the world, including the
U.S. and Europe.
More broadly, we expect sustained but somewhat slow-
er economic growth in 2005, as the world economy con-
tinues to adjust to the high and volatile energy prices and
the moderate upward trend in international interest rates.
Also, the substantial weakening of the U.S. dollar against
the world’s major currencies, as well as the Canadian
dollar, will continue to be a significant issue for us, given
the size and reach of our international operations.
Strategies for successNotwithstanding these challenges, we remain confident
that we will achieve our goal – which is to be the best
Canadian-based international financial services company.
We fully expect continued growth in earnings and
returns to shareholders, albeit at a more moderate rate,
in line with global economic conditions.
Our confidence is rooted in our three strong platforms
for growth and our very strong capital position. These
provide a range of growth options to build our customer
base and make acquisitions across our businesses, partic-
ularly in high-potential international markets. More
specifically, we have developed three sustainable growth
strategies that will form the foundation of our future suc-
cess and be applied across all of our major business lines.
Build our customer baseFirst, we will build deeper, more profitable relationshipswith our customers and acquire new customers. In
> EXECUT IVE OFF ICERS
1
2
8
3
10
5
4
7
6
1 Sarabjit S. MarwahSenior ExecutiveVice-President &Chief Financial Officer
2 Deborah M. AlexanderExecutive Vice-President,General Counsel &Secretary
3 C. John SchumacherDeputy Chairman & Headof Global Trading, ScotiaCapital
4 Luc A. VannesteExecutive Vice-President &Chief Auditor
5 Robert H. PitfieldExecutive Vice-PresidentInternational Banking
6 Sylvia D. ChrominskaExecutive Vice-PresidentHuman Resources andPublic, Corporate andGovernment Affairs
7 Dieter W. JentschExecutive Vice-PresidentCommercial Banking
8 Albert E. WahbeExecutive Vice-PresidentElectronic Banking
9 Barry LuterChief Executive OfficerScotiabank (Ireland) Ltd.
10 Stephen D. McDonaldDeputy Chairman, ScotiaCapital and U.S. CountryHead
11 Robert L. BrooksSenior ExecutiveVice-President, Treasury& Operations
9
11

2004 Scot iabank Annual Report 5
Domestic Banking, we plan to concentrate on thosecustomers who offer the greatest opportunities forgrowth – while retaining profitable business that we havewith all customers. We plan to continue to leverage oursales force, assigning customers to relationship managersbased on the profitability, loyalty and strength of therelationship – and referring them to other partners with-in the Scotiabank Group, when appropriate.
We also have a significant opportunity to acquire new
customers, given that a large number of Canadians have
not yet tried us (only one in five Canadian households
has a relationship with Scotiabank). We’ve launched an
aggressive communications program for 2005, focused on
individuals who have the highest likelihood to switch
financial institutions. We also plan to make effective use
of our branch network – which we’ve significantly
enhanced in recent years – as well as focusing on more
indirect channels, such as mortgage sales managers, to
establish new relationships.
In International Banking, we are looking to improve
our share of our customers’ business by offering a broad-
er range of products and services. In Mexico, for exam-
ple, we are focused on growing our mortgage and auto
loan portfolios – two areas where we can draw on con-
siderable Canadian expertise in adjudication, product
design and administration. We will also look to offer
other financial services, such as insurance, and are
assessing opportunities in the Eastern Caribbean, as well
as the Dominican Republic and Puerto Rico.
Scotia Capital is also deepening relationships with its
core clients through increased cross-sell of its products,
as well as selling products and services from other areas
of the Scotiabank Group.
Leverage core strengthsAs a second growth strategy, we will continue to build onour core strengths and leverage particular areas of expert-ise across the Scotiabank Group. We are now taking ourCanadian retail sales and service delivery model, adjustingit for local markets and demographics, and rolling it out inthe International Bank. This model allows us to focus ourresources more effectively, and allocate significantly moretime to sales and customer service.
Closely linked to these efforts, a number of initiatives
are underway to improve efficiency in our international
operations. We are expanding our electronic delivery
channels in the Caribbean region, particularly our ABM
121814
19
20
2115
16
17
13
12 John A. YoungExecutive Vice-PresidentDomestic Branch Banking
13 Tim P. HaywardExecutive Vice-President& Chief AdministrativeOfficer, InternationalBanking
14 Margaret (Peggy) J.MulliganExecutive Vice-PresidentSystems & Operations
15 Peter C. CardinalExecutive Vice-PresidentLatin America
16 Warren K. WalkerHead, Global RiskManagement
17 Chris J. HodgsonExecutive Vice-PresidentWealth Management
18 Alberta G. CefisExecutive Vice-PresidentRetail Lending Services
19 W. David WilsonVice-Chairman,Scotiabank, & Chairmanand CEO, Scotia Capital
20 Robert W. ChisholmVice-Chairman,Scotiabank, & Presidentand CEO, DomesticBanking & WealthManagement
21 Brian J. PorterDeputy Chairman& Head of CanadianCapital Structuring,Scotia Capital
6 2004 Scot iabank Annual Report
and Internet banking networks, and are consolidating our
data centres to take advantage of declining telecommuni-
cations costs. As well, we are using our Canadian Shared
Services group as a model for both the Caribbean and
Mexico, centralizing branch activities that are not directly
related to sales.
This year, we plan to leverage Scotia Capital’s
capabilities in Canada and the U.S., with those of
Scotiabank Inverlat in Mexico, with the goal of offering
a truly integrated North American wholesale banking
platform to our clients.
Optimize use of capitalFinally, we will optimize our use of capital. We have a
very strong capital base, and we intend to deploy it in a
disciplined way to support organic growth, as well as to
make acquisitions.
In any potential acquisition, we look for ways that we
can bring value by leveraging our core strengths. We also
look for ways to obtain value, particularly by investing in
markets or customer segments where we believe there is
above-average growth potential, or where we can expand
our product line.
At the moment, we are primarily interested in person-
al and commercial banking acquisitions, but we are also
looking in the wealth management area, inside and
outside of Canada – although, as I mentioned earlier,
opportunities in Canada are somewhat more limited.
In addition, until the federal government finalizes draft
guidelines, first released in 2001, domestic bank mergers
are not permitted, and it is difficult to speculate on possi-
bilities and outcomes. Regardless of what might happen,
our focus has not changed: to be in a position of strength
and maintain a high degree of flexibility. Our view is that
we would consider a domestic merger if we believed it
would help us improve offerings to our customers, expand
internationally and provide better opportunities for all of
our stakeholders over the long term. With or without
mergers, we have many options to grow and to deploy our
capital. We have great diversification in our business mix,
which gives us a unique position among Canadian banks.
As Canada’s most international bank, we are always
looking at ways to bolster our multinational operations,
particularly in Mexico, the Spanish-speaking Caribbean,
Central America, as well as Asia. We will also watch for
opportunities in the United States, but remain mindful of
the market’s highly competitive nature, and significant
purchase premiums and execution risk.
Focus on peopleBanking is, at heart, a people business, encompassing our
employees and the broader community, as well as our
shareholders and customers. We believe that shareholder
value is driven by satisfied, loyal customers, who are won
and retained by satisfied, dedicated employees. We pro-
mote a philosophy of One Team, One Goal and emphasize
our shared core values of integrity, respect, commitment,
insight and spirit.
We’re very proud of the Scotiabank Group team. This
was a difficult year, in particular for our employees in the
Caribbean, a region where a series of hurricanes had a
devastating impact this past fall – including causing
significant damage to Scotiabank branches and offices,
and our employees’ homes. Thanks to the tremendous
efforts of our team, we resumed operations and restored
service to customers quickly. In addition, our Bank and
our staff provided supplies and other forms of assistance
to employees. And, in the true spirit of teamwork, employ-
ees in Canada and other parts of the world raised funds
and personally donated more than $100,000 to aid their
colleagues who had been directly affected. Overall, the
Bank made corporate contributions totaling more than
$750,000 to the Red Cross and other relief organizations.
Of course, this focus on people and teamwork is
ongoing and extends to the broader community. We are
committed to being a leader in corporate social responsi-
bility – which encompasses the way we interact with our
stakeholders to meet our social, economic,
environmental and ethical responsibilities.
As part of this commitment, Scotiabank contributed
more than $33 million worldwide to support activities,
projects and organizations in the fields of education,
health care, social services and the arts – particularly
those that empower people with skills, tools and infor-
mation to improve their health, safety and well-being.
Going forward, we remain confident that we have the
right people and the right strategies in place to maintain
our long record of growth, and that our Bank will contin-
ue to successfully deliver solid results, meeting our
financial and operational objectives – as well as the
needs of our customers and our people.
Rick Waugh
President and Chief Executive Officer

2004 Scot iabank Annual Report 7
E a ch yea r, S co t i abank se t s bo th quan t i t a t i v e
and qua l i t a t i v e pe r fo rmance ob j e c t i v e s wh i ch
we segment i n to fou r g roups – cu s tomer s ,
f i nanc i a l , ope ra t i ona l and peop l e . I n the
fo l l ow ing pages , we h igh l i gh t ou r p rog re s s
toward ach i e v i ng those ob j e c t i v e s .
CUSTOMERS F INANC IAL
PAGE 10PAGE 8
PAGE 14PAGE 12
OPERAT IONAL PEOPLE

8 2004 Scot iabank Annual Report
Ou r cu s tome r s a re a t t he c en t re o f e ve r y th i ng we do . We a re ded i c a t ed t o
bu i l d i ng deepe r re l a t i on sh i p s w i t h t hem to s a t i s f y t he i r t o t a l f i n anc i a l
need s , b y p ro v i d i ng t hem w i th ou t s t and ing s e r v i c e f rom a ded i c a t ed t eam,
so l i d adv i c e , and i nnova t i v e p roduc t s and s e r v i c e s .
> CUSTOMERS

2004 Scot iabank Annual Report 9
> Main PhotoScotiabank is committed to helping small businesses, suchas H.V. Truong Ltd., grow and prosper. The Langley, B.C.mushroom farm is owned and operated by Ha Quan Truongand his wife, Van. The Truongs rely on Scotiabank for boththeir business and personal banking needs.
> Small PhotoThe service and personal contact Mary Mann has receivedsince becoming a ScotiaMcLeod client in 1989 motivatedher to recommend their full-service brokerage to her daughter,Alison Van Wermeskerken, as well as several other membersof her family.
Scotiabank has some 10 million customers worldwide –
including more than 6.5 million in Canada, 1.3 million in
Mexico and close to 1.7 million in the Caribbean. Our
core purpose is to be the best at helping our customers
become financially better off by providing relevant
solutions to their unique needs.
Our primary goal related to customers is to be a
leader in customer satisfaction. This is a key priority
across all of our core businesses and, in 2004,
Scotiabank’s customers remained the most satisfied in
many of our major markets.
We retained our top ranking among Canada’s five largest
banks in the annual Customer Service Index survey of
Canadian personal banking customers by Synovate for the
fifth consecutive year. This was just one of several
surveys recognizing our service excellence worldwide
during 2004.
Outside Canada, Scotiabank Inverlat in Mexico placed
in the top three in every category of a customer satisfac-
tion survey by the business publication El Economista,
including first-place rankings for branch and telephone
banking. Scotiabank Jamaica was named Bank of the Year
in Jamaica by The Banker for the second consecutive
year, and Scotiabank de Costa Rica topped a customer
usage and attitudes study by CID Gallup.
In wholesale banking, Scotia Capital was named Best
Investment Bank, and Best Corporate and Institutional
Internet Bank in Canada by Global Finance, as well as
Best Debt House in Canada by Euromoney.
Excellent Service+ Unique Solutions
Customer Satisfaction

10 2004 Scot iabank Annual Report
Sol id contributions from the Bank’s three major business l ines, Domestic Banking,
Scotia Capital and International Banking, helped us surpass our 2004 financial
targets. By focusing on our core strengths in customer satisfaction, people,
diversif ication, expense and r isk management and execution, we continued to
achieve outstanding returns and dividend growth for our shareholders.
2004 Scot iabank Annual Report 11
> F INANC IAL
0
100
200
300
400
500
600
700
800
94 96 98 00 02 04
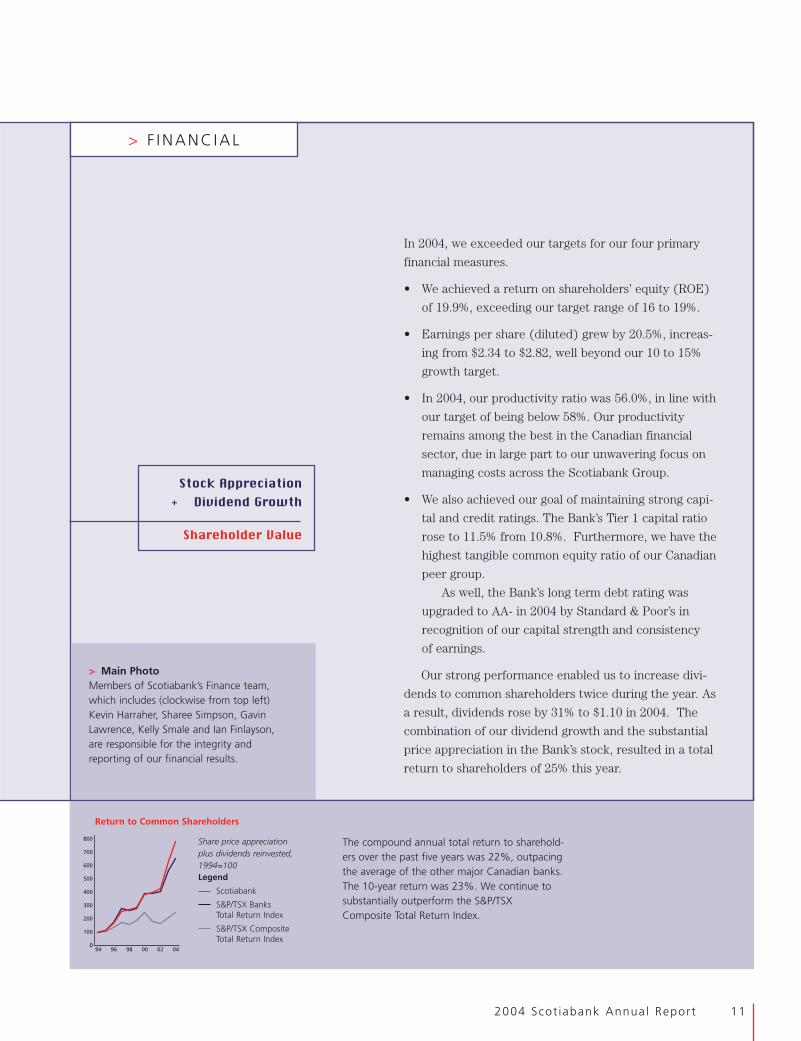
Return to Common Shareholders
Share price appreciationplus dividends reinvested,1994=100Legend
Scotiabank
S&P/TSX BanksTotal Return Index
S&P/TSX CompositeTotal Return Index
Stock Appreciation+ Dividend Growth
Shareholder Value
In 2004, we exceeded our targets for our four primary
financial measures.
• We achieved a return on shareholders’ equity (ROE)
of 19.9%, exceeding our target range of 16 to 19%.
• Earnings per share (diluted) grew by 20.5%, increas-
ing from $2.34 to $2.82, well beyond our 10 to 15%
growth target.
• In 2004, our productivity ratio was 56.0%, in line with
our target of being below 58%. Our productivity
remains among the best in the Canadian financial
sector, due in large part to our unwavering focus on
managing costs across the Scotiabank Group.
• We also achieved our goal of maintaining strong capi-
tal and credit ratings. The Bank’s Tier 1 capital ratio
rose to 11.5% from 10.8%. Furthermore, we have the
highest tangible common equity ratio of our Canadian
peer group.
As well, the Bank’s long term debt rating was
upgraded to AA- in 2004 by Standard & Poor’s in
recognition of our capital strength and consistency
of earnings.
Our strong performance enabled us to increase divi-
dends to common shareholders twice during the year. As
a result, dividends rose by 31% to $1.10 in 2004. The
combination of our dividend growth and the substantial
price appreciation in the Bank’s stock, resulted in a total
return to shareholders of 25% this year.
> Main PhotoMembers of Scotiabank’s Finance team,which includes (clockwise from top left)Kevin Harraher, Sharee Simpson, GavinLawrence, Kelly Smale and Ian Finlayson,are responsible for the integrity andreporting of our financial results.
The compound annual total return to sharehold-ers over the past five years was 22%, outpacingthe average of the other major Canadian banks.The 10-year return was 23%. We continue tosubstantially outperform the S&P/TSXComposite Total Return Index.

12 2004 Scot iabank Annual Report
> Main PhotoScotia Capital’s Financial Engineering Group,led by Mark Engel, provides trading deskswith the financial models, trading systems andtechnology to manage market, counterparty andoperational risks. They are responsible for theimplementation of a common process operatingmodel. They also co-ordinate developmentof operational and control procedures forstructured transactions.
> Upper Left PhotoTo build efficiency and profitability in ourcommercial operations, customer sales supportand service functions are being centralized intoseveral Commercial Business Support Centres(BSCs) located across Canada. We piloted theconcept in Halifax, where (from left) senior rela-tionship manager Patti Davis works with ColinHaynes, Melissa O’Brien, Carolyn Johnson andother BSC staff.
> Upper Right PhotoA dedicated mortgage sales force in theCaribbean and Central America is generatinga new source of customers by cultivatingrelationships with local realtors and real estatedevelopers. Realtors such as Amalitha Tai Chew(left) feel confident referring their customers toHome Financing Specialists, such as Trudy Pedroof Scotiabank Trinidad and Tobago (right), forexpert advice and personalized service.
> OPERAT IONAL
Scot iabank takes pr ide in i t s longstand ing reputat ion for e ff i c iency. Safe , sound
and effec t i ve sys tems and processes throughout the Scot iabank Group are the key
to ma inta in ing our record of operat iona l exce l lence .
We have incorporated common systems, a shared services approach
and best practices across our multinational operations, and adapted
them to local markets. This, in turn, has increased the productivity of
our employees, improved efficiency, enhanced the quality and consis-
tency of our customer service, and accelerated the introduction of new
products and services.
Sophisticated in-house credit risk management capabilities in
all of our business lines also help us to manage costs and take an
effective approach to product pricing. We are committed to
managing our businesses in a way that ensures we operate with an
acceptable level of credit risk at all times. Our credit function works
closely with the business lines, analyzing industries, countries,
individual borrowers and products to ensure we maintain an
appropriate balance and diversification of our risks. Improved credit
policies, analytical tools and lending parameters have recently led to
improved results, in Canada and internationally.
While credit risk management plays a significant role in our
success, we also recognize the importance of safeguarding the
Bank’s reputation and maintaining public confidence in our integrity.
As part of our risk management process, we have centralized and
enhanced our compliance management and reporting functions.
We have also implemented new policies, procedures and training
programs to help employees identify and review financial transac-
tions that involve heightened risk to the Bank’s reputation.

2004 Scot iabank Annual Report 13
First-rate Execution+ Risk Management
Increased Efficiency andReduced Risk

14 2004 Scot iabank Annual Report
Employee Satisfaction+ Employee Engagement
Employer of Choice> PEOPLE
We be l ieve that sa t i s f ied and engaged employees prov ide the k ind of cus tomer
serv i ce that leads to sa t i s f ied and loya l cus tomers . Th i s i s why we are commit ted
to be ing a great p lace to work . Our focus on peop le dr i ves our goa l to be
recogn ized as an employer of cho ice by both cur rent and potent ia l employees .
> Main PhotoThe Central Retail Collection unit at ourScotiabank de Costa Rica subsidiary was one ofseveral locations that achieved top scores inViewPoint, our annual employee satisfaction survey,demonstrating how Scotiabank’s commitment tobeing an employer of choice is experienced acrossour international organization.
> Upper Left PhotoEleanor Evans of our Kensington, P.E.I. branchvolunteers her time to support the tradition of stepdancing. She is shown here with some membersfrom the local dance troupe, the Lady Slipper StepDancers (from left): Megan MacLeod, Claya Coleand Haley Evans.
> Upper Right PhotoScotia Applause is a multi-dimensional web-basedrecognition program that rewards employees' out-standing contributions, by way of peer recognitionand other online tools. According to Yvette Bryan,Director, Employee Recognition and Motivation(right), the program further strengthens ouremployees' focus on our corporate core values. Italso helps us deliver exceptional customer service,which improves customer loyalty and satisfaction.Branch managers such as Linda Davies and PatLucarelli agree that employees are motivated by therecognition they receive.
Our most recent employee survey showed our overall employee satis-
faction index at 82 per cent, a two per cent increase from last year.
In 2004, we enhanced the performance of the Scotiabank Group team
by expanding our training and development opportunities, strength-
ening our leadership development initiatives, increasing our focus on
the advancement of women and extending our employee recognition
and reward programs.
To meet customers’ rising expectations and fulfill employees’
career goals, we offer a variety of training, development and
accreditation programs, including online e-learning tools.
We continue to build our management capabilities by adding rigour to
how we identify emerging leaders and provide them with development
opportunities. And we have renewed our efforts to advance women into
senior management ranks through a number of initiatives, including
networking and mentoring programs, both in Canada and internationally.
Our employees also play an important role in promoting Scotiabank
as a leading corporate citizen in the communities where they live and
work. In addition to the significant financial support the Bank donates
to important causes around the world, we enable our employees to
give back to our communities. From programs that match employee
contributions to support for those who request time to work on behalf
of others, we continue to partner with our employees who dedicate
their time and enthusiasm to make a difference in their community.
For more information, please see our Public Accountability
Statement/Corporate Social Responsibility Report, available at
www.scotiabank.com.

2004 Scot iabank Annual Report 15

16 2004 Scot iabank Annual Report
> BOARD OF D IRECTORS
M. Keith Goodrich
Mr. Goodrich is the retired
Chairman of Moore Corporation
Limited. He has been a Scotiabank
director since August 28, 1990,
and currently sits on the Audit and
Conduct Review and the
Corporate Governance and
Pension Committees.
N. Ashleigh Everett
Ms. Everett is President, Corporate
Secretary and Director of Royal
Canadian Securities Limited. She
has been a Scotiabank director
since October 28, 1997, and cur-
rently sits on the Human Resources
and the Corporate Governance
and Pension Committees.
Laurent Lemaire
Mr. Lemaire is Executive
Vice-Chairman of the Board of
Cascades Inc. He has been a
Scotiabank director since March
31, 1987, and currently sits on
the Executive and Risk and the
Human Resources Committees.
John C. Kerr, C.M., O.B.C., LL.D.
Mr. Kerr is Chairman and Chief
Executive Officer of Lignum
Investments Ltd. He has been a
Scotiabank director since March 30,
1999, and currently sits on the
Human Resources and the
Corporate Governance and Pension
Committees.
Ronald A. Brenneman
Mr. Brenneman is President and
Chief Executive Officer of
Petro-Canada. He has been a
Scotiabank director since March
28, 2000, and currently sits on the
Audit and Conduct Review and
the Human Resources Committees.
C.J. Chen
Mr. Chen is Senior Partner of Rajah
& Tann. He has been a Scotiabank
director since October 30, 1990,
and currently sits on the Corporate
Governance and Pension
Committee.
John T. Mayberry(1)
Mr. Mayberry is the retired
Chair of the Board and Chief
Executive Officer of Dofasco Inc.
He has been a Scotiabank direc-
tor since March 29, 1994, and
currently sits on the Executive
and Risk Committee (Chair).
The Honourable Michael J.L. Kirby
Senator Kirby is a Member of the
Senate of Canada. He has been a
Scotiabank director since March
28, 2000, and currently sits on the
Audit and Conduct Review (Chair)
and the Executive and Risk
Committees.
Arthur R.A. Scace, Q.C.
Mr. Scace is Chairman of Scotiabank
and counsel to McCarthy Tétrault LLP.
He has been a Scotiabank director
since March 25, 1997, and currently
sits on the Human Resources (Chair)
and the Executive and Risk
Committees.
> CORPORATE GOVERNANCE
Sound and effect ive corporate governance i s a pr ior i ty for Scot iabank – indeed, i t i s
cons idered essent ia l to the Bank’s long-term success .
Corporate governance is the platform by which a business
is directed and controlled. In the broader sense, it is a
framework designed to build sustainable financial per-
formance, while ensuring proper accountability, openness
and integrity in the conduct of an organization’s business.
Scotiabank’s corporate governance policies are
designed to maintain the independence of the Board and
its ability to effectively supervise management’s operation
of the Bank. Board independence promotes management
of the Bank for the long-term benefit of all its major
stakeholders – shareholders, employees, customers, and
the communities in which the Bank operates.
In keeping with best practices in corporate governance,
more than 80% of Scotiabank’s directors are independent.
The Board is led by a non-executive chairman, who acts
in an advisory capacity to the President and Chief
Executive Officer and to other officers in all matters
concerning the interests of the Board and relationships
between management and the Board.
The Bank’s directors are business and community
leaders active at the regional, national and international
levels and, collectively, they provide an invaluable
breadth of experience. Scotiabank’s directors have been
carefully selected for their qualifications – including,
(1) Non-independent (NYSE Rules) – prior interlocking corporate relationship with a Bank executive officer.(2) Non-independent (NYSE Rules), related (TSX Guidelines) and affiliated (Bank Act) – overall business relationship with the Bank.(3) Non-independent (NYSE Rules), related (TSX Guidelines) and affiliated (Bank Act) – President and CEO of the Bank.

2004 Scot iabank Annual Report 17
Elizabeth Parr-Johnston, Ph.D.
Dr. Parr-Johnston is President of
Parr Johnston Economic and Policy
Consultants. A Scotiabank director
since October 26, 1993, she
currently sits on the Audit and
Conduct Review and the
Corporate Governance and
Pension Committees.
The Honourable Barbara J.
McDougall, O.C.
Mrs. McDougall is an advisor to
Aird & Berlis LLP. A Scotiabank
director since March 30, 1999, she
currently sits on the Audit and
Conduct Review and the Human
Resources Committees.
Allan C. Shaw, C.M., LL.D.
Mr. Shaw is Chairman and Chief
Executive Officer of The Shaw Group
Limited. A Scotiabank director since
September 30, 1986, he currently
sits on the Executive and Risk and
the Corporate Governance and
Pension (Chair) Committees.
Paul D. Sobey
Mr. Sobey is President and
Chief Executive Officer of Empire
Company Limited. He has been
a Scotiabank director since
August 31, 1999, and currently
sits on the Audit and Conduct Review
and the Corporate Governance and
Pension Committees.
Rick Waugh(3)
Mr. Waugh is President and Chief
Executive Officer of Scotiabank. He
was appointed a Scotiabank director
on March 25, 2003 and currently sits
on the Executive and Risk Committee.
He is also a director of several of the
Bank’s subsidiaries and affiliates.
among other factors, their financial literacy, integrity and
demonstrated sound and independent business judgment.
The Board of Directors and its Corporate Governance
and Pension Committee have been, and continue to be,
proactive and diligent in developing and reviewing the
Bank’s corporate governance structure and procedures.
This committee reviews the Bank’s corporate governance
policies at least annually and recommends approval or
changes to the Board.
Scotiabank continually looks for ways to strengthen its
corporate governance policies and procedures at all levels
across the Bank. During 2004, for example, the Bank
intensified its commitment to corporate social responsi-
bility. Also, the strategic decision was made to establish
a more centralized compliance function to enhance
compliance risk management across the entire Scotiabank
Group. To further guard against reputational risk, the
Scotiabank Group introduced two new policies: the
Suitability Policy, and the Reputational and Legal Risk
Policy and Procedures for Structured Finance
Transactions. These supplement existing policies and
better equip employees to identify financial transactions
that involve heightened reputational risk, and ensure that
complex products and transactions are understood by
customers and are suitable to their business activities.
In the interests of promoting greater disclosure about
the Bank’s corporate governance policies and procedures –
particularly as to how they align with requirements of the
Bank’s various regulators in Canada and the United States
– comprehensive information can be found in the
Corporate Governance section of the Bank’s website and in
the management proxy circular. As well, the Bank’s corpo-
rate governance practices do not differ significantly from
the NYSE listed company corporate governance standards.
Gerald W. Schwartz(2)
Mr. Schwartz is Chairman and
Chief Executive Officer of Onex
Corporation. He has been a
Scotiabank director since
May 26, 1999, and currently sits
on the Executive and Risk
Committee.
Honorary Directors*
Lloyd I. Barber, C.C., S.O.M.,LL.D., Ph.D.Regina Beach, Saskatchewan
Malcolm R. BaxterSaint John, New Brunswick
Bruce R. BirminghamOakville, Ontario
E. Kendall CorkHillsburgh, Ontario
Sir Graham DayHantsport, Nova Scotia
Peter C. Godsoe, O.C.Toronto, Ontario
The Honourable HenryN.R. JackmanToronto, Ontario
Pierre J. Jeanniot, O.C.Montreal, Quebec
John J. Jodrey,C.M., D.C.L.Hantsport, Nova Scotia
Gordon F. MacFarlane, O.B.C.,LL.D.Surrey, British Columbia
Donald MaclarenOttawa, Ontario
Gerald J. MaierCalgary, Alberta
Malcolm H.D. McAlpineHerts, England
Ian McDougallLynbrook, New York
William S. McGregorEdmonton, Alberta
David E. Mitchell, O.C.Calgary, Alberta
David MortonWestmount, Quebec
Sir Denis Mountain, Bt.London, England
Helen A. ParkerSidney, British Columbia
Paul J. PhoenixBurlington, Ontario
Robert L. Pierce, Q.C.Calgary, Alberta
David H. RaceToronto, Ontario
Cedric E. Ritchie, O.C.Toronto, Ontario
Thomas G. Rust,C.M., LL.D.Vancouver, British Columbia
Isadore Sharp, O.C.Toronto, Ontario
Marie Wilson, Q.C.Toronto, Ontario
* Honorary Directors do notattend meetings of the Board.
Barbara S. Thomas
Ms. Thomas is a corporate director.
She has been a Scotiabank director
since September 28, 2004, and
currently sits on the Audit and
Conduct Review Committee.
18 2004 Scot iabank Annual Report
> GLOSSARY
ALLOWANCE FOR CREDIT LOSSES: An allowance set aside which, in management’sopinion, is adequate to absorb all credit-related losses from on and off-balancesheet items. It includes specific, country risk and general allowances.ASSETS UNDER ADMINISTRATION AND MANAGEMENT: Assets owned by customers, forwhich the Bank provides management and custodial services. These assets are notreported on the Bank’s consolidated balance sheet.BANKERS’ ACCEPTANCES (BAs): Negotiable, short-term debt securities, guaranteed fora fee by the issuer’s bank.BASIS POINT: A unit of measure defined as one-hundredth of one per cent.CAPITAL: Consists of common shareholders’ equity, preferred shareholders’ equityand subordinated debentures. It can support asset growth, provide against loanlosses and protect depositors.COUNTRY RISK ALLOWANCE: Funds set aside initially in 1987-89 to cover potentiallosses on exposure to a designated group of emerging market countries deter-mined by OSFI.DERIVATIVE PRODUCTS: Financial contracts whose value is derived from an underly-ing price, interest rate, exchange rate or price index. Forwards, options and swapsare all derivative instruments.DESIGNATED EMERGING MARKETS (DEM): Countries against whose loans and securitiesOSFI has required banks to set aside a country risk allowance.FOREIGN CURRENCY TRANSLATION GAIN/LOSS: The unrealized gain or loss recordedwhen foreign currency assets and liabilities are translated into Canadian dollars ata balance sheet date, when exchange rates differ from those of the previous bal-ance sheet date.FOREIGN EXCHANGE CONTRACTS: Commitments to buy or sell a specified amount offoreign currency on a set date and at a predetermined rate of exchange.FORWARD RATE AGREEMENT (FRA): A contract between two parties, whereby a desig-nated interest rate, applied to a notional principal amount, is locked in for a spec-ified period of time. The difference between the contracted rate and prevailing mar-ket rate is paid in cash on the settlement date. These agreements are used to pro-tect against, or take advantage of, future interest rate movements.FUTURES: Commitments to buy or sell designated amounts of commodities, securi-ties or currencies on a specified date at a predetermined price. Futures are tradedon recognized exchanges. Gains and losses on these contracts are settled daily,based on closing market prices.GENERAL ALLOWANCE: Established by the Bank to recognize credit losses which haveoccurred as at the balance sheet date, but have not yet been specifically identifiedon an individual item-by-item basis.HEDGING: Protecting against price, interest rate or foreign exchange exposures bytaking positions that are expected to react to market conditions in an offsettingmanner.IMPAIRED LOANS: Loans on which the Bank no longer has reasonable assurance asto the timely collection of interest and principal, or where a contractual payment ispast due a prescribed period. Interest is not accrued on impaired loans.MARKED-TO-MARKET: The valuation of securities and off-balance sheet instruments,such as interest and exchange rate contracts, held for trading purposes, at marketprices as of the balance sheet date. The difference between market and bookvalue is recorded as a gain or loss to income.MIDDLE OFFICE: The independent middle office plays a key role in risk managementand measurement. It reviews trading models and valuations; develops and per-forms stress tests, sensitivity analysis and VAR calculations; reviews profit and lossperformance; and participates in new product development.NET INTEREST MARGIN: Net interest income, on a taxable equivalent basis, expressedas a percentage of average total assets.NOTIONAL PRINCIPAL AMOUNTS: The contract or principal amounts used to determinepayments for certain off-balance sheet instruments, such as FRAs, interest rateswaps and cross-currency swaps. The amounts are termed “notional” becausethey are not usually exchanged themselves, serving only as the basis for calculat-ing amounts that do change hands.
OFF-BALANCE SHEET INSTRUMENTS: These are indirect credit commitments, includingundrawn commitments to extend credit and derivative instruments.OPTIONS: Contracts between buyer and seller giving the buyer of the option theright, but not the obligation, to buy (call), or sell (put) a specified commodity,financial instrument or currency at a set price or rate on or before a specifiedfuture date.OSFI: The Office of the Superintendent of Financial Institutions Canada, the regu-lator of Canadian banks.PRODUCTIVITY RATIO: Measures the efficiency with which the Bank incurs expenses togenerate revenue. It expresses non-interest expenses as a percentage of the sumof net interest income on a taxable equivalent basis and other income. A lowerratio indicates improved productivity.REPOS: Repos is short for “obligations related to assets sold under repurchaseagreements” – a short-term transaction where the Bank sells assets, normally gov-ernment bonds, to a client and simultaneously agrees to repurchase them on aspecified date and at a specified price. It is a form of short-term funding.RETURN ON EQUITY (ROE): Net income available to common shareholders, expressedas a percentage of average common shareholders’ equity.REVERSE REPOS: Short for “assets purchased under resale agreements” – a short-term transaction where the Bank purchases assets, normally government bonds,from a client and simultaneously agrees to resell them on a specified date and ata specified price. It is a form of short-term collateralized lending.RISK-WEIGHTED ASSETS: Calculated using weights based on the degree of credit riskfor each class of counterparty. Off-balance sheet instruments are converted to bal-ance sheet equivalents, using specified conversion factors, before the appropriaterisk weights are applied.SECURITIZATION: The process by which financial assets (typically loans) are trans-ferred to a trust, which normally issues a series of different classes of asset-backedsecurities to investors to fund the purchase of loans. The Bank normally accountsfor these transfers as a sale, provided certain conditions are met, and according-ly, the loans are removed from the consolidated balance sheet.STANDBY LETTERS OF CREDIT AND LETTERS OF GUARANTEE: Assurances given by the Bankthat it will make payments on behalf of clients to third parties. The Bank hasrecourse against its clients for any such advanced funds.SWAPS: Interest rate swaps are agreements to exchange streams of interest pay-ments, typically one at a floating rate, the other at a fixed rate, over a specifiedperiod of time, based on notional principal amounts. Cross-currency swaps areagreements to exchange payments in different currencies over predeterminedperiods of time.TAXABLE EQUIVALENT BASIS (TEB): The grossing up of tax-exempt income earned oncertain securities to an equivalent before-tax basis. This ensures uniform meas-urement and comparison of net interest income arising from both taxable and tax-exempt sources.TIER 1, TOTAL CAPITAL AND TANGIBLE COMMON EQUITY RATIOS: These are ratios of capitalto risk-weighted assets, as stipulated by OSFI, based on guidelines developedunder the auspices of the Bank for International Settlements (BIS). Tier 1 capital,the more permanent, consists primarily of common shareholders’ equity, non-con-trolling interest in subsidiaries plus non-cumulative preferred shares, less unamor-tized goodwill and ineligible intangible assets. Tier 2 capital consists mainly ofsubordinated debentures and the eligible general allowance. Together, Tier 1 andTier 2 capital less certain deductions comprise total regulatory capital. Tangible com-mon equity is comprised of common shareholders’ equity, less goodwill and intan-gible assets.VALUE AT RISK (VAR): VAR is an estimate of the potential loss of value that mightresult from holding a position for a specified period of time, with a given level ofstatistical confidence.
2004 Scot iabank Annual Report 19
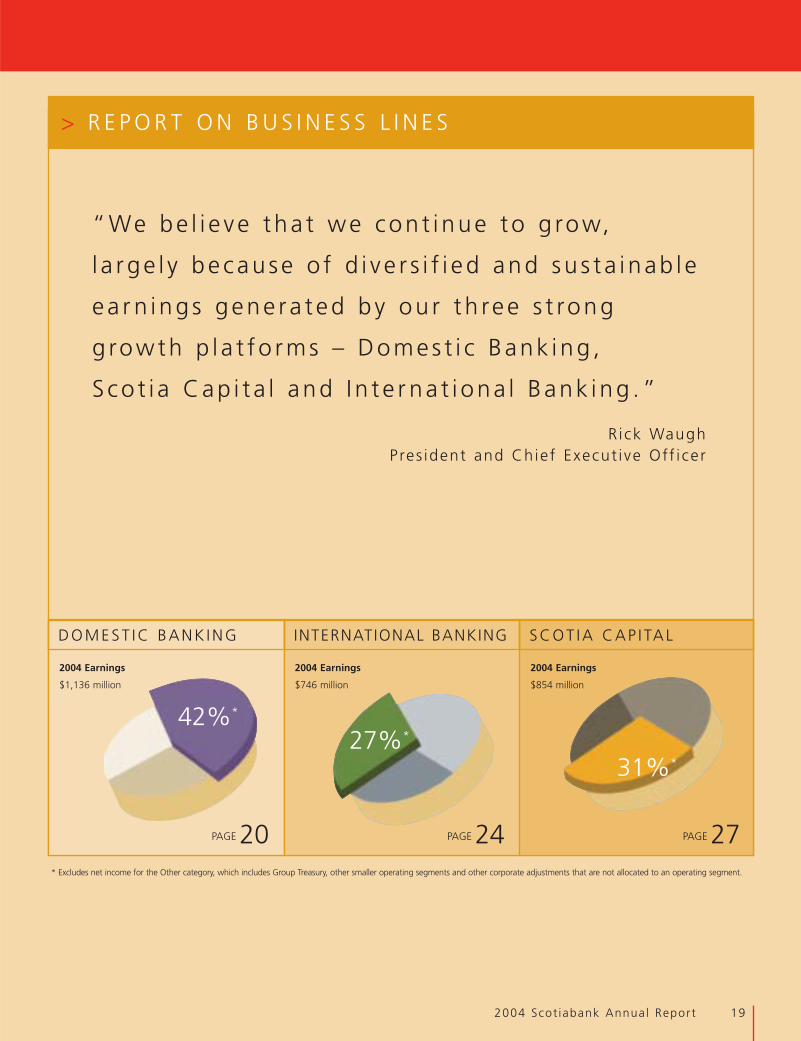
“We be l i e ve tha t we con t i nue to g row,
l a rge l y because o f d i ve r s i f i ed and su s t a i nab l e
ea r n ings gene ra ted by ou r th ree s t rong
g rowth p l a t fo rms – Domes t i c Bank ing ,
Sco t i a Cap i t a l and I n t e r na t i ona l Bank ing .”
Rick WaughPres ident and Chief Execut ive Off icer
> R E P O R T O N B U S I N E S S L I N E S
42%*
27%*
2004 Earnings
$1,136 million
PAGE 20
DOMEST IC BANK ING
31%*
2004 Earnings
$854 million
PAGE 27
SCOT IA CAP I TAL
2004 Earnings
$746 million
PAGE 24
INTERNATIONAL BANKING
* Excludes net income for the Other category, which includes Group Treasury, other smaller operating segments and other corporate adjustments that are not allocated to an operating segment.
20 2004 Scot iabank Annual Report
> D O M E S T I C B A N K I N G RETA I L AND SMALL BUS INESS BANK ING | WEALTH MANAGEMENTCOMMERC IAL BANK ING
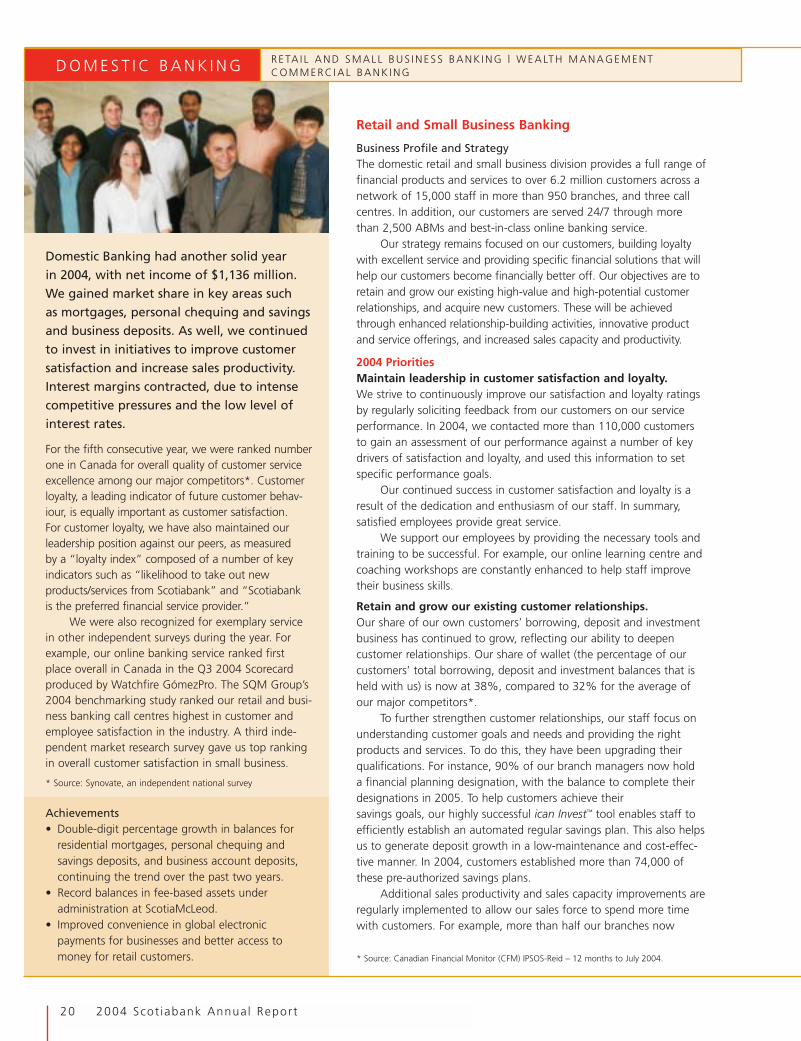
Domestic Banking had another solid yearin 2004, with net income of $1,136 million.We gained market share in key areas suchas mortgages, personal chequing and savingsand business deposits. As well, we continuedto invest in initiatives to improve customersatisfaction and increase sales productivity.Interest margins contracted, due to intensecompetitive pressures and the low level ofinterest rates.
For the fifth consecutive year, we were ranked numberone in Canada for overall quality of customer serviceexcellence among our major competitors*. Customerloyalty, a leading indicator of future customer behav-iour, is equally important as customer satisfaction.For customer loyalty, we have also maintained ourleadership position against our peers, as measuredby a “loyalty index” composed of a number of keyindicators such as “likelihood to take out newproducts/services from Scotiabank” and “Scotiabankis the preferred financial service provider.”
We were also recognized for exemplary servicein other independent surveys during the year. Forexample, our online banking service ranked firstplace overall in Canada in the Q3 2004 Scorecardproduced by Watchfire GómezPro. The SQM Group’s2004 benchmarking study ranked our retail and busi-ness banking call centres highest in customer andemployee satisfaction in the industry. A third inde-pendent market research survey gave us top rankingin overall customer satisfaction in small business.
* Source: Synovate, an independent national survey
Achievements• Double-digit percentage growth in balances for
residential mortgages, personal chequing andsavings deposits, and business account deposits,continuing the trend over the past two years.
• Record balances in fee-based assets underadministration at ScotiaMcLeod.
• Improved convenience in global electronicpayments for businesses and better access tomoney for retail customers.
Retail and Small Business Banking
Business Profile and StrategyThe domestic retail and small business division provides a full range offinancial products and services to over 6.2 million customers across anetwork of 15,000 staff in more than 950 branches, and three callcentres. In addition, our customers are served 24/7 through morethan 2,500 ABMs and best-in-class online banking service.
Our strategy remains focused on our customers, building loyaltywith excellent service and providing specific financial solutions that willhelp our customers become financially better off. Our objectives are toretain and grow our existing high-value and high-potential customerrelationships, and acquire new customers. These will be achievedthrough enhanced relationship-building activities, innovative productand service offerings, and increased sales capacity and productivity.
2004 PrioritiesMaintain leadership in customer satisfaction and loyalty.We strive to continuously improve our satisfaction and loyalty ratingsby regularly soliciting feedback from our customers on our serviceperformance. In 2004, we contacted more than 110,000 customersto gain an assessment of our performance against a number of keydrivers of satisfaction and loyalty, and used this information to setspecific performance goals.
Our continued success in customer satisfaction and loyalty is aresult of the dedication and enthusiasm of our staff. In summary,satisfied employees provide great service.
We support our employees by providing the necessary tools andtraining to be successful. For example, our online learning centre andcoaching workshops are constantly enhanced to help staff improvetheir business skills.
Retain and grow our existing customer relationships.Our share of our own customers’ borrowing, deposit and investmentbusiness has continued to grow, reflecting our ability to deepencustomer relationships. Our share of wallet (the percentage of ourcustomers’ total borrowing, deposit and investment balances that isheld with us) is now at 38%, compared to 32% for the average ofour major competitors*.
To further strengthen customer relationships, our staff focus onunderstanding customer goals and needs and providing the rightproducts and services. To do this, they have been upgrading theirqualifications. For instance, 90% of our branch managers now holda financial planning designation, with the balance to complete theirdesignations in 2005. To help customers achieve theirsavings goals, our highly successful ican Invest™ tool enables staff toefficiently establish an automated regular savings plan. This also helpsus to generate deposit growth in a low-maintenance and cost-effec-tive manner. In 2004, customers established more than 74,000 ofthese pre-authorized savings plans.
Additional sales productivity and sales capacity improvements areregularly implemented to allow our sales force to spend more timewith customers. For example, more than half our branches now
* Source: Canadian Financial Monitor (CFM) IPSOS-Reid – 12 months to July 2004.
2004 Scot iabank Annual Report 212004 Scot iabank Annual Report 212004 Scot iabank Annual Report 21
> DOMEST IC BANK ING
participate in a call redirect program. To date, this programhas automatically directed 30% of calls to these branches toan interactive voice response system, freeing up staff time andimproving productivity.
We have used our increasing sales capacity to proactivelymanage our relationships with high-value and high-potentialcustomers. These customers have been identified using ouraward-winning data warehouse based on strength of relation-ship and profitability. They are then assigned to our most qual-ified sales officers. We know that when we proactively managethese customer relationships, we generate significantly higherbalance growth compared to other customers.
Provide innovative financial solutions based on cus-tomers’ needs. Our competitive products, customer focus,and sales and service philosophy have continued to producesignificant growth in market share.
For example, we continued to leverage the successfulMoney Master® High Interest Savings account by expanding thefamily of products to include Money Master for RSPs™ (RSPs andRIFs), and Money Master for business™. We now have almostone million customers taking advantage of these popular prod-ucts, with balances growing by 85% in 2004.
Small business customers are integral to our strategies andpriorities. Our focus is on both their personal and businessneeds, and we have a small business banker in each branchwho is trained to understand the distinct needs of this impor-tant customer segment.
We have increased our sales capacity and productivity tobuild stronger relationships with more customers. For exam-ple, we simplified the way these customers conduct theirbanking by further automating our business account openingprocess and simplifying forms so they can be completed inone visit. In addition, we successfully piloted a new automatedloan application system called Scotiaworx, and are rolling itout nationally to all our branches.
We have also focused on small business customer acquisi-tion. In this regard, we will continue to leverage our strongprofessional association and alliance relationships, such as our
successful relationships with the College of Family Physiciansof Canada and the Canadian Federation of IndependentBusiness, as sources of new small business customers.
In 2005, we will continue with these priorities, increasingthe capacity of our small business banker sales force, andintroducing innovative solutions to help these customersbecome financially better off, both personally and in theirbusinesses.
2005 PrioritiesFor 2005, our key strategies are to continue to retain andgrow relationships by helping customers achieve their financialgoals, and to focus on new customer acquisition.
Efforts to support building deeper, more profitable rela-tionships include:• Aligning our sales force with the customers who represent
our best opportunities for growth;• Increasing sales capacity by implementing new technology,
removing administration and streamlining processes; and• Increasing sales productivity through enhanced tools and
metrics.For new customer acquisition, we will be reviewing our
branch network to ensure we are optimally serving all ourhigh-potential markets. We are also launching a new, fullyintegrated communication program to increase the propensityof consumers to consider Scotiabank for their next financialproduct purchase.
Wealth Management
Business Profile and StrategyWealth Management provides brokerage, private banking,investment management, estate and trust services, and mutu-al fund solutions to more than 700,000 clients, through anintegrated team of professionals.
Our strategy is to use the four cornerstone financial plan-ning approach (investing, borrowing, banking and insurance)to meet the full financial needs of our more affluent clients.Wealth Management works closely with Retail Banking toleverage resources and maximize referrals.
Domestic Banking – vital statistics 2004 2003 2002
Staffing 19,785 20,221 20,564Number of branches 957 964 984Employee satisfaction index (%) 87 84 83Household share of wallet (%) 38 37 37Retail customer loyalty index vs peer group (%)* 34 vs 30 38 vs 30 34 vs 28
* Source: Synovate CSI
2004 Priorities
Client service delivery. ScotiaMcLeod is delivering industry-leading client service through the Client Commitment pro-gram, a major coaching, training and process improvementinitiative aimed at defining core service standards andimproving client satisfaction. According to recent clientresearch, the results have been very positive, with a significantyear-over-year increase in clients’ confidence in the investmentstrategy provided by advisors. In addition, more clients agreedthat ScotiaMcLeod simplified their financial affairs, had astrong team of experts, and provided quality service.
In ScotiaMcLeod Direct Investing (SMDI), we continued toimprove the online client experience. Based on significant clientinput, we launched numerous enhancements, including regis-tered account details, streaming quotes, news and charting,integrated trading functionality from research pages, and more.As a result of these enhancements, SMDI was recognized by theWatchfire GómezPro and Globe and Mail Report on Businessonline brokerage surveys, improving its ranking in both.
Sales growth. In Scotia Private Client Group, Scotiatrustlaunched Charitable Foundations and Gift Planning as a corebusiness, creating a national centre of expertise. Scotia Casselslaunched two new funds, a Corporate Bond Fund and a CashManagement Account, which gathered approximately $350million and $100 million in assets, respectively.
Our strategy of focusing on a balanced offering of coreinvestment solutions aligned with customers’ long-term goalshas driven sales of the Scotia Selected and Scotia PartnersPortfolio series funds. Net sales in 2004 were over $600 million,the large majority of which came from the retail branches.
ScotiaMcLeod’s focus on increasing recurring revenue hascontinued. Fee-based asset growth for 2004 increased 36%,and our fee-based assets under administration reached an all-time high. To help support this growth, a comprehensive suiteof portfolios was launched. Summit Optimized Portfolios offerclients the convenience of professional portfolio managementin a single account, and are the first multi-manager, multi-styleportfolios of their kind to be offered in Canada.
Closer collaboration and integration with Retail Banking.We continued to re-engineer the Wealth Management tech-nology platform, leveraging the Bank’s existing infrastructureto improve personal computer performance and provide
remote access. This provides greater flexibility for investmentadvisors, allowing them to be more productive, while reducingoperating costs.
ScotiaMcLeod financial planners received 140% morequalified referrals from their Scotiabank Group partners in2004, resulting in more than $550 million in assets beingtransferred in. Referrals to Scotia Private Client Group fromother parts of the Bank increased by 42%, resulting in $1.5billion in assets being transferred in. At the same time, refer-rals from ScotiaMcLeod financial planners back to theirScotiabank Group partners increased by 155%, resulting inmore than $322 million in new business.
2005 Priorities• We will continue to leverage Client Commitment as our
delivery model for the affluent segment, with the nextphase examining best practices for increasing sales in PrivateBanking, Insurance, Will and Estate Planning, Personal Trustand Investment Management services.
• To increase sales of mutual fund and investment savingsproducts, we will strengthen training and align incentivesfor sales officers in Retail Banking.
• We are working with Retail Banking to define a financialplanning strategy that will improve our capability to deliverand support financial planning across all client segments.
Commercial Banking
Business Profile and StrategyCommercial Banking provides a full range of competitive prod-ucts and customized solutions to mid-market and independentbusiness clients. This includes specialization in real estate lend-ing and automotive finance. As well, merchant banking servic-es are provided through our subsidiary, RoyNat Capital.
We are building deeper and more profitable client rela-tionships by combining our strength in relationship manage-
22 2004 Scot iabank Annual Report
> DOMEST IC BANK ING
Wealth Management – Revenue by area($ millions) 2004 2003 2002
Retail Brokerage $ 523 $ 478 $ 440Mutual Funds 116 109 109Private Client Group 135 130 130Other 23 34 48
Total revenue $ 797 $ 751 $ 727
Wealth Management – vital statistics 2004 2003 2002
Assets under administration (AUA) ($ million) (1) 96,931 87,615 80,705Assets under management (AUM) ($ million) (1) 19,777 17,373 18,407Number of investment executives (IE) 792 828 851Assets per IE ($ millions) 63.0 55.0 44.0Retail brokerage trading volumes (# of trades in thousands) 3,158 2,774 2,658% increase in active discount brokerage accounts 7 4 26Net fund sales (redemptions) ($ millions) 751 (512) 658% of funds in top quartiles on basis of one-year return 37 69 51
(1) As at September 30.
2004 Scot iabank Annual Report 23
> DOMEST IC BANK ING
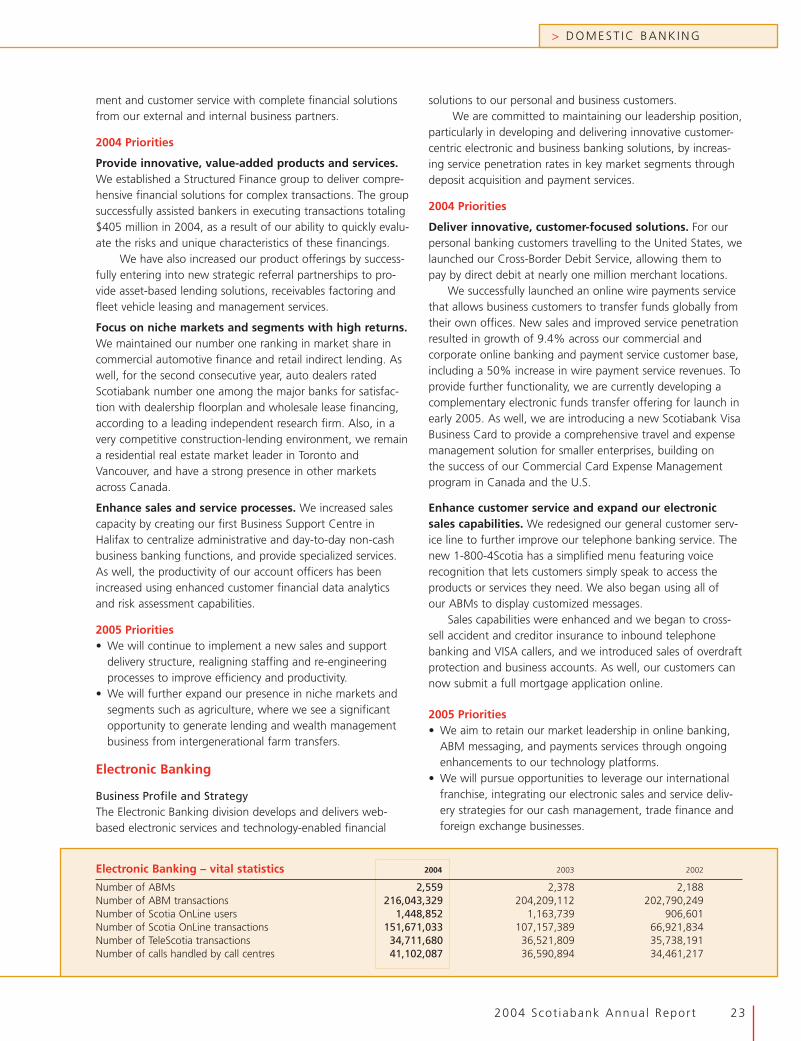
ment and customer service with complete financial solutionsfrom our external and internal business partners.
2004 Priorities
Provide innovative, value-added products and services.We established a Structured Finance group to deliver compre-hensive financial solutions for complex transactions. The groupsuccessfully assisted bankers in executing transactions totaling$405 million in 2004, as a result of our ability to quickly evalu-ate the risks and unique characteristics of these financings.
We have also increased our product offerings by success-fully entering into new strategic referral partnerships to pro-vide asset-based lending solutions, receivables factoring andfleet vehicle leasing and management services.
Focus on niche markets and segments with high returns.We maintained our number one ranking in market share incommercial automotive finance and retail indirect lending. Aswell, for the second consecutive year, auto dealers ratedScotiabank number one among the major banks for satisfac-tion with dealership floorplan and wholesale lease financing,according to a leading independent research firm. Also, in avery competitive construction-lending environment, we remaina residential real estate market leader in Toronto andVancouver, and have a strong presence in other marketsacross Canada.
Enhance sales and service processes. We increased salescapacity by creating our first Business Support Centre inHalifax to centralize administrative and day-to-day non-cashbusiness banking functions, and provide specialized services.As well, the productivity of our account officers has beenincreased using enhanced customer financial data analyticsand risk assessment capabilities.
2005 Priorities• We will continue to implement a new sales and support
delivery structure, realigning staffing and re-engineeringprocesses to improve efficiency and productivity.
• We will further expand our presence in niche markets andsegments such as agriculture, where we see a significantopportunity to generate lending and wealth managementbusiness from intergenerational farm transfers.
Electronic Banking
Business Profile and StrategyThe Electronic Banking division develops and delivers web-based electronic services and technology-enabled financial
solutions to our personal and business customers.We are committed to maintaining our leadership position,
particularly in developing and delivering innovative customer-centric electronic and business banking solutions, by increas-ing service penetration rates in key market segments throughdeposit acquisition and payment services.
2004 Priorities
Deliver innovative, customer-focused solutions. For ourpersonal banking customers travelling to the United States, welaunched our Cross-Border Debit Service, allowing them topay by direct debit at nearly one million merchant locations.
We successfully launched an online wire payments servicethat allows business customers to transfer funds globally fromtheir own offices. New sales and improved service penetrationresulted in growth of 9.4% across our commercial andcorporate online banking and payment service customer base,including a 50% increase in wire payment service revenues. Toprovide further functionality, we are currently developing acomplementary electronic funds transfer offering for launch inearly 2005. As well, we are introducing a new Scotiabank VisaBusiness Card to provide a comprehensive travel and expensemanagement solution for smaller enterprises, building onthe success of our Commercial Card Expense Managementprogram in Canada and the U.S.
Enhance customer service and expand our electronicsales capabilities. We redesigned our general customer serv-ice line to further improve our telephone banking service. Thenew 1-800-4Scotia has a simplified menu featuring voicerecognition that lets customers simply speak to access theproducts or services they need. We also began using all ofour ABMs to display customized messages.
Sales capabilities were enhanced and we began to cross-sell accident and creditor insurance to inbound telephonebanking and VISA callers, and we introduced sales of overdraftprotection and business accounts. As well, our customers cannow submit a full mortgage application online.
2005 Priorities• We aim to retain our market leadership in online banking,
ABM messaging, and payments services through ongoingenhancements to our technology platforms.
• We will pursue opportunities to leverage our internationalfranchise, integrating our electronic sales and service deliv-ery strategies for our cash management, trade finance andforeign exchange businesses.
Electronic Banking – vital statistics 2004 2003 2002
Number of ABMs 2,559 2,378 2,188Number of ABM transactions 216,043,329 204,209,112 202,790,249Number of Scotia OnLine users 1,448,852 1,163,739 906,601Number of Scotia OnLine transactions 151,671,033 107,157,389 66,921,834Number of TeleScotia transactions 34,711,680 36,521,809 35,738,191Number of calls handled by call centres 41,102,087 36,590,894 34,461,217

24 2004 Scot iabank Annual Report
> I N T E R N AT I O N A L B A N K I N G
International Banking had an excellent yearin 2004. The Caribbean, Central America andMexico continue to achieve solid assetgrowth, in conjunction with further improve-ments in credit quality. Once again, thesestrong results were partially offset by theforeign currency translation effect of astrengthening Canadian dollar against theMexican peso and most Caribbean currencies.
Over the past five years, our disciplined, proactiveapproach to acquisition opportunities has helped usto add to our existing franchises and expand intoother high-growth markets. In fact, 37% of 2004earnings came from acquisitions made since 1999.We have a dedicated mergers and acquisitions teamthat is constantly evaluating opportunities. Duringthe year, we continued to focus on our investmentsin high-potential, Spanish-speaking markets. InMexico, we further increased our ownership ofScotiabank Inverlat to 97%, and purchased a largeportfolio of consumer auto loans. In El Salvador, wesigned a memorandum of understanding to purchaseBanco de Comercio, the country’s fourth-largestbank. In the Dominican Republic, we have success-fully integrated the assets acquired from BancoIntercontinental S.A. and have already begun to seesignificant contributions from this investment.
Achievements• Recognized this year by a number of major publica-
tions as Best Bank in the Caribbean, Mexico andDominican Republic, Best Rated Bank in Costa Rica,Best Multinational Company in Chile, Bank of theYear in Jamaica, along with four major first placeawards for service quality in Mexico.
• Scotiabank Inverlat maintained its leadership posi-tion among all Mexican banks in new mortgageand automobile lending growth.
• Successfully integrated 39 Banco IntercontinentalS.A. branches in Dominican Republic in less thanfive months.
Caribbean and Central America
Business Profile and StrategyOperating in 24 countries with 259 branches and offices and a net-work of 535 ABMs, we provide over two million customers with abroad range of personal and commercial banking services.
Our strategy is to achieve superior growth through improvedsales and service productivity, to deepen customer relationshipsthrough increased cross-sell, and the expansion or introduction ofcomplementary businesses. We will also continue our proactive anddisciplined assessment of acquisition opportunities that accelerategrowth in our high-potential, Spanish-speaking markets.
2004 Priorities
Accelerate organic growth by improving sales and service pro-ductivity and effectiveness. Using the experience gained inCanada, we conducted detailed time and activity measurement stud-ies throughout the region, compared the results against our domesticsales organization benchmarks and developed action plans toimprove performance gaps that were identified.
Counselor, our new customer relationship management tool,was also fully implemented in our pilot location, Barbados, and isbeing rolled out across the region. This new tool simplifies and tracksindividual sales officer activities and results and reduces paperwork,leaving staff with more time to proactively contact customers andmanage relationships with them.
Introduce and expand complementary businesses. To deepenrelationships with existing customers and acquire new customers, wecontinued to introduce and expand complementary businesses, suchas mutual funds and insurance products. We launched a major insur-ance initiative in Trinidad and Tobago, where we have already sur-passed our initial sales projections. Further, Scotiabank’s family ofmutual funds was launched in Trinidad and Tobago, Cayman Islandsand Jamaica.
Improve operational efficiency and sales capacity throughautomation and centralization. We continued our efforts toincrease customer usage of cost-effective self-service channels,adding more than 150,000 new active users this year. To furtherincrease usage, we introduced our Internet banking solution in ninecountries to supplement our automated telephone banking capabili-ties. We also expanded our already extensive ABM network, adding100 machines, a 23% increase from last year.
Our re-engineering efforts expanded substantially in 2004 witha total of 14 countries now using a streamlined, web-based creditapplication and adjudication system for small business lending. Morethan 7,000 of our small business customers have benefited from theuse of this new system.
We also streamlined our credit card processing, replacing sixdifferent credit card processing platforms with a single new systemfor all of the Caribbean and Central America and Mexico. Thissystem will achieve significant operational efficiencies andsubstantially improve product development and pricing capabilities.
2004 Scot iabank Annual Report 25
> INTERNAT IONAL BANK ING
Use targeted acquisitions to accelerate growth. Whileorganic expansion of our branch network continues in keygrowth markets such as Costa Rica, El Salvador, Trinidad andTobago and Puerto Rico, proactive identification and disci-plined assessment of potential acquisitions in these and otherhigh-potential markets has been a key area of focus in 2004.
We signed a memorandum of understanding to acquireBanco de Comercio in El Salvador, the country’s fourth-largestbank, with total assets of more than US$1 billion, 48 branchesand 80 ABMs. Combined with our existing operations, ourmarket share in El Salvador will exceed 17%.
We also continued to apply our unique integrationexpertise in the Dominican Republic, and have successfullycompleted the integration of the acquired assets of BancoIntercontinental S.A.
2005 Priorities• Continue to refine sales and service processes, drawing
from our experience in Canada.• Use shared services to optimize efficiencies and remove
non-sales activities from branches.• Focus on opportunistic acquisition efforts in key countries.• Expand our insurance, mutual funds and private banking
businesses.
Mexico
Business Profile and StrategyGrupo Financiero Scotiabank Inverlat is one of the principalfinancial groups in Mexico, with 431 branches and offices anda network of 1,023 ABMs. It provides more than one millionpersonal, commercial and corporate customers with a fullrange of banking products and services, along with selectcapital markets capabilities.
Our strategy is to increase market share in Mexico’s rapidlygrowing retail and commercial segments through improve-ments to sales and service productivity and effectiveness, theexpansion of our delivery network, and enhancements andadditions to our product and service capabilities.
2004 Priorities
Increase ownership of Scotiabank Inverlat. Scotiabankcompleted the acquisition of a further 6% of the shares ofGrupo Financiero Scotiabank Inverlat this year, bringing ourtotal ownership to 97%.
Accelerate organic growth by improving sales and serv-ice productivity and effectiveness. In 2004, Inverlat contin-ued to achieve strong results with growth in both lending anddeposits. Once again, we led the market in acquiring new,high-potential retail customers through our automotivefinance and residential mortgage lending efforts. The
introduction of new mortgage products, and the combinedefforts of our branch-based and expanded specialized salesforces, enabled us to achieve 28% market share in new bank-financed automotive lending and 27% share of new residen-tial bank mortgages.
Sales and service productivity improvements continued tobe a key area of focus. As in Canada and the Caribbean, adetailed time and activity study was performed in Mexico toidentify key areas for sales process and performance improve-ment. To enable these improvements, a new scheduling andcontact management tool was introduced across the entirebranch network that will create additional sales capacity andallow for better tracking of sales activities and results.
Our ongoing expansion efforts continued this year, as weadded 17 new branches and offices to our delivery network.
Expand complementary businesses. Scotiabank Inverlat con-tinued to cement its leadership in Mexican capital markets. Ithas acted as lead arranger in several major syndicated loantransactions, including a US$2.4 billion syndication for Telmex,the largest loan syndication in Latin American history. Inverlatretained its first-place ranking in Mexican commercial paper andshort-term debt issuance, and was awarded a prestigious man-date to lead Pemex’s first commercial paper issue in Mexico.
Wealth management remains a key growth opportunityfor Inverlat and has been a major focus in 2004. In order toprovide our wealth management customers with the highestlevel of service, 16 of our wealth management units havebeen merged into branch operations to offer customers a fullyintegrated model that includes retail banking, retail brokerageand mutual funds.
Improve operational efficiency and sales capacitythrough automation and centralization. Inverlat achievedmajor milestones in its effort to leverage cost-effective alter-nate delivery channels, while at the same time providing cus-tomers with greater choice. By August of this year, Inverlat callcentres had received more than one million calls. At the sametime, Internet banking continues to expand rapidly. More than1.5 million customer transactions are now being conductedvia Internet banking each month.
Credit processes have been substantially re-engineeredand new technology introduced to improve customer servicelevels and reduce processing costs. The result of these effortshas been a dramatic improvement in our ability to provideretail credit approvals. Average approval times were reducedfrom two days in 2002 to approximately two hours in 2004.
Implementation of the shared services platform continuedthroughout 2004, resulting in significant efficiency gainsthrough the removal of a number of non-sales and servicefunctions from branches.
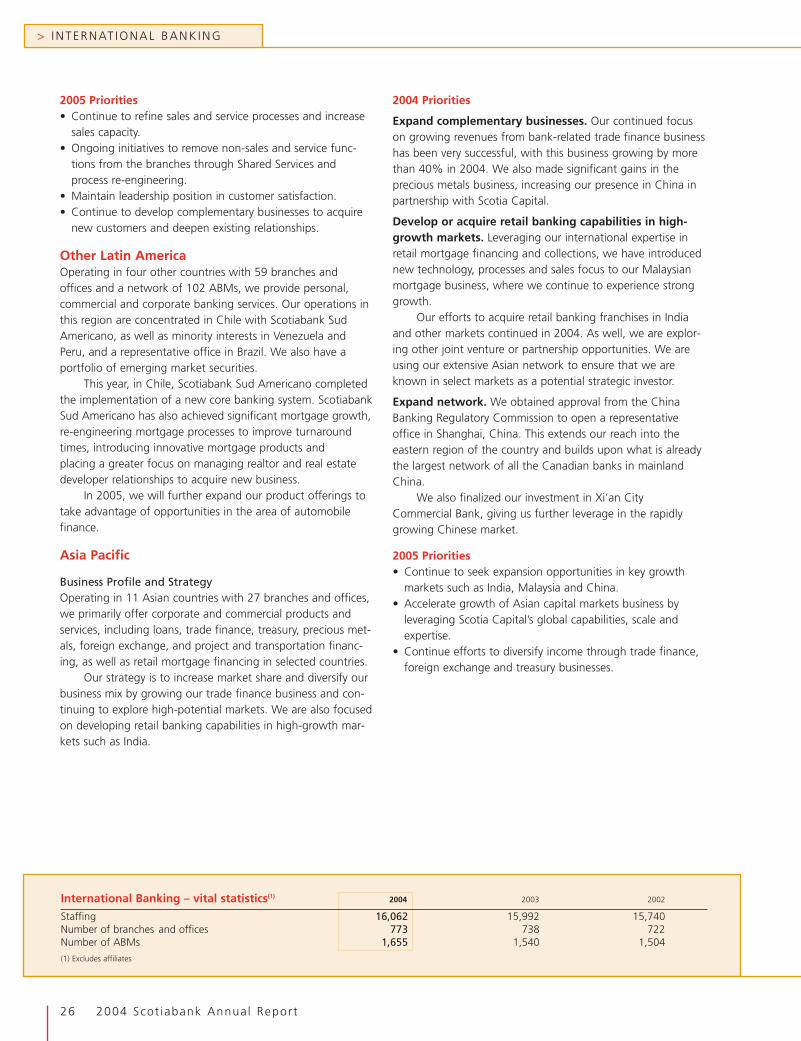
International Banking – vital statistics(1) 2004 2003 2002
Staffing 16,062 15,992 15,740Number of branches and offices 773 738 722Number of ABMs 1,655 1,540 1,504
(1) Excludes affiliates
26 2004 Scot iabank Annual Report
> INTERNAT IONAL BANK ING
2005 Priorities• Continue to refine sales and service processes and increase
sales capacity.• Ongoing initiatives to remove non-sales and service func-
tions from the branches through Shared Services andprocess re-engineering.
• Maintain leadership position in customer satisfaction.• Continue to develop complementary businesses to acquire
new customers and deepen existing relationships.
Other Latin AmericaOperating in four other countries with 59 branches andoffices and a network of 102 ABMs, we provide personal,commercial and corporate banking services. Our operations inthis region are concentrated in Chile with Scotiabank SudAmericano, as well as minority interests in Venezuela andPeru, and a representative office in Brazil. We also have aportfolio of emerging market securities.
This year, in Chile, Scotiabank Sud Americano completedthe implementation of a new core banking system. ScotiabankSud Americano has also achieved significant mortgage growth,re-engineering mortgage processes to improve turnaroundtimes, introducing innovative mortgage products andplacing a greater focus on managing realtor and real estatedeveloper relationships to acquire new business.
In 2005, we will further expand our product offerings totake advantage of opportunities in the area of automobilefinance.
Asia Pacific
Business Profile and StrategyOperating in 11 Asian countries with 27 branches and offices,we primarily offer corporate and commercial products andservices, including loans, trade finance, treasury, precious met-als, foreign exchange, and project and transportation financ-ing, as well as retail mortgage financing in selected countries.
Our strategy is to increase market share and diversify ourbusiness mix by growing our trade finance business and con-tinuing to explore high-potential markets. We are also focusedon developing retail banking capabilities in high-growth mar-kets such as India.
2004 Priorities
Expand complementary businesses. Our continued focuson growing revenues from bank-related trade finance businesshas been very successful, with this business growing by morethan 40% in 2004. We also made significant gains in theprecious metals business, increasing our presence in China inpartnership with Scotia Capital.
Develop or acquire retail banking capabilities in high-growth markets. Leveraging our international expertise inretail mortgage financing and collections, we have introducednew technology, processes and sales focus to our Malaysianmortgage business, where we continue to experience stronggrowth.
Our efforts to acquire retail banking franchises in Indiaand other markets continued in 2004. As well, we are explor-ing other joint venture or partnership opportunities. We areusing our extensive Asian network to ensure that we areknown in select markets as a potential strategic investor.
Expand network. We obtained approval from the ChinaBanking Regulatory Commission to open a representativeoffice in Shanghai, China. This extends our reach into theeastern region of the country and builds upon what is alreadythe largest network of all the Canadian banks in mainlandChina.
We also finalized our investment in Xi’an CityCommercial Bank, giving us further leverage in the rapidlygrowing Chinese market.
2005 Priorities• Continue to seek expansion opportunities in key growth
markets such as India, Malaysia and China.• Accelerate growth of Asian capital markets business by
leveraging Scotia Capital’s global capabilities, scale andexpertise.
• Continue efforts to diversify income through trade finance,foreign exchange and treasury businesses.
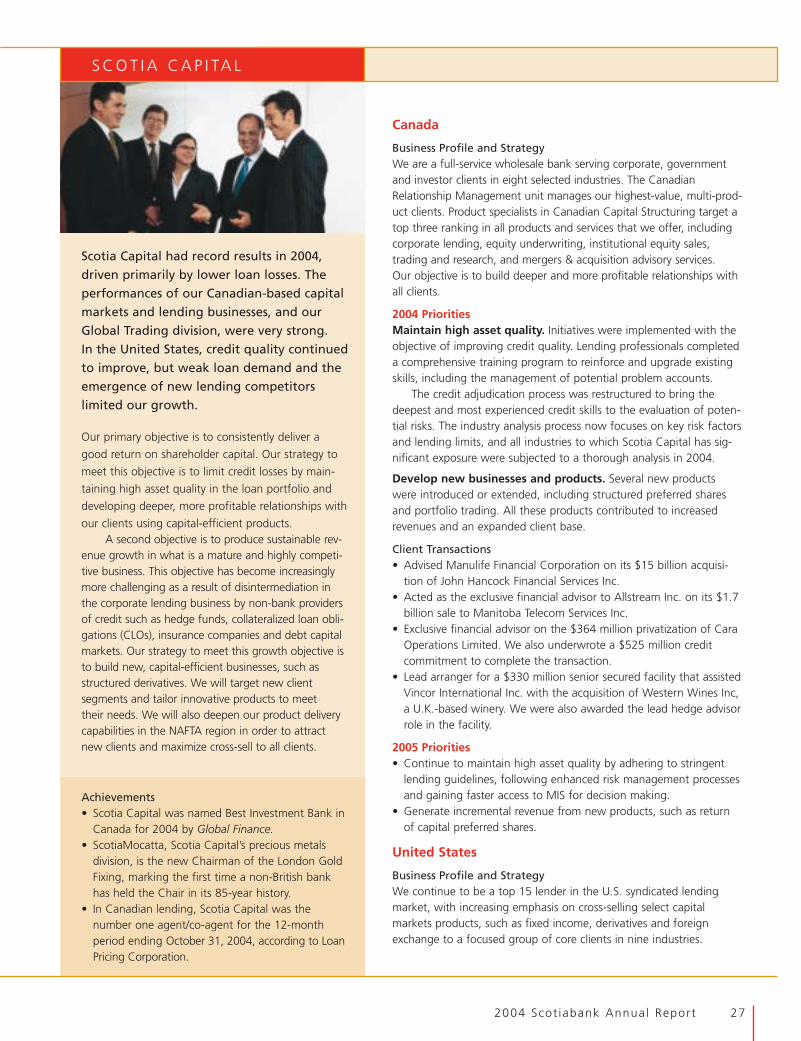
2004 Scot iabank Annual Report 27
> S C O T I A C A P I TA L
Scotia Capital had record results in 2004,driven primarily by lower loan losses. Theperformances of our Canadian-based capitalmarkets and lending businesses, and ourGlobal Trading division, were very strong.In the United States, credit quality continuedto improve, but weak loan demand and theemergence of new lending competitorslimited our growth.
Our primary objective is to consistently deliver a
good return on shareholder capital. Our strategy to
meet this objective is to limit credit losses by main-
taining high asset quality in the loan portfolio and
developing deeper, more profitable relationships with
our clients using capital-efficient products.A second objective is to produce sustainable rev-
enue growth in what is a mature and highly competi-tive business. This objective has become increasinglymore challenging as a result of disintermediation inthe corporate lending business by non-bank providersof credit such as hedge funds, collateralized loan obli-gations (CLOs), insurance companies and debt capitalmarkets. Our strategy to meet this growth objective isto build new, capital-efficient businesses, such asstructured derivatives. We will target new clientsegments and tailor innovative products to meettheir needs. We will also deepen our product deliverycapabilities in the NAFTA region in order to attractnew clients and maximize cross-sell to all clients.
Achievements• Scotia Capital was named Best Investment Bank in
Canada for 2004 by Global Finance.• ScotiaMocatta, Scotia Capital’s precious metals
division, is the new Chairman of the London GoldFixing, marking the first time a non-British bankhas held the Chair in its 85-year history.
• In Canadian lending, Scotia Capital was thenumber one agent/co-agent for the 12-monthperiod ending October 31, 2004, according to LoanPricing Corporation.
Canada
Business Profile and StrategyWe are a full-service wholesale bank serving corporate, governmentand investor clients in eight selected industries. The CanadianRelationship Management unit manages our highest-value, multi-prod-uct clients. Product specialists in Canadian Capital Structuring target atop three ranking in all products and services that we offer, includingcorporate lending, equity underwriting, institutional equity sales,trading and research, and mergers & acquisition advisory services.Our objective is to build deeper and more profitable relationships withall clients.
2004 PrioritiesMaintain high asset quality. Initiatives were implemented with theobjective of improving credit quality. Lending professionals completeda comprehensive training program to reinforce and upgrade existingskills, including the management of potential problem accounts.
The credit adjudication process was restructured to bring thedeepest and most experienced credit skills to the evaluation of poten-tial risks. The industry analysis process now focuses on key risk factorsand lending limits, and all industries to which Scotia Capital has sig-nificant exposure were subjected to a thorough analysis in 2004.
Develop new businesses and products. Several new productswere introduced or extended, including structured preferred sharesand portfolio trading. All these products contributed to increasedrevenues and an expanded client base.
Client Transactions• Advised Manulife Financial Corporation on its $15 billion acquisi-
tion of John Hancock Financial Services Inc.• Acted as the exclusive financial advisor to Allstream Inc. on its $1.7
billion sale to Manitoba Telecom Services Inc.• Exclusive financial advisor on the $364 million privatization of Cara
Operations Limited. We also underwrote a $525 million creditcommitment to complete the transaction.
• Lead arranger for a $330 million senior secured facility that assistedVincor International Inc. with the acquisition of Western Wines Inc,a U.K.-based winery. We were also awarded the lead hedge advisorrole in the facility.
2005 Priorities• Continue to maintain high asset quality by adhering to stringent
lending guidelines, following enhanced risk management processesand gaining faster access to MIS for decision making.
• Generate incremental revenue from new products, such as returnof capital preferred shares.
United States
Business Profile and StrategyWe continue to be a top 15 lender in the U.S. syndicated lendingmarket, with increasing emphasis on cross-selling select capitalmarkets products, such as fixed income, derivatives and foreignexchange to a focused group of core clients in nine industries.
> SCOT IA CAP I TAL CONT INUED
28 2004 Scot iabank Annual Report
> SCOT IA CAP I TAL
2004 PrioritiesReducing loan losses and improving credit quality.As in Canada, we implemented initiatives to improve creditquality. The addition of a local loan portfolio managementgroup and new MIS tools supported and improved our creditdecision making. We also took actions to reduce non-performing loans, including loan sales of $630 million in 2004.The large majority of the U.S. loan portfolio is investment grade.
In 2001, we identified a portfolio of more than 350low-return accounts, with plans to exit those accounts by theend of 2005. During 2004, we completed the exit of thoseaccounts, more than one year ahead of schedule.
Selective addition of new clients. We began to grow theportfolio by selectively adding clients that met our return hur-dles and which offered excellent opportunity for cross-sell. Thenumber of core clients grew by about 10% in 2004, includingboth investment grade and non-investment grade clients.
Client Transactions• Won the Thompson Financial – Project Finance International
“Power Deal of the Year” and the Euromoney “PowerPortfolio Deal of the Year” awards for our role in financingFPL Energy Construction Funding.
• Administrative agent and arranger of US$1.25 billion incredit facilities for Las Vegas Sands Inc.
2005 Priorities• Increase cross-sell of non-lending products by enhancing the
skill set of our professionals and identifying new clients wecan serve profitably across the NAFTA region.
• Respond to the impact of new non-bank lending competitorsby developing credit products for investor clients, launchingcollateralized debt obligations (CDOs) which earn manage-ment fees along with equity returns from our investment, andusing loan substitutes, such as credit default swaps.
• Utilize business development funds to assist in the earlydevelopment of client relationships.
Global Trading
Business Profile and StrategyWe develop and market capital-efficient products such as deriv-atives, fixed income, foreign exchange and, throughScotiaMocatta, precious metals. We focus on marketing deriva-tives and foreign exchange to corporate clients, while expand-ing business with government and investor clients in the NAFTAregion, with an opportunistic approach to Europe and Asia.
2004 PrioritiesGrow the client base. The capital markets group, whichmarkets fixed income and derivative products, established
more than 130 new client relationships in Canada and theU.S., with a focus on growing the investor client base.
Expand product offerings. We expanded our product line-up, building a deeper U.S. fixed income capability, and devel-oping unique, high-margin structured derivative products. Wealso opened a peso derivatives trading desk in Mexico.
Reduce costs. Consolidation of back-office operations acrossNew York, London and Toronto achieved sizeable cost savings.Additional efficiencies were created through centralization ofthe Europe derivative products group to Dublin from London.
Client Transactions• Joint bookrunner of a US$350 million high-yield bond offer-
ing which funded Alimentation Couche-Tard Inc.’s $1.1 bil-lion acquisition of Circle K stores.
• Acted as the co-lead agent and co-bookrunner for the YellowPages Income Fund’s $750 million medium-term note issue.
• Awarded the co-lead arranger and co-bookrunner roles inIntrawest Corporation’s cross-border high-yield senior notesissue, of which $125 million was placed in Canada andUS$225 million was placed in the U.S.
2005 Priorities• Continue to focus on developing high-margin products such
as credit derivatives, and target high-margin segments suchas investor clients. We will also look for opportunities indeveloping markets in Latin America and Asia.
• Realize efficiencies through the continued review and con-solidation of front and back office functions.
EuropeWe are a niche competitor in the syndicated lending market,cross-selling selected capital markets products to a core groupof clients in five industry groups, using the same stringentlending guidelines implemented in North America. We onlycompete with European lenders in those targeted industrygroups. Revenue growth and higher return on equity willcome from enhanced secondary loan trading, cross-sellingnon-lending products and using business development fundsto invest in client relationships.
Latin America and AsiaScotia Capital and Scotiabank operate wholesale businesses invarious Latin American and Asian markets. In order to opti-mize the delivery of product capabilities to clients, we aredeveloping plans for the greater alignment of these businesseswith Scotia Capital. The first step is development of a NAFTAwholesale banking platform, including Scotia Capital inCanada and the United States, and Scotiabank Inverlat’sMexican wholesale banking business.
Scotia Capital – vital statistics 2004 2003 2002
Staffing 1,309 1,340 1,447Core corporate clients 1,446 1,494 1,426Average products per client 2.2 2.2 2.0

> M A N A G E M E N T ’ S D I S C U S S I O N A N D A N A LY S I S O F
F I N A N C I A L C O N D I T I O N A N D R E S U LT S O F O P E R AT I O N S
30 Forward-Looking Statements31 Financial Highlights
Overview32 Performance vs. Target33 Financial Results33 Non-GAAP Measures33 Strong Shareholder Returns33 Impact of Foreign Currency Translation
Group Financial Performance34 Net Income34 Total Revenue34 Net Interest Income36 Other Income38 Non-Interest Expenses38 Taxes38 Non-Controlling Interest40 Credit Quality42 Fourth Quarter Results42 Summary of Quarterly Results
Group Financial Condition43 Assets and Liabilities44 Capital Management47 Off-Balance Sheet Arrangements48 Financial Instruments
Business Lines49 Overview50 Domestic Banking51 International Banking52 Scotia Capital53 Other
Risk Management54 Overview54 Credit Risk57 Market Risk60 Liquidity Risk62 Operational Risk63 Reputational Risk63 Environmental Risk
Controls and Accounting Policies64 Controls and Procedures64 Summary of Critical Accounting Estimates67 Change in Accounting Policies67 Related Party Transactions
Supplementary Data68 Credit Risk73 Capital74 Other Information76 11-Year Statistical Information
2004 Scot iabank Annual Report 29
> MANAGEMENT ’ S D I SCUSS ION & ANALYS I S
30 2004 Scot iabank Annual Report
Forward-Looking Statements
This document includes forward-looking statements which aremade pursuant to the “safe harbour” provisions of the UnitedStates Private Securities Litigation Reform Act of 1995. Thesestatements include comments with respect to our objectives,strategies, expected financial results (including those in thearea of risk management), and our outlook for our businessesand for the Canadian, U.S. and global economies. Forward-looking statements are typically identified by words or phrasessuch as “believe,” “expect,” “anticipate,” “intent,”“estimate,” “may increase,” “may fluctuate,” and similarexpressions of future or conditional verbs such as “will,”“should,” “would” and “could.”
By their very nature, forward-looking statements involvenumerous assumptions, inherent risks and uncertainties, bothgeneral and specific, and the risk that predictions and otherforward-looking statements will not prove to be accurate.The Bank cautions readers not to place undue reliance onthese statements, as a number of important factors couldcause actual results to differ materially from the estimatesand intentions expressed in such forward-looking statements.These factors include, but are not limited to, the economicand financial conditions in Canada and globally; fluctuationsin interest rates and currency values; liquidity; the effect ofchanges in monetary policy; legislative and regulatory develop-ments in Canada and elsewhere; the accuracy and complete-ness of information the Bank receives on customers andcounterparties; the timely development and introduction ofnew products and services; the Bank’s ability to complete andintegrate acquisitions; the Bank’s ability to attract and retainkey executives; reliance on third parties to provide compo-
nents of the Bank’s business infrastructure; unexpectedchanges in consumer spending and saving habits; technologi-cal developments; consolidation in the Canadian financialservices sector; changes in tax laws; competition; judicial andregulatory proceedings; acts of God, such as earthquakes; thepossible impact of international conflicts and other develop-ments, including terrorist acts and war on terrorism; and theBank’s anticipation of and success in managing the risksimplied by the foregoing. A substantial amount of the Bank’sbusiness involves making loans or otherwise committingresources to specific companies, industries or countries.Unforeseen events affecting such borrowers, industries orcountries could have a material adverse effect on the Bank’sfinancial results, businesses, financial condition or liquidity.These and other factors may cause the Bank’s actual perform-ance to differ materially from that contemplated by forward-looking statements.
The Bank cautions that the foregoing list of importantfactors is not exhaustive. When relying on forward-lookingstatements to make decisions with respect to the Bank and itssecurities, investors and others should carefully consider theforegoing factors, other uncertainties and potential events.The Bank does not undertake to update any forward-lookingstatements, whether written or oral, that may be made fromtime to time by or on behalf of the Bank.
Additional information relating to the Bank, includingthe Bank’s Annual Information Form, can be located on theSEDAR website at www.sedar.com, and on the EDGAR sectionof the SEC’s website at www.sec.gov.
[December 17, 2004]
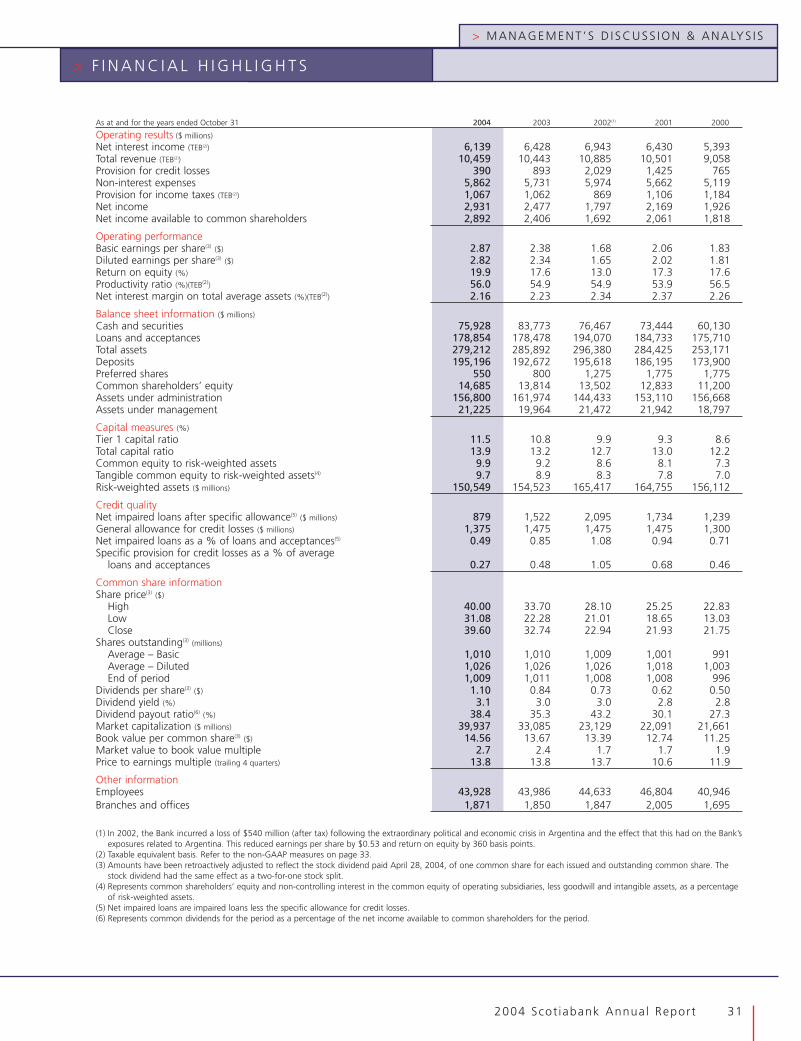
2004 Scot iabank Annual Report 31
> MANAGEMENT ’ S D I SCUSS ION & ANALYS I S
As at and for the years ended October 31 2004 2003 2002(1) 2001 2000
Operating results ($ millions)
Net interest income (TEB(2)) 6,139 6,428 6,943 6,430 5,393Total revenue (TEB(2)) 10,459 10,443 10,885 10,501 9,058Provision for credit losses 390 893 2,029 1,425 765Non-interest expenses 5,862 5,731 5,974 5,662 5,119Provision for income taxes (TEB(2)) 1,067 1,062 869 1,106 1,184Net income 2,931 2,477 1,797 2,169 1,926Net income available to common shareholders 2,892 2,406 1,692 2,061 1,818
Operating performanceBasic earnings per share(3) ($) 2.87 2.38 1.68 2.06 1.83Diluted earnings per share(3) ($) 2.82 2.34 1.65 2.02 1.81Return on equity (%) 19.9 17.6 13.0 17.3 17.6Productivity ratio (%)(TEB(2)) 56.0 54.9 54.9 53.9 56.5Net interest margin on total average assets (%)(TEB(2)) 2.16 2.23 2.34 2.37 2.26
Balance sheet information ($ millions)
Cash and securities 75,928 83,773 76,467 73,444 60,130Loans and acceptances 178,854 178,478 194,070 184,733 175,710Total assets 279,212 285,892 296,380 284,425 253,171Deposits 195,196 192,672 195,618 186,195 173,900Preferred shares 550 800 1,275 1,775 1,775Common shareholders’ equity 14,685 13,814 13,502 12,833 11,200Assets under administration 156,800 161,974 144,433 153,110 156,668Assets under management 21,225 19,964 21,472 21,942 18,797
Capital measures (%)
Tier 1 capital ratio 11.5 10.8 9.9 9.3 8.6Total capital ratio 13.9 13.2 12.7 13.0 12.2Common equity to risk-weighted assets 9.9 9.2 8.6 8.1 7.3Tangible common equity to risk-weighted assets(4) 9.7 8.9 8.3 7.8 7.0Risk-weighted assets ($ millions) 150,549 154,523 165,417 164,755 156,112
Credit qualityNet impaired loans after specific allowance(5) ($ millions) 879 1,522 2,095 1,734 1,239General allowance for credit losses ($ millions) 1,375 1,475 1,475 1,475 1,300Net impaired loans as a % of loans and acceptances(5) 0.49 0.85 1.08 0.94 0.71Specific provision for credit losses as a % of average
loans and acceptances 0.27 0.48 1.05 0.68 0.46
Common share informationShare price(3) ($)
High 40.00 33.70 28.10 25.25 22.83Low 31.08 22.28 21.01 18.65 13.03Close 39.60 32.74 22.94 21.93 21.75
Shares outstanding(3) (millions)
Average – Basic 1,010 1,010 1,009 1,001 991Average – Diluted 1,026 1,026 1,026 1,018 1,003End of period 1,009 1,011 1,008 1,008 996
Dividends per share(3) ($) 1.10 0.84 0.73 0.62 0.50Dividend yield (%) 3.1 3.0 3.0 2.8 2.8Dividend payout ratio(6) (%) 38.4 35.3 43.2 30.1 27.3Market capitalization ($ millions) 39,937 33,085 23,129 22,091 21,661Book value per common share(3) ($) 14.56 13.67 13.39 12.74 11.25Market value to book value multiple 2.7 2.4 1.7 1.7 1.9Price to earnings multiple (trailing 4 quarters) 13.8 13.8 13.7 10.6 11.9
Other informationEmployees 43,928 43,986 44,633 46,804 40,946Branches and offices 1,871 1,850 1,847 2,005 1,695
(1) In 2002, the Bank incurred a loss of $540 million (after tax) following the extraordinary political and economic crisis in Argentina and the effect that this had on the Bank’sexposures related to Argentina. This reduced earnings per share by $0.53 and return on equity by 360 basis points.
(2) Taxable equivalent basis. Refer to the non-GAAP measures on page 33.(3) Amounts have been retroactively adjusted to reflect the stock dividend paid April 28, 2004, of one common share for each issued and outstanding common share. The
stock dividend had the same effect as a two-for-one stock split.(4) Represents common shareholders’ equity and non-controlling interest in the common equity of operating subsidiaries, less goodwill and intangible assets, as a percentage
of risk-weighted assets.(5) Net impaired loans are impaired loans less the specific allowance for credit losses.(6) Represents common dividends for the period as a percentage of the net income available to common shareholders for the period.
> F I N A N C I A L H I G H L I G H T S
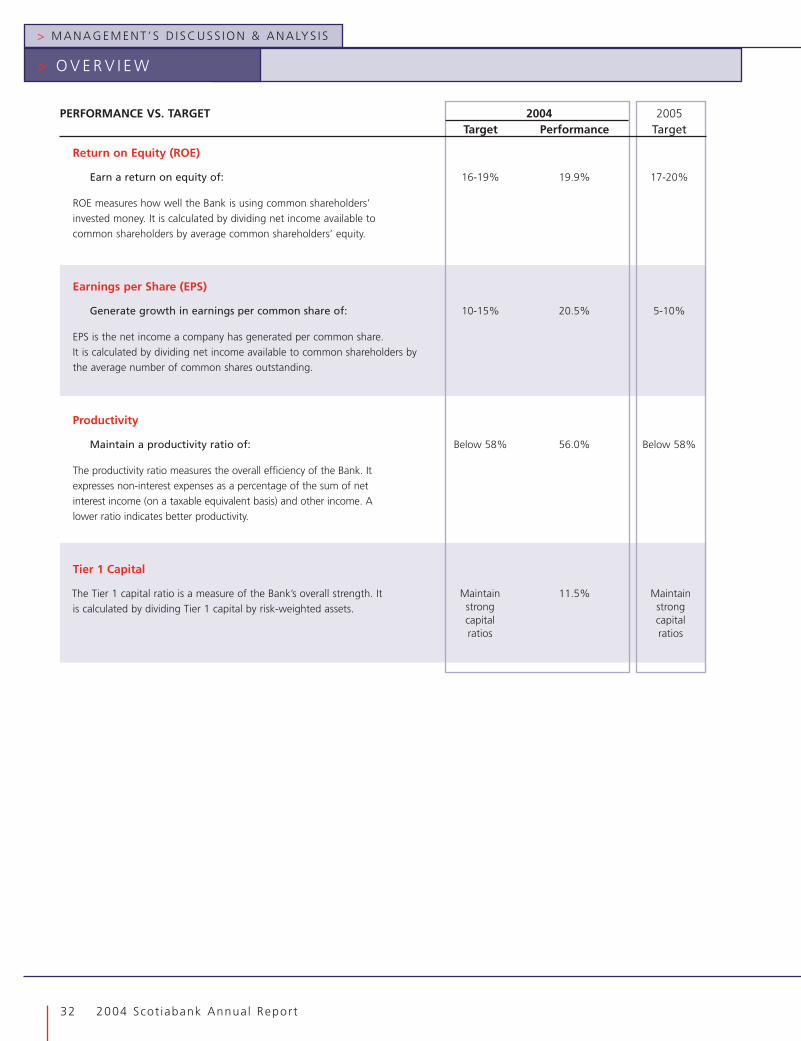
PERFORMANCE VS. TARGET 2004 2005Target Performance Target
Return on Equity (ROE)
Earn a return on equity of: 16-19% 19.9% 17-20%
ROE measures how well the Bank is using common shareholders’invested money. It is calculated by dividing net income available tocommon shareholders by average common shareholders’ equity.
Earnings per Share (EPS)
Generate growth in earnings per common share of: 10-15% 20.5% 5-10%
EPS is the net income a company has generated per common share.It is calculated by dividing net income available to common shareholders bythe average number of common shares outstanding.
Productivity
Maintain a productivity ratio of: Below 58% 56.0% Below 58%
The productivity ratio measures the overall efficiency of the Bank. Itexpresses non-interest expenses as a percentage of the sum of netinterest income (on a taxable equivalent basis) and other income. Alower ratio indicates better productivity.
Tier 1 Capital
The Tier 1 capital ratio is a measure of the Bank’s overall strength. It 11.5%is calculated by dividing Tier 1 capital by risk-weighted assets.
> MANAGEMENT ’ S D I SCUSS ION & ANALYS I S
32 2004 Scot iabank Annual Report
> O V E R V I E W
Maintainstrongcapitalratios
Maintainstrongcapitalratios
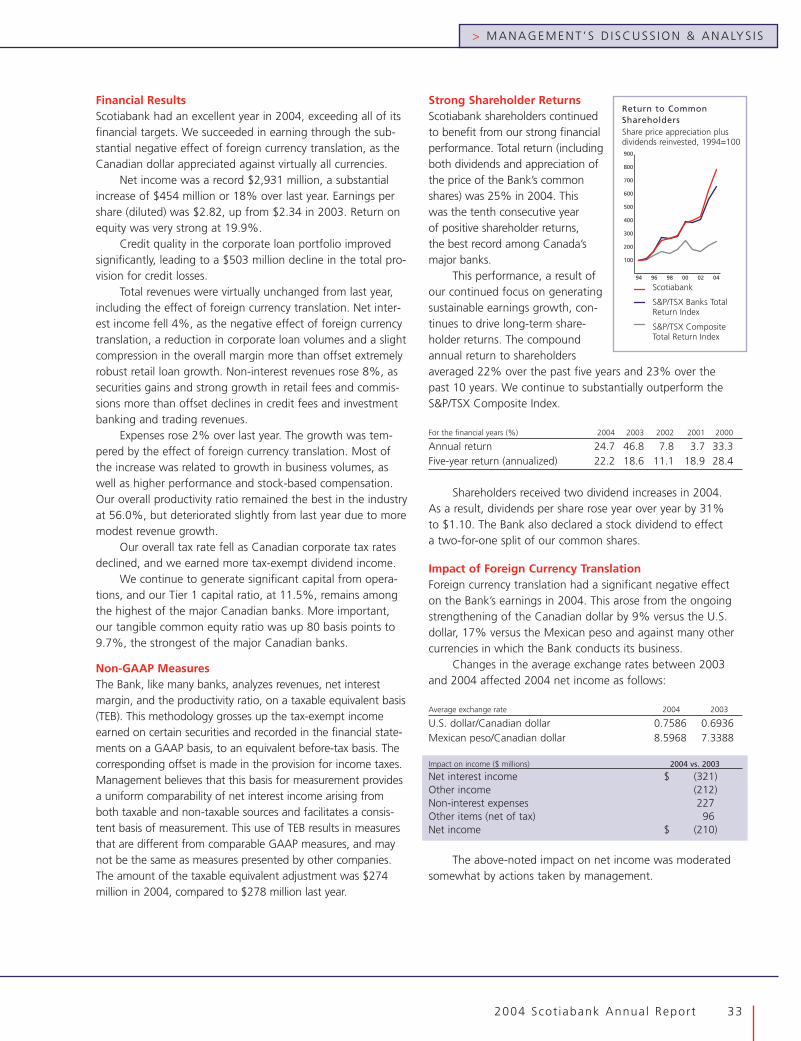
2004 Scot iabank Annual Report 33
> MANAGEMENT ’ S D I SCUSS ION & ANALYS I S
Financial ResultsScotiabank had an excellent year in 2004, exceeding all of itsfinancial targets. We succeeded in earning through the sub-stantial negative effect of foreign currency translation, as theCanadian dollar appreciated against virtually all currencies.
Net income was a record $2,931 million, a substantialincrease of $454 million or 18% over last year. Earnings pershare (diluted) was $2.82, up from $2.34 in 2003. Return onequity was very strong at 19.9%.
Credit quality in the corporate loan portfolio improvedsignificantly, leading to a $503 million decline in the total pro-vision for credit losses.
Total revenues were virtually unchanged from last year,including the effect of foreign currency translation. Net inter-est income fell 4%, as the negative effect of foreign currencytranslation, a reduction in corporate loan volumes and a slightcompression in the overall margin more than offset extremelyrobust retail loan growth. Non-interest revenues rose 8%, assecurities gains and strong growth in retail fees and commis-sions more than offset declines in credit fees and investmentbanking and trading revenues.
Expenses rose 2% over last year. The growth was tem-pered by the effect of foreign currency translation. Most ofthe increase was related to growth in business volumes, aswell as higher performance and stock-based compensation.Our overall productivity ratio remained the best in the industryat 56.0%, but deteriorated slightly from last year due to moremodest revenue growth.
Our overall tax rate fell as Canadian corporate tax ratesdeclined, and we earned more tax-exempt dividend income.
We continue to generate significant capital from opera-tions, and our Tier 1 capital ratio, at 11.5%, remains amongthe highest of the major Canadian banks. More important,our tangible common equity ratio was up 80 basis points to9.7%, the strongest of the major Canadian banks.
Non-GAAP MeasuresThe Bank, like many banks, analyzes revenues, net interestmargin, and the productivity ratio, on a taxable equivalent basis(TEB). This methodology grosses up the tax-exempt incomeearned on certain securities and recorded in the financial state-ments on a GAAP basis, to an equivalent before-tax basis. Thecorresponding offset is made in the provision for income taxes.Management believes that this basis for measurement providesa uniform comparability of net interest income arising fromboth taxable and non-taxable sources and facilitates a consis-tent basis of measurement. This use of TEB results in measuresthat are different from comparable GAAP measures, and maynot be the same as measures presented by other companies.The amount of the taxable equivalent adjustment was $274million in 2004, compared to $278 million last year.
Strong Shareholder ReturnsScotiabank shareholders continuedto benefit from our strong financialperformance. Total return (includingboth dividends and appreciation ofthe price of the Bank’s commonshares) was 25% in 2004. Thiswas the tenth consecutive yearof positive shareholder returns,the best record among Canada’smajor banks.
This performance, a result ofour continued focus on generatingsustainable earnings growth, con-tinues to drive long-term share-holder returns. The compoundannual return to shareholdersaveraged 22% over the past five years and 23% over thepast 10 years. We continue to substantially outperform theS&P/TSX Composite Index.
For the financial years (%) 2004 2003 2002 2001 2000
Annual return 24.7 46.8 7.8 3.7 33.3Five-year return (annualized) 22.2 18.6 11.1 18.9 28.4
Shareholders received two dividend increases in 2004.As a result, dividends per share rose year over year by 31%to $1.10. The Bank also declared a stock dividend to effecta two-for-one split of our common shares.
Impact of Foreign Currency TranslationForeign currency translation had a significant negative effecton the Bank’s earnings in 2004. This arose from the ongoingstrengthening of the Canadian dollar by 9% versus the U.S.dollar, 17% versus the Mexican peso and against many othercurrencies in which the Bank conducts its business.
Changes in the average exchange rates between 2003and 2004 affected 2004 net income as follows:
Average exchange rate 2004 2003
U.S. dollar/Canadian dollar 0.7586 0.6936Mexican peso/Canadian dollar 8.5968 7.3388
Impact on income ($ millions) 2004 vs. 2003
Net interest income $ (321)Other income (212)Non-interest expenses 227Other items (net of tax) 96Net income $ (210)
The above-noted impact on net income was moderatedsomewhat by actions taken by management.
100
200
300
400
500
600
700
800
900
94 96 98 00 02 04
Scotiabank
S&P/TSX Banks TotalReturn Index
S&P/TSX CompositeTotal Return Index
Return to CommonShareholdersShare price appreciation plusdividends reinvested, 1994=100
Net IncomeScotiabank had another record year in 2004, with net incomeof $2,931 million, a substantial increase of $454 million or18% over 2003. The increase was driven by significantly lowercredit losses and higher securities gains, as well as businessgrowth in several areas. These were partly offset by a nar-rower margin, declining volumes in corporate lending and thenegative impact of foreign currency translation as noted onthe previous page.
Total RevenueTotal revenues (on a taxable equivalent basis) were $10,459million in 2004, which was up marginally from the prior year.Contributing to the growth were higher results in the Bank’sdomestic operations as well as an increase in securities gains,along with higher local currency results in InternationalBanking, particularly in Mexico and several countries in theCaribbean. These were offset by the negative effect of foreigncurrency translation, lower corporate loan balances and creditfees and a decline in the net interest margin. Overall, totalunderlying revenue in the Bank grew by 5%. There was also anegative impact from the implementation this year of the newaccounting standard for hedging relationships (AcG 13).Under this standard, derivatives that do not meet specificcriteria for designation as hedges are marked to market, andgains or losses are taken into income in the current year.
Net Interest IncomeNet interest income (on a taxable equivalent basis) was$6,139 million in 2004, down $289 million from last year,due primarily to the effect of foreign currency translation.Underlying net interest income rose by $32 million.
The Bank’s net interest margin (net interest income as apercentage of average assets) was 2.16% in 2004, a decreaseof seven basis points from the previous year. This was largelydue to a decline in the Canadian currency margin.
Canadian currency net interest income was $3,684million in 2004, a decrease of $36 million from the prior year.The effect of an 8% increase in average assets was more
than offset by a compression in the net interest margin.The narrower margin was largely the result of low interestrates during the year and competitive pressures, particularlyin retail mortgages.
Foreign currency net interest income was $2,455 millionthis year, $253 million below 2003, due entirely to the effectof foreign currency translation. Local currency net interestincome rose by $68 million or 3%, largely from strong growthin International Banking, particularly the Caribbean and Scotia-bank Inverlat in Mexico. This was partly offset by a decline innet interest income from the Bank’s corporate business in theU.S. and Europe, where asset levels continued to fall.
OutlookCanadian currency net interest income is expected to increasenext year, mainly from asset growth. On the foreign currencyside, it is expected that the stronger Canadian dollar willcontinue to have a negative foreign currency translationimpact. However, underlying local currency growth is expectedin most of the Bank’s international operations, and in ScotiaCapital’s U.S. operations.
> MANAGEMENT ’ S D I SCUSS ION & ANALYS I S
34 2004 Scot iabank Annual Report
> G R O U P F I N A N C I A L P E R F O R M A N C E
4.5
5.0
5.5
6.0
6.5
7.0
00 01 02 0403
1
2
3
4
5
6
7
02 040300 01
Net interest incometaxable equivalent basis$ billions
Net interest income bycurrencytaxable equivalent basis$ billions
Foreign currency
Canadian currency
2004 Scot iabank Annual Report 35
> MANAGEMENT ’ S D I SCUSS ION & ANALYS I S
Table 2 Volume/rate analysis of changes in net interest income
2004 versus 2003 2003 versus 2002Increase (decrease) due to change in: Increase (decrease) due to change in:
Taxable equivalent basis(1) Average Average Net Average Average NetFor the fiscal years ($ millions) volume rate change volume rate change
Net interest incomeAssets $ (212) $ (861) $ (1,073) $ (411) $ (701) $ (1,112)Liabilities and shareholders’ equity 111 673 784 216 381 597Total $ (101) $ (188) $ (289) $ (195) $ (320) $ (515)
(1) Refer to the non-GAAP measures on page 33.
Table 1 Average balance sheet and interest margin(1)
2004 2003Taxable equivalent basis(2) Average Average Average AverageFor the fiscal years ($ billions) balance rate balance rate
AssetsDeposits with banks $ 16.8 2.62% $ 16.2 2.72%Securities 63.4 4.63 58.3 5.38Loans:
Residential mortgages 64.5 5.39 57.9 5.93Personal and credit cards 28.0 7.38 24.5 8.09Business and governments 57.9 5.07 67.3 5.44Securities purchased under resale agreements 20.2 2.94 27.8 3.13
170.6 5.32 177.5 5.60Total earning assets 250.8 4.96 252.0 5.37Customers’ liability under acceptances 7.1 – 8.0 –Other assets 26.1 – 28.5 –Total assets $ 284.0 4.38% $ 288.5 4.69%
Liabilities and shareholders’ equityDeposits:
Personal $ 78.0 2.66% $ 75.9 2.93%Business and governments 94.5 2.46 89.3 2.88Banks 23.7 1.65 25.2 1.70
196.2 2.44 190.4 2.74Obligations related to securities sold under repurchase agreements 23.4 3.27 30.8 3.54Subordinated debentures 2.7 4.20 3.2 4.35Other interest-bearing liabilities 14.6 4.43 15.5 4.17Total interest-bearing liabilities 236.9 2.66 239.9 2.96Other liabilities including acceptances 32.0 – 33.9 –Shareholders’ equity 15.1 – 14.7 –Total liabilities and equity $ 284.0 2.22% $ 288.5 2.46%Net interest margin 2.16% 2.23%
(1) Average of daily balances.(2) Refer to the non-GAAP measures on page 33.
Other IncomeOther income was $4,320 million in 2004, an increase of $305million or 8% from 2003, despite a reduction of $212 millionfrom foreign currency translation. The underlying year-over-yearincrease in other income was substantially higher at 13%.
Card revenues of $231 million rose by 13% in 2004.Excluding the 2004 reclassification of ScotiaGold benefits tooperating expenses, the sale of Inverlat’s point of sale businessand the effect of foreign currency translation, card revenuesincreased by 21%. This reflected the maturity of certain creditcard securitizations, growth in transaction volumes and expan-sion of the commercial card program.
Revenues from deposit and payment services, which rep-resent revenues earned from retail, commercial and corporatecustomers, were $53 million or 9% higher than 2003. Thisgrowth arose from pricing changes, volume growth and newinitiatives, such as the ABM alliance with Shell Canada. Partlymitigating this growth was the effect of foreign currencytranslation on revenues in International Banking.
Mutual fund fees increased by $10 million or 6% in 2004,in line with the growth in our mutual fund assets in Canada.
Revenues from investment management, brokerage andtrust services were $504 million, an increase of $49 million or11% from last year. This was entirely from higher commissionsin both full-service retail brokerage and direct investing, as animprovement in equity markets resulted in higher clienttrading activity, particularly in the first half of the year.
Credit fees declined by $101 million or 15% to $583million in 2004. About one quarter of the decrease was dueto the effect of foreign currency translation on U.S. dollarfees. The balance of the decline was a result of lower loanutilization, reflecting weak market demand for corporateloans, particularly in the U.S. and Europe.
Trading revenues of $476 million were $25 million belowlast year, largely from the negative effect of foreign currencytranslation. Record results were achieved in precious metalsand foreign exchange trading, while revenues declined in fixedincome, reflecting challenging bond market conditions.
Investment banking revenues were $648 million in 2004,a decrease of $25 million from last year. Underwriting rev-enues were slightly lower than last year’s record results, asmarkets for new issues remained buoyant, and institutionalbrokerage commissions rose 13%. As well, option premiums,which were reported in investment banking in 2003, arereported in net gain on investment securities in 2004.
Net gain on the sale of investment securities increased asubstantial $318 million to $477 million in 2004, primarilyfrom higher gains on the sale of equities and strong returnson private equity fund investments. Equity gains included a$125 million pre-tax gain on the sale of one-third of theBank’s investment holding in Shinsei Bank in Japan.
Securitization revenues fell by $29 million during the year,largely from the maturity of certain credit card, mortgage andrevolving credit securitizations. The decline in this categorywas offset by increases in other fee-based revenues and netinterest income. Miscellaneous revenues reported in “other”were up modestly from 2003.
OutlookWe expect growth in most revenue categories in 2005, exceptin gains on investment securities, where the exceptionalrevenues earned in 2004 are not expected to be repeated.As well, the ongoing appreciation of the Canadian dollar isanticipated to continue to mitigate year-over-year growth.
> MANAGEMENT ’ S D I SCUSS ION & ANALYS I S
36 2004 Scot iabank Annual Report
2.5
3.0
3.5
4.0
4.5
00 01 02 03 04
Other incomeexcluding sales ofbusinesses, $ billions
excluding chargesfor Argentina
Many sources of otherincome
Deposit & payment services
Investment banking
Credit fees
Investment, brokerage &trust services
Gains on sale of investmentsecurities
Trading revenues
Other
Card revenues
Mutual funds
Securitization
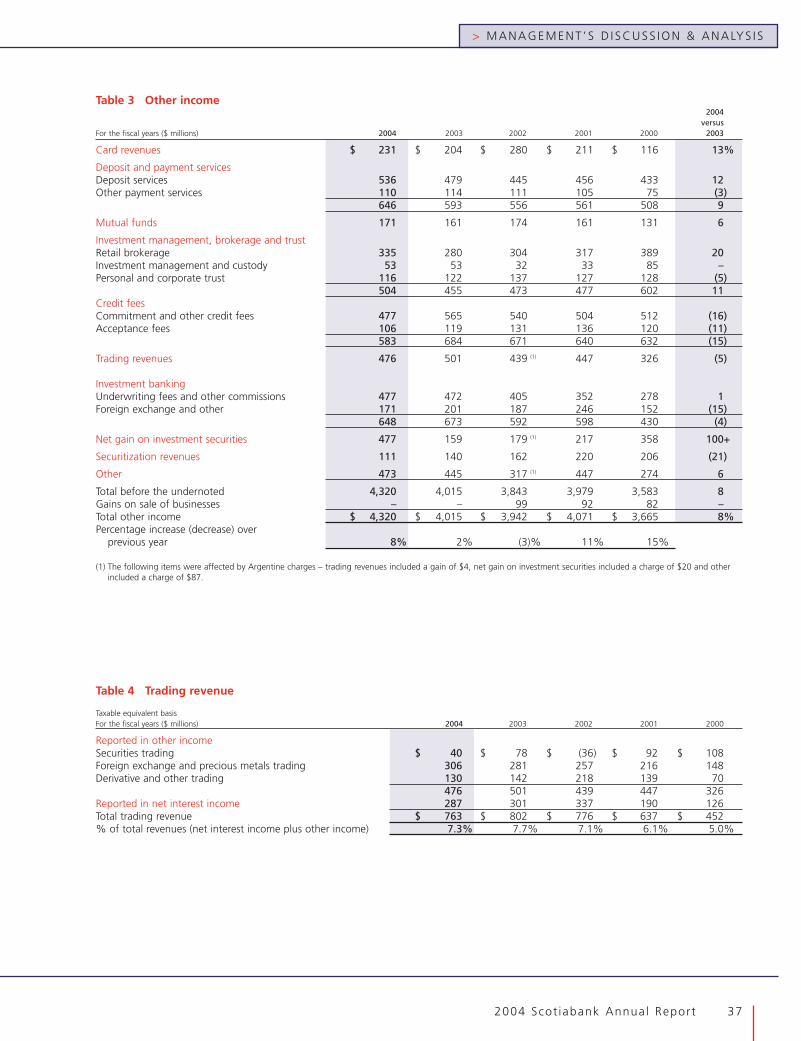
2004 Scot iabank Annual Report 37
> MANAGEMENT ’ S D I SCUSS ION & ANALYS I S
Table 3 Other income2004
versusFor the fiscal years ($ millions) 2004 2003 2002 2001 2000 2003
Card revenues $ 231 $ 204 $ 280 $ 211 $ 116 13%
Deposit and payment servicesDeposit services 536 479 445 456 433 12Other payment services 110 114 111 105 75 (3)
646 593 556 561 508 9
Mutual funds 171 161 174 161 131 6
Investment management, brokerage and trustRetail brokerage 335 280 304 317 389 20Investment management and custody 53 53 32 33 85 –Personal and corporate trust 116 122 137 127 128 (5)
504 455 473 477 602 11Credit feesCommitment and other credit fees 477 565 540 504 512 (16)Acceptance fees 106 119 131 136 120 (11)
583 684 671 640 632 (15)
Trading revenues 476 501 439 (1) 447 326 (5)
Investment bankingUnderwriting fees and other commissions 477 472 405 352 278 1Foreign exchange and other 171 201 187 246 152 (15)
648 673 592 598 430 (4)
Net gain on investment securities 477 159 179 (1) 217 358 100+
Securitization revenues 111 140 162 220 206 (21)
Other 473 445 317 (1) 447 274 6
Total before the undernoted 4,320 4,015 3,843 3,979 3,583 8Gains on sale of businesses – – 99 92 82 –Total other income $ 4,320 $ 4,015 $ 3,942 $ 4,071 $ 3,665 8%Percentage increase (decrease) over
previous year 8% 2% (3)% 11% 15%
(1) The following items were affected by Argentine charges – trading revenues included a gain of $4, net gain on investment securities included a charge of $20 and otherincluded a charge of $87.
Table 4 Trading revenue
Taxable equivalent basisFor the fiscal years ($ millions) 2004 2003 2002 2001 2000
Reported in other incomeSecurities trading $ 40 $ 78 $ (36) $ 92 $ 108Foreign exchange and precious metals trading 306 281 257 216 148Derivative and other trading 130 142 218 139 70
476 501 439 447 326Reported in net interest income 287 301 337 190 126Total trading revenue $ 763 $ 802 $ 776 $ 637 $ 452% of total revenues (net interest income plus other income) 7.3% 7.7% 7.1% 6.1% 5.0%
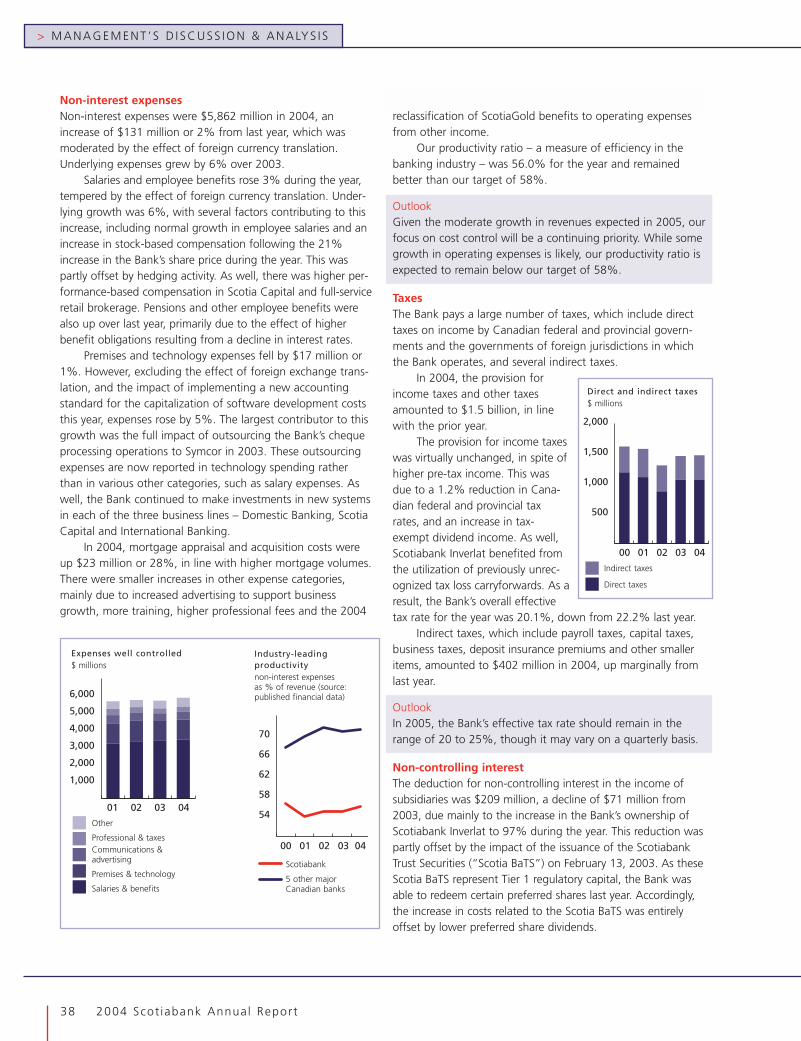
Non-interest expensesNon-interest expenses were $5,862 million in 2004, anincrease of $131 million or 2% from last year, which wasmoderated by the effect of foreign currency translation.Underlying expenses grew by 6% over 2003.
Salaries and employee benefits rose 3% during the year,tempered by the effect of foreign currency translation. Under-lying growth was 6%, with several factors contributing to thisincrease, including normal growth in employee salaries and anincrease in stock-based compensation following the 21%increase in the Bank’s share price during the year. This waspartly offset by hedging activity. As well, there was higher per-formance-based compensation in Scotia Capital and full-serviceretail brokerage. Pensions and other employee benefits werealso up over last year, primarily due to the effect of higherbenefit obligations resulting from a decline in interest rates.
Premises and technology expenses fell by $17 million or1%. However, excluding the effect of foreign exchange trans-lation, and the impact of implementing a new accountingstandard for the capitalization of software development coststhis year, expenses rose by 5%. The largest contributor to thisgrowth was the full impact of outsourcing the Bank’s chequeprocessing operations to Symcor in 2003. These outsourcingexpenses are now reported in technology spending ratherthan in various other categories, such as salary expenses. Aswell, the Bank continued to make investments in new systemsin each of the three business lines – Domestic Banking, ScotiaCapital and International Banking.
In 2004, mortgage appraisal and acquisition costs wereup $23 million or 28%, in line with higher mortgage volumes.There were smaller increases in other expense categories,mainly due to increased advertising to support businessgrowth, more training, higher professional fees and the 2004
reclassification of ScotiaGold benefits to operating expensesfrom other income.
Our productivity ratio – a measure of efficiency in thebanking industry – was 56.0% for the year and remainedbetter than our target of 58%.
OutlookGiven the moderate growth in revenues expected in 2005, ourfocus on cost control will be a continuing priority. While somegrowth in operating expenses is likely, our productivity ratio isexpected to remain below our target of 58%.
TaxesThe Bank pays a large number of taxes, which include directtaxes on income by Canadian federal and provincial govern-ments and the governments of foreign jurisdictions in whichthe Bank operates, and several indirect taxes.
In 2004, the provision forincome taxes and other taxesamounted to $1.5 billion, in linewith the prior year.
The provision for income taxeswas virtually unchanged, in spite ofhigher pre-tax income. This wasdue to a 1.2% reduction in Cana-dian federal and provincial taxrates, and an increase in tax-exempt dividend income. As well,Scotiabank Inverlat benefited fromthe utilization of previously unrec-ognized tax loss carryforwards. As aresult, the Bank’s overall effectivetax rate for the year was 20.1%, down from 22.2% last year.
Indirect taxes, which include payroll taxes, capital taxes,business taxes, deposit insurance premiums and other smalleritems, amounted to $402 million in 2004, up marginally fromlast year.
OutlookIn 2005, the Bank’s effective tax rate should remain in therange of 20 to 25%, though it may vary on a quarterly basis.
Non-controlling interestThe deduction for non-controlling interest in the income ofsubsidiaries was $209 million, a decline of $71 million from2003, due mainly to the increase in the Bank’s ownership ofScotiabank Inverlat to 97% during the year. This reduction waspartly offset by the impact of the issuance of the ScotiabankTrust Securities (“Scotia BaTS”) on February 13, 2003. As theseScotia BaTS represent Tier 1 regulatory capital, the Bank wasable to redeem certain preferred shares last year. Accordingly,the increase in costs related to the Scotia BaTS was entirelyoffset by lower preferred share dividends.
> MANAGEMENT ’ S D I SCUSS ION & ANALYS I S
38 2004 Scot iabank Annual Report
500
1,000
1,500
2,000
03 040100 02
Indirect taxes
Direct taxes
Direct and indirect taxes$ millions
1,000
2,000
3,000
4,000
5,000
6,000
03 0401 02
Expenses well controlled$ millions
Other
Professional & taxesCommunications &advertising
Premises & technology
Salaries & benefits
54
58
62
66
70
00 01 02 03 04
Industry-leadingproductivitynon-interest expensesas % of revenue (source:published financial data)
Scotiabank
5 other majorCanadian banks
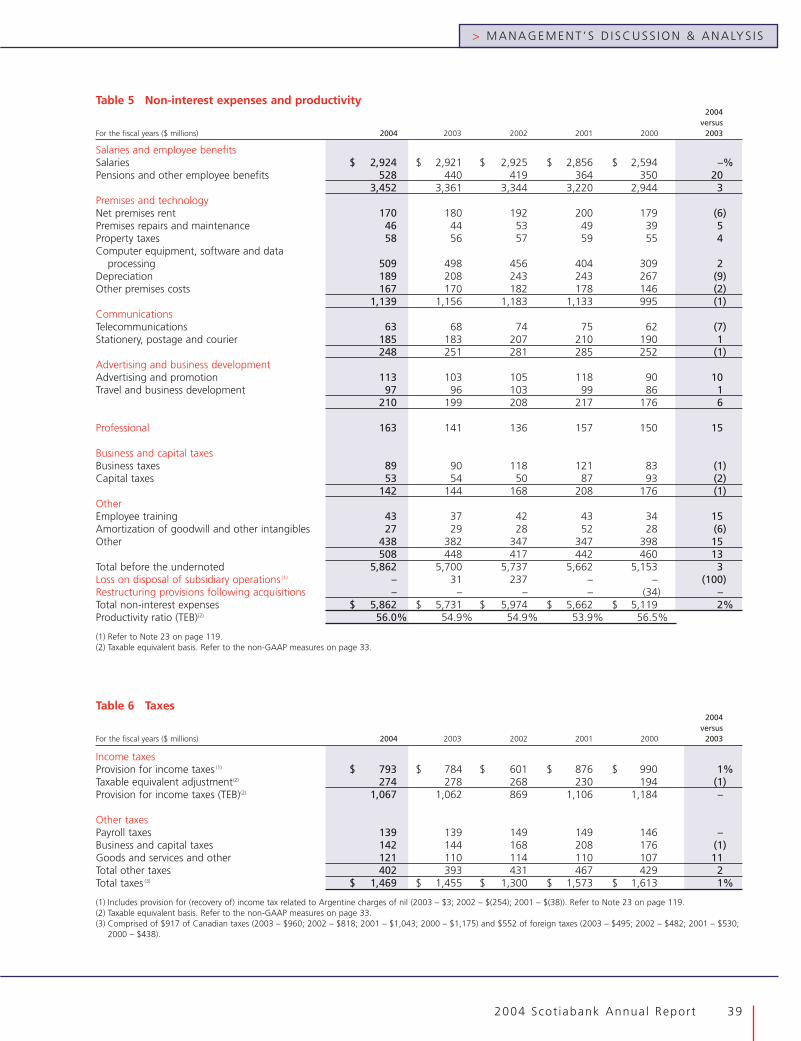
2004 Scot iabank Annual Report 39
> MANAGEMENT ’ S D I SCUSS ION & ANALYS I S
Table 6 Taxes2004
versusFor the fiscal years ($ millions) 2004 2003 2002 2001 2000 2003
Income taxesProvision for income taxes (1) $ 793 $ 784 $ 601 $ 876 $ 990 1%Taxable equivalent adjustment(2) 274 278 268 230 194 (1)Provision for income taxes (TEB)(2) 1,067 1,062 869 1,106 1,184 –
Other taxesPayroll taxes 139 139 149 149 146 –Business and capital taxes 142 144 168 208 176 (1)Goods and services and other 121 110 114 110 107 11Total other taxes 402 393 431 467 429 2Total taxes (3) $ 1,469 $ 1,455 $ 1,300 $ 1,573 $ 1,613 1%
(1) Includes provision for (recovery of) income tax related to Argentine charges of nil (2003 – $3; 2002 – $(254); 2001 – $(38)). Refer to Note 23 on page 119.(2) Taxable equivalent basis. Refer to the non-GAAP measures on page 33.(3) Comprised of $917 of Canadian taxes (2003 – $960; 2002 – $818; 2001 – $1,043; 2000 – $1,175) and $552 of foreign taxes (2003 – $495; 2002 – $482; 2001 – $530;
2000 – $438).
Table 5 Non-interest expenses and productivity2004
versusFor the fiscal years ($ millions) 2004 2003 2002 2001 2000 2003
Salaries and employee benefitsSalaries $ 2,924 $ 2,921 $ 2,925 $ 2,856 $ 2,594 –%Pensions and other employee benefits 528 440 419 364 350 20
3,452 3,361 3,344 3,220 2,944 3Premises and technologyNet premises rent 170 180 192 200 179 (6)Premises repairs and maintenance 46 44 53 49 39 5Property taxes 58 56 57 59 55 4Computer equipment, software and data
processing 509 498 456 404 309 2Depreciation 189 208 243 243 267 (9)Other premises costs 167 170 182 178 146 (2)
1,139 1,156 1,183 1,133 995 (1)CommunicationsTelecommunications 63 68 74 75 62 (7)Stationery, postage and courier 185 183 207 210 190 1
248 251 281 285 252 (1)Advertising and business developmentAdvertising and promotion 113 103 105 118 90 10Travel and business development 97 96 103 99 86 1
210 199 208 217 176 6
Professional 163 141 136 157 150 15
Business and capital taxesBusiness taxes 89 90 118 121 83 (1)Capital taxes 53 54 50 87 93 (2)
142 144 168 208 176 (1)OtherEmployee training 43 37 42 43 34 15Amortization of goodwill and other intangibles 27 29 28 52 28 (6)Other 438 382 347 347 398 15
508 448 417 442 460 13Total before the undernoted 5,862 5,700 5,737 5,662 5,153 3Loss on disposal of subsidiary operations (1) – 31 237 – – (100)Restructuring provisions following acquisitions – – – – (34) –Total non-interest expenses $ 5,862 $ 5,731 $ 5,974 $ 5,662 $ 5,119 2%Productivity ratio (TEB)(2) 56.0% 54.9% 54.9% 53.9% 56.5%
(1) Refer to Note 23 on page 119.(2) Taxable equivalent basis. Refer to the non-GAAP measures on page 33.
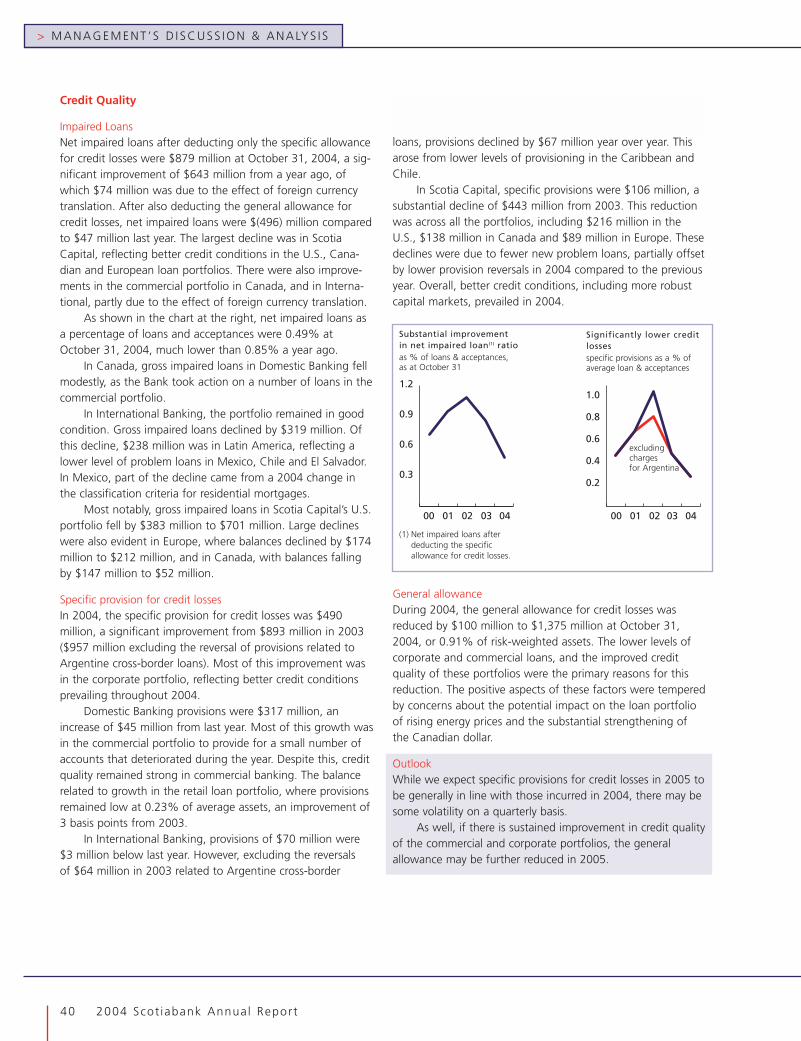
Credit Quality
Impaired LoansNet impaired loans after deducting only the specific allowancefor credit losses were $879 million at October 31, 2004, a sig-nificant improvement of $643 million from a year ago, ofwhich $74 million was due to the effect of foreign currencytranslation. After also deducting the general allowance forcredit losses, net impaired loans were $(496) million comparedto $47 million last year. The largest decline was in ScotiaCapital, reflecting better credit conditions in the U.S., Cana-dian and European loan portfolios. There were also improve-ments in the commercial portfolio in Canada, and in Interna-tional, partly due to the effect of foreign currency translation.
As shown in the chart at the right, net impaired loans asa percentage of loans and acceptances were 0.49% atOctober 31, 2004, much lower than 0.85% a year ago.
In Canada, gross impaired loans in Domestic Banking fellmodestly, as the Bank took action on a number of loans in thecommercial portfolio.
In International Banking, the portfolio remained in goodcondition. Gross impaired loans declined by $319 million. Ofthis decline, $238 million was in Latin America, reflecting alower level of problem loans in Mexico, Chile and El Salvador.In Mexico, part of the decline came from a 2004 change inthe classification criteria for residential mortgages.
Most notably, gross impaired loans in Scotia Capital’s U.S.portfolio fell by $383 million to $701 million. Large declineswere also evident in Europe, where balances declined by $174million to $212 million, and in Canada, with balances fallingby $147 million to $52 million.
Specific provision for credit lossesIn 2004, the specific provision for credit losses was $490million, a significant improvement from $893 million in 2003($957 million excluding the reversal of provisions related toArgentine cross-border loans). Most of this improvement wasin the corporate portfolio, reflecting better credit conditionsprevailing throughout 2004.
Domestic Banking provisions were $317 million, anincrease of $45 million from last year. Most of this growth wasin the commercial portfolio to provide for a small number ofaccounts that deteriorated during the year. Despite this, creditquality remained strong in commercial banking. The balancerelated to growth in the retail loan portfolio, where provisionsremained low at 0.23% of average assets, an improvement of3 basis points from 2003.
In International Banking, provisions of $70 million were$3 million below last year. However, excluding the reversalsof $64 million in 2003 related to Argentine cross-border
loans, provisions declined by $67 million year over year. Thisarose from lower levels of provisioning in the Caribbean andChile.
In Scotia Capital, specific provisions were $106 million, asubstantial decline of $443 million from 2003. This reductionwas across all the portfolios, including $216 million in theU.S., $138 million in Canada and $89 million in Europe. Thesedeclines were due to fewer new problem loans, partially offsetby lower provision reversals in 2004 compared to the previousyear. Overall, better credit conditions, including more robustcapital markets, prevailed in 2004.
General allowanceDuring 2004, the general allowance for credit losses wasreduced by $100 million to $1,375 million at October 31,2004, or 0.91% of risk-weighted assets. The lower levels ofcorporate and commercial loans, and the improved creditquality of these portfolios were the primary reasons for thisreduction. The positive aspects of these factors were temperedby concerns about the potential impact on the loan portfolioof rising energy prices and the substantial strengthening ofthe Canadian dollar.
OutlookWhile we expect specific provisions for credit losses in 2005 tobe generally in line with those incurred in 2004, there may besome volatility on a quarterly basis.
As well, if there is sustained improvement in credit qualityof the commercial and corporate portfolios, the generalallowance may be further reduced in 2005.
> MANAGEMENT ’ S D I SCUSS ION & ANALYS I S
40 2004 Scot iabank Annual Report
0.3
0.6
0.9
1.2
00 01 02 03 04
Substantial improvementin net impaired loan(1) ratioas % of loans & acceptances,as at October 31
(1) Net impaired loans afterdeducting the specificallowance for credit losses.
0.2
0.4
0.6
0.8
1.0
00 01 02 03 04
Significantly lower creditlossesspecific provisions as a % ofaverage loan & acceptances
excludingchargesfor Argentina

2004 Scot iabank Annual Report 41
> MANAGEMENT ’ S D I SCUSS ION & ANALYS I S
Table 7 Impaired loans by business line
2004Allowancefor credit Gross Impaired Loans
As at October 31 ($ millions) Net losses Gross 2003 2002 2001 2000
DomesticRetail $ 78 $ (189) $ 267 $ 292 $ 287 $ 258 $ 270Commercial 51 (119) 170 184 225 332 343
129 (308) 437 476 512 590 613International(1)
Latin America (21) (390) 369 607 995 1,587 432Caribbean 172 (120) 292 305 329 283 261Asia 49 (84) 133 142 164 302 341Europe 1 (3) 4 63 84 63 66
201 (597) 798 1,117 1,572 2,235 1,100Scotia CapitalCanada 15 (37) 52 199 127 203 111United States 442 (259) 701 1,084 1,688 1,280 865Other 92 (120) 212 386 113 156 76
549 (416) 965 1,669 1,928 1,639 1,052Gross impaired loans 2,200 3,262 4,012 4,464 2,765Allowance for credit losses
– specific and country risk(1) (1,321) (1,740) (1,917) (2,730) (1,526)$ 879 $ 1,522 $ 2,095 $ 1,734 $ 1,239
Allowance for credit losses –general (1,375) (1,375) (1,475) (1,475) (1,475) (1,300)
Net impaired loans after generalallowance $ (496) $ 47 $ 620 $ 259 $ (61)
Net impaired loans(2) as a % ofloans and acceptances 0.49% 0.85% 1.08% 0.94% 0.71%
Specific allowance(1) for credit lossesas a % of gross impaired loans 60% 53% 48% 61% 55%
(1) Prior years’ numbers include designated emerging market gross impaired loans and offsetting country risk allowance as follows: 2003 – $21; 2002 – $25; 2001 – $25;2000 – $24.
(2) Net impaired loans after deducting specific allowance for credit losses.
Table 8 Provisions for credit losses
For the fiscal years ($ millions) 2004 2003 2002 2001 2000
Specific provisions for credit lossesNet specific provisions $ 648 $ 1,057 $ 2,198 $ 1,373 $ 878Recoveries (158) (164) (169) (123) (113)Net specific provisions for credit losses 490 893(1) 2,029(1) 1,250 765General provision (100) – – 175 –Total net provisions for credit losses $ 390 $ 893 $ 2,029 $ 1,425 $ 765
(1) Excluding reversals of credit losses (2002 – provision for credit losses) related to Argentina, net specific provisions were: 2003 – $957; 2002 – $1,575.
Fourth Quarter ResultsNet income was $708 million in the fourth quarter, a $48million or 7% increase from the same quarter in 2003,although $25 million below the third quarter. Foreign currencytranslation reduced net income by $22 million compared tolast year, and $22 million versus last quarter. Underlying netincome increased $70 million over last year but was $3 millionbelow last quarter. The year-over-year increase was mainlydriven by a decline in credit losses, the Bank’s higher owner-ship of Scotiabank Inverlat, a lower effective tax rate and solidretail asset growth. Partly offsetting this increase were a com-pression in the margin and lower corporate lending volumes.
Total revenue (on a taxable equivalent basis) was $2,495million in the fourth quarter, $96 million below the samequarter last year due primarily to the effect of foreign currencytranslation. Underlying revenues fell $28 million year over year,largely because of a narrower interest margin and a negativeimpact from the implementation of the new accountingstandard for hedging relationships (AcG 13). Total revenuesdeclined $74 million quarter over quarter, due to lower gainson the sale of investment securities, the effect of foreigncurrency translation and the negative impact of AcG 13.
Non-interest expenses of $1,461 million in the fourthquarter were $33 million or 2% below the same quarter lastyear, due entirely to the effect of foreign currency translation.Underlying expenses were essentially unchanged year overyear. Lower severance and performance-based compensationwere offset by higher pension and other benefits, advertisingand professional expenses. Quarter over quarter, expenses fell$11 million, due to the effect of foreign currency translationand lower performance-based compensation.
The provision for credit losses was $40 million in the fourthquarter, comprised of specific provisions of $90 million and areduction of $50 million in the general allowance for creditlosses. The specific provisions of $90 million were a significantimprovement from $120 million a year ago, largely from lower
credit losses in all of the corporate lending portfolios. In ScotiaCapital, there was a $25 million net recovery, as previouslyestablished provisions were reversed due to higher realizationsthrough loan sales and loans returning to performing status,and there were low levels of new provisions. Compared to thethird quarter of 2004, specific provisions fell by $10 million.Each of the third and fourth quarters of 2004 included a reduc-tion of $50 million in the general allowance for credit losses,versus nil last year.
The Bank’s effective tax rate was 18.0% in the fourthquarter, a 210 basis point decline from the same quarter lastyear and 200 basis points below the previous quarter. This wasdue mainly to higher tax-exempt dividend income.
The deduction for the non-controlling interest in the Bank’snet income was $47 million for the fourth quarter, down $20million from the same quarter last year, and $3 million belowthe prior quarter. The year-over-year reduction was mainly dueto a lower non-controlling interest in Scotiabank Inverlat, as theBank increased its ownership to 97% this year.
Summary of Quarterly ResultsThe Bank’s results in each quarter of 2004 were above thosein the prior year. A major contributing factor was the steadydecline in credit losses following improvements in creditmarkets and the actions taken by the Bank. As well, gains oninvestment securities were fairly robust during this period butdid create some volatility. Other positive factors were solidretail asset growth in Canada and local currency asset growthin the Caribbean and Mexico.
On the negative side, earnings over the past eight quar-ters were affected by the continued appreciation of the Cana-dian dollar, the margin compression in Canada and the declinein corporate lending volumes, most notably in the U.S.
An eight-quarter trend in net income and other selectedinformation is provided on page 75.
> MANAGEMENT ’ S D I SCUSS ION & ANALYS I S
42 2004 Scot iabank Annual Report

2004 Scot iabank Annual Report 43
> MANAGEMENT ’ S D I SCUSS ION & ANALYS I S
Assets and LiabilitiesAssetsThe Bank’s total assets decreasedyear over year by $7 billion or 2%to $279 billion as at October 31,2004. The effect of foreign cur-rency translation resulted in areduction in assets of $8 billion.There was underlying asset growthof $1 billion, primarily in residentialmortgages and retail lending assets,partly offset by lower securities.
SECURIT IES
Securities declined by $4 billion,half of which was due to theeffect of foreign currency transla-tion. Investment securities declined$5 billion, as we realized gains on Canadian government secu-rities and sold part of our investment holding in Shinsei Bankin Japan. This was partly offset by growth in Scotiabank Inver-lat’s trading securities portfolio.
As at October 31, 2004, the surplus of the market valueover book value of the Bank’s investment securities was $1,048million, up $345 million from the prior year, due mainly to unre-alized gains on the Bank’s investment holding in Shinsei Bank.
LOANS
Loans were relatively unchanged year over year, due primarily tothe effect of foreign currency translation. Underlying loans roseby $4 billion or 2%, largely driven by record residential mortgagegrowth of $9 billion, after excluding net increases in loan secu-ritizations of $2 billion. The continued strong housing market,as well as the launch of innovative products, such as the RightRate Mortgage and the Long and Short blended mortgage,supported by excellent sales efforts across our branches andother distribution networks, were key drivers of this growth.
Other personal and credit cards loans (ScotiaLine andScotiaLine Visa) in Canada grew by $4 billion. The significantgrowth in these products resulted in domestic retail lendingmarket share increasing 32 basis points from the prior year – thebest year-over-year growth among the major Canadian banks.
In International Banking, there was solid underlyinggrowth in retail lending assets, particularly in Mexico andthe Caribbean, which was moderated by the effect of foreigncurrency translation.
Business lending fell $7 billion, due in part to the effect offoreign currency translation. As well, there was an underlyingdecline of $4 billion in the combined U.S. and European corpo-rate loan portfolio as a result of more selective lending andincreased liquidity in the capital markets.
LiabilitiesThe Bank’s total liabilities were $264 billion as at October 31,2004, compared to $271 billion last year. The foreign currencytranslation effect resulted in a reduction in liabilities of $8billion. The underlying liabilities were up $1 billion.
DEPOSITS
Deposits increased by $3 billion thisyear. This growth was dampenedby the effect of foreign currencytranslation. Underlying depositswere up $8 billion or 4%. Thisincluded growth of $4 billion ineach of personal and businessdeposits. The former was due tothe continued popularity of theMoney Master® High InterestSavings Account, and the introduc-tion of a registered version of thesame account.
Growth in the Canadian dollarbusiness and government deposits of $7 billion was driven byboth the new Money Master for businessTM account, andhigher current account deposits, where our market share con-tinued to rise.
Deposits by banks declined $1 billion, due entirely to theeffect of foreign currency translation. The underlying depositsincreased by $1 billion.
OBL IGATIONS RELATED TO REPURCHASE AGREEMENTS
Obligations related to repurchase agreements are anothersource of wholesale funding. The year-over-year decline of$9 billion was due in part to a change in the mix ofwholesale funding.
Shareholders’ EquityTotal shareholders’ equity rose by $621 million in 2004, fromstrong growth in retained earnings of $1.5 billion, partiallyoffset by the net effect of unrealized foreign currency transla-tion losses recorded in shareholders’ equity. See the CapitalManagement section on the following page for more detailon the capital components.
OutlookFor 2005, we are expecting asset growth in Canada tocontinue, primarily in residential mortgages, though not atthe same growth rates as 2004. Outside Canada, growth inlocal currency assets in most international operations, and arecovery in U.S. corporate lending, is expected to continueto be negatively affected by foreign currency translation.
50
100
150
03 0402
Loan portfolio is broadlydiversifiedloans & acceptances, $ billions
Securities purchased underresale agreements
Business and governments
Other personal loans
Residential mortgages
50
100
150
200
0402 03
Strong deposit base$ billions
Banks
Business & government
Personal
> G R O U P F I N A N C I A L C O N D I T I O N
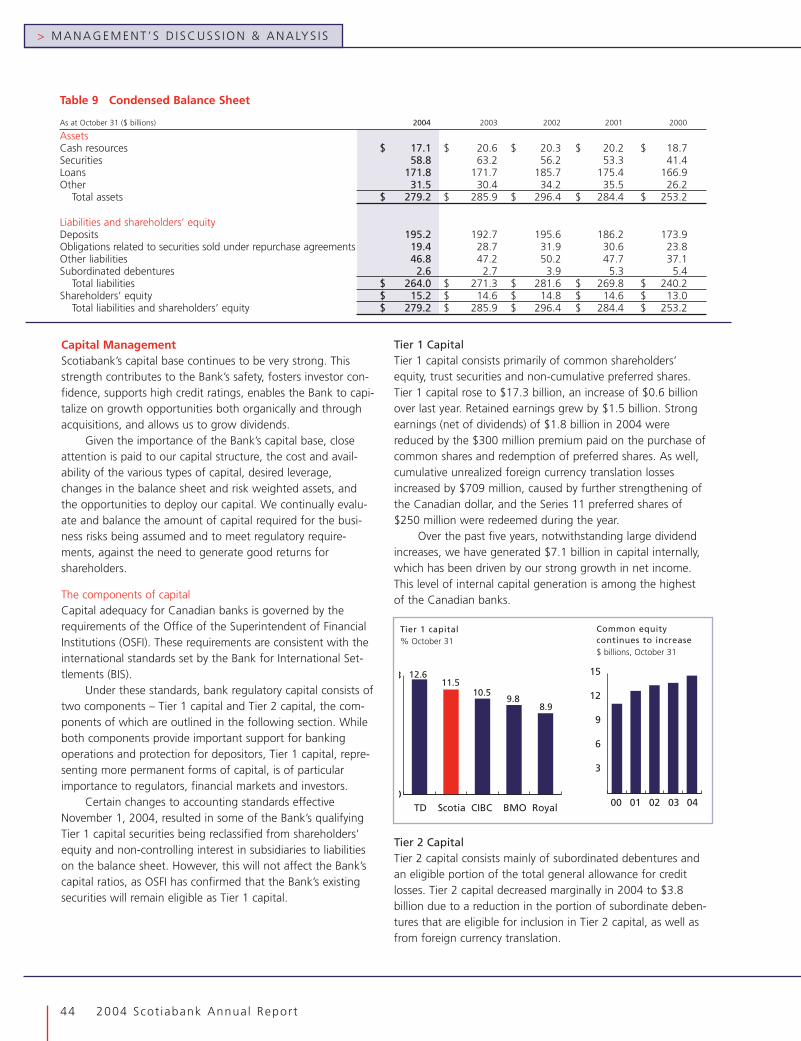
> MANAGEMENT ’ S D I SCUSS ION & ANALYS I S
44 2004 Scot iabank Annual Report
Table 9 Condensed Balance Sheet
As at October 31 ($ billions) 2004 2003 2002 2001 2000
AssetsCash resources $ 17.1 $ 20.6 $ 20.3 $ 20.2 $ 18.7Securities 58.8 63.2 56.2 53.3 41.4Loans 171.8 171.7 185.7 175.4 166.9Other 31.5 30.4 34.2 35.5 26.2
Total assets $ 279.2 $ 285.9 $ 296.4 $ 284.4 $ 253.2
Liabilities and shareholders’ equityDeposits 195.2 192.7 195.6 186.2 173.9Obligations related to securities sold under repurchase agreements 19.4 28.7 31.9 30.6 23.8Other liabilities 46.8 47.2 50.2 47.7 37.1Subordinated debentures 2.6 2.7 3.9 5.3 5.4
Total liabilities $ 264.0 $ 271.3 $ 281.6 $ 269.8 $ 240.2Shareholders’ equity $ 15.2 $ 14.6 $ 14.8 $ 14.6 $ 13.0
Total liabilities and shareholders’ equity $ 279.2 $ 285.9 $ 296.4 $ 284.4 $ 253.2
Capital ManagementScotiabank’s capital base continues to be very strong. Thisstrength contributes to the Bank’s safety, fosters investor con-fidence, supports high credit ratings, enables the Bank to capi-talize on growth opportunities both organically and throughacquisitions, and allows us to grow dividends.
Given the importance of the Bank’s capital base, closeattention is paid to our capital structure, the cost and avail-ability of the various types of capital, desired leverage,changes in the balance sheet and risk weighted assets, andthe opportunities to deploy our capital. We continually evalu-ate and balance the amount of capital required for the busi-ness risks being assumed and to meet regulatory require-ments, against the need to generate good returns forshareholders.
The components of capitalCapital adequacy for Canadian banks is governed by therequirements of the Office of the Superintendent of FinancialInstitutions (OSFI). These requirements are consistent with theinternational standards set by the Bank for International Set-tlements (BIS).
Under these standards, bank regulatory capital consists oftwo components – Tier 1 capital and Tier 2 capital, the com-ponents of which are outlined in the following section. Whileboth components provide important support for bankingoperations and protection for depositors, Tier 1 capital, repre-senting more permanent forms of capital, is of particularimportance to regulators, financial markets and investors.
Certain changes to accounting standards effectiveNovember 1, 2004, resulted in some of the Bank’s qualifyingTier 1 capital securities being reclassified from shareholders’equity and non-controlling interest in subsidiaries to liabilitieson the balance sheet. However, this will not affect the Bank’scapital ratios, as OSFI has confirmed that the Bank’s existingsecurities will remain eligible as Tier 1 capital.
Tier 1 CapitalTier 1 capital consists primarily of common shareholders’equity, trust securities and non-cumulative preferred shares.Tier 1 capital rose to $17.3 billion, an increase of $0.6 billionover last year. Retained earnings grew by $1.5 billion. Strongearnings (net of dividends) of $1.8 billion in 2004 werereduced by the $300 million premium paid on the purchase ofcommon shares and redemption of preferred shares. As well,cumulative unrealized foreign currency translation lossesincreased by $709 million, caused by further strengthening ofthe Canadian dollar, and the Series 11 preferred shares of$250 million were redeemed during the year.
Over the past five years, notwithstanding large dividendincreases, we have generated $7.1 billion in capital internally,which has been driven by our strong growth in net income.This level of internal capital generation is among the highestof the Canadian banks.
Tier 2 CapitalTier 2 capital consists mainly of subordinated debentures andan eligible portion of the total general allowance for creditlosses. Tier 2 capital decreased marginally in 2004 to $3.8billion due to a reduction in the portion of subordinate deben-tures that are eligible for inclusion in Tier 2 capital, as well asfrom foreign currency translation.
TD Scotia CIBC BMO Royal
11.510.5
12.6
9.88.9
0
3
3
6
9
12
15
0400 01 02 03
Tier 1 capital% October 31
Common equitycontinues to increase$ billions, October 31

2004 Scot iabank Annual Report 45
> MANAGEMENT ’ S D I SCUSS ION & ANALYS I S
Table 10 Regulatory capital
As at October 31 ($ millions) 2004 2003 2002 2001 2000
Tier 1 capitalCommon shareholders’ equity $ 14,685 $ 13,814 $ 13,502 $ 12,833 $ 11,200Non-cumulative preferred shares 550 800 1,275 1,775 1,775Non-controlling interest in subsidiaries (1) 2,280 2,326 1,912 1,086 729Less: Goodwill (261) (270) (299) (400) (297)
17,254 16,670 16,390 15,294 13,407Tier 2 capitalSubordinated debentures (net of amortization) 2,493 2,595 3,372 4,933 4,990Eligible amount of general allowance (2) 1,317 1,352 1,448 1,442 1,171
3,810 3,947 4,820 6,375 6,161Less: Investments in associated corporations and other items (200) (209) (250) (329) (539)Total capital $ 20,864 $ 20,408 $ 20,960 $ 21,340 $ 19,029Total risk-weighted assets ($ billions) $ 150.5 $ 154.5 $ 165.4 $ 164.8 $ 156.1
Capital ratiosTier 1 capital ratio 11.5% 10.8% 9.9% 9.3% 8.6%Total capital ratio 13.9% 13.2% 12.7% 13.0% 12.2%
(1) Includes Scotiabank Trust Securities (Scotia BaTS), an innovative capital instrument.(2) Under OSFI guidelines, the general allowance was included in Tier 2 capital up to a maximum of 0.875% of risk-weighted assets. Prior to October 2001, this limit
was 0.75%.
Table 11 Changes in regulatory capital
For the fiscal years ($ millions) 2004 2003 2002 2001 2000
Total capital, beginning of year $ 20,408 $ 20,960 $ 21,340 $ 19,029 $ 16,905Internally generated capital
Net income 2,931 2,477 1,797 2,169 1,926Preferred and common share dividends (1,139) (901) (837) (729) (604)
1,792 1,576 960 1,440 1,322External financing
Debentures (net of amortization) (102) (777) (1,561) (57) (124)Preferred shares (250) (475) (500) – –Innovative Tier 1 capital instruments (1) – 750 750 – 500Common shares and contributed surplus 88 139 82 155 87Purchase of shares and premium on redemption (300) (220) (154) – –
(564) (583) (1,383) 98 463Other
Net unrealized foreign exchange translation gains (losses) (2) (709) (1,176) (137)(3) 79 163Non-controlling interest in subsidiaries (46) (336) 76 357 31Other (4) (17) (33) 104 337 145
(772) (1,545) 43 773 339Total capital generated (used) 456 (552) (380) 2,311 2,124Total capital, end of year 20,864 20,408 20,960 21,340 19,029
(1) Innovative Tier 1 capital instruments (Scotia BaTS) issued through BNS Capital Trust and Scotiabank Capital Trust.(2) Refer to footnote (2) on page 87.(3) Refer to footnote (3) on page 87.(4) Represents changes to eligible general allowance, regulatory capital deductions for goodwill, investments in associated corporations and securitization-related amounts,
and other charges (credits) to retained earnings.
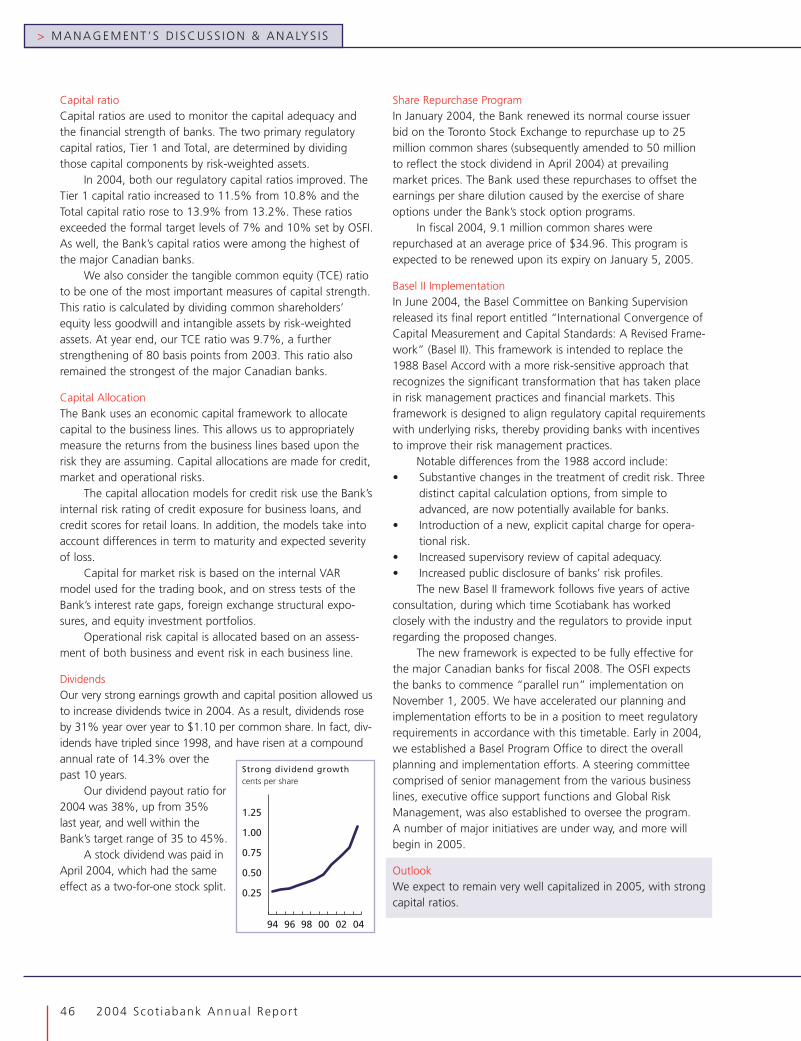
> MANAGEMENT ’ S D I SCUSS ION & ANALYS I S
46 2004 Scot iabank Annual Report
Capital ratioCapital ratios are used to monitor the capital adequacy andthe financial strength of banks. The two primary regulatorycapital ratios, Tier 1 and Total, are determined by dividingthose capital components by risk-weighted assets.
In 2004, both our regulatory capital ratios improved. TheTier 1 capital ratio increased to 11.5% from 10.8% and theTotal capital ratio rose to 13.9% from 13.2%. These ratiosexceeded the formal target levels of 7% and 10% set by OSFI.As well, the Bank’s capital ratios were among the highest ofthe major Canadian banks.
We also consider the tangible common equity (TCE) ratioto be one of the most important measures of capital strength.This ratio is calculated by dividing common shareholders’equity less goodwill and intangible assets by risk-weightedassets. At year end, our TCE ratio was 9.7%, a furtherstrengthening of 80 basis points from 2003. This ratio alsoremained the strongest of the major Canadian banks.
Capital AllocationThe Bank uses an economic capital framework to allocatecapital to the business lines. This allows us to appropriatelymeasure the returns from the business lines based upon therisk they are assuming. Capital allocations are made for credit,market and operational risks.
The capital allocation models for credit risk use the Bank’sinternal risk rating of credit exposure for business loans, andcredit scores for retail loans. In addition, the models take intoaccount differences in term to maturity and expected severityof loss.
Capital for market risk is based on the internal VARmodel used for the trading book, and on stress tests of theBank’s interest rate gaps, foreign exchange structural expo-sures, and equity investment portfolios.
Operational risk capital is allocated based on an assess-ment of both business and event risk in each business line.
DividendsOur very strong earnings growth and capital position allowed usto increase dividends twice in 2004. As a result, dividends roseby 31% year over year to $1.10 per common share. In fact, div-idends have tripled since 1998, and have risen at a compoundannual rate of 14.3% over thepast 10 years.
Our dividend payout ratio for2004 was 38%, up from 35%last year, and well within theBank’s target range of 35 to 45%.
A stock dividend was paid inApril 2004, which had the sameeffect as a two-for-one stock split.
Share Repurchase ProgramIn January 2004, the Bank renewed its normal course issuerbid on the Toronto Stock Exchange to repurchase up to 25million common shares (subsequently amended to 50 millionto reflect the stock dividend in April 2004) at prevailingmarket prices. The Bank used these repurchases to offset theearnings per share dilution caused by the exercise of shareoptions under the Bank’s stock option programs.
In fiscal 2004, 9.1 million common shares wererepurchased at an average price of $34.96. This program isexpected to be renewed upon its expiry on January 5, 2005.
Basel II ImplementationIn June 2004, the Basel Committee on Banking Supervisionreleased its final report entitled “International Convergence ofCapital Measurement and Capital Standards: A Revised Frame-work” (Basel II). This framework is intended to replace the1988 Basel Accord with a more risk-sensitive approach thatrecognizes the significant transformation that has taken placein risk management practices and financial markets. Thisframework is designed to align regulatory capital requirementswith underlying risks, thereby providing banks with incentivesto improve their risk management practices.
Notable differences from the 1988 accord include:• Substantive changes in the treatment of credit risk. Three
distinct capital calculation options, from simple toadvanced, are now potentially available for banks.
• Introduction of a new, explicit capital charge for opera-tional risk.
• Increased supervisory review of capital adequacy.• Increased public disclosure of banks’ risk profiles.
The new Basel II framework follows five years of activeconsultation, during which time Scotiabank has workedclosely with the industry and the regulators to provide inputregarding the proposed changes.
The new framework is expected to be fully effective forthe major Canadian banks for fiscal 2008. The OSFI expectsthe banks to commence “parallel run” implementation onNovember 1, 2005. We have accelerated our planning andimplementation efforts to be in a position to meet regulatoryrequirements in accordance with this timetable. Early in 2004,we established a Basel Program Office to direct the overallplanning and implementation efforts. A steering committeecomprised of senior management from the various businesslines, executive office support functions and Global RiskManagement, was also established to oversee the program.A number of major initiatives are under way, and more willbegin in 2005.
OutlookWe expect to remain very well capitalized in 2005, with strongcapital ratios.
0.25
0.50
0.75
1.00
1.25
94 96 98 00 02 04
Strong dividend growthcents per share
2004 Scot iabank Annual Report 47
> MANAGEMENT ’ S D I SCUSS ION & ANALYS I S
Off-Balance Sheet ArrangementsIn the normal course of business, the Bank has contractualarrangements that are not required to be consolidated in itsbalance sheet. These arrangements could have a current orfuture effect on its results of operations or financial condition.They fall into three main categories: variable interest entities(VIEs), securitizations, and guarantees and loan commitments.
Variable interest entitiesThe Bank has off-balance sheet arrangements with VIEs whichfall into two broad categories:• VIEs that are used to provide a wide range of services to
customers. These include sponsoring and actively manag-ing mutual funds, as well as offering trust and estateservices for personal and corporate trusts. In addition,the Bank establishes VIEs to assist clients in securitizingtheir financial assets (through commercial paper con-duits) and to provide investment opportunities.
• VIEs that are used to diversify the Bank’s funding sourcesand manage its capital requirements, by securitizing itsown assets (mostly residential mortgages and personalloans) and issuing innovative Tier 1 capital instruments(e.g., Scotiabank Trust Securities described in Note 11and Note 13 to the consolidated financial statements).
For many of the VIEs used to provide services to cus-tomers, the Bank earns fees but has no exposure to loss onthe underlying assets, as it does not guarantee the perform-ance of the assets. For other VIEs, such as securitization andinvestment vehicles, the Bank earns fees and may be exposedto credit, market, liquidity, or operational risks. Maximum pos-sible payments under liquidity facilities, mainly related to assetbacked commercial paper conduits, are discussed below underguarantees and loan commitments.
VIEs are subject to the review and approval processes thatthe Bank applies to all transactions to ensure that risks, as wellas accounting, related party and ownership issues, are prop-erly addressed.
As disclosed in Note 2 to the consolidated financial state-ments on page 94, new Canadian accounting rules, which areeffective for fiscal 2005, require some of these VIEs to be con-solidated, mainly asset backed commercial paper conduits.The estimated effect of applying these rules will be anincrease in assets and liabilities of $7 billion. The Bank earnedapproximately $23 million in fiscal 2004 from the administra-tion of these asset backed commercial paper conduits. Theamounts owed by or to these conduits are not significant.More information with respect to these VIEs is included inNote 2.
Information with respect to VIEs where the Bank has sig-nificant involvement, but will not be required to consolidate, isalso included in Note 2. These VIEs include personal and cor-porate trusts, and mutual fund structures, with assets totaling
approximately $46 billion. The Bank earned approximately$324 million in related fees in 2004.
SecuritizationsThe Bank securitizes some of its personal and credit cardloans, and residential mortgages, by transferring the assets tounrelated trusts. As discussed further in Note 1 to the consoli-dated financial statements on page 90, if certain criteria aremet, the transfers are treated as sales and the transferredassets are removed from the consolidated balance sheet.These securitizations allow the Bank to diversify its fundingsources, and manage risks and capital requirements.
The total principal amount of off-balance sheet securi-tized personal and credit card loans has declined over the pasttwo years, as these arrangements mature. However, the totalprincipal amount of off-balance sheet securitized mortgageshas increased over the past two years, as securitization hasbeen a cost-effective method of funding the significantgrowth in mortgage volumes. As at October 31, 2004, $7,523million of mortgages were securitized, up from $5,248 millionlast year and $3,829 million two years ago. Given the Bank’ssizable capital base, and the manner in which these securitiza-tions are structured, the Bank is not exposed to significantliquidity risks in connection with these off-balance sheetarrangements.
Subsequent to the transfer of assets, the Bank retainsinterests in securities issued by the trusts, maintains relation-ships with the underlying customers and provides administra-tive services to the trusts. The Bank recorded securitizationrevenues of $111 million in 2004, compared to $140 millionin 2003 and $162 million in 2002. More information on theamount of securitizations and associated cash flows, servicingfees and retained interests is provided in Note 4(b) to the con-solidated financial statements on page 96. Information onrelated guarantees is provided in Note 20, on page 111.
Guarantees and loan commitmentsGuarantees and loan commitments are issued by the Bank toearn fee revenue and consist primarily of:• Standby letters of credit and letters of guarantee, of
which $14,417 million are outstanding as at October 31,2004, up from $14,176 million last year. These are issuedat the request of a Bank customer to secure the cus-tomer’s payment or performance obligations to a thirdparty.
• Liquidity facilities, which generally provide an alternatesource of financing to asset-backed commercial paperconduits, in the event that a market disruption preventsthe conduits from issuing commercial paper or, in somecases, when certain specified conditions or performancemeasures are not met. As at October 31, 2004, thesefacilities amounted to $14,577 million, compared to$14,543 million a year earlier.
> MANAGEMENT ’ S D I SCUSS ION & ANALYS I S
48 2004 Scot iabank Annual Report
• The Bank provides partial credit enhancements, in theform of financial standby letters, to commercial paperconduits, administered by the Bank and by third parties.As at October 31, 2004, these credit enhancementsamounted to $846 million, unchanged from 2003, andare included within standby letters of credit and letters ofguarantee.
• In the ordinary course of business, the Bank enters intomany contracts which contain indemnification provisionswhere the Bank may indemnify counterparties to thecontracts for certain aspects of the Bank’s past conduct ifother parties fail to perform, or if certain events occur.The Bank cannot estimate in all cases the maximumpotential future amount that may be payable, nor theamount of collateral or assets available under recourseprovisions that would mitigate any such payments.
• Commitments to extend credit which represent under-takings to make credit available in the form of loans orother financings for specific amounts and maturities,subject to specific conditions. As at October 31, 2004,these commitments amounted to $104 billion, comparedto $111 billion a year earlier.
These arrangements may expose the Bank to credit orliquidity risks and are subject to the Bank’s standard reviewand approval processes. Annual fees from these guaranteesand loan commitment arrangements, recorded in credit fees inthe Consolidated Statement of Income, were approximately$258 million in 2004, compared to $288 million in the prioryear. Detailed information on guarantees and loan commit-ments is disclosed in Note 20 to the consolidated financialstatements on page 111.
Financial InstrumentsFinancial instruments are central to the business of the Bankand, as such, the Bank’s balance sheet is comprised substan-tially of financial instruments. To understand the Bank’spresent financial instrument positions and related risks, it isnecessary to understand the strategies and activities of theBank’s business lines as well as the Bank’s approach to riskmanagement.
On the asset side of the balance sheet, financial instru-ments include cash resources, securities, loans and derivativeinstruments. Liabilities that are financial instruments includedeposits, obligations related to securities sold under repur-chase agreements, obligations related to securities sold short,derivative instruments and subordinated debentures. Financialinstruments are generally carried at cost, except for those heldfor trading purposes, which are recorded at their estimatedfair value.
The terms and conditions of these financial instruments aredisclosed in the notes to the 2004 consolidated financial state-ments. In particular, Note 21 on pages 113-116 discloses the
methods the Bank uses in determining fair values and the fairvalue amounts of the Bank’s financial instruments; the interestrate risk profile, including the interest rate sensitivity gap andmaturity or repricing profiles; and the credit exposure ofselected financial instruments. With respect to derivative instru-ments, Note 22 on pages 116-119 provides product volumes,term to maturity, credit risk and fair value information.
The fair value of the Bank’s financial instrumentsexceeded their carrying value by $1,171 million (2003 – $468million) as at October 31, 2004. The net changes in fair valueyear over year arise primarily from changes in interest rates,and to a lesser extent foreign currency rates and equity secu-rity prices. Fair values for those instruments that do not havea quoted market price were estimated using present value orother techniques based primarily on observable interest rates,foreign exchange rates, equity prices and credit spreads. Thecalculation of estimated fair value is based on market condi-tions at a specific point in time and may not be reflective offuture fair values.
Financial instruments, by their nature, give rise to differentrisks, such as credit risk, liquidity risk, operational risk andmarket risk. The latter includes risks related to interest rate,foreign currency and equities. The Bank has extensive risk man-agement policies and practices in place to manage these risks,including a variety of Board-approved risk management limitsand risk measurement techniques. A discussion of the Bank’srisk management practices can be found in the Risk Manage-ment section on pages 54 to 63, including a description of riskmanagement practices with respect to derivative instruments.
There are various measures that reflect the level of riskassociated with the Bank’s portfolios of financial instruments.Included on page 58 under Interest Rate Risk is the sensitivityto net interest income of the Bank’s non-trading financialinstruments if interest rates were to rise 1%, as well as theimpact on the present value of the Bank’s net assets. On thetrading side, the table on page 60 discloses the averageone-day Value At Risk, by risk factor. From a term to maturitystandpoint, only 9% (2003 – 8%) of the Bank’s derivativeinstruments have a term to maturity greater than five years,which historically is at the low end of our Canadian peer group.
Income and expense on interest-bearing financial instru-ments is included in net interest income in the Bank’s Consoli-dated Statement of Income, and credit losses are recorded inthe provision for credit losses. Realized gains, losses and write-downs on investment securities are recorded in Other Income,as are net trading revenues. Details of the Bank’s accountingpolicies with respect to derivatives and hedging activity can befound in Note 1 of the 2004 consolidated financial statementson page 90.
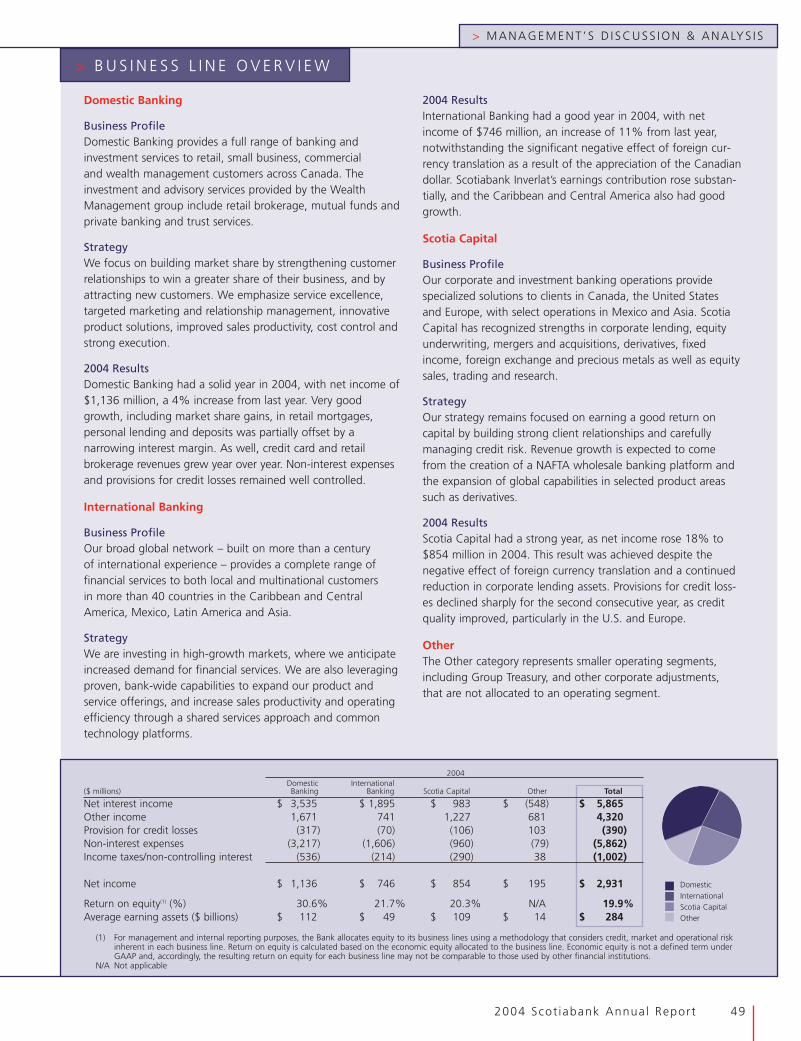
2004 Scot iabank Annual Report 49
> MANAGEMENT ’ S D I SCUSS ION & ANALYS I S
> B U S I N E S S L I N E O V E R V I E W
Domestic Banking
Business ProfileDomestic Banking provides a full range of banking andinvestment services to retail, small business, commercialand wealth management customers across Canada. Theinvestment and advisory services provided by the WealthManagement group include retail brokerage, mutual funds andprivate banking and trust services.
StrategyWe focus on building market share by strengthening customerrelationships to win a greater share of their business, and byattracting new customers. We emphasize service excellence,targeted marketing and relationship management, innovativeproduct solutions, improved sales productivity, cost control andstrong execution.
2004 ResultsDomestic Banking had a solid year in 2004, with net income of$1,136 million, a 4% increase from last year. Very goodgrowth, including market share gains, in retail mortgages,personal lending and deposits was partially offset by anarrowing interest margin. As well, credit card and retailbrokerage revenues grew year over year. Non-interest expensesand provisions for credit losses remained well controlled.
International Banking
Business ProfileOur broad global network – built on more than a centuryof international experience – provides a complete range offinancial services to both local and multinational customersin more than 40 countries in the Caribbean and CentralAmerica, Mexico, Latin America and Asia.
StrategyWe are investing in high-growth markets, where we anticipateincreased demand for financial services. We are also leveragingproven, bank-wide capabilities to expand our product andservice offerings, and increase sales productivity and operatingefficiency through a shared services approach and commontechnology platforms.
2004 ResultsInternational Banking had a good year in 2004, with netincome of $746 million, an increase of 11% from last year,notwithstanding the significant negative effect of foreign cur-rency translation as a result of the appreciation of the Canadiandollar. Scotiabank Inverlat’s earnings contribution rose substan-tially, and the Caribbean and Central America also had goodgrowth.
Scotia Capital
Business ProfileOur corporate and investment banking operations providespecialized solutions to clients in Canada, the United Statesand Europe, with select operations in Mexico and Asia. ScotiaCapital has recognized strengths in corporate lending, equityunderwriting, mergers and acquisitions, derivatives, fixedincome, foreign exchange and precious metals as well as equitysales, trading and research.
StrategyOur strategy remains focused on earning a good return oncapital by building strong client relationships and carefullymanaging credit risk. Revenue growth is expected to comefrom the creation of a NAFTA wholesale banking platform andthe expansion of global capabilities in selected product areassuch as derivatives.
2004 ResultsScotia Capital had a strong year, as net income rose 18% to$854 million in 2004. This result was achieved despite thenegative effect of foreign currency translation and a continuedreduction in corporate lending assets. Provisions for credit loss-es declined sharply for the second consecutive year, as creditquality improved, particularly in the U.S. and Europe.
OtherThe Other category represents smaller operating segments,including Group Treasury, and other corporate adjustments,that are not allocated to an operating segment.
2004Domestic International
($ millions) Banking Banking Scotia Capital Other Total
Net interest income $ 3,535 $ 1,895 $ 983 $ (548) $ 5,865Other income 1,671 741 1,227 681 4,320Provision for credit losses (317) (70) (106) 103 (390)Non-interest expenses (3,217) (1,606) (960) (79) (5,862)Income taxes/non-controlling interest (536) (214) (290) 38 (1,002)
Net income $ 1,136 $ 746 $ 854 $ 195 $ 2,931
Return on equity(1) (%) 30.6% 21.7% 20.3% N/A 19.9%Average earning assets ($ billions) $ 112 $ 49 $ 109 $ 14 $ 284
DomesticInternationalScotia CapitalOther
(1) For management and internal reporting purposes, the Bank allocates equity to its business lines using a methodology that considers credit, market and operational riskinherent in each business line. Return on equity is calculated based on the economic equity allocated to the business line. Economic equity is not a defined term underGAAP and, accordingly, the resulting return on equity for each business line may not be comparable to those used by other financial institutions.
N/A Not applicable

50 2004 Scot iabank Annual Report
Financial PerformanceDomestic Banking reported net income of $1,136 million in2004, $42 million or 4% higher than last year, with an excel-lent return on equity of 30.6%. Domestic Banking accountedfor 39% of the Bank’s total net income. This growth was drivenby a stronger performance in retail banking, partly offset by adecline in earnings from our commercial operations.
Assets and LiabilitiesDomestic retail assets including Wealth Management’s privateclient group business, grew by a solid 14% this year. This wasled by exceptional growth in residential mortgage balances of$9.3 billion or 15% over 2003. As a result, market share grewby 52 basis points, a continuation of the gains of the past sev-eral years. Also contributing to the increase in assets was verystrong year-over-year growth of 16% in personal revolvingcredit. Furthermore, 60% of the ScotiaLine® and ScotiaLineVISA credit portfolios are now secured. Commercial lending vol-umes declined slightly, mainly because of a managed reductionin commercial mortgages.
Core retail deposits recorded strong growth of 19%,reflecting the ongoing success of the Money Master® HighInterest Savings Account, which resulted in significant marketshare gains of 26 basis points over last year. Business deposits,including the new Money Master for businessTM, also rosestrongly by 22%, continuing the double-digit growth trend ofthe past several years.
Assets under administration rose 10% to $97 billion. Netasset inflows from new and internally referred customers, aswell as continued growth in our share of wallet, complementedmarket-driven gains.
RevenuesTotal revenues were $5,206 million, up $204 million or 4%from last year. Net interest income increased by $61 million or2% to $3,535 million in 2004, driven by strong volume growthin assets and deposits. The interest margin fell during the year,largely the result of low interest rates and competitive pres-sures, particularly in retail mortgages.
Other income for the year was $1,671 million, an increaseof 9% over last year. Growth was broadly based, includinghigher card revenues from expansion of the commercial card
program, an increase in transaction-based fees from volumegrowth and pricing initiatives, and growth in electronic-basedfees, which came in part from the installation of more ABMs.As well, brokerage revenues grew by $49 million or 11% as aresult of greater customer trading activity.
Non-interest ExpensesNon-interest expenses were $3,217 million in 2004, an increaseof $141 million or 5% from last year. This reflected normalmerit-based growth in salaries, higher performance and stock-based compensation and an increase in pension costs. Alsocontributing to the rise in expenses were higher mortgageacquisition and appraisal costs, consistent with the growth inresidential mortgages. Expenses also rose for initiatives under-taken to enhance customer service, expand product offerings,and improve efficiencies, including the replacement of legacyproduct systems.
Credit QualityProvisions for credit losses were $317 million in 2004, up$45 million or 17% from last year. Credit quality remainedvery good in the retail portfolio, with our retail loan loss ratioof 23 basis points being 3 basis points below last year.Commercial credit losses rose this year due to the deteriorationof a small number of accounts.
OutlookWe expect good growth in assets and deposits next year,although not at the same rate as 2004. However, ongoingmargin compression is likely to constrain growth in netinterest income. Credit quality is expected to remain fairlystable. Our focus for the next year will be to continue toincrease our sales capacity, deepen customer relationshipsand attract new customers.
> MANAGEMENT ’ S D I SCUSS ION & ANALYS I S
Domestic BankingFinancial performance ($ millions) 2004 2003 2002
Net interest income(1) $ 3,535 $ 3,474 $ 3,405Other income 1,671 1,528 1,599Provision for credit losses (317) (272) (282)Non-interest expenses (3,217) (3,076) (2,953)Income taxes(1) (536) (560) (627)
Net income $ 1,136 $ 1,094 $ 1,142
Return on equity (%) 30.6 30.9 33.0Average earning assets ($ billions) 112 101 93Productivity ratio(1) (%) 61.8 61.5 59.0
Revenue by areaTaxable equivalent basis ($ millions) 2004 2003 2002
Retail $3,299 $3,118 $ 3,007Small Business & Commercial 1,110 1,133 1,270Wealth Management 797 751 727
Total revenue $ 5,206 $5,002 $ 5,004
(1) Taxable equivalent basis
> D O M E S T I C B A N K I N G
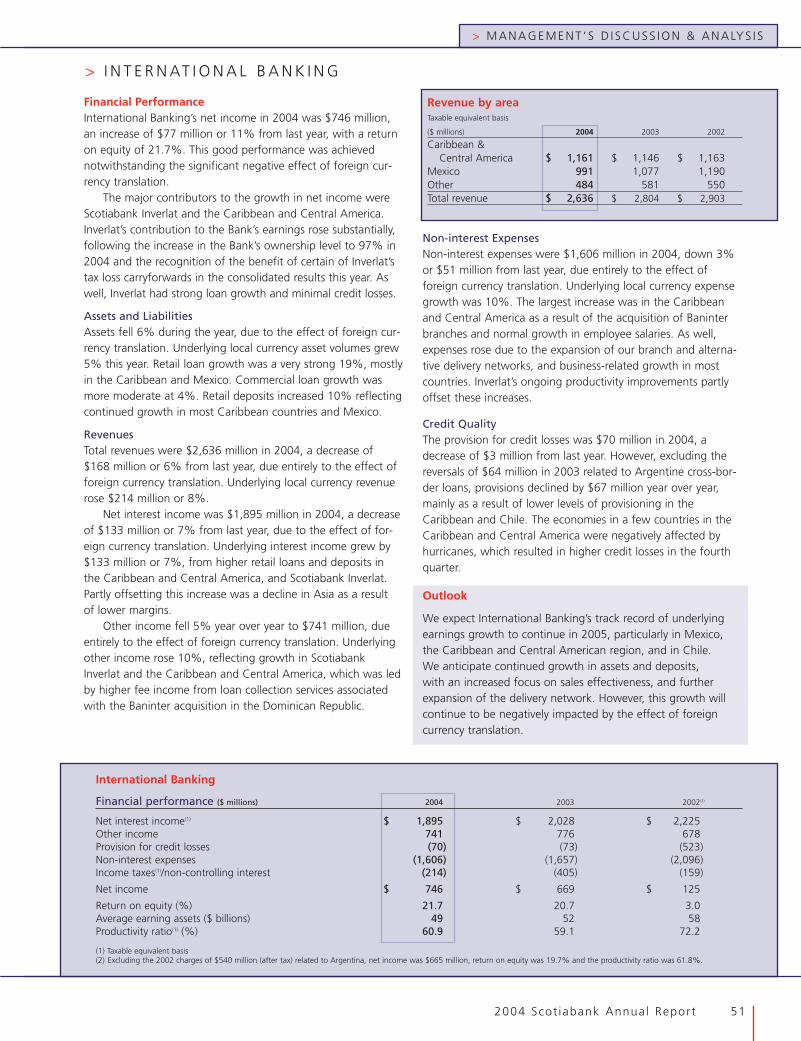
2004 Scot iabank Annual Report 51
> MANAGEMENT ’ S D I SCUSS ION & ANALYS I S
International Banking
Financial performance ($ millions) 2004 2003 2002(2)
Net interest income(1) $ 1,895 $ 2,028 $ 2,225Other income 741 776 678Provision for credit losses (70) (73) (523)Non-interest expenses (1,606) (1,657) (2,096)Income taxes(1)/non-controlling interest (214) (405) (159)
Net income $ 746 $ 669 $ 125
Return on equity (%) 21.7 20.7 3.0Average earning assets ($ billions) 49 52 58Productivity ratio(1) (%) 60.9 59.1 72.2
(1) Taxable equivalent basis(2) Excluding the 2002 charges of $540 million (after tax) related to Argentina, net income was $665 million, return on equity was 19.7% and the productivity ratio was 61.8%.
Financial PerformanceInternational Banking’s net income in 2004 was $746 million,an increase of $77 million or 11% from last year, with a returnon equity of 21.7%. This good performance was achievednotwithstanding the significant negative effect of foreign cur-rency translation.
The major contributors to the growth in net income wereScotiabank Inverlat and the Caribbean and Central America.Inverlat’s contribution to the Bank’s earnings rose substantially,following the increase in the Bank’s ownership level to 97% in2004 and the recognition of the benefit of certain of Inverlat’stax loss carryforwards in the consolidated results this year. Aswell, Inverlat had strong loan growth and minimal credit losses.
Assets and LiabilitiesAssets fell 6% during the year, due to the effect of foreign cur-rency translation. Underlying local currency asset volumes grew5% this year. Retail loan growth was a very strong 19%, mostlyin the Caribbean and Mexico. Commercial loan growth wasmore moderate at 4%. Retail deposits increased 10% reflectingcontinued growth in most Caribbean countries and Mexico.
RevenuesTotal revenues were $2,636 million in 2004, a decrease of$168 million or 6% from last year, due entirely to the effect offoreign currency translation. Underlying local currency revenuerose $214 million or 8%.
Net interest income was $1,895 million in 2004, a decreaseof $133 million or 7% from last year, due to the effect of for-eign currency translation. Underlying interest income grew by$133 million or 7%, from higher retail loans and deposits inthe Caribbean and Central America, and Scotiabank Inverlat.Partly offsetting this increase was a decline in Asia as a resultof lower margins.
Other income fell 5% year over year to $741 million, dueentirely to the effect of foreign currency translation. Underlyingother income rose 10%, reflecting growth in ScotiabankInverlat and the Caribbean and Central America, which was ledby higher fee income from loan collection services associatedwith the Baninter acquisition in the Dominican Republic.
Non-interest ExpensesNon-interest expenses were $1,606 million in 2004, down 3%or $51 million from last year, due entirely to the effect offoreign currency translation. Underlying local currency expensegrowth was 10%. The largest increase was in the Caribbeanand Central America as a result of the acquisition of Baninterbranches and normal growth in employee salaries. As well,expenses rose due to the expansion of our branch and alterna-tive delivery networks, and business-related growth in mostcountries. Inverlat’s ongoing productivity improvements partlyoffset these increases.
Credit QualityThe provision for credit losses was $70 million in 2004, adecrease of $3 million from last year. However, excluding thereversals of $64 million in 2003 related to Argentine cross-bor-der loans, provisions declined by $67 million year over year,mainly as a result of lower levels of provisioning in theCaribbean and Chile. The economies in a few countries in theCaribbean and Central America were negatively affected byhurricanes, which resulted in higher credit losses in the fourthquarter.
Outlook
We expect International Banking’s track record of underlyingearnings growth to continue in 2005, particularly in Mexico,the Caribbean and Central American region, and in Chile.We anticipate continued growth in assets and deposits,with an increased focus on sales effectiveness, and furtherexpansion of the delivery network. However, this growth willcontinue to be negatively impacted by the effect of foreigncurrency translation.
Revenue by areaTaxable equivalent basis
($ millions) 2004 2003 2002
Caribbean &Central America $ 1,161 $ 1,146 $ 1,163
Mexico 991 1,077 1,190Other 484 581 550Total revenue $ 2,636 $ 2,804 $ 2,903
> I N T E R N AT I O N A L B A N K I N G
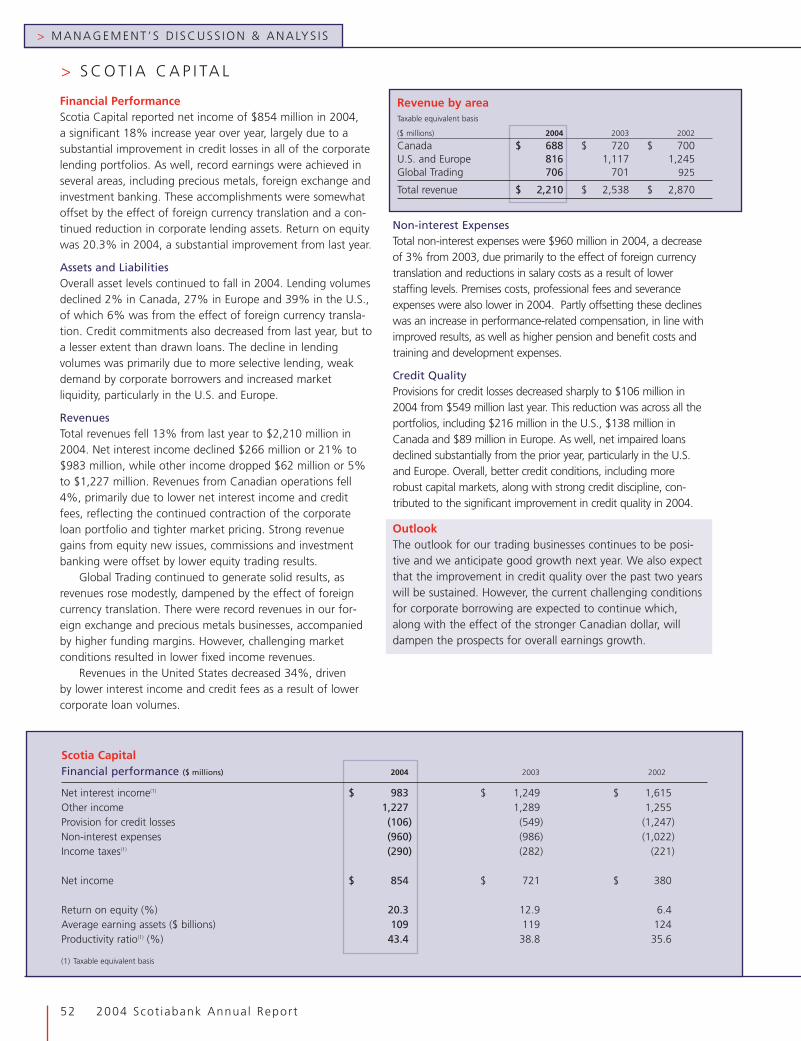
> MANAGEMENT ’ S D I SCUSS ION & ANALYS I S
52 2004 Scot iabank Annual Report
Financial PerformanceScotia Capital reported net income of $854 million in 2004,a significant 18% increase year over year, largely due to asubstantial improvement in credit losses in all of the corporatelending portfolios. As well, record earnings were achieved inseveral areas, including precious metals, foreign exchange andinvestment banking. These accomplishments were somewhatoffset by the effect of foreign currency translation and a con-tinued reduction in corporate lending assets. Return on equitywas 20.3% in 2004, a substantial improvement from last year.
Assets and LiabilitiesOverall asset levels continued to fall in 2004. Lending volumesdeclined 2% in Canada, 27% in Europe and 39% in the U.S.,of which 6% was from the effect of foreign currency transla-tion. Credit commitments also decreased from last year, but toa lesser extent than drawn loans. The decline in lendingvolumes was primarily due to more selective lending, weakdemand by corporate borrowers and increased marketliquidity, particularly in the U.S. and Europe.
RevenuesTotal revenues fell 13% from last year to $2,210 million in2004. Net interest income declined $266 million or 21% to$983 million, while other income dropped $62 million or 5%to $1,227 million. Revenues from Canadian operations fell4%, primarily due to lower net interest income and creditfees, reflecting the continued contraction of the corporateloan portfolio and tighter market pricing. Strong revenuegains from equity new issues, commissions and investmentbanking were offset by lower equity trading results.
Global Trading continued to generate solid results, asrevenues rose modestly, dampened by the effect of foreigncurrency translation. There were record revenues in our for-eign exchange and precious metals businesses, accompaniedby higher funding margins. However, challenging marketconditions resulted in lower fixed income revenues.
Revenues in the United States decreased 34%, drivenby lower interest income and credit fees as a result of lowercorporate loan volumes.
Non-interest ExpensesTotal non-interest expenses were $960 million in 2004, a decreaseof 3% from 2003, due primarily to the effect of foreign currencytranslation and reductions in salary costs as a result of lowerstaffing levels. Premises costs, professional fees and severanceexpenses were also lower in 2004. Partly offsetting these declineswas an increase in performance-related compensation, in line withimproved results, as well as higher pension and benefit costs andtraining and development expenses.
Credit QualityProvisions for credit losses decreased sharply to $106 million in2004 from $549 million last year. This reduction was across all theportfolios, including $216 million in the U.S., $138 million inCanada and $89 million in Europe. As well, net impaired loansdeclined substantially from the prior year, particularly in the U.S.and Europe. Overall, better credit conditions, including morerobust capital markets, along with strong credit discipline, con-tributed to the significant improvement in credit quality in 2004.
OutlookThe outlook for our trading businesses continues to be posi-tive and we anticipate good growth next year. We also expectthat the improvement in credit quality over the past two yearswill be sustained. However, the current challenging conditionsfor corporate borrowing are expected to continue which,along with the effect of the stronger Canadian dollar, willdampen the prospects for overall earnings growth.
Scotia CapitalFinancial performance ($ millions) 2004 2003 2002
Net interest income(1) $ 983 $ 1,249 $ 1,615Other income 1,227 1,289 1,255Provision for credit losses (106) (549) (1,247)Non-interest expenses (960) (986) (1,022)Income taxes(1) (290) (282) (221)
Net income $ 854 $ 721 $ 380
Return on equity (%) 20.3 12.9 6.4Average earning assets ($ billions) 109 119 124Productivity ratio(1) (%) 43.4 38.8 35.6
Revenue by areaTaxable equivalent basis
($ millions) 2004 2003 2002
Canada $ 688 $ 720 $ 700U.S. and Europe 816 1,117 1,245Global Trading 706 701 925
Total revenue $ 2,210 $ 2,538 $ 2,870
(1) Taxable equivalent basis
> S C O T I A C A P I TA L
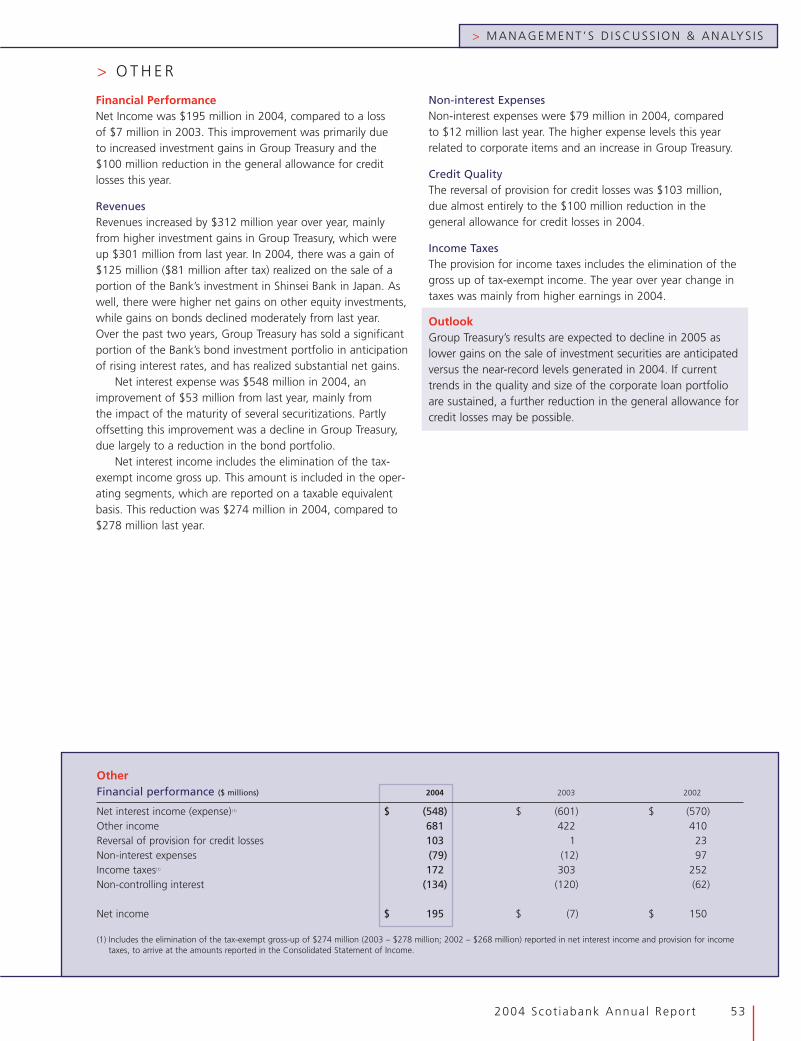
2004 Scot iabank Annual Report 53
> MANAGEMENT ’ S D I SCUSS ION & ANALYS I S
> O T H E R
Financial PerformanceNet Income was $195 million in 2004, compared to a lossof $7 million in 2003. This improvement was primarily dueto increased investment gains in Group Treasury and the$100 million reduction in the general allowance for creditlosses this year.
RevenuesRevenues increased by $312 million year over year, mainlyfrom higher investment gains in Group Treasury, which wereup $301 million from last year. In 2004, there was a gain of$125 million ($81 million after tax) realized on the sale of aportion of the Bank’s investment in Shinsei Bank in Japan. Aswell, there were higher net gains on other equity investments,while gains on bonds declined moderately from last year.Over the past two years, Group Treasury has sold a significantportion of the Bank’s bond investment portfolio in anticipationof rising interest rates, and has realized substantial net gains.
Net interest expense was $548 million in 2004, animprovement of $53 million from last year, mainly fromthe impact of the maturity of several securitizations. Partlyoffsetting this improvement was a decline in Group Treasury,due largely to a reduction in the bond portfolio.
Net interest income includes the elimination of the tax-exempt income gross up. This amount is included in the oper-ating segments, which are reported on a taxable equivalentbasis. This reduction was $274 million in 2004, compared to$278 million last year.
Non-interest ExpensesNon-interest expenses were $79 million in 2004, comparedto $12 million last year. The higher expense levels this yearrelated to corporate items and an increase in Group Treasury.
Credit QualityThe reversal of provision for credit losses was $103 million,due almost entirely to the $100 million reduction in thegeneral allowance for credit losses in 2004.
Income TaxesThe provision for income taxes includes the elimination of thegross up of tax-exempt income. The year over year change intaxes was mainly from higher earnings in 2004.
OutlookGroup Treasury’s results are expected to decline in 2005 aslower gains on the sale of investment securities are anticipatedversus the near-record levels generated in 2004. If currenttrends in the quality and size of the corporate loan portfolioare sustained, a further reduction in the general allowance forcredit losses may be possible.
OtherFinancial performance ($ millions) 2004 2003 2002
Net interest income (expense)(1) $ (548) $ (601) $ (570)Other income 681 422 410Reversal of provision for credit losses 103 1 23Non-interest expenses (79) (12) 97Income taxes(1) 172 303 252Non-controlling interest (134) (120) (62)
Net income $ 195 $ (7) $ 150
(1) Includes the elimination of the tax-exempt gross-up of $274 million (2003 – $278 million; 2002 – $268 million) reported in net interest income and provision for incometaxes, to arrive at the amounts reported in the Consolidated Statement of Income.
54 2004 Scot iabank Annual Report
> R I S K M A N A G E M E N T
RISK GOVERNANCE
Board of DirectorsReviews and approves risk management strategies,policies, standards and key limits.
Senior Management Committees
Risk Policy Committee: reviews key risk exposuresand risk policies, and adjudicates risk issues referredby the Senior Credit, Market and Reputational Riskcommittees.
Liability Committee: provides strategic direction inthe management of global interest rate risk, foreignexchange risk, liquidity and funding risk and tradingand investment portfolio decisions.
Senior Credit Committees: adjudicate non-retailcredits within prescribed limits and establish theoperating rules and guidelines for the implementa-tion of credit policies. Separate committees covercommercial, international, corporate and investmentbanking counterparties. In addition, there are sepa-rate senior committees that authorize major creditpolicy changes for retail and small business credits.
Market Risk Management and Policy Committee:oversees and establishes standards for market andliquidity risk management processes within the Bank,including the review and approval of new products,limits, practices and policies for the Bank’s principaltrading and treasury activities.
Reputational Risk Committee: reviews structuredfinance transactions, loans, merchant banking trans-actions, underwriting and other transactions or newproducts referred by business lines or the SeniorCredit or Market Risk committees, to ensure that theBank is, and is seen to be, acting legally with highethical standards.
Risk Management OverviewRisk, to varying degrees and in different forms, is present in virtually allbusiness activities of a financial services organization. In certain activi-ties, risk is assumed as a means of generating revenue, while in otheractivities, risk exists by virtue of engaging in the activity. The primarygoals of risk management are to ensure that the outcomes of risk-taking activities are within the Bank’s risk tolerance, and that there is anappropriate balance between risk and reward in order to maximizeshareholder returns.
Risk management is guided by several key principles that form thefoundation of the framework the Bank has developed to control therisks in its diverse, global activities. The risk management framework isintegrated with the Bank’s strategy and business planning processes.The effectiveness of this framework is enhanced by the active participa-tion of executive and business line management in the risk manage-ment process. This process is continually reviewed and updated toensure consistency with risk-taking activities.
In varying forms, these principles apply to all businesses and risk types:• Board oversight – Risk strategies, policies and limits are subject to
Board approval. The Board, directly or through its committees,receives regular updates on the key risks of the Bank.
• Decision-making – Decision-making processes are designed to ensurealignment of business objectives, risk tolerance and resources.
• Accountability – Business units are responsible for managing riskswithin their portfolios, and are allocated capital in line with their riskprofiles.
• Independent review – All significant credit, market and liquidity risk-taking activities are subject to oversight by Global Risk Managementand other units that are independent of the business lines thatgenerate the activity.
• Diversification – Strategies, policies and limits, approved by an inde-pendent risk management group and endorsed by business linemanagement, are designed to ensure that risk is well diversified.
• Audit review – Internal Audit reports independently to the Audit andConduct Review Committee of the Board on the effectiveness of therisk management policies and on the extent to which internalcontrols are in place and being followed.
Risks are managed within the policies and limits approved by theBoard of Directors and in accordance with the governance structuredescribed to the left. Global Risk Management is responsible for moni-toring credit, market, liquidity, and operational risk within the policiesand limits set by the Board of Directors.
Credit Risk
Credit risk is the risk of loss resulting from the failure of a borrower orcounterparty to honour its financial or contractual obligations to theBank. Credit risk is created in the Bank’s direct lending operations, andin its funding, investment and trading activities where counterpartieshave repayment or other obligations to the Bank.
Credit Risk Management ProcessesThe credit risk management program is an integral part of enterprise-wide policies and procedures that articulate the Bank’s governance, riskmanagement and control structure. Credit risk is managed through poli-
> MANAGEMENT ’ S D I SCUSS ION & ANALYS I S

2004 Scot iabank Annual Report 55
> MANAGEMENT ’ S D I SCUSS ION & ANALYS I S
cies, guidelines and limits that are approved by the Board ofDirectors. The Risk Policy Committee reviews the policies, stan-dards and limits that control credit risk and recommends to theBoard any changes that may be required in response tochanging market conditions and other factors. Both the Boardand the Risk Policy Committee regularly receive comprehensivereports from Global Risk Management on the quality of thecredit portfolios, including major risk exposures and concentra-tions across the organization.
CORPORATE AND COMMERCIAL
The decision-making process for corporate and commercial creditsis intended to ensure that credit risks are adequately assessed,properly approved, continually monitored and actively managed.All significant credit requests are processed through the headoffice credit units of Global Risk Management, which are inde-pendent of the business line, for analysis and recommendation.
The decision-making process begins with an assessment ofthe credit risk of the individual borrower or counterparty. Keyfactors considered in the assessment include: analysis of theborrower’s current and projected financial results and creditstatistics; the industry in which the borrower operates;economic trends; geopolitical risk; and management. The resultof this assessment is the assignment of a risk rating to theborrower, using an 18-category rating system. A separate riskrating is assigned at the facility level, taking into considerationfactors that affect the loss-given-default of the facility such assecurity, seniority of claim, structure and term. Risk ratingsdetermine the level of seniority at which the credit decision canbe made, the assignment of economic capital and the compu-tation of the general allowance for credit losses.
In making credit decisions, a number of other factors arealso considered, including risk rating, facility risk, industry andcountry limits, and single name and connection concentrationlimits. Various internal and external modeling techniques areused to supplement the risk analysis of individual borrowersand credit portfolios. In addition, a risk-adjusted return onequity profitability model is used to provide an assessment ofeach credit application to ensure the client and transactionstructure offers an appropriate return for a given level of risk.Scotia Capital also has a loan portfolio management group thatindependently reviews the model results together with externalbenchmarks, and provides an opinion on the relative return andpricing of each transaction above a minimum threshold.
The Bank segments its corporate and commercial creditexposures into major industry groups. The risks in theseindustry groups are managed through limits, and lendingcriteria and guidelines relevant to each particular industry.
Credit units have defined authority levels appropriate to thesize and risk of each transaction. Where the decision is beyondthese authority levels, the credit unit will make a recommenda-tion and refer the request to a Senior Credit Committee foradjudication. Senior Credit Committees also have definedauthority levels and, accordingly, forward certain credits to the
Risk Policy Committee. In certain cases, credits must be referredto the Board of Directors.
Individual credit exposures are regularly monitored for anysigns of deterioration by both the business line units and GlobalRisk Management. In addition, a review and risk analysis ofeach borrower is conducted annually, or more frequently forhigher-risk borrowers. If, in the judgment of management, anaccount requires the expertise of specialists in workouts andrestructurings, it will be transferred to a separate group withinGlobal Risk Management for monitoring and resolution.Internal audit conducts periodic reviews of credit risk manage-ment processes as well as reviews of a sample of individualcredits from the various portfolios.
Banking units and Global Risk Management review thevarious segments of the credit portfolio across the organizationon a regular basis to assess whether economic trends or specificevents may affect the quality of the portfolio and determinewhether corrective action needs to be taken. These reviewsinclude the examination of the risk to particular industries andcountries. The results of these reviews are reported to the RiskPolicy Committee and, when significant, the Board of Directors.The Risk Policy Committee makes recommendations to theBoard to adjust limits to various industries and countries.
CONSUMER
The decision-making process for consumer and small businesscredits is intended to ensure that credit risks are adequatelyassessed, properly approved, continually monitored and activelymanaged. Generally, decisions on consumer credits are basedon risk ratings, which are generated using predictive creditscoring models. Individual credit requests are processed byindustry-leading adjudication software.
The Bank’s credit adjudication and portfolio managementmethodologies are designed to ensure consistent underwritingand early identification of problem loans. The Bank’s rigorouscredit underwriting methodology and risk modelling in Canadais customer rather than product focused. We believe that acustomer-centric approach provides better risk assessment thanproduct-based approaches, and should result in lower loanlosses over time. Our adjudication software calculates themaximum debt for which the customer qualifies. This allowscustomers to choose the products that satisfy all of their creditneeds.
All significant credit scoring and policy changes proposedby the business line require analysis and recommendation byGlobal Risk Management, which is independent of the businessline, and approval by the appropriate Senior Credit Committee.All credit scoring models are subject to ongoing validation andindependent review by Global Risk Management.
Consumer credit portfolios are reviewed monthly to deter-mine emerging trends in credit quality and to assess whethercorrective action is required. Internal audit conducts periodicreviews of the risk management process.
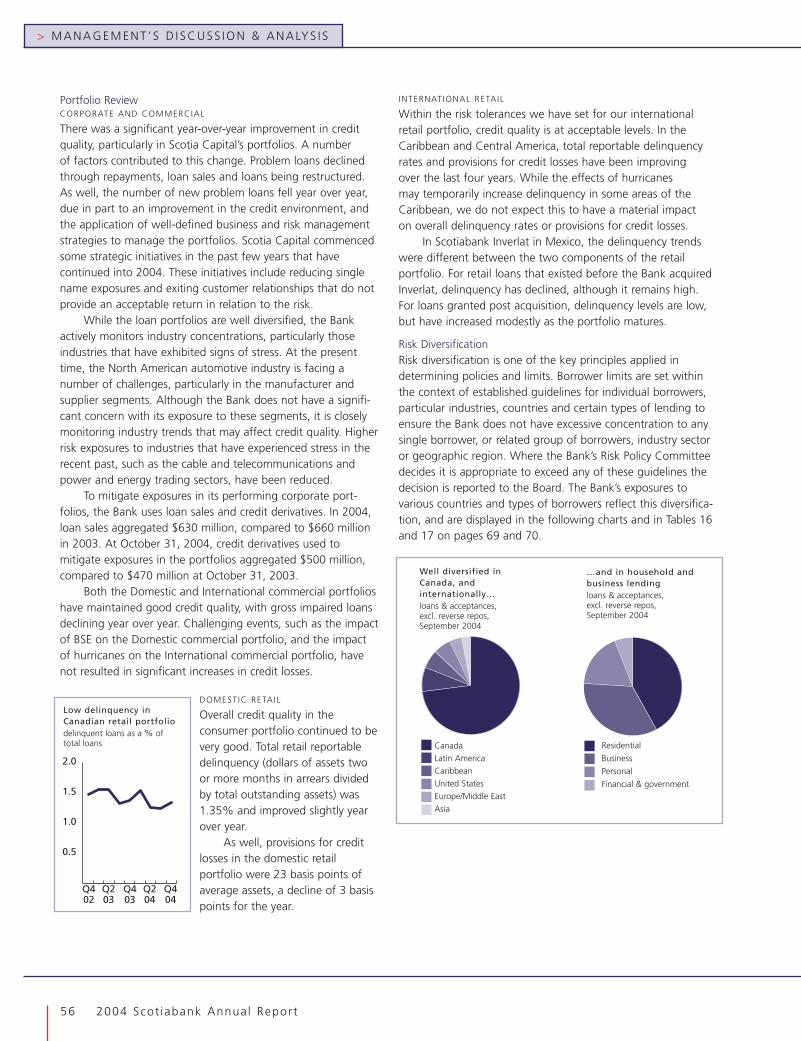
> MANAGEMENT ’ S D I SCUSS ION & ANALYS I S
56 2004 Scot iabank Annual Report
Portfolio ReviewCORPORATE AND COMMERCIAL
There was a significant year-over-year improvement in creditquality, particularly in Scotia Capital’s portfolios. A numberof factors contributed to this change. Problem loans declinedthrough repayments, loan sales and loans being restructured.As well, the number of new problem loans fell year over year,due in part to an improvement in the credit environment, andthe application of well-defined business and risk managementstrategies to manage the portfolios. Scotia Capital commencedsome strategic initiatives in the past few years that havecontinued into 2004. These initiatives include reducing singlename exposures and exiting customer relationships that do notprovide an acceptable return in relation to the risk.
While the loan portfolios are well diversified, the Bankactively monitors industry concentrations, particularly thoseindustries that have exhibited signs of stress. At the presenttime, the North American automotive industry is facing anumber of challenges, particularly in the manufacturer andsupplier segments. Although the Bank does not have a signifi-cant concern with its exposure to these segments, it is closelymonitoring industry trends that may affect credit quality. Higherrisk exposures to industries that have experienced stress in therecent past, such as the cable and telecommunications andpower and energy trading sectors, have been reduced.
To mitigate exposures in its performing corporate port-folios, the Bank uses loan sales and credit derivatives. In 2004,loan sales aggregated $630 million, compared to $660 millionin 2003. At October 31, 2004, credit derivatives used tomitigate exposures in the portfolios aggregated $500 million,compared to $470 million at October 31, 2003.
Both the Domestic and International commercial portfolioshave maintained good credit quality, with gross impaired loansdeclining year over year. Challenging events, such as the impactof BSE on the Domestic commercial portfolio, and the impactof hurricanes on the International commercial portfolio, havenot resulted in significant increases in credit losses.
DOMESTIC RETAIL
Overall credit quality in theconsumer portfolio continued to bevery good. Total retail reportabledelinquency (dollars of assets twoor more months in arrears dividedby total outstanding assets) was1.35% and improved slightly yearover year.
As well, provisions for creditlosses in the domestic retailportfolio were 23 basis points ofaverage assets, a decline of 3 basispoints for the year.
INTERNATIONAL RETAIL
Within the risk tolerances we have set for our internationalretail portfolio, credit quality is at acceptable levels. In theCaribbean and Central America, total reportable delinquencyrates and provisions for credit losses have been improvingover the last four years. While the effects of hurricanesmay temporarily increase delinquency in some areas of theCaribbean, we do not expect this to have a material impacton overall delinquency rates or provisions for credit losses.
In Scotiabank Inverlat in Mexico, the delinquency trendswere different between the two components of the retailportfolio. For retail loans that existed before the Bank acquiredInverlat, delinquency has declined, although it remains high.For loans granted post acquisition, delinquency levels are low,but have increased modestly as the portfolio matures.
Risk DiversificationRisk diversification is one of the key principles applied indetermining policies and limits. Borrower limits are set withinthe context of established guidelines for individual borrowers,particular industries, countries and certain types of lending toensure the Bank does not have excessive concentration to anysingle borrower, or related group of borrowers, industry sectoror geographic region. Where the Bank’s Risk Policy Committeedecides it is appropriate to exceed any of these guidelines thedecision is reported to the Board. The Bank’s exposures tovarious countries and types of borrowers reflect this diversifica-tion, and are displayed in the following charts and in Tables 16and 17 on pages 69 and 70.
Well diversified inCanada, andinternationally…loans & acceptances,excl. reverse repos,September 2004
Canada
Latin America
Caribbean
United States
Europe/Middle East
Asia
…and in household andbusiness lendingloans & acceptances,excl. reverse repos,September 2004
Residential
Business
Personal
Financial & government
0.5
1.0
1.5
2.0
Q402
Q203
Q403
Q204
Q404
Low delinquency inCanadian retail portfoliodelinquent loans as a % oftotal loans
2004 Scot iabank Annual Report 57
> MANAGEMENT ’ S D I SCUSS ION & ANALYS I S
Market Risk
Market risk is the risk of loss due to changes in interest rates,foreign currency rates, credit spreads, equity and commodityprices and market volatility. Market risk exists in the Bank’sfunding, investment and trading activities.
Market Risk Management ProcessesMarket risk exposures are managed within the framework ofstrategies, policies and limits that are approved by the Board ofDirectors. The Board reviews and approves these policies andrisk limits annually, and receives regular reports on risk expo-sures and performance covering various lines of business.
The Liability Committee (LCO) and the Market RiskManagement and Policy Committee (MRMPC) provide seniormanagement oversight of the Bank’s market risk exposures. TheLCO is primarily focused on asset liability management, whichincludes funding and investment activities. The MRMPC isresponsible for the approval of new products, limits and practicesfor trading, funding and investment activities and monitoring riskexposures. All market risk limits are reviewed at least annually.
Global Risk Management provides independent oversight ofall significant market risks. In conjunction with other supportunits, Global Risk Management develops and monitors variousrisk measures and provides reports on market risk to seniormanagement and the Board. Global Risk Management developsmarket risk policies, including valuation policies. Internal Auditconducts periodic reviews of market risk management processes.
Risk Measurement TechniquesThe Bank uses a variety of metrics to measure and control therisk it assumes in its various activities. The measurements usedare selected based on an assessment of the nature of risks in aparticular activity. Limits are then set for those measurementsthat have been determined to best control the amount of riskthat can be taken. There are various limits at the product, port-folio, business unit and business line levels, and for the Bank intotal. Set out below is a description of some of the key riskmeasures employed.
VALUE AT R ISK
Value at risk (VAR) is an estimate, within a given level of statis-tical confidence, of the potential for loss of value that couldresult from holding a position for a specified period of time. Fortrading books, VAR is calculated daily at a 99% confidencelevel, for a one-day holding period, using historical simulationsbased on 300 days of market data. The quality of the Bank’sVAR is validated by ongoing backtesting analysis, in which theVAR is compared to hypothetical and actual profit and lossresults. VAR is also used to evaluate risks arising in certainfunding and investment portfolios.
STRESS TEST ING
VAR measures potential losses in normally active markets. Stresstesting examines the impact that abnormally large swings inmarket factors and periods of prolonged inactivity might have
on trading portfolios. The stress-testing program is designed toidentify key risks and ensure that the Bank’s capital can easilyabsorb potential losses from abnormal events. The Banksubjects its trading portfolios to over 50 stress tests on a dailybasis, and over 200 stress tests on a monthly basis. From timeto time, the Bank also evaluates risk in its investment portfolios,using stress tests based on specific market events.
SENSIT IV ITY ANALYSIS AND S IMULATION MODELL ING
Sensitivity analysis assesses the effect of changes in interestrates on current earnings and on the economic value of assetsand liabilities. It is applied globally to each of the major curren-cies within the Bank’s operations. Simulation models enable theBank to assess interest rate risk under a variety of scenarios overtime. The models incorporate assumptions about growth,planned business mix, changes in interest rates, shape of theyield curve, embedded product options, maturities and otherfactors. Simulation modeling under various scenarios is partic-ularly important for managing risk in the deposit, lending andinvestment products the Bank offers to its retail customers.
GAP ANALYSIS
Gap analysis is used to assess the interest rate sensitivity of theBank’s retail, wholesale banking and international operations.Under gap analysis, interest rate sensitive assets, liabilities andoff-balance sheet instruments are assigned to defined timeperiods on the basis of expected re-pricing dates. A liability gapoccurs when more liabilities than assets are subject to interestrate changes during a given time period. Conversely, an assetsensitive position arises when more assets than liabilities aresubject to rate changes.
Funding and Investment ActivitiesThe Bank’s asset liability management processes focus on identi-fying, measuring and controlling the market risks arising in theBank’s funding and investment activities. The LiabilityCommittee meets weekly to review risks and opportunities, andto evaluate performance.
INTEREST RATE R ISK
Interest rate risk arises from the impact that changes in interestrates may have on income and economic value due to themismatch between positions that are subject to interest rateadjustment within a specified period.
The Bank actively manages its interest rate exposures withthe objective of enhancing net interest income within prudentrisk tolerances. Interest rate risk arising from the Bank’s fundingand investment activities is managed in accordance withBoard-approved policies and global limits, which are designedto control the risk to annual income and economic value. Theannual income limit measures the effect of a specified shift ininterest rates on the Bank’s net income, while the economicvalue limit measures the impact of a specified change in interestrates on the present value of the Bank’s net assets. Interest rateexposures in individual currencies are also controlled by gap
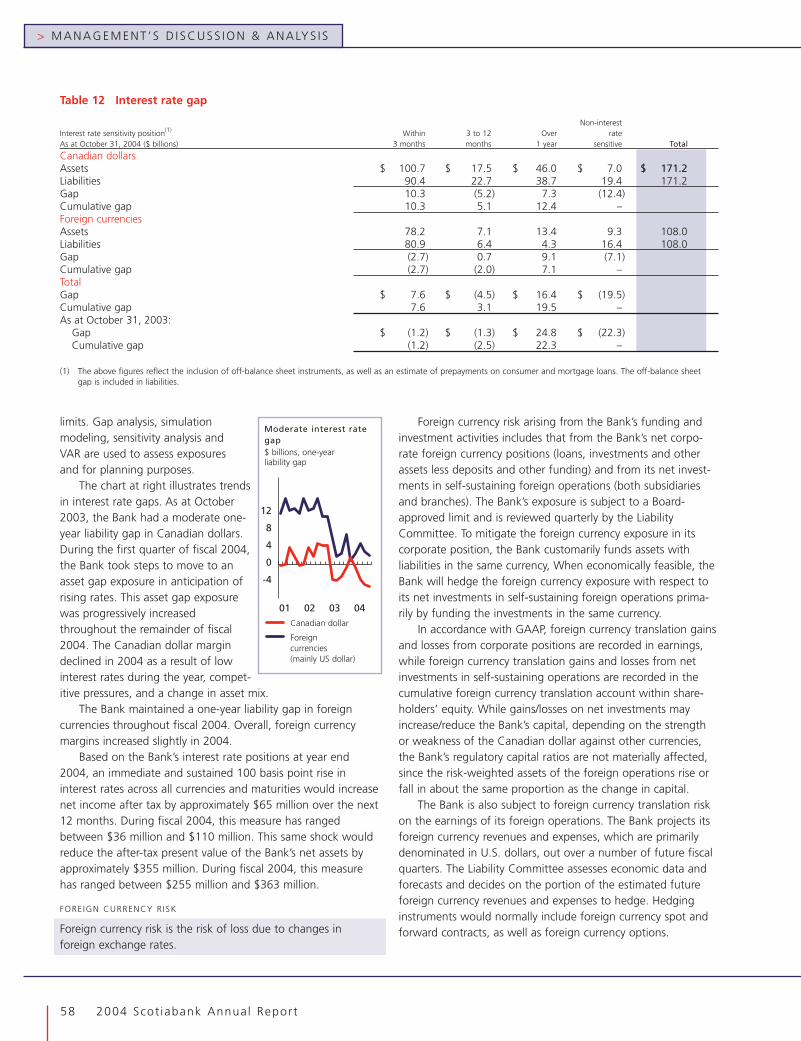
> MANAGEMENT ’ S D I SCUSS ION & ANALYS I S
58 2004 Scot iabank Annual Report
limits. Gap analysis, simulationmodeling, sensitivity analysis andVAR are used to assess exposuresand for planning purposes.
The chart at right illustrates trendsin interest rate gaps. As at October2003, the Bank had a moderate one-year liability gap in Canadian dollars.During the first quarter of fiscal 2004,the Bank took steps to move to anasset gap exposure in anticipation ofrising rates. This asset gap exposurewas progressively increasedthroughout the remainder of fiscal2004. The Canadian dollar margindeclined in 2004 as a result of lowinterest rates during the year, compet-itive pressures, and a change in asset mix.
The Bank maintained a one-year liability gap in foreigncurrencies throughout fiscal 2004. Overall, foreign currencymargins increased slightly in 2004.
Based on the Bank’s interest rate positions at year end2004, an immediate and sustained 100 basis point rise ininterest rates across all currencies and maturities would increasenet income after tax by approximately $65 million over the next12 months. During fiscal 2004, this measure has rangedbetween $36 million and $110 million. This same shock wouldreduce the after-tax present value of the Bank’s net assets byapproximately $355 million. During fiscal 2004, this measurehas ranged between $255 million and $363 million.
FOREIGN CURRENCY R ISK
Foreign currency risk is the risk of loss due to changes inforeign exchange rates.
Foreign currency risk arising from the Bank’s funding andinvestment activities includes that from the Bank’s net corpo-rate foreign currency positions (loans, investments and otherassets less deposits and other funding) and from its net invest-ments in self-sustaining foreign operations (both subsidiariesand branches). The Bank’s exposure is subject to a Board-approved limit and is reviewed quarterly by the LiabilityCommittee. To mitigate the foreign currency exposure in itscorporate position, the Bank customarily funds assets withliabilities in the same currency, When economically feasible, theBank will hedge the foreign currency exposure with respect toits net investments in self-sustaining foreign operations prima-rily by funding the investments in the same currency.
In accordance with GAAP, foreign currency translation gainsand losses from corporate positions are recorded in earnings,while foreign currency translation gains and losses from netinvestments in self-sustaining operations are recorded in thecumulative foreign currency translation account within share-holders’ equity. While gains/losses on net investments mayincrease/reduce the Bank’s capital, depending on the strengthor weakness of the Canadian dollar against other currencies,the Bank’s regulatory capital ratios are not materially affected,since the risk-weighted assets of the foreign operations rise orfall in about the same proportion as the change in capital.
The Bank is also subject to foreign currency translation riskon the earnings of its foreign operations. The Bank projects itsforeign currency revenues and expenses, which are primarilydenominated in U.S. dollars, out over a number of future fiscalquarters. The Liability Committee assesses economic data andforecasts and decides on the portion of the estimated futureforeign currency revenues and expenses to hedge. Hedginginstruments would normally include foreign currency spot andforward contracts, as well as foreign currency options.
-4
0
4
8
12
030201 04
Moderate interest rategap$ billions, one-yearliability gap
Canadian dollar
Foreigncurrencies(mainly US dollar)
Table 12 Interest rate gap
Non-interestInterest rate sensitivity position(1) Within 3 to 12 Over rateAs at October 31, 2004 ($ billions) 3 months months 1 year sensitive Total
Canadian dollarsAssets $ 100.7 $ 17.5 $ 46.0 $ 7.0 $ 171.2Liabilities 90.4 22.7 38.7 19.4 171.2Gap 10.3 (5.2) 7.3 (12.4)Cumulative gap 10.3 5.1 12.4 –Foreign currenciesAssets 78.2 7.1 13.4 9.3 108.0Liabilities 80.9 6.4 4.3 16.4 108.0Gap (2.7) 0.7 9.1 (7.1)Cumulative gap (2.7) (2.0) 7.1 –TotalGap $ 7.6 $ (4.5) $ 16.4 $ (19.5)Cumulative gap 7.6 3.1 19.5 –As at October 31, 2003:
Gap $ (1.2) $ (1.3) $ 24.8 $ (22.3)Cumulative gap (1.2) (2.5) 22.3 –
(1) The above figures reflect the inclusion of off-balance sheet instruments, as well as an estimate of prepayments on consumer and mortgage loans. The off-balance sheetgap is included in liabilities.

2004 Scot iabank Annual Report 59
> MANAGEMENT ’ S D I SCUSS ION & ANALYS I S
However, recent changes to hedge accounting standards,effective November 1, 2003, have made it more difficult toachieve hedge accounting treatment for these economichedges. Consequently, this has the potential for a mismatch inthe timing of the recognition of economic hedge gains/losseswith the underlying foreign earnings translation losses/gains.
The translation effect of the strengthening of the Canadiandollar on the Bank’s earnings is summarized on page 33. In theabsence of hedging activity, a one per cent increase (decrease)in the Canadian dollar against all the currencies in which weoperate, decreases (increases) our earnings by approximately$23 million before tax. A similar change in the Canadian dollarwould decrease (increase) the foreign currency translationaccount in shareholder’s equity by approximately $70 million.
INVESTMENT PORTFOLIO R ISKS
The Bank holds investment portfolios for liquidity, longer-termcapital appreciation or attractive after-tax yields. These port-folios expose the Bank to interest rate, credit spread and equityrisk. Debt investments primarily consist of government andcorporate bonds. Equity investments include common andpreferred shares, as well as a diversified portfolio of third-partymanaged funds. The majority of these securities are valuedusing prices obtained from external sources. These portfoliosare subject to a Board-approved policy and limits.
As at October 31, 2004, the market value of the Bank’sinvestment securities portfolio was a substantial $1,048 millionover book value, compared to a $703 million surplus over bookvalue at the end of fiscal 2003. The majority of this increaserelated to the Bank’s unrealized gain on its investment holdingin Shinsei Bank.
Trading ActivitiesTrading is primarily customer focused, but also includes aproprietary component. Scotiabank’s policies, processes andcontrols for trading activities are designed to achieve a balancebetween pursuing profitable trading opportunities and
managing earnings volatility within a framework of sound andprudent practices.
The Board of Directors annually approves aggregate VARand stress testing limits for the Bank’s trading portfolios, andreviews the results quarterly. Within the policy and limit frame-work established by the Board, the Market Risk Managementand Policy Committee establishes detailed trading policies,product and risk limits, including VAR limits by business line.
The Bank’s independent risk management units develop,execute and analyze stress testing, sensitivity analysis, VARcalculations and valuation processes, and review and participatein new product development. Models that are used for financialreporting or limit monitoring are independently validated priorto implementation and are subject to formal periodic review.
Trading positions are marked to market daily in accordancewith valuation policies established by Global Risk Management.Valuations are independently reviewed by back office or riskmanagement units on a regular basis. These units provideprofit and loss reporting, as well as VAR and limit compliancereporting to business unit management and executive manage-ment for evaluation and action where appropriate.
In fiscal 2004, the one-day VAR for trading activitiesaveraged $8.8 million, compared to $9.0 million in 2003.
The histogram below shows the distribution of daily tradingrevenue for fiscal 2004. Trading revenue averaged $3.0 millionper day, compared to $3.1 million for 2003. Revenue waspositive on more than 92% of trading days during the year,compared to 89% in 2003.
During the year, the largest single day loss was $7.3 million.This was the result of a significant decline in interest rates onAugust 6, 2004.
The following table shows the VAR by risk factor. Interestrate exposure has increased from an average of $5.7 millionin fiscal 2003 to $7.9 million in fiscal 2004, offset by declinesin the average foreign exchange and equity risk factors.
-6-7 -2-4 0 2 4 6 8 10 120
5
10
15
20
25
30
35
40
45
no.
of d
ays
$ millions
Low variability of trading revenuesperiod ending October 31, 2004
Q1 Q2 Q3 Q4-20
-15
-10
-5
0
5
10
15
Daily trading revenue vs. Value at Risk$ millions, November 1, 2003, to October 31, 2004
Actual P&LVAR, 99%, 1 day holding periodGain
Neutral
Loss
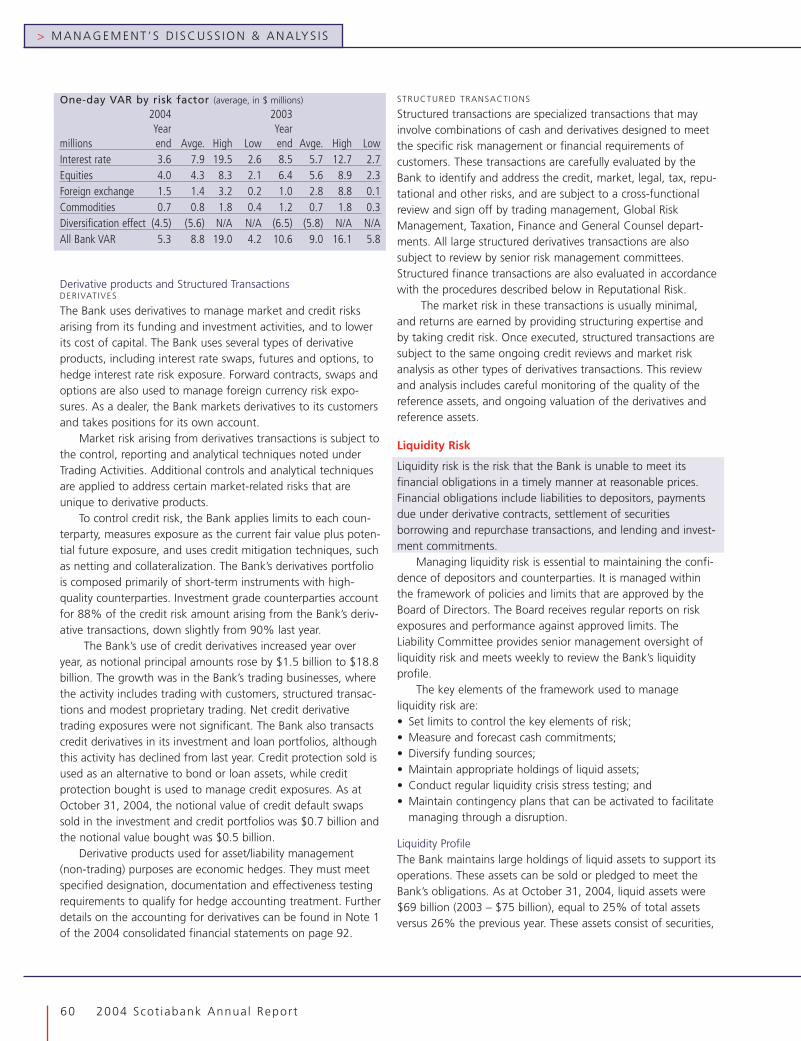
> MANAGEMENT ’ S D I SCUSS ION & ANALYS I S
60 2004 Scot iabank Annual Report
One-day VAR by risk factor (average, in $ millions)
2004 2003Year Year
millions end Avge. High Low end Avge. High LowInterest rate 3.6 7.9 19.5 2.6 8.5 5.7 12.7 2.7Equities 4.0 4.3 8.3 2.1 6.4 5.6 8.9 2.3Foreign exchange 1.5 1.4 3.2 0.2 1.0 2.8 8.8 0.1Commodities 0.7 0.8 1.8 0.4 1.2 0.7 1.8 0.3Diversification effect (4.5) (5.6) N/A N/A (6.5) (5.8) N/A N/AAll Bank VAR 5.3 8.8 19.0 4.2 10.6 9.0 16.1 5.8
Derivative products and Structured TransactionsDERIVATIVES
The Bank uses derivatives to manage market and credit risksarising from its funding and investment activities, and to lowerits cost of capital. The Bank uses several types of derivativeproducts, including interest rate swaps, futures and options, tohedge interest rate risk exposure. Forward contracts, swaps andoptions are also used to manage foreign currency risk expo-sures. As a dealer, the Bank markets derivatives to its customersand takes positions for its own account.
Market risk arising from derivatives transactions is subject tothe control, reporting and analytical techniques noted underTrading Activities. Additional controls and analytical techniquesare applied to address certain market-related risks that areunique to derivative products.
To control credit risk, the Bank applies limits to each coun-terparty, measures exposure as the current fair value plus poten-tial future exposure, and uses credit mitigation techniques, suchas netting and collateralization. The Bank’s derivatives portfoliois composed primarily of short-term instruments with high-quality counterparties. Investment grade counterparties accountfor 88% of the credit risk amount arising from the Bank’s deriv-ative transactions, down slightly from 90% last year.
The Bank’s use of credit derivatives increased year overyear, as notional principal amounts rose by $1.5 billion to $18.8billion. The growth was in the Bank’s trading businesses, wherethe activity includes trading with customers, structured transac-tions and modest proprietary trading. Net credit derivativetrading exposures were not significant. The Bank also transactscredit derivatives in its investment and loan portfolios, althoughthis activity has declined from last year. Credit protection sold isused as an alternative to bond or loan assets, while creditprotection bought is used to manage credit exposures. As atOctober 31, 2004, the notional value of credit default swapssold in the investment and credit portfolios was $0.7 billion andthe notional value bought was $0.5 billion.
Derivative products used for asset/liability management(non-trading) purposes are economic hedges. They must meetspecified designation, documentation and effectiveness testingrequirements to qualify for hedge accounting treatment. Furtherdetails on the accounting for derivatives can be found in Note 1of the 2004 consolidated financial statements on page 92.
STRUCTURED TRANSACTIONS
Structured transactions are specialized transactions that mayinvolve combinations of cash and derivatives designed to meetthe specific risk management or financial requirements ofcustomers. These transactions are carefully evaluated by theBank to identify and address the credit, market, legal, tax, repu-tational and other risks, and are subject to a cross-functionalreview and sign off by trading management, Global RiskManagement, Taxation, Finance and General Counsel depart-ments. All large structured derivatives transactions are alsosubject to review by senior risk management committees.Structured finance transactions are also evaluated in accordancewith the procedures described below in Reputational Risk.
The market risk in these transactions is usually minimal,and returns are earned by providing structuring expertise andby taking credit risk. Once executed, structured transactions aresubject to the same ongoing credit reviews and market riskanalysis as other types of derivatives transactions. This reviewand analysis includes careful monitoring of the quality of thereference assets, and ongoing valuation of the derivatives andreference assets.
Liquidity Risk
Liquidity risk is the risk that the Bank is unable to meet itsfinancial obligations in a timely manner at reasonable prices.Financial obligations include liabilities to depositors, paymentsdue under derivative contracts, settlement of securitiesborrowing and repurchase transactions, and lending and invest-ment commitments.
Managing liquidity risk is essential to maintaining the confi-dence of depositors and counterparties. It is managed withinthe framework of policies and limits that are approved by theBoard of Directors. The Board receives regular reports on riskexposures and performance against approved limits. TheLiability Committee provides senior management oversight ofliquidity risk and meets weekly to review the Bank’s liquidityprofile.
The key elements of the framework used to manageliquidity risk are:• Set limits to control the key elements of risk;• Measure and forecast cash commitments;• Diversify funding sources;• Maintain appropriate holdings of liquid assets;• Conduct regular liquidity crisis stress testing; and• Maintain contingency plans that can be activated to facilitate
managing through a disruption.
Liquidity ProfileThe Bank maintains large holdings of liquid assets to support itsoperations. These assets can be sold or pledged to meet theBank’s obligations. As at October 31, 2004, liquid assets were$69 billion (2003 – $75 billion), equal to 25% of total assetsversus 26% the previous year. These assets consist of securities,

2004 Scot iabank Annual Report 61
> MANAGEMENT ’ S D I SCUSS ION & ANALYS I S
75% (2003 – 73%), and cash and deposits with banks,25% (2003 – 27%). The year-over-year decline in liquid assetsis due to lower balances of Government of Canada and otherdebt securities and deposits with other banks, partially offsetby an increase in equity securities.
In the course of the Bank’s day-to-day activities, securitiesand other assets are pledged to secure an obligation, partici-pate in clearing or settlement systems, or operate in a foreignjurisdiction. Securities may also be sold under repurchase agree-ments. As at October 31, 2004, total assets pledged or soldunder repurchase agreements were $33 billion (2003 – $44billion). The year-over-year decline is attributable primarily to areduced level of securities sold under repurchase agreements.
FundingScotiabank relies on a broad rangeof funding sources. The principalsources of funding are capital,deposits drawn from retail andcommercial clients in the Bank’sextensive domestic and interna-tional branch network, and whole-sale funding. To ensure that theBank does not place undue relianceon a single entity as a fundingsource, the Bank maintains a limiton the amount of deposits it willaccept from any one entity. Corefunds, represented by capital and core deposits of the Bank’sretail and commercial clients, were $146 billion as at October31, 2004, versus $137 billion last year. This increase arosefrom higher retail and commercial deposits. As at October 31,2004, the Bank’s core funds represented 52% of total funding(2003 – 48%).
Contractual ObligationsThe table below provides aggregated information about theBank’s contractual obligations at October 31, 2004, whichaffect the Bank’s liquidity and capital resource needs. TheBank’s contractual obligations include contracts and purchaseobligations, including agreements to purchase goods and serv-ices, that are enforceable and legally binding on the Bank. Thetable excludes deposit liabilities (except term funding), othershort-term financing arrangements, lending commitments andpension and other retirement benefit obligations, which arediscussed in Notes 9, 21, 20 and 16, respectively, of the 2004consolidated financial statements.
Contractual Obligations
($ millions) 1 year 1-3 years 4-5 years 5 years Total
Term funding
Wholesale deposit notes 4,368 3,945 3,754 645 12,712
Euro MTN 2,768 3,813 473 – 7,054
Subordinated debentures – – 305 2,310 2,615
Other long-term liabilities 290 385 – 1,188 1,863
Subtotal 7,426 8,143 4,532 4,143 24,244
Operating leases 162 221 135 172 690
Outsourcing obligations 165 329 186 468 1,148
Total 7,753 8,693 4,853 4,783 26,082
The Bank has a number of note issuance programs tobroaden its base of term funding. In 2004, the Bank issued$2,156 million in euro medium-term notes, $5,112 million indeposit notes in the domestic market, and $603 million ofYankee certificates of deposit and other instruments.
The Bank issues subordinated debentures as part of itscapital management program. In 2004, there was no changein the debentures issued and outstanding.
Other long-term liabilities include transactions wherethe Bank is the paying agent on customer lease transactions,and term financing bonds in the Bank’s foreign subsidiaries.
30
60
90
120
150
0400 01 02 03
Substantial core funds$ billions, October 31
Table 13 Liquidity
For the fiscal years ($ millions) 2004 2003 2002 2001 2000
Canadian dollar liquid assetsCash and deposits with Bank of Canada $ 356 $ 647 $ 868 $ 1,062 $ 648Deposits with other banks 1,255 1,382 686 1,124 1,131Securities 32,211 34,234 30,310 25,284 22,129Call and short loans – – – – –
33,822 36,263 31,864 27,470 23,908Foreign currency liquid assetsCash and deposits with Bank of Canada 2,624 2,388 2,370 2,147 1,598Deposits with other banks 12,920 16,163 16,348 15,827 15,368Securities 19,344 20,254 16,194 17,702 12,058Call and short loans – – – 291 –
34,888 38,805 34,912 35,967 29,024Total liquid assetsCash and deposits with Bank of Canada 2,980 3,035 3,238 3,209 2,246Deposits with other banks 14,175 17,545 17,034 16,951 16,499Securities 51,555 54,488 46,504 42,986 34,187Call and short loans – – – 291 –
$ 68,710 $ 75,068 $ 66,776 $ 63,437 $ 52,932Liquid assets as a % of total assets 24.6% 26.3% 22.5% 22.3% 20.9%
Within Over

> MANAGEMENT ’ S D I SCUSS ION & ANALYS I S
62 2004 Scot iabank Annual Report
The Bank leases a large number of its branches, office andother locations. The vast majority of these leases are for a term offive years, with an option to renew. The total cost of these leases,net of rental income from subleases, was $170 million in 2004.
The Bank has entered into two major outsourcing contracts.The largest is a seven-year contract with IBM Canada enteredinto in 2001 to manage the Bank’s domestic computer opera-tions, including data centres, branches, ABMs and desktopcomputers. The second is a three-year contract, with twooptional five-year renewals, entered into in 2003 with SymcorInc. to manage the Bank’s cheque and bill payment processing,including associated statement and report printing activitiesacross Canada. Both outsourcing contracts are cancellablewith notice.
Capital CommitmentsScotiabank has an ongoing program of capital investmentto provide the necessary level of technology and real estateresources to service our customers and meet new productrequirements. All major capital expenditures go through arigorous review and approval process.
Total capital expenditures were $158 million in 2004,comparable with 2003. Of this, 41% was in technology-relatedspending, particularly for upgraded telecommunicationsequipment, new ABMs and computer hardware. Real estatespending comprised the remaining 59% of capital expendituresfor 19 new branches and offices, and the renovation orexpansion of existing locations.
Operational RiskOperational risk is the risk of loss, whether direct or indirect, towhich the Bank is exposed due to external events, human error,or the inadequacy or failure of processes, procedures orcontrols. Operational risk, in some form, exists in each of theBank’s business and support activities. Operational risk canresult in financial loss, regulatory sanctions and damage tothe Bank’s reputation.
The Bank has developed policies, standards andassessment methodologies to ensure that operational riskis appropriately identified, managed and controlled withineach business line. The key policies and standards include:• An operational risk management policy approved by the
Board of Directors;• Processes to identify and assess operational risks in relation
to changes to products and systems and new initiatives;• Defined and documented approval authorities;• Appropriate segregation of duties and delegated authority;• Compliance programs to ensure the Bank’s adherence to
regulatory requirements;• A business continuity planning process, including business
resumption plans for all key operations, and appropriateback-up facilities to ensure the availability of service delivery;and
• Risk mitigation through insurance, where feasible andappropriate.
In addition to the policies and standards outlined above,the internal audit department, through regular risk-basedaudits, provides independent, objective assessment thatcontrols and operating processes are properly designed andoperating effectively.
The Bank has a central operational risk managementunit, which is part of Global Risk Management. This unit isresponsible for:• Defining, developing, recommending and, in conjunction
with business and support units, implementing high-leveloperational risk policies;
• Collecting data on operational losses and providing reportingto executive and line management;
• Operating a guided self-assessment program; and• Reviewing industry best practices and regulatory require-
ments, and providing guidance to business units with respectto these issues.
The central operational risk management unit isresponsible for the guided self-assessment program, whichentails reviews of significant operations to identify and assessoperational risks. Where appropriate, line managementdevelops action plans to mitigate identified risks. Resultsof these reviews are summarized and reported to executivemanagement.
2004 Scot iabank Annual Report 63
> MANAGEMENT ’ S D I SCUSS ION & ANALYS I S
Reputational RiskReputational risk is the risk that negative publicity regarding theBank’s business practices, whether true or not, will adverselyaffect the Bank’s operations or customer base, or will requirecostly litigation or other defensive measures.
Negative publicity about an institution’s business practicesmay involve any aspect of its operations but usually relates toquestions of business ethics and integrity, or quality of productsand services. Negative publicity and attendant reputational riskfrequently arise as a by-product of some other kind of riskmanagement control failure.
Reputational risk is managed and controlled throughoutthe Bank by codes of conduct, governance practices and riskmanagement programs, policies, procedures and training. Manyrelevant checks and balances are outlined in greater detailunder other risk management sections, particularly OperationalRisk, where reference is made to the Bank’s well-establishedcompliance program. All directors, officers and employees havea responsibility to conduct their activities in accordance withthe Scotiabank Guidelines for Business Conduct and in amanner that minimizes reputational risk. The activities of theGeneral Counsel, Corporate Secretary, Public, Corporate &Government Affairs and Compliance departments, and theBank’s Reputational Risk Committee, are particularly oriented tothe management of reputational risk.
In providing credit or advice to customers, the Bankconsiders whether the transaction or relationship might giverise to reputational risk. The Bank has an established Board-approved policy and procedures for managing reputational andlegal risk relative to structured finance transactions. As well, theReputational Risk Committee is available to support other riskmanagement committees and business units with their assess-ment of reputational risk associated with complex products andtransactions.
To ensure that the Bank enters into transactions that are,and will be seen to be, congruent with high ethical standards,the committee considers a broad array of factors whenassessing transactions including: the extent, and outcome, oflegal and regulatory due diligence pertinent to the transaction;the economic intent of the transaction; the effect of the trans-action on the transparency of a customer’s financial reporting;the need for customer or public disclosure; conflict of interest;fairness issues; and public perception.
The committee may impose conditions on customer trans-actions, including customer disclosure requirements to promotetransparency in financial reporting, to ensure that transactionsmeet Bank standards. In the event the committee recommendsnot proceeding with a transaction and the sponsor of the trans-action wishes to proceed, the transaction is referred to the RiskPolicy Committee.
Environmental RiskEnvironmental risk refers to the possibility that environmentalconcerns involving the Scotiabank Group or its customers couldaffect the Bank’s financial performance. To safeguard the Bankand the interests of its stakeholders, Scotiabank implementedan environmental policy in 1991 which, with Board approval,has been periodically updated. This policy – which guides ourday-to-day operations, lending practices, supplier agreementsand the management of our real estate holdings – is supple-mented by specific policies and practices relating to individualbusiness lines.
The Environmental Lending Policy, for example, ensuresappropriate consideration is given to environmental risks associ-ated with the business operations of each borrower. Suchconsiderations are factored into the Bank’s credit evaluationprocedures.
Environmental concerns also play a prominent role inshaping our real estate practices. The Real Estate Departmentadheres to an Environmental Compliance Policy to ensureresponsible management of the Bank’s real estate holdings.In addition, considerable recycling and resource managementprograms are in place in the Bank’s corporate offices andbranch networks.
To ensure it continues to operate in an environmentallyresponsible manner, the Bank monitors policy and legislativerequirements through ongoing dialogue with government,industry and stakeholders in countries where it operates.
For more information on Scotiabank’s environmentalpolicies and practices, please refer to our annual PublicAccountability Statement/Corporate Social ResponsibilityReport, which is also available online at www.scotiabank.com.
> MANAGEMENT ’ S D I SCUSS ION & ANALYS I S
64 2004 Scot iabank Annual Report
> C O N T R O L S A N D A C C O U N T I N G P O L I C I E S
Controls and ProceduresManagement’s responsibility for financial information containedin this Annual Report is described on page 84. In addition, theBank’s Audit and Conduct Review Committee of the Board ofDirectors has reviewed this Annual Report, and the Board ofDirectors has reviewed and approved this document prior to itsrelease. The Bank is committed to providing timely, accurateand balanced disclosure of all material information about theBank and to providing fair and equal access to such informa-tion. The Bank’s disclosure policies and practices are publishedon its website.
As of October 31, 2004, the Bank’s managementevaluated the effectiveness of the design and operation ofits disclosure controls and procedures, as defined under therules adopted by the U.S. Securities and Exchange Commission(SEC). This evaluation was performed under the supervision of,and with the participation of the Chief Executive Officer (CEO)and the Chief Financial Officer (CFO). In addition, the Bank’smanagement has assessed whether during the 2004 fiscal yearthere have been any significant changes in the Bank’s internalcontrol over financial reporting that have materially affected, orare reasonably likely to materially affect, the Bank’s internalcontrol over financial reporting.
Disclosure controls are procedures designed to ensure thatinformation required to be disclosed in reports filed with securi-ties regulatory agencies is recorded, processed, summarized andreported on a timely basis, and is accumulated and communi-cated to the Bank's management, including the CEO and theCFO, as appropriate, to allow timely decisions regardingrequired disclosure. Internal control over financial reportingis a process designed by, or under the supervision of, seniormanagement, to provide reasonable assurance regarding thereliability of financial reporting and preparation of the Bank'sconsolidated financial statements in accordance with Canadiangenerally accepted accounting principles.
The Bank's management, including the CEO and the CFO,does not expect that the Bank's disclosure controls or internalcontrol over financial reporting will prevent or detect allmisstatements due to error or fraud. Because of the inherentlimitations in all control systems, an evaluation of controls canprovide only reasonable, not absolute, assurance that all controlissues and instances of fraud or error, if any, within the Bankhave been detected.
Based on the evaluation of disclosure controls and assess-ment of changes in internal control over financial reporting, theCEO and the CFO have concluded that, subject to the inherentlimitations noted above:• the Bank's disclosure controls are effective in ensuring that
material information relating to the Bank, including itsconsolidated subsidiaries, is made known to management ona timely basis, and is fairly presented in all material respectsin this Annual Report; and
• during the 2004 fiscal year, to the best of their knowledgeand belief, there have been no changes in the Bank’s internalcontrol over financial reporting that have materially affected,or are reasonably likely to materially affect, the Bank’sinternal control over financial reporting.
The Bank is continually evolving and enhancing its systemsof controls and procedures. Based on current SEC rules, theCEO and CFO will be required to certify annually, commencingOctober 31, 2005, that they have evaluated the effectivenessof the design and operation of internal control over financialreporting and must provide an annual report on internal controlover financial reporting. The shareholders’ auditors will berequired to attest to and report on management’s assessment.A significant effort is under way to meet this new reportingrequirement.
Summary of Critical Accounting EstimatesThe Bank’s accounting policies are integral to understandingand interpreting the financial results reported in this AnnualReport. The significant accounting policies used in preparingthe Bank’s consolidated financial statements are summarizedin Note 1 to those statements. Certain of those policies areconsidered to be particularly important to the presentation ofthe Bank’s financial position and results of operations, becausethey require management to make difficult, complex or subjec-tive judgments and estimates, often as a result of matters thatare inherently uncertain. The following is a discussion of thosecritical accounting estimates. These estimates are adjusted in
the normal course to reflect changing underlying circum-stances. However, there were no significant adjustments tothese estimates, except as noted under Allowance for CreditLosses.
Allowance for credit lossesThe allowance for credit losses represents management’sestimate of the probable incurred losses inherent in the port-folio of deposits with banks, securities purchased under resaleagreements, loans, acceptances and other indirect creditcommitments, such as letters of credit and guarantees.Management undertakes regular reviews of credit quality to
2004 Scot iabank Annual Report 65
> MANAGEMENT ’ S D I SCUSS ION & ANALYS I S
determine the adequacy of the allowance for credit losses. Thisdetermination requires management to make difficult, complexor subjective judgments and estimates at many levels, includingidentifying credits that are impaired, considering factors specificto individual credits, as well as the impact of portfolio charac-teristics and risks. Changes to these estimates, or the use ofdifferent but also reasonable judgments and estimates, couldhave a direct impact on the provision for credit losses and couldresult in a change in the related allowance.
In determining specific allowances applicable to individualcredit exposures, management must first form a judgment as towhether a loan is impaired, and then as to its estimated netrealizable value, based on available evidence about the indi-vidual borrower. This process requires management to make anumber of significant judgments and estimates, including esti-mates as to the amount and timing of future cash flows, thefair value of any underlying security, costs of realization, observ-able market prices, and expectations about the future prospectsof the borrower and any guarantors.
Specific allowances for homogenous portfolios, includingcredit card loans, certain personal loans and certain interna-tional residential mortgages are determined on a group basis.This process involves estimating the probable losses inherent inthe portfolio, using a formula method that takes into accountrecent loss experience.
With the overall improved credit quality of the loan port-folio, management’s best estimate of losses on impaired loansresulted in a reduction in the specific provisions for credit lossesin 2004.
The general allowance is intended to estimate probableincurred losses inherent in the loan portfolio that have not yetbeen identified on an item-by-item basis. Many factors canaffect management’s estimate of the required level of thegeneral allowance, including historical default probabilities,loss severity in the event of default and exposure at default.The Bank applies estimates of these parameters in its internallydeveloped model to arrive at an initial quantitative estimate.If the probability of default or the loss severity parameters forthe non-retail portfolio were independently increased ordecreased by 10%, the model would indicate an increase ordecrease to the quantitative estimate of approximately $60million each.
Senior management forms a judgment as to whetheradjustments are necessary to the initially calculated amounts.Considerations include observable data, such as economictrends and business conditions, portfolio concentrations, riskmigrations and recent trends in volumes and severity of delin-quencies. The general allowance is reviewed each quarter toensure the amount is appropriate in relation to the size of theportfolio, inherent credit risks and trends in portfolio quality.
In the past year, the initial quantitative estimate hasdeclined due primarily to the lower levels of corporate andcommercial loans, and the improved credit quality of these
portfolios. The positive aspects of these factors were temperedby judgments made about the potential impact of rising energyprices and the substantial strengthening of the Canadian dollar.However, if there is sustained improvement in the credit qualityof the commercial and corporate loans, the general allowancemay be further reduced in 2005.
Fair value of financial instrumentsFinancial instruments held for trading purposes, includingtrading securities and derivatives, are carried at fair value, withchanges in fair value recorded in the income statement. Mosttrading securities are recorded at quoted market prices. Tradingderivatives, which include derivatives transacted with customersto accommodate their risk management needs and derivativesused to generate trading income from the Bank’s proprietarytrading positions, are recorded at quoted market prices, whereavailable. Where quoted market prices are not available, fairvalues are determined using other valuation techniques,including discounted cash flow and option pricing models thatare based on independently sourced market interest rate yieldcurves, foreign currency rates and option volatility factors. As atOctober 31, 2004, 97% of the gross fair value of trading deriv-atives is based primarily on internal models with significantobservable market parameters or quoted market prices. Fortrading securities, approximately 99% of the portfolio is fairvalued based on quoted market prices.
Management applies judgment in the selection of themodels and the various inputs, as well as in the determinationof any valuation adjustments to cover future risks and relatedcosts. Any imprecision in these estimates can affect therecorded fair value. However, the impact of any changes inthese estimates – for example, for model imprecision orliquidity – is not expected to be significant.
Other-than-temporary impairment of investment securitiesInvestment securities comprise debt and equity securities heldfor liquidity and longer-term investment. Investment securitiesare held at cost or, in the case of debt securities, at amortizedcost. In circumstances where management determines that another-than-temporary impairment of an investment security hasoccurred, the carrying value of the security is written down toits estimated net realizable value. This determination involves anumber of judgments and estimates.
Management’s judgment as to the existence of an other-than-temporary impairment takes into account the length oftime that the fair value of a security has been below its carryingvalue, prospects for recovery in fair value, and factors such asthe company’s financial condition and future prospects. Oncemanagement has determined that the security has suffered another-than-temporary decline in value, management must forma judgment as to the estimated net realizable value of the secu-rity. In making this estimate, management considers all of thedata gathered during the impairment evaluation process, as wellas the market liquidity and the Bank’s plans for the security.
> MANAGEMENT ’ S D I SCUSS ION & ANALYS I S
66 2004 Scot iabank Annual Report
As at October 31, 2004, the gross unrealized gains onindividual investment securities were $1,427 million, and thegross unrealized losses were $73 million, combining for a netunrealized gain of $1,354 million before related derivative andother hedge amounts ($1,048 after related derivative and otherhedge amounts). Management does not expect these losses tobe realized, as they have been judged to be temporary.
Pensions and other employee future benefitsThe Bank provides pension and other future benefit plans forqualified employees in Canada, the United States and otherinternational operations.
The cost of these employee future benefits is actuariallydetermined each year. The calculation uses management’s bestestimate of a number of assumptions, as discussed in Note 1 ofthe 2004 consolidated financial statements on page 90. Thecritical assumptions made by management are the long-termrate of investment return on plan assets, future compensationand health care costs. Management applies judgment in theselection of these assumptions, based on regular reviews ofhistorical investment returns, salary increases and health carecosts. Expectations regarding future economic trends and busi-ness conditions, including inflation rates, are also considered.
Actual experience will differ from the assumptions madeby management, resulting in a net actuarial gain or loss thatwill cause the benefit expense for future years to increase ordecrease. Rather than being recognized in income immediately,if the unrecognized net actuarial gain or loss is more than 10%of the greater of the plan assets or benefit obligation at thebeginning of the year, the excess above this 10% threshold isgenerally amortized into income over the estimated averageremaining service period of active employees ranging from11 to 20 years.
Management’s assumptions, along with a sensitivityanalysis of changes in these assumptions on both the benefitobligation and the benefit expense, are disclosed in Note 16 ofthe 2004 consolidated financial statements on page 107. Theassumption with the greatest sensitivity impact is the assumedlong-term rate of return on assets. If this assumed long-termrate of return on assets was 1% lower (higher), the benefitexpense for 2004 would have been $35 million higher (lower).Over the past 10-year period, the actual annualized rate ofreturn on the assets for the Bank’s main pension plan exceededthe assumed annualized rate by 3%, notwithstanding lowerreturns in recent years.
The discount rate is another critical assumption used tocalculate the cost of employee future benefits, though this rateis generally prescribed to be equal to the current yield on long-term, high-quality corporate bonds with a duration similar tothe duration of the benefit obligation. Thus, managementapplies very little judgment in selecting this rate.
Corporate income taxesThe provision for income taxes and future income tax assetsand liabilities represent management’s estimate of the incometax consequences of transactions and events during the period.In determining the accounting for income taxes, tax legislationin a variety of jurisdictions is interpreted and assumptions aremade about the expected timing of the reversal of temporarydifferences that result from the different treatment of items fortax and accounting purposes. In addition, the valuation offuture income tax assets related to tax loss carryforwardsrequires management to assess whether it is more likely thannot that benefits will be realized prior to expiration. Total grossfuture tax assets relating to subsidiaries’ unused income taxlosses arising in prior years were $180 million as at October 31,2004 (2003 – $295 million), for which the Bank established avaluation allowance of $84 million (2003 – $189 million) dueto the uncertainty in realizing these losses. These tax loss carry-forwards expire by 2006. The Bank will adjust the valuationallowance if and when there is greater certainty of realizing thisfuture asset.
The Bank’s total net future income tax asset, including thenet amount for tax loss carryforwards, was $999 million as atOctober 31, 2004 (2003 – $912 million). Note 1 on page 92of the 2004 consolidated financial statements contains furtherdetails on the significant accounting policies underlyingaccounting for income taxes, and Note 15 on page 105provides further information with respect to our provisionsfor income taxes.
2004 Scot iabank Annual Report 67
> MANAGEMENT ’ S D I SCUSS ION & ANALYS I S
Changes in accounting policiesThe Bank’s significant accounting policies are set out in Note 1on pages 90 to 94 of the 2004 consolidated financial state-ments. Included in Note 1 is a description of the changes toaccounting policies in 2004. These changes were a result ofnew accounting standards that were required to be adopted ona prospective basis in 2004.• The Bank adopted a new accounting guideline for hedging
relationships, issued by the CICA, which establishes morestringent and formalized conditions for the use of hedgeaccounting.
• Qualifying costs incurred on a prospective basis for computersoftware are capitalized and depreciated, rather than beingexpensed as incurred.
• The country risk allowance is no longer disclosed as part ofthe allowance for credit losses, but continues to be deductedfrom investment securities.
These accounting policy changes did not have a materialimpact on the Bank’s financial condition, results of operationsor changes in financial condition for fiscal 2004.
As well, in 2004 the Bank was required to change thebalance sheet presentation of certain types of cheques andother items in transit on a prospective basis, as a result of anew CICA standard for financial reporting that eliminated
industry practice as a source of generally accepted accountingprinciples. This change in balance sheet presentation was notmaterial to the Bank’s consolidated financial position, and alsoresulted in these items not being classified as part of cash andcash equivalents in the consolidated statement of cash flows asdiscussed more fully in footnote 2 on page 88 of the 2004consolidated financial statements.
There are two future accounting standard changes thatwill be effective for the Bank’s 2005 consolidated financialstatements:• The Bank will be required to consolidate variable interest
entities (VIEs) where the Bank is the primary beneficiary ofthe VIE. This accounting standard permits prospective appli-cation, which is the method of adoption that the Bank haschosen to apply.
• Certain financial instruments that have the characteristics ofa liability and equity, which are currently recorded as equity,will be retroactively classified as a liability and the compara-tive financial statements will be restated.
These future changes and the expected impact on theBank are described in greater detail in Note 2 on page 94 ofthe 2004 consolidated financial statements.
Related Party TransactionsIn the ordinary course of business, the Bank provides normalbanking services to its associated and other related corpora-tions on terms similar to those offered to non-related parties.
In Canada, loans are currently granted to directors andofficers at market terms and conditions. Effective March 1,2001, in Canada the Bank discontinued the prior practice ofgranting loans to officers and employees at reduced rates. Anyloans granted prior to March 1, 2001 are grandfathered untilmaturity. In some of the Bank’s foreign subsidiaries andbranches, in accordance with local practices and laws, loansmay be made available to officers of those foreign units atreduced rates or on preferred terms. Loans to executive officersof the Bank totaled $2.8 million as at October 31, 2004, andloans to directors totaled $0.5 million.
Directors can use some or all of their fees to buy commonshares at market rates through the Directors’ Share PurchasePlan. Commencing in 2004, the Bank no longer grants stockoptions to non-officer directors (refer to Note 14 of the 2004consolidated financial statements on pages 103 and 104).
The Bank may also enter into commercial arrangementswith companies controlled by directors. These commercialarrangements are conducted at market terms and conditionsand follow the normal credit and other review processes withinthe Bank. The Bank’s committed credit exposure to companies
controlled by directors totaled $587 million as at October 31,2004, while actual utilized amounts were $408 million.
The Bank has various processes in place to ensure thatrelated party information is identified and reported to the Auditand Conduct Review Committee (ACRC) of the Board ofDirectors on a semi-annual basis. The oversight provided bythe ACRC meets the requirements of the Bank Act, and encom-passes a broader definition of related party transactions than isset out in generally accepted accounting principles. The ACRChas the responsibility for reviewing policies and practices of theBank to identify transactions with its related parties that maymaterially affect the Bank, and reviewing the procedures forensuring compliance with the Bank Act for related party trans-actions. In addition, the ACRC approves the terms and condi-tions of all transactions between the Bank and Bank-sponsored asset securitization special purpose vehicles toensure that such transactions are at market terms and condi-tions. The ACRC is provided with detailed reports that reflectthe Bank’s compliance with its established procedures.
The Bank’s Audit Department carries out audit proceduresas necessary to provide the ACRC with reasonable assurancethat the Bank’s policies and procedures with respect to theidentification, authorization and reporting of related party trans-actions are appropriately designed and operating effectively.
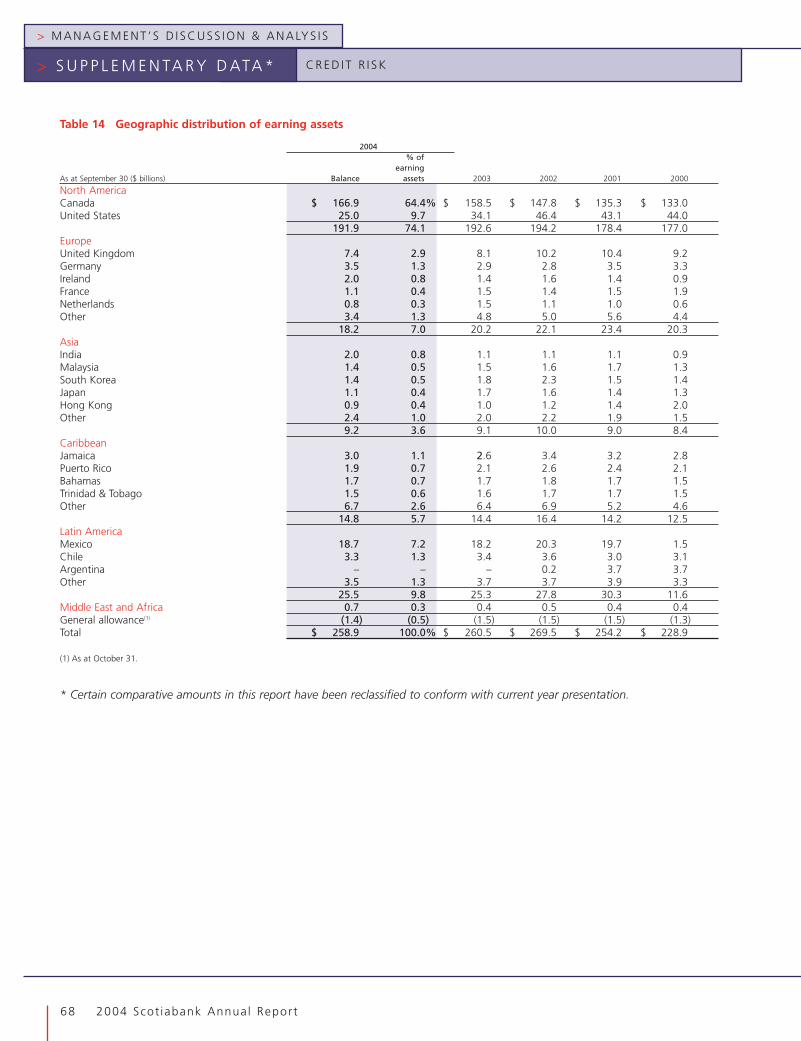
> MANAGEMENT ’ S D I SCUSS ION & ANALYS I S
68 2004 Scot iabank Annual Report
> S U P P L E M E N TA R Y D ATA *
Table 14 Geographic distribution of earning assets
2004% of
earningAs at September 30 ($ billions) Balance assets 2003 2002 2001 2000
North AmericaCanada $ 166.9 64.4% $ 158.5 $ 147.8 $ 135.3 $ 133.0United States 25.0 9.7 34.1 46.4 43.1 44.0
191.9 74.1 192.6 194.2 178.4 177.0EuropeUnited Kingdom 7.4 2.9 8.1 10.2 10.4 9.2Germany 3.5 1.3 2.9 2.8 3.5 3.3Ireland 2.0 0.8 1.4 1.6 1.4 0.9France 1.1 0.4 1.5 1.4 1.5 1.9Netherlands 0.8 0.3 1.5 1.1 1.0 0.6Other 3.4 1.3 4.8 5.0 5.6 4.4
18.2 7.0 20.2 22.1 23.4 20.3AsiaIndia 2.0 0.8 1.1 1.1 1.1 0.9Malaysia 1.4 0.5 1.5 1.6 1.7 1.3South Korea 1.4 0.5 1.8 2.3 1.5 1.4Japan 1.1 0.4 1.7 1.6 1.4 1.3Hong Kong 0.9 0.4 1.0 1.2 1.4 2.0Other 2.4 1.0 2.0 2.2 1.9 1.5
9.2 3.6 9.1 10.0 9.0 8.4CaribbeanJamaica 3.0 1.1 2.6 3.4 3.2 2.8Puerto Rico 1.9 0.7 2.1 2.6 2.4 2.1Bahamas 1.7 0.7 1.7 1.8 1.7 1.5Trinidad & Tobago 1.5 0.6 1.6 1.7 1.7 1.5Other 6.7 2.6 6.4 6.9 5.2 4.6
14.8 5.7 14.4 16.4 14.2 12.5Latin AmericaMexico 18.7 7.2 18.2 20.3 19.7 1.5Chile 3.3 1.3 3.4 3.6 3.0 3.1Argentina – – – 0.2 3.7 3.7Other 3.5 1.3 3.7 3.7 3.9 3.3
25.5 9.8 25.3 27.8 30.3 11.6Middle East and Africa 0.7 0.3 0.4 0.5 0.4 0.4General allowance(1) (1.4) (0.5) (1.5) (1.5) (1.5) (1.3)Total $ 258.9 100.0% $ 260.5 $ 269.5 $ 254.2 $ 228.9
(1) As at October 31.
* Certain comparative amounts in this report have been reclassified to conform with current year presentation.
CRED I T R I SK
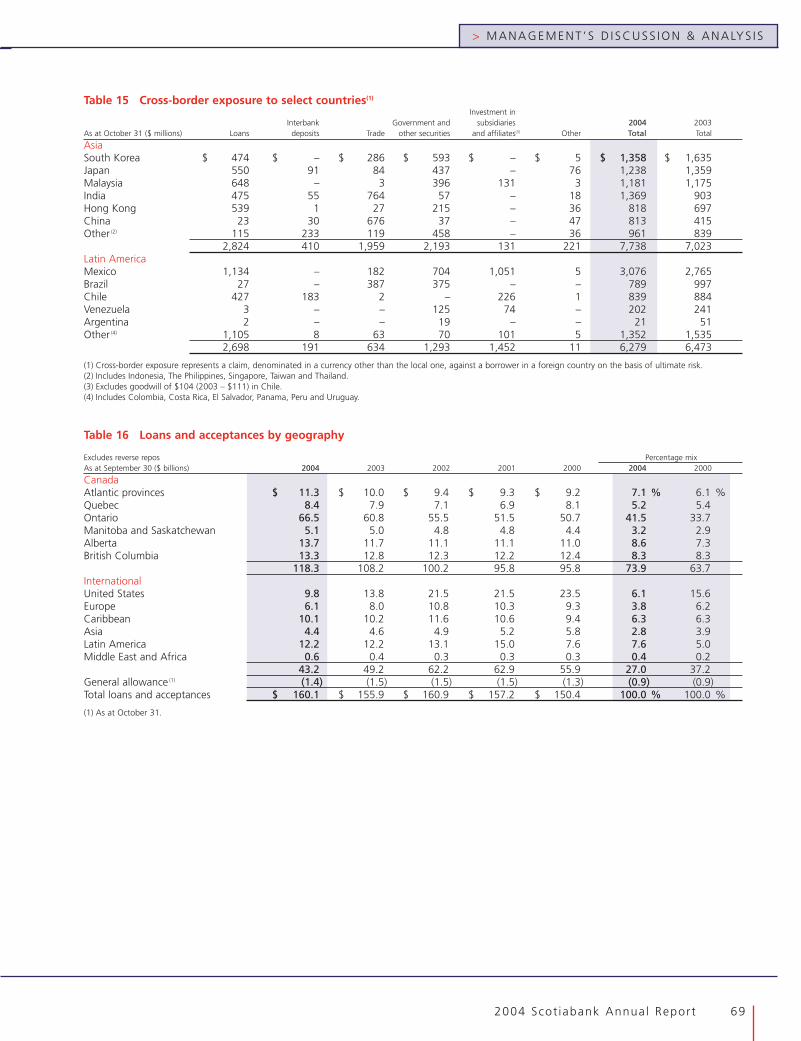
2004 Scot iabank Annual Report 69
> MANAGEMENT ’ S D I SCUSS ION & ANALYS I S
Table 15 Cross-border exposure to select countries(1)
Investment inInterbank Government and subsidiaries 2004 2003
As at October 31 ($ millions) Loans deposits Trade other securities and affiliates(3) Other Total Total
AsiaSouth Korea $ 474 $ – $ 286 $ 593 $ – $ 5 $ 1,358 $ 1,635Japan 550 91 84 437 – 76 1,238 1,359Malaysia 648 – 3 396 131 3 1,181 1,175India 475 55 764 57 – 18 1,369 903Hong Kong 539 1 27 215 – 36 818 697China 23 30 676 37 – 47 813 415Other (2) 115 233 119 458 – 36 961 839
2,824 410 1,959 2,193 131 221 7,738 7,023Latin AmericaMexico 1,134 – 182 704 1,051 5 3,076 2,765Brazil 27 – 387 375 – – 789 997Chile 427 183 2 – 226 1 839 884Venezuela 3 – – 125 74 – 202 241Argentina 2 – – 19 – – 21 51Other (4) 1,105 8 63 70 101 5 1,352 1,535
2,698 191 634 1,293 1,452 11 6,279 6,473
(1) Cross-border exposure represents a claim, denominated in a currency other than the local one, against a borrower in a foreign country on the basis of ultimate risk.(2) Includes Indonesia, The Philippines, Singapore, Taiwan and Thailand.(3) Excludes goodwill of $104 (2003 – $111) in Chile.(4) Includes Colombia, Costa Rica, El Salvador, Panama, Peru and Uruguay.
Table 16 Loans and acceptances by geography
Excludes reverse repos Percentage mixAs at September 30 ($ billions) 2004 2003 2002 2001 2000 2004 2000
CanadaAtlantic provinces $ 11.3 $ 10.0 $ 9.4 $ 9.3 $ 9.2 7.1 % 6.1 %Quebec 8.4 7.9 7.1 6.9 8.1 5.2 5.4Ontario 66.5 60.8 55.5 51.5 50.7 41.5 33.7Manitoba and Saskatchewan 5.1 5.0 4.8 4.8 4.4 3.2 2.9Alberta 13.7 11.7 11.1 11.1 11.0 8.6 7.3British Columbia 13.3 12.8 12.3 12.2 12.4 8.3 8.3
118.3 108.2 100.2 95.8 95.8 73.9 63.7InternationalUnited States 9.8 13.8 21.5 21.5 23.5 6.1 15.6Europe 6.1 8.0 10.8 10.3 9.3 3.8 6.2Caribbean 10.1 10.2 11.6 10.6 9.4 6.3 6.3Asia 4.4 4.6 4.9 5.2 5.8 2.8 3.9Latin America 12.2 12.2 13.1 15.0 7.6 7.6 5.0Middle East and Africa 0.6 0.4 0.3 0.3 0.3 0.4 0.2
43.2 49.2 62.2 62.9 55.9 27.0 37.2General allowance (1) (1.4) (1.5) (1.5) (1.5) (1.3) (0.9) (0.9)Total loans and acceptances $ 160.1 $ 155.9 $ 160.9 $ 157.2 $ 150.4 100.0 % 100.0 %
(1) As at October 31.
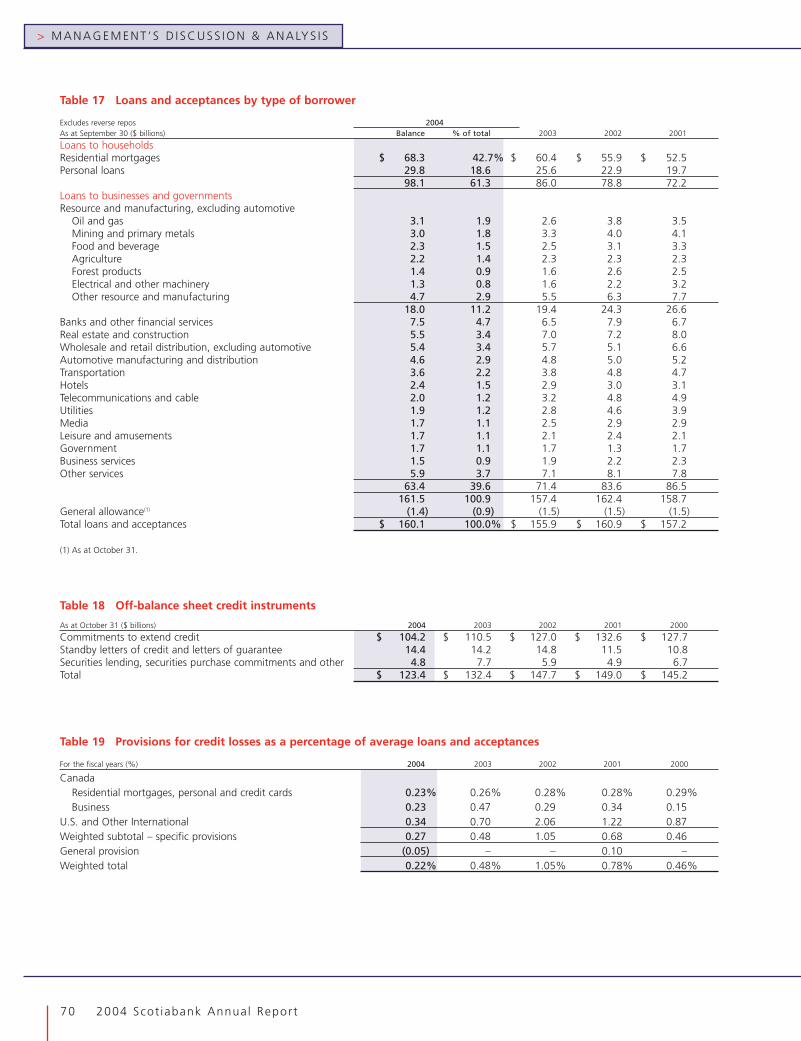
> MANAGEMENT ’ S D I SCUSS ION & ANALYS I S
70 2004 Scot iabank Annual Report
Table 17 Loans and acceptances by type of borrower
Excludes reverse repos 2004As at September 30 ($ billions) Balance % of total 2003 2002 2001
Loans to householdsResidential mortgages $ 68.3 42.7% $ 60.4 $ 55.9 $ 52.5Personal loans 29.8 18.6 25.6 22.9 19.7
98.1 61.3 86.0 78.8 72.2Loans to businesses and governmentsResource and manufacturing, excluding automotive
Oil and gas 3.1 1.9 2.6 3.8 3.5Mining and primary metals 3.0 1.8 3.3 4.0 4.1Food and beverage 2.3 1.5 2.5 3.1 3.3Agriculture 2.2 1.4 2.3 2.3 2.3Forest products 1.4 0.9 1.6 2.6 2.5Electrical and other machinery 1.3 0.8 1.6 2.2 3.2Other resource and manufacturing 4.7 2.9 5.5 6.3 7.7
18.0 11.2 19.4 24.3 26.6Banks and other financial services 7.5 4.7 6.5 7.9 6.7Real estate and construction 5.5 3.4 7.0 7.2 8.0Wholesale and retail distribution, excluding automotive 5.4 3.4 5.7 5.1 6.6Automotive manufacturing and distribution 4.6 2.9 4.8 5.0 5.2Transportation 3.6 2.2 3.8 4.8 4.7Hotels 2.4 1.5 2.9 3.0 3.1Telecommunications and cable 2.0 1.2 3.2 4.8 4.9Utilities 1.9 1.2 2.8 4.6 3.9Media 1.7 1.1 2.5 2.9 2.9Leisure and amusements 1.7 1.1 2.1 2.4 2.1Government 1.7 1.1 1.7 1.3 1.7Business services 1.5 0.9 1.9 2.2 2.3Other services 5.9 3.7 7.1 8.1 7.8
63.4 39.6 71.4 83.6 86.5161.5 100.9 157.4 162.4 158.7
General allowance(1) (1.4) (0.9) (1.5) (1.5) (1.5)Total loans and acceptances $ 160.1 100.0% $ 155.9 $ 160.9 $ 157.2
(1) As at October 31.
Table 18 Off-balance sheet credit instruments
As at October 31 ($ billions) 2004 2003 2002 2001 2000
Commitments to extend credit $ 104.2 $ 110.5 $ 127.0 $ 132.6 $ 127.7Standby letters of credit and letters of guarantee 14.4 14.2 14.8 11.5 10.8Securities lending, securities purchase commitments and other 4.8 7.7 5.9 4.9 6.7Total $ 123.4 $ 132.4 $ 147.7 $ 149.0 $ 145.2
Table 19 Provisions for credit losses as a percentage of average loans and acceptances
For the fiscal years (%) 2004 2003 2002 2001 2000
CanadaResidential mortgages, personal and credit cards 0.23% 0.26% 0.28% 0.28% 0.29%Business 0.23 0.47 0.29 0.34 0.15
U.S. and Other International 0.34 0.70 2.06 1.22 0.87Weighted subtotal – specific provisions 0.27 0.48 1.05 0.68 0.46General provision (0.05) – – 0.10 –Weighted total 0.22% 0.48% 1.05% 0.78% 0.46%

2004 Scot iabank Annual Report 71
> MANAGEMENT ’ S D I SCUSS ION & ANALYS I S
Table 20 Changes in net impaired loans(1)
As at October 31 ($ millions) 2004 2003 2002 2001 2000
Gross impaired loansBalance at beginning of year $ 3,241 $ 3,987 $ 4,439 $ 2,741 $ 2,380
New additions 1,774 2,634 4,843Declassifications, payments and loan sales (1,680) (1,936) (1,789)Net additions 94 698 3,054 1,820 965
Acquisition of subsidiaries – – – 906 121Disposal of Scotiabank Quilmes operations(2) – – (1,006) – –Writeoffs (982) (927) (2,376) (1,165) (781)Foreign exchange and other (153) (517) (124) 137 56Balance at end of year 2,200 3,241 3,987 4,439 2,741Specific allowance for credit lossesBalance at beginning of year 1,719 1,892 2,705 1,502 1,236Acquisition of subsidiaries – – – 919 153Specific provision for credit losses 490 893 2,029 1,250 765Disposal of Scotiabank Quilmes operations(2) – – (504) – –Writeoffs (982) (927) (2,376) (1,165) (781)Recoveries 158 164 169 123 113Foreign exchange and other (64)(3) (303) (131) 76 16Balance at end of year 1,321 1,719 1,892 2,705 1,502Net impaired loansBalance at beginning of year 1,522 2,095 1,734 1,239 1,144Net change in gross impaired loans (1,041) (746) (452) 1,698 361Net change in specific allowance for credit losses 398 173 813 (1,203) (266)Balance at end of year $ 879 $ 1,522 $ 2,095 $ 1,734 $ 1,239General allowance for credit losses 1,375 1,475 1,475 1,475 1,300Balance after deducting general allowance (496) 47 620 259 (61)
(1) Excludes net impaired loans pertaining to designated emerging markets in years prior to 2004.(2) Includes foreign exchange impact.(3) Includes $23 reclassified from country risk allowance and $8 transferred to other liabilities in 2004.
Table 21 Specific provisions for credit losses by business line
For the fiscal years ($ millions) 2004 2003 2002 2001 2000
DomesticRetail $ 207 $ 204 $ 197 $ 185 $ 184Commercial 110 68 85 98 26
317 272 282 283 210InternationalLatin America(1) 4 (29) 434 162 99Caribbean 53 84 73 62 61Asia 14 17 13 25 16Europe (1) 1 3 1 9
70 73 523 250 185Scotia CapitalCanada (15) 124 37 38 33United States 54 270 1,131 671 308Other 67 155 79 45 71
106 549 1,247 754 412
Other (3) (1) (23) (37) (42)
Total $ 490 $ 893 $ 2,029 $ 1,250 $ 765
(1) Includes reversals of $64 in 2003 and charge of $454 in 2002 of specific provisions with respect to Argentina, including cross-border exposure.
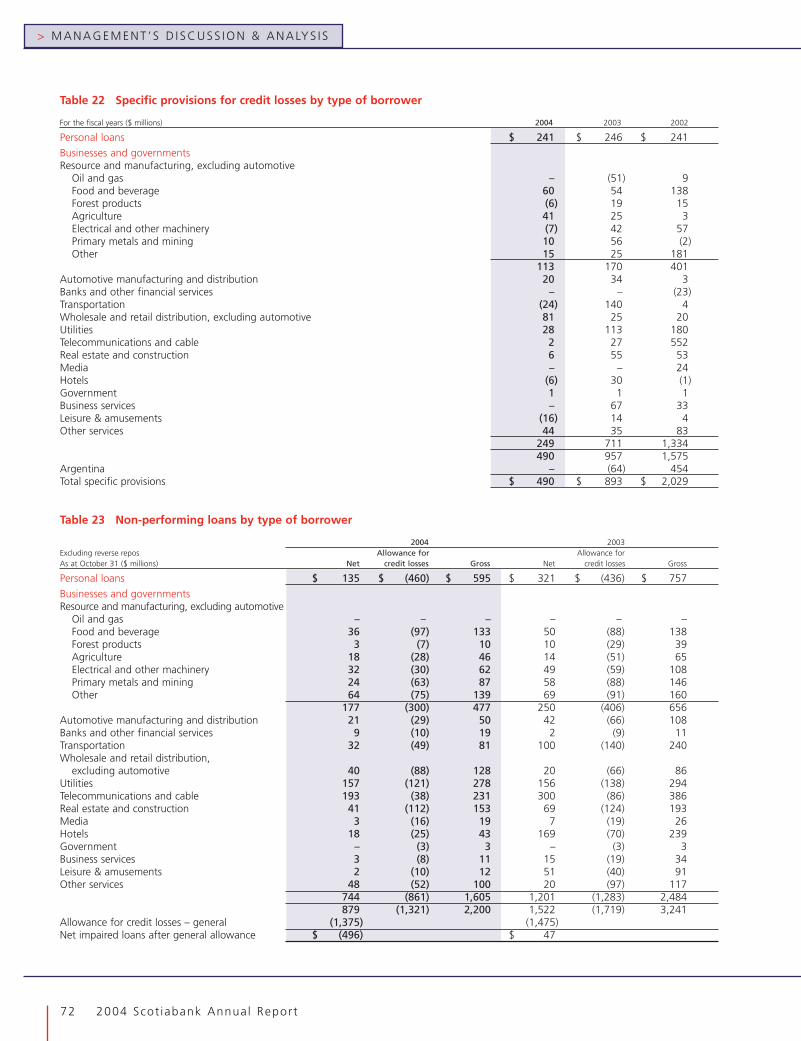
> MANAGEMENT ’ S D I SCUSS ION & ANALYS I S
72 2004 Scot iabank Annual Report
Table 22 Specific provisions for credit losses by type of borrower
For the fiscal years ($ millions) 2004 2003 2002
Personal loans $ 241 $ 246 $ 241
Businesses and governmentsResource and manufacturing, excluding automotive
Oil and gas – (51) 9Food and beverage 60 54 138Forest products (6) 19 15Agriculture 41 25 3Electrical and other machinery (7) 42 57Primary metals and mining 10 56 (2)Other 15 25 181
113 170 401Automotive manufacturing and distribution 20 34 3Banks and other financial services – – (23)Transportation (24) 140 4Wholesale and retail distribution, excluding automotive 81 25 20Utilities 28 113 180Telecommunications and cable 2 27 552Real estate and construction 6 55 53Media – – 24Hotels (6) 30 (1)Government 1 1 1Business services – 67 33Leisure & amusements (16) 14 4Other services 44 35 83
249 711 1,334490 957 1,575
Argentina – (64) 454Total specific provisions $ 490 $ 893 $ 2,029
Table 23 Non-performing loans by type of borrower
2004 2003Excluding reverse repos Allowance for Allowance forAs at October 31 ($ millions) Net credit losses Gross Net credit losses Gross
Personal loans $ 135 $ (460) $ 595 $ 321 $ (436) $ 757
Businesses and governmentsResource and manufacturing, excluding automotive
Oil and gas – – – – – –Food and beverage 36 (97) 133 50 (88) 138Forest products 3 (7) 10 10 (29) 39Agriculture 18 (28) 46 14 (51) 65Electrical and other machinery 32 (30) 62 49 (59) 108Primary metals and mining 24 (63) 87 58 (88) 146Other 64 (75) 139 69 (91) 160
177 (300) 477 250 (406) 656Automotive manufacturing and distribution 21 (29) 50 42 (66) 108Banks and other financial services 9 (10) 19 2 (9) 11Transportation 32 (49) 81 100 (140) 240Wholesale and retail distribution,
excluding automotive 40 (88) 128 20 (66) 86Utilities 157 (121) 278 156 (138) 294Telecommunications and cable 193 (38) 231 300 (86) 386Real estate and construction 41 (112) 153 69 (124) 193Media 3 (16) 19 7 (19) 26Hotels 18 (25) 43 169 (70) 239Government – (3) 3 – (3) 3Business services 3 (8) 11 15 (19) 34Leisure & amusements 2 (10) 12 51 (40) 91Other services 48 (52) 100 20 (97) 117
744 (861) 1,605 1,201 (1,283) 2,484879 (1,321) 2,200 1,522 (1,719) 3,241
Allowance for credit losses – general (1,375) (1,475)Net impaired loans after general allowance $ (496) $ 47
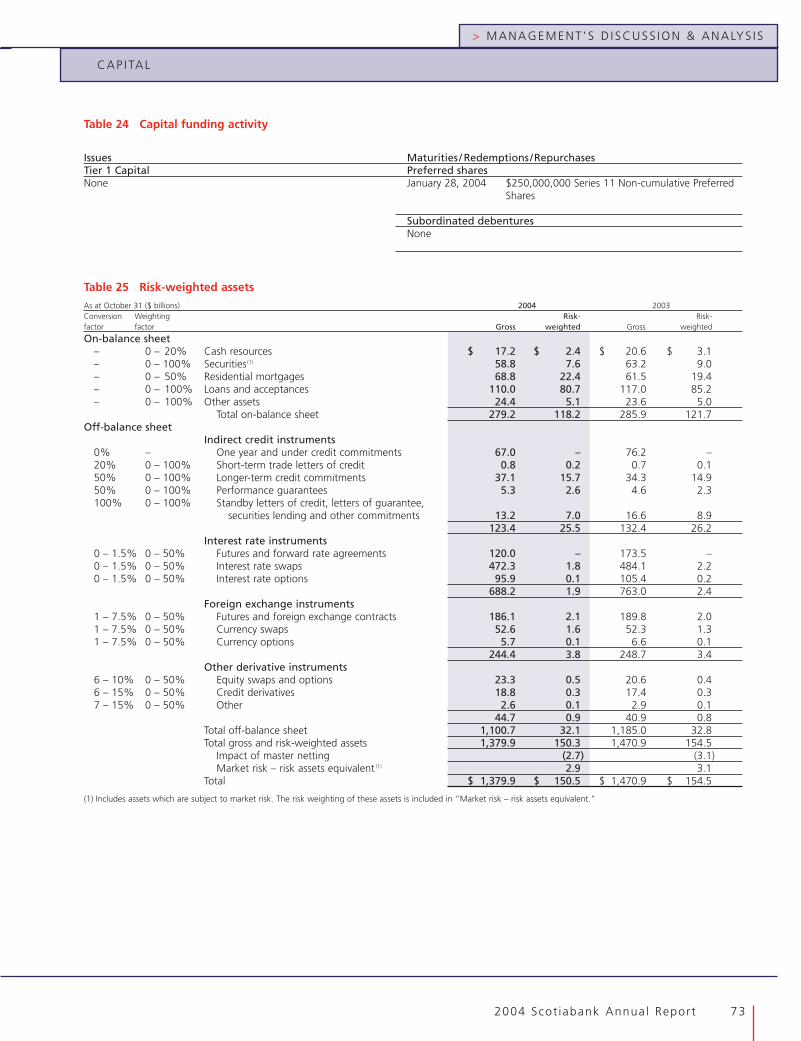
2004 Scot iabank Annual Report 73
> MANAGEMENT ’ S D I SCUSS ION & ANALYS I S
Table 24 Capital funding activity
Issues Maturities / Redemptions/RepurchasesTier 1 Capital Preferred sharesNone January 28, 2004 $250,000,000 Series 11 Non-cumulative Preferred
Shares
Subordinated debenturesNone
Table 25 Risk-weighted assets
As at October 31 ($ billions) 2004 2003Conversion Weighting Risk- Risk-factor factor Gross weighted Gross weighted
On-balance sheet– 0 – 20% Cash resources $ 17.2 $ 2.4 $ 20.6 $ 3.1– 0 – 100% Securities(1) 58.8 7.6 63.2 9.0– 0 – 50% Residential mortgages 68.8 22.4 61.5 19.4– 0 – 100% Loans and acceptances 110.0 80.7 117.0 85.2– 0 – 100% Other assets 24.4 5.1 23.6 5.0
Total on-balance sheet 279.2 118.2 285.9 121.7Off-balance sheet
Indirect credit instruments0% – One year and under credit commitments 67.0 – 76.2 –20% 0 – 100% Short-term trade letters of credit 0.8 0.2 0.7 0.150% 0 – 100% Longer-term credit commitments 37.1 15.7 34.3 14.950% 0 – 100% Performance guarantees 5.3 2.6 4.6 2.3100% 0 – 100% Standby letters of credit, letters of guarantee,
securities lending and other commitments 13.2 7.0 16.6 8.9123.4 25.5 132.4 26.2
Interest rate instruments0 – 1.5% 0 – 50% Futures and forward rate agreements 120.0 – 173.5 –0 – 1.5% 0 – 50% Interest rate swaps 472.3 1.8 484.1 2.20 – 1.5% 0 – 50% Interest rate options 95.9 0.1 105.4 0.2
688.2 1.9 763.0 2.4Foreign exchange instruments
1 – 7.5% 0 – 50% Futures and foreign exchange contracts 186.1 2.1 189.8 2.01 – 7.5% 0 – 50% Currency swaps 52.6 1.6 52.3 1.31 – 7.5% 0 – 50% Currency options 5.7 0.1 6.6 0.1
244.4 3.8 248.7 3.4Other derivative instruments
6 – 10% 0 – 50% Equity swaps and options 23.3 0.5 20.6 0.46 – 15% 0 – 50% Credit derivatives 18.8 0.3 17.4 0.37 – 15% 0 – 50% Other 2.6 0.1 2.9 0.1
44.7 0.9 40.9 0.8Total off-balance sheet 1,100.7 32.1 1,185.0 32.8Total gross and risk-weighted assets 1,379.9 150.3 1,470.9 154.5
Impact of master netting (2.7) (3.1)Market risk – risk assets equivalent (1) 2.9 3.1
Total $ 1,379.9 $ 150.5 $ 1,470.9 $ 154.5
(1) Includes assets which are subject to market risk. The risk weighting of these assets is included in “Market risk – risk assets equivalent.”
CAP I TAL
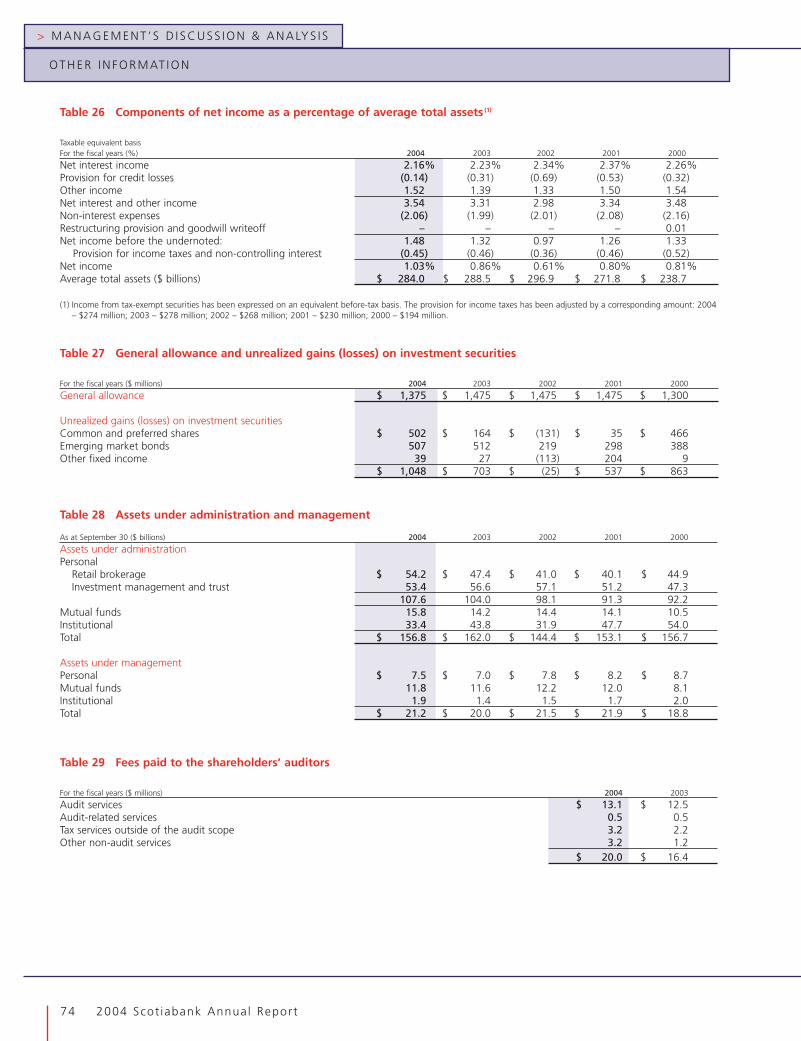
> MANAGEMENT ’ S D I SCUSS ION & ANALYS I S
74 2004 Scot iabank Annual Report
Table 28 Assets under administration and management
As at September 30 ($ billions) 2004 2003 2002 2001 2000
Assets under administrationPersonal
Retail brokerage $ 54.2 $ 47.4 $ 41.0 $ 40.1 $ 44.9Investment management and trust 53.4 56.6 57.1 51.2 47.3
107.6 104.0 98.1 91.3 92.2Mutual funds 15.8 14.2 14.4 14.1 10.5Institutional 33.4 43.8 31.9 47.7 54.0Total $ 156.8 $ 162.0 $ 144.4 $ 153.1 $ 156.7
Assets under managementPersonal $ 7.5 $ 7.0 $ 7.8 $ 8.2 $ 8.7Mutual funds 11.8 11.6 12.2 12.0 8.1Institutional 1.9 1.4 1.5 1.7 2.0Total $ 21.2 $ 20.0 $ 21.5 $ 21.9 $ 18.8
Table 29 Fees paid to the shareholders’ auditors
For the fiscal years ($ millions) 2004 2003
Audit services $ 13.1 $ 12.5Audit-related services 0.5 0.5Tax services outside of the audit scope 3.2 2.2Other non-audit services 3.2 1.2
$ 20.0 $ 16.4
Table 26 Components of net income as a percentage of average total assets (1)
Taxable equivalent basisFor the fiscal years (%) 2004 2003 2002 2001 2000
Net interest income 2.16% 2.23% 2.34% 2.37% 2.26%Provision for credit losses (0.14) (0.31) (0.69) (0.53) (0.32)Other income 1.52 1.39 1.33 1.50 1.54Net interest and other income 3.54 3.31 2.98 3.34 3.48Non-interest expenses (2.06) (1.99) (2.01) (2.08) (2.16)Restructuring provision and goodwill writeoff – – – – 0.01Net income before the undernoted: 1.48 1.32 0.97 1.26 1.33
Provision for income taxes and non-controlling interest (0.45) (0.46) (0.36) (0.46) (0.52)Net income 1.03% 0.86% 0.61% 0.80% 0.81%Average total assets ($ billions) $ 284.0 $ 288.5 $ 296.9 $ 271.8 $ 238.7
(1) Income from tax-exempt securities has been expressed on an equivalent before-tax basis. The provision for income taxes has been adjusted by a corresponding amount: 2004– $274 million; 2003 – $278 million; 2002 – $268 million; 2001 – $230 million; 2000 – $194 million.
Table 27 General allowance and unrealized gains (losses) on investment securities
For the fiscal years ($ millions) 2004 2003 2002 2001 2000
General allowance $ 1,375 $ 1,475 $ 1,475 $ 1,475 $ 1,300
Unrealized gains (losses) on investment securitiesCommon and preferred shares $ 502 $ 164 $ (131) $ 35 $ 466Emerging market bonds 507 512 219 298 388Other fixed income 39 27 (113) 204 9
$ 1,048 $ 703 $ (25) $ 537 $ 863
OTHER INFORMAT ION

2004 Scot iabank Annual Report 75
> MANAGEMENT ’ S D I SCUSS ION & ANALYS I S
Table 30 Selected quarterly information2004 2003
As at and for the quarter ended Q4 Q3 Q2 Q1 Q4 Q3 Q2 Q1
Operating results ($ millions)
Net interest income (TEB(1)) 1,499 1,534 1,558 1,548 1,584 1,630 1,603 1,611Total revenue (TEB(1)) 2,495 2,569 2,807 2,588 2,591 2,639 2,568 2,645Provision for credit losses 40 50 130 170 120 200 248 325Non-interest expenses 1,461 1,472 1,523 1,406 1,494 1,453 1,429 1,355Provision for income taxes (TEB(1)) 239 264 313 251 250 291 225 296Net income 708 733 786 704 660 626 596 595Net income available to common shareholders 701 727 780 684 650 616 572 568Operating performanceBasic earnings per share(2) ($) 0.70 0.72 0.77 0.68 0.64 0.61 0.57 0.56Diluted earnings per share(2) ($) 0.69 0.71 0.75 0.67 0.63 0.60 0.56 0.55Return on equity (%) 18.8 19.4 21.8 19.4 18.6 17.7 17.2 16.6Productivity ratio (%)(TEB(1)) 58.6 57.3 54.3 54.3 57.7 55.1 55.6 51.2Net interest margin on total average assets (%)(TEB(1)) 2.12 2.15 2.21 2.18 2.22 2.28 2.25 2.17Balance sheet information ($ billions)
Cash and securities 75.9 85.0 81.3 81.6 83.8 78.9 77.3 74.5Loans and acceptances 178.9 182.2 179.9 175.7 178.5 179.6 189.2 188.0Total assets 279.2 286.9 283.6 281.5 285.9 282.2 291.7 289.6Deposits 195.2 201.1 197.6 191.8 192.7 190.3 189.2 192.7Preferred shares 0.6 0.6 0.6 0.6 0.8 0.8 0.8 1.1Common shareholders’ equity 14.7 15.0 14.9 14.2 13.8 13.9 13.6 13.7Assets under administration 156.8 162.1 162.3 167.7 162.0 161.2 154.9 154.9Assets under management 21.2 21.2 20.9 20.5 20.0 20.2 19.6 20.7Capital measures (%)
Tier 1 capital ratio 11.5 11.3 11.2 10.9 10.8 10.6 10.3 10.0Total capital ratio 13.9 13.7 13.6 13.4 13.2 13.1 12.7 12.8Common equity to risk-weighted assets 9.9 9.8 9.7 9.5 9.2 9.1 8.7 8.8Tangible common equity to risk-weighted assets(3) 9.7 9.5 9.4 9.2 8.9 8.7 8.4 8.5Risk-weighted assets ($ billions) 150.5 155.5 155.7 153.5 154.5 157.2 159.1 163.2Credit qualityNet impaired loans after specific allowance(4) ($ millions) 879 1,198 1,371 1,487 1,522 1,792 1,853 2,034General allowance for credit losses ($ millions) 1,375 1,425 1,475 1,475 1,475 1,475 1,475 1,475Net impaired loans as a % of loans and acceptances(4) 0.49 0.66 0.76 0.85 0.85 1.00 0.98 1.08Specific provision for credit losses as a % of average
loans and acceptances 0.20 0.22 0.30 0.38 0.27 0.43 0.53 0.67Common share informationShare price(2) ($)
High 40.00 36.88 37.45 34.24 33.70 32.19 27.90 27.38Low 35.28 32.90 33.38 31.08 29.19 27.52 24.84 22.28Close 39.60 36.60 35.15 33.75 32.74 30.24 27.90 25.35
Shares outstanding(2) (millions)
Average – Basic 1,008 1,008 1,011 1,011 1,012 1,010 1,007 1,009Average – Diluted 1,024 1,024 1,028 1,027 1,028 1,027 1,023 1,025End of period 1,009 1,008 1,009 1,011 1,011 1,012 1,008 1,007
Dividends per share(2) ($) 0.30 0.30 0.25 0.25 0.22 0.22 0.20 0.20Dividend yield (%) 3.2 3.4 2.8 3.1 2.8 2.9 3.0 3.2Dividend payout ratio(5) (%) 43.1 41.6 32.4 37.0 34.2 36.1 35.2 35.6Market capitalization ($ billions) 39.9 36.9 35.5 34.1 33.1 30.6 28.1 25.5Book value per share(2) ($) 14.56 14.86 14.73 14.05 13.67 13.76 13.50 13.56Market value to book value multiple 2.7 2.5 2.4 2.4 2.4 2.2 2.1 1.9Price to earnings multiple (trailing 4 quarters) 13.8 13.0 13.0 13.5 13.8 13.2 12.6 11.4
(1) Taxable equivalent basis. Refer to the non-GAAP measures on page 33.(2) Amounts have been retroactively adjusted to reflect the stock dividend paid April 28, 2004, of one common share for each issued and outstanding common share. The stock
dividend had the same effect as a two-for-one stock split.(3) Represents common shareholders’ equity and non-controlling interest in the common equity of operating subsidiaries, less goodwill and intangible assets, as a percentage of
risk-weighted assets.(4) Net impaired loans are impaired loans less the specific allowance for credit losses.(5) Represents common dividends for the period as a percentage of the net income available to common shareholders for the period.
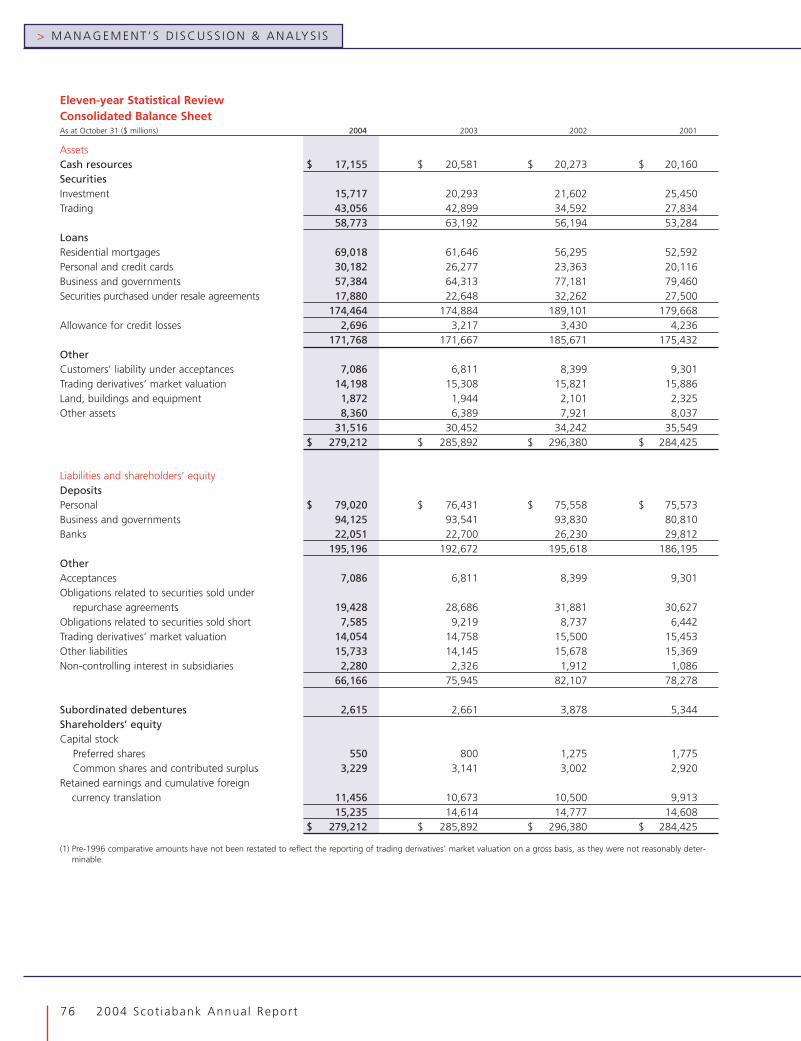
> MANAGEMENT ’ S D I SCUSS ION & ANALYS I S
76 2004 Scot iabank Annual Report
Eleven-year Statistical ReviewConsolidated Balance SheetAs at October 31 ($ millions) 2004 2003 2002 2001
AssetsCash resources $ 17,155 $ 20,581 $ 20,273 $ 20,160SecuritiesInvestment 15,717 20,293 21,602 25,450Trading 43,056 42,899 34,592 27,834
58,773 63,192 56,194 53,284LoansResidential mortgages 69,018 61,646 56,295 52,592Personal and credit cards 30,182 26,277 23,363 20,116Business and governments 57,384 64,313 77,181 79,460Securities purchased under resale agreements 17,880 22,648 32,262 27,500
174,464 174,884 189,101 179,668Allowance for credit losses 2,696 3,217 3,430 4,236
171,768 171,667 185,671 175,432OtherCustomers’ liability under acceptances 7,086 6,811 8,399 9,301Trading derivatives’ market valuation 14,198 15,308 15,821 15,886Land, buildings and equipment 1,872 1,944 2,101 2,325Other assets 8,360 6,389 7,921 8,037
31,516 30,452 34,242 35,549$ 279,212 $ 285,892 $ 296,380 $ 284,425
Liabilities and shareholders’ equityDepositsPersonal $ 79,020 $ 76,431 $ 75,558 $ 75,573Business and governments 94,125 93,541 93,830 80,810Banks 22,051 22,700 26,230 29,812
195,196 192,672 195,618 186,195OtherAcceptances 7,086 6,811 8,399 9,301Obligations related to securities sold under
repurchase agreements 19,428 28,686 31,881 30,627Obligations related to securities sold short 7,585 9,219 8,737 6,442Trading derivatives’ market valuation 14,054 14,758 15,500 15,453Other liabilities 15,733 14,145 15,678 15,369Non-controlling interest in subsidiaries 2,280 2,326 1,912 1,086
66,166 75,945 82,107 78,278
Subordinated debentures 2,615 2,661 3,878 5,344Shareholders’ equityCapital stock
Preferred shares 550 800 1,275 1,775Common shares and contributed surplus 3,229 3,141 3,002 2,920
Retained earnings and cumulative foreigncurrency translation 11,456 10,673 10,500 9,913
15,235 14,614 14,777 14,608$ 279,212 $ 285,892 $ 296,380 $ 284,425
(1) Pre-1996 comparative amounts have not been restated to reflect the reporting of trading derivatives’ market valuation on a gross basis, as they were not reasonably deter-minable.
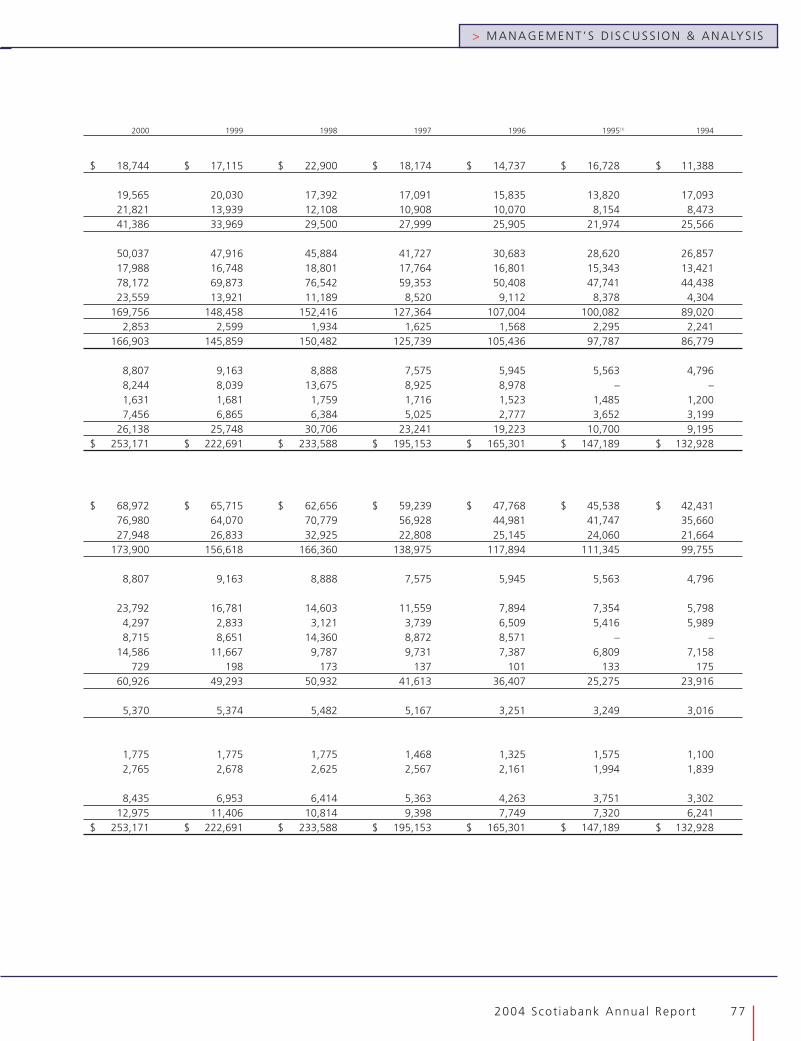
2004 Scot iabank Annual Report 77
> MANAGEMENT ’ S D I SCUSS ION & ANALYS I S
2000 1999 1998 1997 1996 1995(1) 1994
$ 18,744 $ 17,115 $ 22,900 $ 18,174 $ 14,737 $ 16,728 $ 11,388
19,565 20,030 17,392 17,091 15,835 13,820 17,09321,821 13,939 12,108 10,908 10,070 8,154 8,47341,386 33,969 29,500 27,999 25,905 21,974 25,566
50,037 47,916 45,884 41,727 30,683 28,620 26,85717,988 16,748 18,801 17,764 16,801 15,343 13,42178,172 69,873 76,542 59,353 50,408 47,741 44,43823,559 13,921 11,189 8,520 9,112 8,378 4,304
169,756 148,458 152,416 127,364 107,004 100,082 89,0202,853 2,599 1,934 1,625 1,568 2,295 2,241
166,903 145,859 150,482 125,739 105,436 97,787 86,779
8,807 9,163 8,888 7,575 5,945 5,563 4,7968,244 8,039 13,675 8,925 8,978 – –1,631 1,681 1,759 1,716 1,523 1,485 1,2007,456 6,865 6,384 5,025 2,777 3,652 3,199
26,138 25,748 30,706 23,241 19,223 10,700 9,195$ 253,171 $ 222,691 $ 233,588 $ 195,153 $ 165,301 $ 147,189 $ 132,928
$ 68,972 $ 65,715 $ 62,656 $ 59,239 $ 47,768 $ 45,538 $ 42,43176,980 64,070 70,779 56,928 44,981 41,747 35,66027,948 26,833 32,925 22,808 25,145 24,060 21,664
173,900 156,618 166,360 138,975 117,894 111,345 99,755
8,807 9,163 8,888 7,575 5,945 5,563 4,796
23,792 16,781 14,603 11,559 7,894 7,354 5,7984,297 2,833 3,121 3,739 6,509 5,416 5,9898,715 8,651 14,360 8,872 8,571 – –
14,586 11,667 9,787 9,731 7,387 6,809 7,158729 198 173 137 101 133 175
60,926 49,293 50,932 41,613 36,407 25,275 23,916
5,370 5,374 5,482 5,167 3,251 3,249 3,016
1,775 1,775 1,775 1,468 1,325 1,575 1,1002,765 2,678 2,625 2,567 2,161 1,994 1,839
8,435 6,953 6,414 5,363 4,263 3,751 3,30212,975 11,406 10,814 9,398 7,749 7,320 6,241
$ 253,171 $ 222,691 $ 233,588 $ 195,153 $ 165,301 $ 147,189 $ 132,928
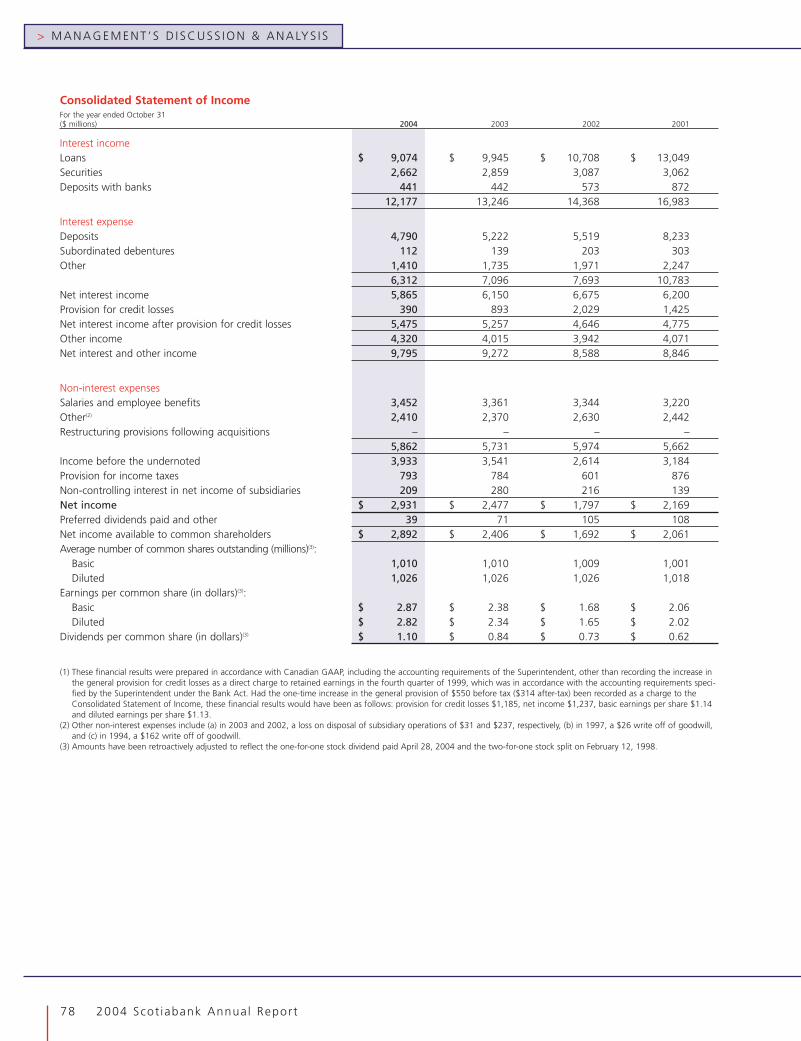
> MANAGEMENT ’ S D I SCUSS ION & ANALYS I S
78 2004 Scot iabank Annual Report
Consolidated Statement of IncomeFor the year ended October 31($ millions) 2004 2003 2002 2001
Interest incomeLoans $ 9,074 $ 9,945 $ 10,708 $ 13,049Securities 2,662 2,859 3,087 3,062Deposits with banks 441 442 573 872
12,177 13,246 14,368 16,983
Interest expenseDeposits 4,790 5,222 5,519 8,233Subordinated debentures 112 139 203 303Other 1,410 1,735 1,971 2,247
6,312 7,096 7,693 10,783Net interest income 5,865 6,150 6,675 6,200Provision for credit losses 390 893 2,029 1,425Net interest income after provision for credit losses 5,475 5,257 4,646 4,775Other income 4,320 4,015 3,942 4,071Net interest and other income 9,795 9,272 8,588 8,846
Non-interest expensesSalaries and employee benefits 3,452 3,361 3,344 3,220Other(2) 2,410 2,370 2,630 2,442Restructuring provisions following acquisitions – – – –
5,862 5,731 5,974 5,662Income before the undernoted 3,933 3,541 2,614 3,184Provision for income taxes 793 784 601 876Non-controlling interest in net income of subsidiaries 209 280 216 139Net income $ 2,931 $ 2,477 $ 1,797 $ 2,169Preferred dividends paid and other 39 71 105 108Net income available to common shareholders $ 2,892 $ 2,406 $ 1,692 $ 2,061Average number of common shares outstanding (millions)(3):
Basic 1,010 1,010 1,009 1,001Diluted 1,026 1,026 1,026 1,018
Earnings per common share (in dollars)(3):Basic $ 2.87 $ 2.38 $ 1.68 $ 2.06Diluted $ 2.82 $ 2.34 $ 1.65 $ 2.02
Dividends per common share (in dollars)(3) $ 1.10 $ 0.84 $ 0.73 $ 0.62
(1) These financial results were prepared in accordance with Canadian GAAP, including the accounting requirements of the Superintendent, other than recording the increase inthe general provision for credit losses as a direct charge to retained earnings in the fourth quarter of 1999, which was in accordance with the accounting requirements speci-fied by the Superintendent under the Bank Act. Had the one-time increase in the general provision of $550 before tax ($314 after-tax) been recorded as a charge to theConsolidated Statement of Income, these financial results would have been as follows: provision for credit losses $1,185, net income $1,237, basic earnings per share $1.14and diluted earnings per share $1.13.
(2) Other non-interest expenses include (a) in 2003 and 2002, a loss on disposal of subsidiary operations of $31 and $237, respectively, (b) in 1997, a $26 write off of goodwill,and (c) in 1994, a $162 write off of goodwill.
(3) Amounts have been retroactively adjusted to reflect the one-for-one stock dividend paid April 28, 2004 and the two-for-one stock split on February 12, 1998.

2004 Scot iabank Annual Report 79
> MANAGEMENT ’ S D I SCUSS ION & ANALYS I S
2000 1999(1) 1998 1997 1996 1995 1994
$ 12,129 $ 10,654 $ 10,269 $ 8,082 $ 7,881 $ 8,007 $ 6,0902,286 1,874 1,815 1,636 1,757 1,991 1,287
916 943 1,007 770 740 597 39115,331 13,471 13,091 10,488 10,378 10,595 7,768
8,192 7,284 7,303 5,714 5,969 6,166 4,149324 314 354 260 214 209 172
1,616 1,201 1,057 797 841 1,046 48710,132 8,799 8,714 6,771 7,024 7,421 4,8085,199 4,672 4,377 3,717 3,354 3,174 2,960
765 635 595 35 380 560 5674,434 4,037 3,782 3,682 2,974 2,614 2,3933,665 3,183 2,858 2,683 2,008 1,498 1,6068,099 7,220 6,640 6,365 4,982 4,112 3,999
2,944 2,627 2,501 2,202 1,910 1,652 1,5832,209 2,149 1,945 1,607 1,327 1,192 1,273
(34) (20) – 250 (20) – 1755,119 4,756 4,446 4,059 3,217 2,844 3,0312,980 2,464 2,194 2,306 1,765 1,268 968
990 867 762 758 665 371 45564 46 38 34 31 21 31
$ 1,926 $ 1,551 $ 1,394 $ 1,514 $ 1,069 $ 876 $ 482108 108 97 99 113 104 97
$ 1,818 $ 1,443 $ 1,297 $ 1,415 $ 956 $ 772 $ 385
991 986 982 958 937 914 8751,003 996 993 966 939 915 875
$ 1.83 $ 1.46 $ 1.32 $ 1.48 $ 1.02 $ 0.84 $ 0.44$ 1.81 $ 1.45 $ 1.31 $ 1.46 $ 1.02 $ 0.84 $ 0.44$ 0.50 $ 0.44 $ 0.40 $ 0.37 $ 0.33 $ 0.31 $ 0.29

> MANAGEMENT ’ S D I SCUSS ION & ANALYS I S
80 2004 Scot iabank Annual Report
Consolidated Statement of Changes in Shareholders’ EquityFor the year ended October 31 ($ millions) 2004 2003 2002 2001
Preferred sharesBank:
Balance at beginning of year $ 550 $ 1,025 $ 1,525 $ 1,525Issued – – – –Redeemed (250) (475) (500) –Balance at end of year 300 550 1,025 1,525
Scotia Mortgage Investment Corporation 250 250 250 250Total 550 800 1,275 1,775Common shares and contributed surplusBalance of common shares at beginning of year 3,140 3,002 2,920 2,765Issued 117 163 101 155Purchased for cancellation (29) (25) (19) –Balance of common shares at end of year 3,228 3,140 3,002 2,920Contributed surplus: Fair value of stock options 1 1 – –Total 3,229 3,141 3,002 2,920Retained earnings and cumulative foreign currency translationBalance at beginning of year 10,673 10,500 9,913 8,435Adjustments – – (76)(1) (39)(2)
Net income 2,931 2,477 1,797 2,169Dividends: Preferred (29) (52) (105) (108)
Common (1,110) (849) (732) (621)Net unrealized foreign exchange translation gains/(losses) (709) (1,176) (137) 79Purchase of shares and premium on redemption (300) (220) (154) –Other – (7) (6) (2)Balance at end of year 11,456 10,673 10,500 9,913Total shareholders’ equity at end of year $ 15,235 $ 14,614 $ 14,777 $ 14,608
Other Statistics(5)
Operating performanceBasic earnings per share ($)(6) 2.87 2.38 1.68 2.06Diluted earnings per share ($)(6) 2.82 2.34 1.65 2.02Return on equity (%) 19.9 17.6 13.0 17.3Productivity ratio (%)(TEB) 56.0 54.9 54.9 53.9Return on assets (%) 1.03 0.86 0.61 0.80Net interest margin on total average assets (%)(TEB) 2.16 2.23 2.34 2.37Capital measuresTier 1 capital ratio (%) 11.5 10.8 9.9 9.3Total capital ratio (%) 13.9 13.2 12.7 13.0Assets to capital ratio(7) 13.8 14.4 14.5 13.5Common equity to risk-weighted assets (%) 9.9 9.2 8.6 8.1Tangible common equity to risk-weighted assets (%) 9.7 8.9 8.3 7.8Common share informationShare price ($):(6)
High 40.00 33.70 28.10 25.25Low 31.08 22.28 21.01 18.65Close 39.60 32.74 22.94 21.93
Number of shares outstanding (millions)(6) 1,009 1,011 1,008 1,008Dividends per share ($)(6) 1.10 0.84 0.73 0.62Dividend payout (%)(8) 38.4 35.3 43.2 30.1Dividend yield (%)(9) 3.1 3.0 3.0 2.8Price to earnings multiple(10) 13.8 13.8 13.7 10.6Book value per common share ($)(6) 14.56 13.67 13.39 12.74Other informationAverage total assets ($ millions) 283,986 288,513 296,852 271,843Number of branches and offices 1,871 1,850 1,847 2,005Number of employees(11) 43,928 43,986 44,633 46,804Number of automated banking machines 4,219 3,918 3,693 3,761
(1) Cumulative effect of adoption of new goodwill accounting standard.(2) Cumulative effect of adoption of new corporate income taxes accounting standard.(3) If the increase in the general provision had been charged to income (refer to footnote 1 on the previous page), these 1999 financial ratios would have been: return on equity
12.0%, return on assets 0.54%, basic earnings per share $1.14, diluted earnings per share $1.13, dividend payout 38.0% and price earnings multiple 14.3.(4) In accordance with the guidelines issued by the Superintendent, the Bank adopted new impaired loans accounting principles established by the CICA.(5) Pre-1996 comparative amounts have not been restated to reflect the reporting of trading derivatives’ market valuation on a gross basis, as they were not reasonably
determinable.

2004 Scot iabank Annual Report 81
> MANAGEMENT ’ S D I SCUSS ION & ANALYS I S
2000 1999 1998 1997 1996 1995 1994
$ 1,525 $ 1,525 $ 1,218 $ 1,325 $ 1,575 $ 1,100 $ 1,300– – 311 143 100 675 –– – (4) (250) (350) (200) (200)
1,525 1,525 1,525 1,218 1,325 1,575 1,100250 250 250 250 – – –
1,775 1,775 1,775 1,468 1,325 1,575 1,100
2,678 2,625 2,567 2,161 1,994 1,839 1,42987 53 58 406 167 155 410
– – – – – – –2,765 2,678 2,625 2,567 2,161 1,994 1,839
– – – – – – –2,765 2,678 2,625 2,567 2,161 1,994 1,839
6,953 6,414 5,363 4,263 3,751 3,302 3,175– (314)(3) – – (116)(4) – –
1,926 1,551 1,394 1,514 1,069 876 482(108) (108) (97) (99) (113) (104) (97)(496) (429) (393) (355) (305) (283) (253)163 (160) 152 43 (19) (15) 9
– – – – – – –(3) (1) (5) (3) (4) (25) (14)
8,435 6,953 6,414 5,363 4,263 3,751 3,302$ 12,975 $ 11,406 $ 10,814 $ 9,398 $ 7,749 $ 7,320 $ 6,241
1.83 1.46)(3) 1.32 1.48 1.02 0.84 0.441.81 1.45)(3) 1.31 1.46 1.02 0.84 0.4417.6 15.3)(3) 15.3 20.2 15.8 14.2 7.956.5 59.3 60.4 62.4 58.8 59.9 65.60.81 0.68)(3) 0.65 0.85 0.67 0.64 0.402.26 2.11 2.11 2.13 2.18 2.31 2.62
8.6 8.1 7.2 6.9 6.7 6.7 6.212.2 11.9 10.6 10.4 8.9 9.6 9.613.7 13.5 14.9 14.2 16.4 15.2 15.27.3 6.9 6.0 5.8 5.5 5.4 5.47.0 6.7 5.7 5.6 5.5 5.4 5.4
22.83 18.45 22.35 17.05 10.60 7.57 8.3213.03 14.30 11.40 10.28 7.10 6.07 5.7921.75 16.80 16.10 15.54 10.57 7.22 6.88
996 989 984 980 950 929 9050.50 0.44 0.40 0.37 0.33 0.31 0.2927.3 29.7)(3) 30.3 25.1 31.9 36.7 65.82.8 2.7 2.4 2.7 3.7 4.6 4.1
11.9 11.5)(3) 12.2 10.5 10.4 8.5 15.611.25 9.74 9.18 8.09 6.76 6.18 5.68
238,664 229,037 213,973 179,176 158,803 137,988 120,6191,695 1,654 1,741 1,658 1,464 1,460 1,454
40,946 40,894 42,046 38,648 34,592 33,717 33,2722,669 2,322 2,244 2,030 1,526 1,429 1,381
(6) Amounts have been retroactively adjusted to reflect the one-for-one stock dividend paid April 28, 2004 and the two-for-one stock split on February 12, 1998.(7) Based on guidelines issued by the Superintendent, the Bank’s assets to capital ratio is calculated by dividing adjusted total assets by total regulatory capital.(8) Dividend payments as a percentage of net income available to common shareholders.(9) Based on the average of the high and low common share price for the year.(10) Based on the closing common share price.(11) Includes all personnel (part-time stated on a full-time equivalent basis) of the Bank and all its subsidiaries.

82 2004 Scot iabank Annual Report
> 2 0 0 4 C O N S O L I D AT E D F I N A N C I A L S TAT E M E N T S
Page Audited Financial Statements:
84 Management’s Responsibility for Financial Information
84 Shareholders’ Auditors’ Report
85 Consolidated Balance Sheet
86 Consolidated Statement of Income
87 Consolidated Statement of Changes in Shareholders’ Equity
88 Consolidated Statement of Cash Flows
89 Notes to the Consolidated Financial Statements
2004 Scot iabank Annual Report 83
The management of The Bank of Nova Scotia (the Bank) is respon-sible for the integrity and fair presentation of the financial informa-tion contained in this Annual Report. The consolidated financialstatements have been prepared in accordance with Canadiangenerally accepted accounting principles. The consolidated financialstatements also comply with the accounting requirements of theBank Act.
The consolidated financial statements, where necessary, includeamounts which are based on the best estimates and judgement ofmanagement. Financial information presented elsewhere in thisAnnual Report is consistent with that shown in the consolidatedfinancial statements.
Management has always recognized the importance of the Bankmaintaining and reinforcing the highest possible standards ofconduct in all of its actions, including the preparation and dissemi-nation of statements fairly presenting the financial condition of theBank. In this regard, management has developed and maintains asystem of accounting and reporting which provides for the neces-sary internal controls to ensure that transactions are properlyauthorized and recorded, assets are safeguarded against unautho-rized use or disposition, and liabilities are recognized. The system isaugmented by written policies and procedures, the careful selectionand training of qualified staff, the establishment of organizationalstructures providing an appropriate and well-defined division ofresponsibilities, and the communication of policies and guidelines ofbusiness conduct throughout the Bank.
The system of internal controls is further supported by a profes-sional staff of internal auditors who conduct periodic audits of allaspects of the Bank’s operations. As well, the Bank’s Chief Auditorhas full and free access to, and meets periodically with, the Auditand Conduct Review Committee of the Board of Directors. In
addition, the Bank’s compliance function maintains policies, proced-dures and programs directed at ensuring compliance with regulatoryrequirements, including conflict of interest rules.
The Superintendent of Financial Institutions Canada examinesand enquires into the business and affairs of the Bank, to the extentdeemed necessary, to satisfy himself that the provisions of the BankAct, having reference to the safety of the interests of depositors,creditors and shareholders of the Bank, are being duly observed andthat the Bank is in a sound financial condition.
The Audit and Conduct Review Committee, composed entirelyof outside directors, reviews the consolidated financial statementswith both management and the independent auditors before suchstatements are approved by the Board of Directors and submitted tothe shareholders of the Bank.
The Audit and Conduct Review Committee reviews and reportstheir findings to the Board of Directors on all related party transac-tions that may have a material impact on the Bank.
KPMG LLP and PricewaterhouseCoopers LLP, the independentauditors appointed by the shareholders of the Bank, have auditedthe consolidated financial statements of the Bank in accordance withCanadian generally accepted auditing standards and have expressedtheir opinion upon completion of such audit in the following reportto the shareholders. In order to provide their opinion on theseconsolidated financial statements, the Shareholders’ Auditors reviewthe system of internal controls and conduct their work to the extentthat they consider appropriate. The Shareholders’ Auditors have fulland free access to, and meet periodically with, the Audit andConduct Review Committee to discuss their audit and findings as tothe integrity of the Bank’s accounting, financial reporting andrelated matters.
> CONSOL IDATED F INANC IAL STATEMENTS
84 2004 Scot iabank Annual Report
Management’s Responsibility for Financial Information
Rick WaughPresident and Chief Executive Officer
Toronto, November 30, 2004
Sarabjit S. MarwahSenior Executive Vice-Presidentand Chief Financial Officer
KPMG LLPChartered Accountants
PricewaterhouseCoopers LLPChartered Accountants Toronto, November 30, 2004
To the Shareholders of The Bank of Nova ScotiaWe have audited the Consolidated Balance Sheets of The Bank ofNova Scotia as at October 31, 2004 and 2003, and the Consoli-dated Statements of Income, Changes in Shareholders’ Equity andCash Flows for each of the years in the three-year period endedOctober 31, 2004. These financial statements are the responsibilityof the Bank’s management. Our responsibility is to express anopinion on these financial statements based on our audits.
We conducted our audits in accordance with Canadian gener-ally accepted auditing standards. Those standards require that weplan and perform an audit to obtain reasonable assurance whetherthe financial statements are free of material misstatement. An audit
includes examining, on a test basis, evidence supporting theamounts and disclosures in the financial statements. An audit alsoincludes assessing the accounting principles used and significantestimates made by management, as well as evaluating the overallfinancial statement presentation.
In our opinion, these consolidated financial statements presentfairly, in all material respects, the financial position of the Bank as atOctober 31, 2004 and 2003, and the results of its operations andits cash flows for each of the years in the three-year period endedOctober 31, 2004 in accordance with Canadian generally acceptedaccounting principles.
Shareholders’ Auditors’ Report

Consolidated Balance SheetAs at October 31 ($ millions) 2004 2003
AssetsCash resourcesCash and non-interest-bearing deposits with banks $ 1,921 $ 1,373Interest-bearing deposits with banks 12,932 17,111Precious metals 2,302 2,097
17,155 20,581Securities (Note 3)Investment 15,717 20,293Trading 43,056 42,899
58,773 63,192Loans (Note 4)Residential mortgages 69,018 61,646Personal and credit cards 30,182 26,277Business and governments 57,384 64,313Securities purchased under resale agreements 17,880 22,648
174,464 174,884Allowance for credit losses (Note 5 b)) 2,696 3,217
171,768 171,667OtherCustomers’ liability under acceptances 7,086 6,811Trading derivatives’ market valuation (Note 22 d)) 14,198 15,308Land, buildings and equipment (Note 6) 1,872 1,944Goodwill (Note 7) 261 270Other intangible assets (Note 7) 240 284Other assets (Note 8) 7,859 5,835
31,516 30,452$ 279,212 $ 285,892
Liabilities and shareholders’ equityDeposits (Note 9)Personal $ 79,020 $ 76,431Business and governments 94,125 93,541Banks 22,051 22,700
195,196 192,672OtherAcceptances 7,086 6,811Obligations related to securities sold under repurchase agreements 19,428 28,686Obligations related to securities sold short 7,585 9,219Trading derivatives’ market valuation (Note 22 d)) 14,054 14,758Other liabilities (Note 10) 15,733 14,145Non-controlling interest in subsidiaries (Note 11) 2,280 2,326
66,166 75,945Subordinated debentures (Note 12) 2,615 2,661
Shareholders’ equityCapital stock (Note 13)
Preferred shares 550 800Common shares and contributed surplus 3,229 3,141
Retained earnings 13,239 11,747Cumulative foreign currency translation (1,783) (1,074)
15,235 14,614$ 279,212 $ 285,892
Arthur R.A. Scace Rick WaughChairman of the Board President and Chief Executive Officer
The accompanying notes are an integral part of these consolidated financial statements.
2004 Scot iabank Annual Report 85
> CONSOL IDATED F INANC IAL STATEMENTS
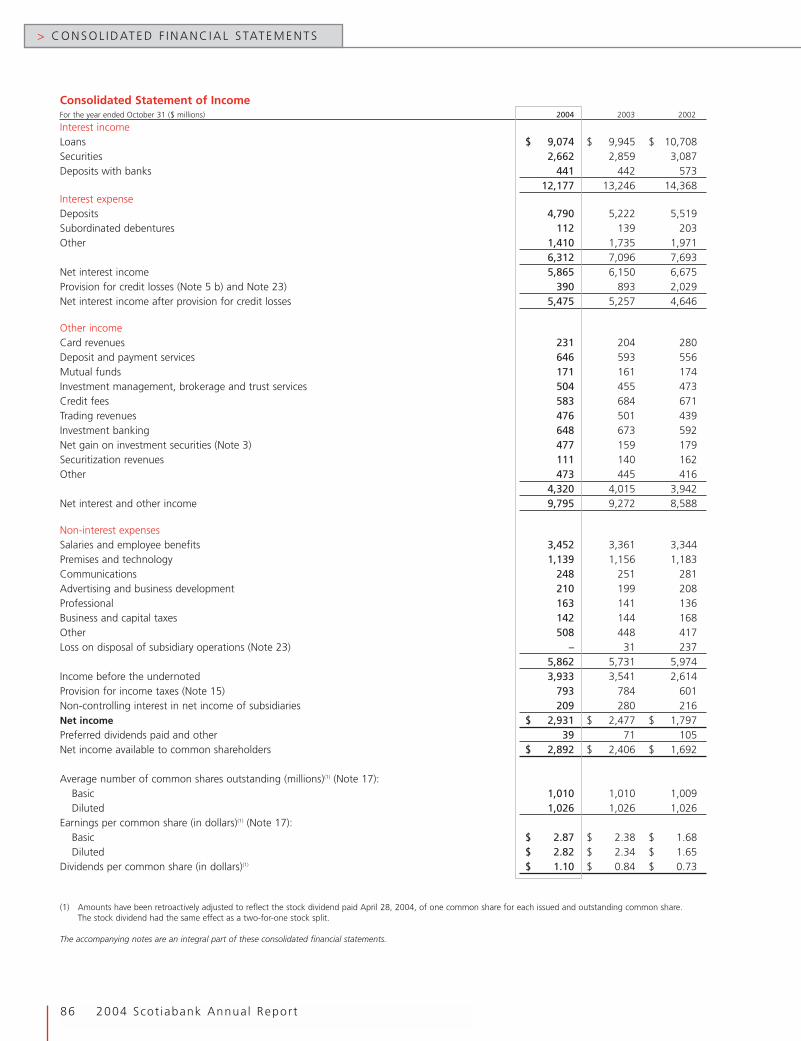
> CONSOL IDATED F INANC IAL STATEMENTS
86 2004 Scot iabank Annual Report
Consolidated Statement of IncomeFor the year ended October 31 ($ millions) 2004 2003 2002
Interest incomeLoans $ 9,074 $ 9,945 $ 10,708Securities 2,662 2,859 3,087Deposits with banks 441 442 573
12,177 13,246 14,368Interest expenseDeposits 4,790 5,222 5,519Subordinated debentures 112 139 203Other 1,410 1,735 1,971
6,312 7,096 7,693Net interest income 5,865 6,150 6,675Provision for credit losses (Note 5 b) and Note 23) 390 893 2,029Net interest income after provision for credit losses 5,475 5,257 4,646
Other incomeCard revenues 231 204 280Deposit and payment services 646 593 556Mutual funds 171 161 174Investment management, brokerage and trust services 504 455 473Credit fees 583 684 671Trading revenues 476 501 439Investment banking 648 673 592Net gain on investment securities (Note 3) 477 159 179Securitization revenues 111 140 162Other 473 445 416
4,320 4,015 3,942Net interest and other income 9,795 9,272 8,588
Non-interest expensesSalaries and employee benefits 3,452 3,361 3,344Premises and technology 1,139 1,156 1,183Communications 248 251 281Advertising and business development 210 199 208Professional 163 141 136Business and capital taxes 142 144 168Other 508 448 417Loss on disposal of subsidiary operations (Note 23) – 31 237
5,862 5,731 5,974Income before the undernoted 3,933 3,541 2,614Provision for income taxes (Note 15) 793 784 601Non-controlling interest in net income of subsidiaries 209 280 216Net income $ 2,931 $ 2,477 $ 1,797Preferred dividends paid and other 39 71 105Net income available to common shareholders $ 2,892 $ 2,406 $ 1,692
Average number of common shares outstanding (millions)(1) (Note 17):Basic 1,010 1,010 1,009Diluted 1,026 1,026 1,026
Earnings per common share (in dollars)(1) (Note 17):Basic $ 2.87 $ 2.38 $ 1.68Diluted $ 2.82 $ 2.34 $ 1.65
Dividends per common share (in dollars)(1) $ 1.10 $ 0.84 $ 0.73
(1) Amounts have been retroactively adjusted to reflect the stock dividend paid April 28, 2004, of one common share for each issued and outstanding common share.The stock dividend had the same effect as a two-for-one stock split.
The accompanying notes are an integral part of these consolidated financial statements.
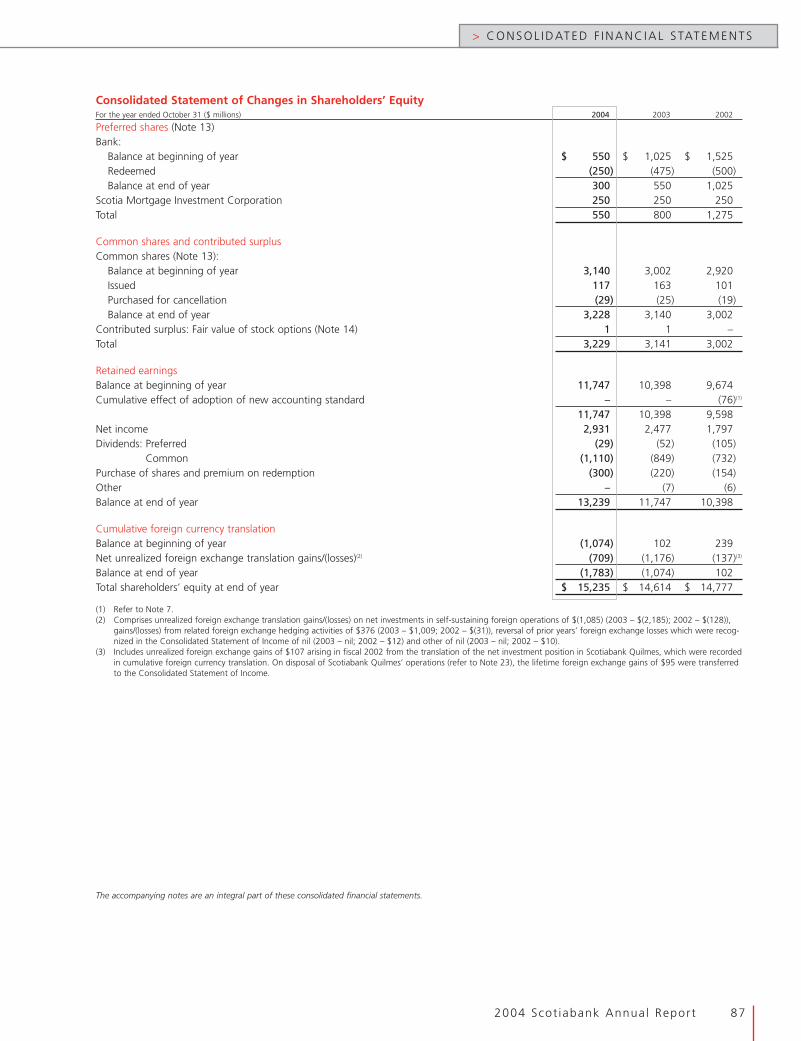
Consolidated Statement of Changes in Shareholders’ EquityFor the year ended October 31 ($ millions) 2004 2003 2002
Preferred shares (Note 13)Bank:
Balance at beginning of year $ 550 $ 1,025 $ 1,525Redeemed (250) (475) (500)Balance at end of year 300 550 1,025
Scotia Mortgage Investment Corporation 250 250 250Total 550 800 1,275
Common shares and contributed surplusCommon shares (Note 13):
Balance at beginning of year 3,140 3,002 2,920Issued 117 163 101Purchased for cancellation (29) (25) (19)Balance at end of year 3,228 3,140 3,002
Contributed surplus: Fair value of stock options (Note 14) 1 1 –Total 3,229 3,141 3,002
Retained earningsBalance at beginning of year 11,747 10,398 9,674Cumulative effect of adoption of new accounting standard – – (76)(1)
11,747 10,398 9,598Net income 2,931 2,477 1,797Dividends: Preferred (29) (52) (105)
Common (1,110) (849) (732)Purchase of shares and premium on redemption (300) (220) (154)Other – (7) (6)Balance at end of year 13,239 11,747 10,398
Cumulative foreign currency translationBalance at beginning of year (1,074) 102 239Net unrealized foreign exchange translation gains/(losses)(2) (709) (1,176) (137)(3)
Balance at end of year (1,783) (1,074) 102Total shareholders’ equity at end of year $ 15,235 $ 14,614 $ 14,777
(1) Refer to Note 7.(2) Comprises unrealized foreign exchange translation gains/(losses) on net investments in self-sustaining foreign operations of $(1,085) (2003 – $(2,185); 2002 – $(128)),
gains/(losses) from related foreign exchange hedging activities of $376 (2003 – $1,009; 2002 – $(31)), reversal of prior years’ foreign exchange losses which were recog-nized in the Consolidated Statement of Income of nil (2003 – nil; 2002 – $12) and other of nil (2003 – nil; 2002 – $10).
(3) Includes unrealized foreign exchange gains of $107 arising in fiscal 2002 from the translation of the net investment position in Scotiabank Quilmes, which were recordedin cumulative foreign currency translation. On disposal of Scotiabank Quilmes’ operations (refer to Note 23), the lifetime foreign exchange gains of $95 were transferredto the Consolidated Statement of Income.
The accompanying notes are an integral part of these consolidated financial statements.
2004 Scot iabank Annual Report 87
> CONSOL IDATED F INANC IAL STATEMENTS
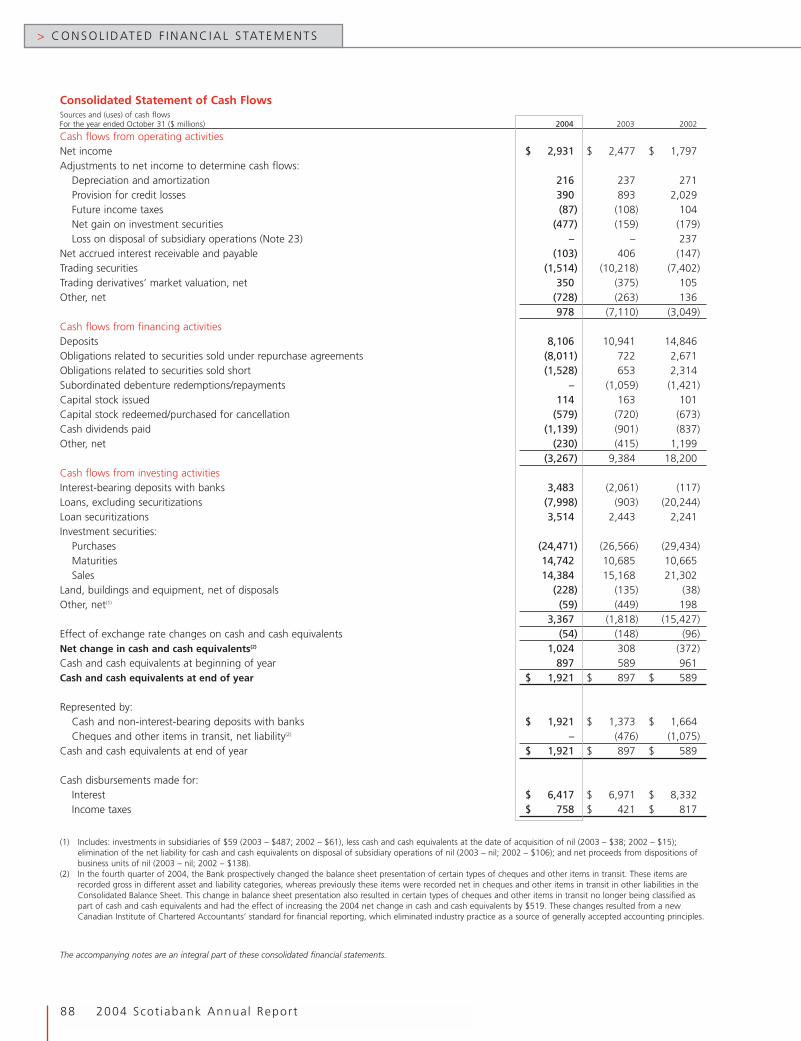
> CONSOL IDATED F INANC IAL STATEMENTS
88 2004 Scot iabank Annual Report
Consolidated Statement of Cash FlowsSources and (uses) of cash flowsFor the year ended October 31 ($ millions) 2004 2003 2002
Cash flows from operating activitiesNet income $ 2,931 $ 2,477 $ 1,797Adjustments to net income to determine cash flows:
Depreciation and amortization 216 237 271Provision for credit losses 390 893 2,029Future income taxes (87) (108) 104Net gain on investment securities (477) (159) (179)Loss on disposal of subsidiary operations (Note 23) – – 237
Net accrued interest receivable and payable (103) 406 (147)Trading securities (1,514) (10,218) (7,402)Trading derivatives’ market valuation, net 350 (375) 105Other, net (728) (263) 136
978 (7,110) (3,049)Cash flows from financing activitiesDeposits 8,106 10,941 14,846Obligations related to securities sold under repurchase agreements (8,011) 722 2,671Obligations related to securities sold short (1,528) 653 2,314Subordinated debenture redemptions/repayments – (1,059) (1,421)Capital stock issued 114 163 101Capital stock redeemed/purchased for cancellation (579) (720) (673)Cash dividends paid (1,139) (901) (837)Other, net (230) (415) 1,199
(3,267) 9,384 18,200Cash flows from investing activitiesInterest-bearing deposits with banks 3,483 (2,061) (117)Loans, excluding securitizations (7,998) (903) (20,244)Loan securitizations 3,514 2,443 2,241Investment securities:
Purchases (24,471) (26,566) (29,434)Maturities 14,742 10,685 10,665Sales 14,384 15,168 21,302
Land, buildings and equipment, net of disposals (228) (135) (38)Other, net(1) (59) (449) 198
3,367 (1,818) (15,427)Effect of exchange rate changes on cash and cash equivalents (54) (148) (96)Net change in cash and cash equivalents(2) 1,024 308 (372)Cash and cash equivalents at beginning of year 897 589 961Cash and cash equivalents at end of year $ 1,921 $ 897 $ 589
Represented by:Cash and non-interest-bearing deposits with banks $ 1,921 $ 1,373 $ 1,664Cheques and other items in transit, net liability(2) – (476) (1,075)
Cash and cash equivalents at end of year $ 1,921 $ 897 $ 589
Cash disbursements made for:Interest $ 6,417 $ 6,971 $ 8,332Income taxes $ 758 $ 421 $ 817
(1) Includes: investments in subsidiaries of $59 (2003 – $487; 2002 – $61), less cash and cash equivalents at the date of acquisition of nil (2003 – $38; 2002 – $15);elimination of the net liability for cash and cash equivalents on disposal of subsidiary operations of nil (2003 – nil; 2002 – $106); and net proceeds from dispositions ofbusiness units of nil (2003 – nil; 2002 – $138).
(2) In the fourth quarter of 2004, the Bank prospectively changed the balance sheet presentation of certain types of cheques and other items in transit. These items arerecorded gross in different asset and liability categories, whereas previously these items were recorded net in cheques and other items in transit in other liabilities in theConsolidated Balance Sheet. This change in balance sheet presentation also resulted in certain types of cheques and other items in transit no longer being classified aspart of cash and cash equivalents and had the effect of increasing the 2004 net change in cash and cash equivalents by $519. These changes resulted from a newCanadian Institute of Chartered Accountants’ standard for financial reporting, which eliminated industry practice as a source of generally accepted accounting principles.
The accompanying notes are an integral part of these consolidated financial statements.

Page Note
90 1. Significant accounting policies
94 2. Future accounting changes
95 3. Securities
96 4. Loans
98 5. Impaired loans and allowance for credit losses
98 6. Land, buildings and equipment
99 7. Goodwill and other intangible assets
99 8. Other assets
100 9. Deposits
100 10. Other liabilities
100 11. Non-controlling interest in subsidiaries
101 12. Subordinated debentures
102 13. Capital stock
103 14. Stock-based compensation
105 15. Corporate income taxes
106 16. Employee future benefits
108 17. Earnings per common share
108 18. Related party transactions
108 19. Segmented results of operations
111 20. Guarantees, commitments and contingent liabilities
113 21. Financial instruments
116 22. Derivative instruments
119 23. Argentine charges
120 24. Acquisitions
120 25. Sale of business
121 26. Reconciliation of Canadian and United States generally accepted accounting principles
> N O T E S T O T H E C O N S O L I D AT E D F I N A N C I A L S TAT E M E N T S
2004 Scot iabank Annual Report 89

1. Significant accounting policies
The consolidated financial statements of The Bank of Nova Scotia havebeen prepared in accordance with Section 308 of the Bank Actwhich states that, except as otherwise specified by the Superinten-dent of Financial Institutions Canada (the Superintendent), thefinancial statements are to be prepared in accordance withCanadian generally accepted accounting principles (GAAP). Thesignificant accounting policies used in the preparation of theseconsolidated financial statements, including the accounting require-ments of the Superintendent, are summarized on the followingpages. These accounting policies conform, in all material respects, toCanadian GAAP. In addition, Note 26 describes and reconciles thesignificant measurement differences between Canadian and U.S.GAAP affecting the accompanying consolidated financial statements.
The preparation of financial statements in conformity with GAAPrequires management to make estimates and assumptions that affectthe reported amount of assets and liabilities at the date of the financialstatements, and income and expenses during the reporting period. Keyareas of estimation where management has made difficult, complex orsubjective judgements, often as a result of matters that are inherentlyuncertain, include those relating to the allowance for credit losses, thefair value of financial instruments, corporate income taxes, pensionsand other employee future benefits, and other-than-temporary impair-ment of investment securities. Therefore, actual results could differfrom these and other estimates.
Certain comparative amounts have been reclassified to conformwith current year presentation. Where new accounting policies havebeen adopted during the year, the effects of these changes havebeen discussed in the respective notes.
Basis of consolidationThe consolidated financial statements include the assets, liabilities,results of operations and cash flows of the Bank and all of itssubsidiaries after the elimination of intercompany transactions andbalances. Subsidiaries are defined as corporations controlled by theBank, which are normally corporations in which the Bank owns morethan 50% of the voting shares.
Investments in associated corporations where the Bank hassignificant influence, which is normally evidenced by direct or indi-rect ownership of between 20% and 50% of the voting shares, areaccounted for using the equity method and are included in invest-ment securities in the Consolidated Balance Sheet. The Bank’s shareof earnings of such corporations is included in interest income –securities in the Consolidated Statement of Income.
Translation of foreign currenciesForeign currency monetary assets and liabilities of the Bank’sintegrated foreign operations, and all foreign currency denominatedassets and liabilities of its self-sustaining foreign operations aretranslated into Canadian dollars at rates prevailing at the end of thefinancial period. Foreign currency non-monetary assets and liabilitiesof the Bank’s integrated foreign operations are translated intoCanadian dollars at historical rates.
Unrealized gains and losses arising upon translation of netforeign currency investment positions in self-sustaining branches,subsidiaries and associated corporations, together with any gains orlosses arising from hedges of those net investment positions, arecredited or charged to cumulative foreign currency translation in theConsolidated Balance Sheet, except as noted below. Upon sale,reduction or substantial liquidation of an investment position, thepreviously recorded unrealized gains or losses thereon are trans-ferred from cumulative foreign currency translation in the Consoli-dated Balance Sheet to the Consolidated Statement of Income.
Translation gains and losses arising in the Bank’s integrated foreignoperations, as well as those arising from self-sustaining foreign opera-tions in highly inflationary environments, if any, are included in otherincome-trading revenues in the Consolidated Statement of Income.
Revenues and expenses denominated in foreign currencies aretranslated using average exchange rates, except for depreciationand amortization of foreign currency denominated buildings, equip-ment and leasehold improvements of the Bank’s integrated foreignoperations, which are translated using historical rates.
Precious metalsPrecious metals are carried at market value and are included in cashresources in the Consolidated Balance Sheet. The liability arisingfrom outstanding certificates is also carried at market value andincluded in other liabilities in the Consolidated Balance Sheet.
SecuritiesSecurities are held in either the investment or trading portfolio. Invest-ment securities comprise debt and equity securities held for liquidityand longer-term investment. Equity securities in which the Bank’sholdings of voting shares are less than 20% are carried at cost, exceptwhere significant influence is demonstrated. Debt securities held in theinvestment account are carried at amortized cost with premiums anddiscounts being amortized to interest income – securities over theperiod to maturity. When there has been a decline in value of debt orequity securities that is other than temporary, the carrying value of thesecurities is appropriately reduced. Such reductions, if any, togetherwith gains and losses on disposals, which are determined on anaverage cost basis, are included in other income – net gain oninvestment securities in the Consolidated Statement of Income.
Trading securities are intended to be held for a short period of timeand are carried at market value. Gains and losses on disposal and adjust-ments to market value are included in other income – trading revenuesin the Consolidated Statement of Income. Where securities are used tomanage the volatility of stock-based compensation, gains and losses ondisposal and adjustments to market value are included in salaries andemployee benefits expense in the Consolidated Statement of Income.
LoansLoans are stated net of any unearned income and of an allowancefor credit losses. Interest income is accounted for on the accrualbasis for all loans other than impaired loans. Accrued interest isincluded in other assets in the Consolidated Balance Sheet.
A loan is classified as impaired when, in management’s opinion,there has been a deterioration in credit quality to the extent that thereis no longer reasonable assurance of timely collection of the fullamount of principal and interest. If a payment on a loan is contractually90 days in arrears, the loan will be classified as impaired, if not alreadyclassified as such, unless the loan is fully secured, the collection of thedebt is in process, and the collection efforts are reasonably expected toresult in repayment of the loan or in restoring it to a current statuswithin 180 days from the date a payment has become contractually inarrears. Finally, a loan that is contractually 180 days in arrears is classi-fied as impaired in all situations, except when it is guaranteed orinsured by the Canadian government, the provinces or a Canadiangovernment agency; such loans are classified as impaired if the loan iscontractually in arrears for 365 days. Any credit card loan that has apayment that is contractually 180 days in arrears is written off.
When a loan is classified as impaired, recognition of interestceases. Interest received on impaired loans is credited to the carryingvalue of the loan.
Loans are generally returned to accrual status when the timelycollection of both principal and interest is reasonably assured and alldelinquent principal and interest payments are brought current.
> CONSOL IDATED F INANC IAL STATEMENTS
90 2004 Scot iabank Annual Report

Foreclosed assets received after April 30, 2003 meeting specifiedcriteria are considered to be held for sale and recorded in other assetsin the Consolidated Balance Sheet at fair value less costs to sell. If thespecified criteria are not met, the asset is considered to be held foruse, measured initially at fair value and accounted for in the samemanner as a similar asset acquired in the normal course of business.Prior to May 1, 2003, foreclosed assets were included in impairedloans and presumed to be held for sale.
Loan fees are recognized in interest income over the appropriatelending or commitment period. Mortgage prepayment fees arerecognized in interest income when received, unless they relate to aminor modification to the terms of the mortgage, in which case thefees are deferred and amortized over the remaining period of theoriginal mortgage. Loan syndication fees are included in credit feesin other income when the syndication is completed.
Securities purchased under resale agreements and obligationsrelated to securities sold under repurchase agreementsThe purchase and sale of securities under resale and repurchaseagreements are treated as collateralized lending and borrowingtransactions and are recorded at cost. The related interest incomeand interest expense are recorded on an accrual basis.
Obligations related to securities sold shortThe Bank’s obligation to deliver securities sold that were not ownedat the time of sale is recorded at fair value. Realized and unrealizedgains and losses are recorded in other income – trading revenues inthe Consolidated Statement of Income. Interest expense accruing ondebt securities sold short is recorded in interest expense in theConsolidated Statement of Income.
Allowance for credit lossesThe Bank maintains an allowance for credit losses which, in manage-ment’s opinion, is adequate to absorb all incurred credit-related losses inits portfolio of the following on-and off-balance sheet items: depositswith banks, securities purchased under resale agreements, loans, accept-ances and other indirect credit commitments, such as letters of creditand guarantees. The allowance for credit losses consists of specificallowances and a general allowance, each of which is reviewed on aregular basis. The allowance for credit losses against on-balance sheetitems is included as a reduction of the related asset category, andallowances relating to off-balance sheet items are included in other liabil-ities in the Consolidated Balance Sheet. Full or partial write-offs of loansare generally recorded when management believes there is no realisticprospect of full recovery. Actual write-offs, net of recoveries, arededucted from the allowance for credit losses.
Specific allowancesSpecific allowances, except those relating to credit card loans,certain personal loans and certain international residential mort-gages, are determined on an item-by-item basis and reflect theassociated estimated credit loss. In the case of loans, the specificallowance is the amount that is required to reduce the carrying valueof an impaired loan to its estimated realizable amount. Generally,the estimated realizable amount is determined by discounting theexpected future cash flows at the effective interest rate inherent inthe loan at the date of impairment. When the amounts and timingof future cash flows cannot be measured with reasonable reliability,either the fair value of any security underlying the loan, net ofexpected costs of realization and any amounts legally required to bepaid to the borrower, or the observable market price for the loan isused to measure the estimated realizable amount. The change in thepresent value attributable to the passage of time on the expectedfuture cash flows is reported as a reduction of the provision for credit
losses in the Consolidated Statement of Income. Specific allowancesfor credit card loans, certain personal loans and certain internationalresidential mortgages are calculated using a formula method takinginto account recent loss experience.
General allowanceThe general allowance is established against the loan portfolio inrespect of the Bank’s core business lines where prudent assessment bythe Bank of past experience and existing economic and portfolioconditions indicate that it is probable that losses have occurred, butwhere such losses cannot be determined on an item-by-item basis.
The general allowance for business and government loans isunderpinned by a risk rating process in which internal risk ratings areassigned at the time of loan origination, monitored on an ongoingbasis, and adjusted to reflect changes in underlying credit risk. Withthe internal risk ratings as the foundation, the allowance is initiallycalculated through the application of migration and default statisticsby risk rating, loss severity in the event of default, and exposure atdefault patterns within each of the business line portfolios. Basedupon recent observable data, senior management forms a judgementwhether adjustments are necessary to the initially calculated (quantita-tive) allowance and the amount of any such adjustments. In makingthis judgement, management considers observable factors such aseconomic trends and business conditions, portfolio concentrations,and trends in volumes and severity of delinquencies.
For personal loan, credit card and mortgage portfolios, expectedlosses are estimated through analysis of historical loss migration andwrite-off trends.
The level of the general allowance is re-assessed quarterly and mayfluctuate as a result of changes in portfolio volumes, concentrations andrisk profile; analysis of evolving trends in probability of loss, severity ofloss and exposure at default factors; and management’s current assess-ment of factors that may have affected the condition of the portfolio.
While the total general allowance is established through a step-by-step process that considers risk arising from specific segments ofthe portfolio, the resulting total general allowance is available toabsorb all incurred losses in the loan portfolio.
Change in accounting policy:Prior to fiscal 2004, the Bank maintained a country risk allowance.Effective November 1, 2003, the country risk allowance related toinvestment securities ($363 million) is no longer disclosed as part ofthe allowance for credit losses [refer to Note 5b)], but continues tobe deducted from investment securities. The balance of the countryrisk allowance ($23 million) was related to impaired loans, and wasreclassified to the specific allowance. This change in presentation wasmade following the Canadian Institute of Chartered Accountants’(CICA) elimination of industry practice as a source of GAAP.
Sales of loansTransfers of loans to unrelated parties are treated as sales providedthat control over the transferred loans has been surrendered andconsideration other than beneficial interests in the transferred loanshas been received in exchange. If these criteria are not satisfied, thenthe transfers are treated as financing transactions. If treated as sales,the loans are removed from the Consolidated Balance Sheet and again or loss is recognized in income immediately based on thecarrying value of the loans transferred, allocated between the assetssold and the retained interests in proportion to their fair values at thedate of transfer. The fair values of loans sold, retained interests andrecourse liabilities are determined using either quoted market prices,pricing models which take into account management’s best estimatesof key assumptions such as expected losses, prepayments and
2004 Scot iabank Annual Report 91
> CONSOL IDATED F INANC IAL STATEMENTS
discount rates commensurate with the risks involved, or sales ofsimilar assets. Where the Bank continues to service the loans sold, aservicing liability or asset is recognized and amortized over the serv-icing period as servicing fees.
Retained interests in securitizations that can be contractually prepaidor otherwise settled in such a way that the Bank would not recoversubstantially all of its recorded investment are classified in investmentsecurities in the Consolidated Balance Sheet. Such retained interests aretested regularly for other-than-temporary impairment. When there hasbeen an adverse change in the expected cash flows and the fair value ofsuch retained interests is less than the carrying value, the retainedinterest’s carrying value is reduced to that fair value by a charge to securi-tization revenues in the Consolidated Statement of Income. Otherretained interests are classified and accounted for as loans.
For securitizations of loans, gains and losses on sale and servicingfee revenues are reported in other income – securitization revenuesin the Consolidated Statement of Income. Where a servicing liabilityor asset is recognized, the amount is recorded in other liabilities orother assets in the Consolidated Balance Sheet.
On November 1, 2002, the Bank established a new accountingpolicy for the sale of performing loans (other than by way of securitiza-tion), which is one of its credit risk management strategies. As such,gains and losses are reported in other income – other. Gains and losseson sales of impaired loans are reported in the provision for credit losses.
AcceptancesThe Bank’s potential liability under acceptances is reported as a liabilityin the Consolidated Balance Sheet. The Bank has equal and offsettingclaims against its customers in the event of a call on these commit-ments, which are reported as an asset. Fees earned are reported inother income – credit fees in the Consolidated Statement of Income.
Land, buildings and equipmentLand is carried at cost. Buildings, equipment and computer software,and leasehold improvements are carried at cost less accumulateddepreciation and amortization. Depreciation and amortization arecalculated using the straight-line method over the estimated usefullife of the related asset as follows: buildings – 40 years, equipmentand computer software – 3 to 10 years and leasehold improvements –term of lease plus one renewal option period.
Net gains and losses on disposal are included in other income – other,in the Consolidated Statement of Income, in the year of disposal.
Change in accounting policy:Effective November 1, 2003, qualifying costs incurred for computersoftware are capitalized and depreciated on a prospective basis. Thischange was made following the CICA’s elimination of industry prac-tice as a source of GAAP. Prior to this date, these costs were expensedas incurred. The adoption of this accounting policy did not have amaterial impact on the Bank’s results of operations for fiscal 2004.
Goodwill and other intangible assetsEffective November 1, 2001, the Bank retroactively adopted a newCICA accounting standard for goodwill and other intangible assetswithout restatement of prior periods.
Goodwill is the excess of the purchase price paid for the acquisi-tion of a subsidiary over the fair value of the net assets acquired.
Goodwill and other intangible assets with indefinite useful livesare not amortized, but are subject to impairment tests on at least anannual basis. Goodwill is allocated to reporting units and any poten-tial goodwill impairment is identified by comparing the carrying valueof a reporting unit with its fair value. If any potential impairment isindicated, then it is quantified by comparing the carrying value of
goodwill to its fair value, calculated as the fair value of the reportingunit less the fair value of its assets and liabilities.
Intangible assets, other than goodwill, which do not have indefi-nite useful lives are amortized on a straight-line basis over theiruseful lives not exceeding 20 years. These intangible assets aresubject to an impairment test when events and circumstances indi-cate the carrying amounts may not be recoverable. The amortizationof intangible assets is recorded in other non-interest expenses in theConsolidated Statement of Income.
Corporate income taxesThe Bank follows the asset and liability method of accounting forcorporate income taxes. Under this method, future tax assets andliabilities represent the cumulative amount of tax applicable to tempo-rary differences between the carrying amount of the assets and liabili-ties, and their values for tax purposes. Future tax assets and liabilitiesare measured using enacted or substantively enacted tax ratesexpected to apply to taxable income in the years in which thosetemporary differences are expected to be recovered or settled.Changes in future income taxes related to a change in tax rates arerecognized in income in the period of the tax rate change.
Future tax assets and liabilities are included in other assets andother liabilities in the Consolidated Balance Sheet.
Derivative instrumentsDerivative instruments are financial contracts whose value is derivedfrom interest rates, foreign exchange rates or other financial orcommodity indices. Most derivative instruments can be character-ized as interest rate contracts, foreign exchange and gold contracts,commodity contracts, equity contracts or credit contracts. Derivativeinstruments are either exchange-traded contracts or negotiatedover-the-counter contracts. Exchange-traded derivatives includefutures and option contracts. Negotiated over-the-counter deriva-tives include swaps, forwards and options.
The Bank enters into these derivative instruments to accommo-date the risk management needs of its customers, for proprietarytrading and for asset/liability management purposes.
Derivative instruments designated as “trading” include deriva-tives entered into with customers to accommodate their riskmanagement needs and derivatives transacted to generate tradingincome from the Bank’s proprietary trading positions. Trading deriva-tives are carried at their fair values [refer to Note 22d)]. In deter-mining the fair value of trading derivatives, a deferral is made tocover credit risk and ongoing direct costs over the life of the instru-ments. The gains and losses resulting from changes in fair values areincluded in other income – trading revenues in the ConsolidatedStatement of Income. Unrealized gains and unrealized losses ontrading derivatives are reported separately in the ConsolidatedBalance Sheet as trading derivatives’ market valuation.
Derivative instruments designated as “asset/liability manage-ment” (non-trading) are those used to manage the Bank’s interestrate, foreign currency and other exposures. These include instru-ments that meet specified criteria to be designated as hedges foraccounting purposes. Commencing in 2004, the criteria to desig-nate hedges for accounting purposes are more stringent andformalized (see Change in accounting policy below).
Income and expenses on derivative instruments designated andqualifying as hedges are recognized in the Consolidated Statement ofIncome in the same period as the related hedged item. If a designatedhedge is no longer effective, the associated derivative instrument issubsequently carried at fair value. Asset/liability management derivativesthat do not qualify for hedge accounting are carried at fair value on
> CONSOL IDATED F INANC IAL STATEMENTS
92 2004 Scot iabank Annual Report

the Consolidated Balance Sheet, and subsequent changes in their fairvalue are recorded in the Consolidated Statement of Income asfollows: interest rate-related contracts in net interest income; optionsused in managing investment securities in net gain on investmentsecurities; and other derivative contracts in other income – other.Accrued income and expenses, and deferred gains and losses areincluded in other assets and other liabilities, as appropriate, in theConsolidated Balance Sheet.
Where the Bank manages its exposures using written creditdefault swaps, these derivatives are carried at fair value withchanges in their fair value included in other income – other, in theConsolidated Statement of Income. Where derivative instrumentsare used to manage the volatility of stock-based compensation,these derivatives are carried at fair value with changes in their fairvalue included in salaries and employee benefits expense, in theConsolidated Statement of Income.
Change in accounting policy:Effective November 1, 2003, the Bank adopted a new accounting guide-line for hedging relationships, issued by the CICA. This guideline estab-lishes certain qualifying conditions for the use of hedge accounting,which are more stringent and formalized than prior standards. The Bankformally documents all relationships between hedging instruments andhedged items, as well as its risk management objective and strategy forundertaking various hedge transactions. This process includes linking allderivatives to specific assets and liabilities on the Consolidated BalanceSheet or to specific firm commitments or forecasted transactions. TheBank also formally assesses, both at the hedge’s inception and on anongoing basis, whether the derivatives that are used in hedging transac-tions are highly effective in offsetting changes in fair values or cash flowsof hedged items.
The Bank reassessed its hedging relationships as at November 1,2003, which on transition resulted in an associated unrealized net lossof $44 million from asset/liability management derivatives that did notqualify for hedge accounting under the new criteria. This amount wasdeferred in other assets in the Consolidated Balance Sheet, and isbeing recognized in earnings as the original hedged items affect netincome. The adoption of this accounting guideline did not have amaterial impact on the Bank’s results of operations for fiscal 2004.
Employee future benefitsThe Bank provides pension and other future benefit plans for quali-fied employees in Canada, the United States and other internationaloperations. Pension benefits are generally based on an employee’slength of service and the final five years’ average salary. Otherfuture benefits provided include post-retirement health care, dentalcare and life insurance, along with post-employment benefits andcompensated absences.
The cost of these employee future benefits is actuarially determinedeach year using the projected benefit method prorated on service. Thecalculation uses management’s best estimate of a number of assump-tions – including the long-term rates of investment return on plan assets,future compensation, health care costs, mortality, as well as the retire-ment age of employees. The discount rate is based on market conditionsas at the calculation date. The expected return on plan assets is generallybased on a market-related value of plan assets, where gains or losses onequity investments are recognized over three years; fixed income invest-ments are recognized at market value. The Bank’s main pension planuses a measurement date of August 31, while the other principalemployee future benefit plans use a July 31 date.
Past service costs, from plan amendments that impact previouslyearned employee benefits, are amortized on a straight-line basis over the
estimated average remaining period to full benefit eligibility for activeemployees. For the Bank’s principal plans, these periods range from 11 to22 years. If the unrecognized net actuarial gain or loss is more than 10%of the greater of the plan assets or benefit obligation at the beginning ofthe year, the excess above this 10% threshold is generally amortized overthe estimated average remaining service period of employees. For theBank’s principal plans, these periods range from 11 years to 22 years. Apension valuation allowance is recognized if the prepaid benefit expense(the cumulative difference between pension income/expense and fundingcontributions) is more than the Bank’s expected future benefit.
The cumulative difference between pension income/expense andfunding contributions is included in other assets and other liabilitiesin the Consolidated Balance Sheet. The difference between otherfuture benefits expense and payments to qualified plan members isincluded in other assets and other liabilities in the ConsolidatedBalance Sheet.
Stock-based compensationThe Bank has stock option plans and other stock-based compensa-tion plans for certain eligible employees and non-officer directorsthat are described more fully in Note 14.
In December 2001, the CICA issued a new accounting standardfor stock-based compensation and other stock-based payments. Thenew standard required the use of a fair-value-based method toaccount for certain stock-based compensation arrangements, andencouraged, but did not require, fair value accounting for employeestock options. The Bank adopted this new standard effectiveNovember 1, 2002, on a prospective basis for all of its stock-basedcompensation plans, including employee stock options. The transi-tion to this standard did not have an impact on the consolidatedfinancial statements as at the date of adoption.
Furthermore, in November 2003, the CICA amended the standardon stock-based compensation and stock-based payments to requireemployee stock options to be accounted for using a fair-value-basedmethod. This change did not impact the Bank’s current accounting forstock-based compensation or other stock-based payments.
For stock options granted prior to November 1, 2002, the Bankaccounts for these options using the intrinsic method. Under thismethod, the Bank does not recognize any compensation expense,since the exercise price was set at an amount equal to the closing priceon the day prior to the grant of the stock options. When these stockoptions are exercised, the proceeds received by the Bank are creditedto common shares in the Consolidated Balance Sheet.
Commencing November 1, 2002, new stock option grants toemployees have Tandem Stock Appreciation Rights (Tandem SARs),which provide the employee the choice to either exercise the stockoption for shares, or to exercise the Tandem SAR and thereby receive theintrinsic value of the stock option in cash. Tandem SARs were alsoretroactively attached to the fiscal 2002 employee stock option grants.Options with Tandem SARs are accounted for in the same manner as theBank’s other stock-based compensation plans as described below. If anemployee chooses to exercise the option, thereby cancelling the TandemSAR, both the exercise price and the accrued liability are credited tocommon shares in the Consolidated Balance Sheet.
Effective November 1, 2002, new stock option grants to non-officer directors (which do not have Tandem SAR features) areexpensed using a fair-value-based method (Black-Scholes pricingmodel) and recorded in other non-interest expenses with a correspon-ding credit to contributed surplus in the Consolidated Balance Sheet.
The Bank’s other stock-based compensation plans (includingstock options with Tandem SAR features) are awards that may call
2004 Scot iabank Annual Report 93
> CONSOL IDATED F INANC IAL STATEMENTS
> CONSOL IDATED F INANC IAL STATEMENTS
94 2004 Scot iabank Annual Report
for settlement in cash and therefore, are accounted for as a liability.Changes in the Bank’s obligations under these stock-based compen-sation plans, which arise from fluctuations in the market price of theBank’s common shares underlying these compensation plans, arerecorded in salaries and employee benefits expense in the Consoli-dated Statement of Income with a corresponding accrual in otherliabilities in the Consolidated Balance Sheet.
2. Future accounting changes
The following summarizes the known and finalized accounting policychanges that are relevant to the Bank’s Consolidated Financial State-ments in 2005.
Consolidation of variable interest entities (VIEs)In June 2003, the CICA issued a new accounting guideline whichrequires the consolidation of VIEs by the primary beneficiary. Revi-sions to this guideline were published by the CICA in August 2004to harmonize with the U.S. VIE accounting standard.
A VIE is an entity where (a) its equity investment at risk is insuffi-cient to permit the entity to finance its activities without additionalsubordinated support from others and/or where certain essentialcharacteristics of a controlling financial interest are not met, and (b)it does not meet specified exemption criteria. The primary benefi-ciary is the enterprise that will absorb or receive the majority of theVIE’s expected losses, expected residual returns, or both. This guide-line is effective for the Bank commencing November 1, 2004.
The following is a summary by VIE category of the presently esti-mated financial statement impact of this new guideline. Accountingstandard setters continue to deliberate implementation issues associ-ated with this guideline. As implementation issues are addressedand revisions to the accounting guidance are made, the estimatedeffects of this new guideline, as discussed below, may change.
Securitization vehiclesThe Bank administers three multi-seller commercial paper conduitprograms. The programs involve the purchase of assets by conduit vehi-cles from outside parties funded by the issuance of asset-backedcommercial paper (totalling $7 billion as at October 31, 2004). Thesellers continue to service the assets and absorb first losses for theirportion of the program. The Bank has no rights to these assets, butmanages for a fee the commercial paper selling program and, in someinstances, is the counterparty to derivatives contracts with these conduitsand provides them a large portion of the backstop liquidity and partialcredit enhancement facilities. As a result, under the new accountingguideline, the Bank is considered the primary beneficiary for theseprograms and will consolidate them as of November 1, 2004. The Bankcontinues to assess restructuring alternatives that may require theseprograms to be deconsolidated in the future.
The Bank has historically securitized portions of its personal loanand mortgage portfolios [as discussed in Note 4 b)]. The Bank willnot consolidate the related securitization vehicles as they are exemptunder the new guideline.
Scotiabank Trust SecuritiesThe Bank has issued $2.0 billion in innovative Tier 1 capital usingtwo trust structures: BNS Capital Trust and Scotiabank Capital Trust[refer to Note 11]. These structures are considered to be VIEs underthe new accounting guideline. The Bank is the primary beneficiaryfor BNS Capital Trust, and will continue to consolidate this structure.However, the Bank is not the primary beneficiary for ScotiabankCapital Trust. As a result, the Bank will deconsolidate $1.5 billion of
non-controlling interest in subsidiaries and record this amount onthe Consolidated Balance Sheet as a deposit liability. This change isestimated to increase interest expense by $97 million for the yearending October 31, 2005, with the non-controlling interest in netincome of subsidiaries decreasing by $97 million. The change willnot impact net income available to common shareholders or earn-ings per share. As well, this change will not impact the Bank’scapital ratios as the Superintendent has confirmed that existingsecurities issued under these trust structures will remain as eligibleTier 1 capital. The Bank continues to hold a significant interest inScotiabank Capital Trust resulting in a maximum loss exposure tothis entity of $77 million as at October 31, 2004.
Personal and corporate trust, and mutual fund structuresCertain personal and corporate trust, and mutual fund structuresare VIEs under the new accounting guideline as there is a dispropor-tionate relationship between the control of the assets and the rightsto the investment returns and losses. The Bank has no exposure toloss on these structures as it does not guarantee the performance ofthe underlying assets, nor does it have the right to these assetsexcept for the collection of fees and expense recoveries. Accord-ingly, the Bank is not the primary beneficiary of those personal andcorporate trust, and mutual fund structures that are VIEs. As aresult, the Bank will continue not to consolidate such structures.
OtherThe Bank is involved with other entities or structures such as invest-ment vehicles, collateralized debt obligation vehicles, and syntheticleases, which total $6 billion. The Bank is the primary beneficiary ofcertain of these structures. As a result, the Bank will consolidatethese structures on November 1, 2004, and total assets and liabili-ties will increase by less than $1 billion.
Liabilities and equityIn January 2004, the CICA issued a new pronouncement amendingthe accounting for certain financial instruments, which have thecharacteristics of both a liability and equity. This pronouncementrequires those instruments that can be settled at the issuer’s optionby issuing a variable number of the issuer’s own equity instrumentsto be presented as liabilities rather than as equity. This change inaccounting would be applied retroactively, with restatement ofcomparative amounts, and is effective for the Bank commencingNovember 1, 2004.
The Bank expects that the $250 million of preferred sharesissued by Scotia Mortgage Investment Corporation and $500 millionof Scotiabank Trust Securities issued by BNS Capital Trust will bereclassified from shareholders’ equity and non-controlling interest insubsidiaries, respectively, to liabilities. This change is estimated toincrease interest expense by $53 million for the year ending October31, 2005, and decrease the provision for income taxes, non-control-ling interest in net income of subsidiaries, and preferred dividendspaid by an estimated $7 million, $37 million, and $9 million, respec-tively. However, these changes will not impact net income availableto common shareholders or earnings per share. As well, the Bank’scapital ratios will not be impacted as the Superintendent has confirmedthat these existing securities will remain eligible as Tier 1 capital.
The effect of applying this retroactively will result in thefollowing restatements for 2004: increase in interest expense of$67 million (2003 – $100 million), decrease in provision for incometaxes, non-controlling interest in net income of subsidiaries, andpreferred dividends paid of $7 million, $37 million, and $23 million(2003 – $7 million, $37 million and $56 million), respectively.
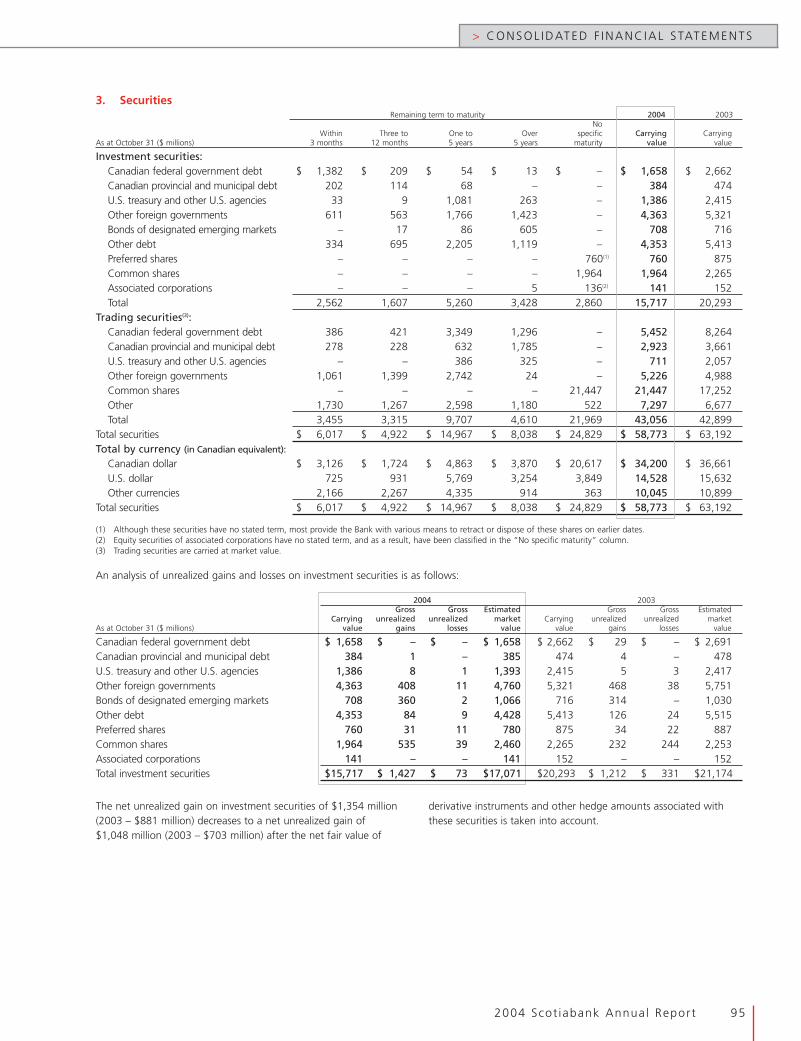
2004 Scot iabank Annual Report 95
> CONSOL IDATED F INANC IAL STATEMENTS
The net unrealized gain on investment securities of $1,354 million(2003 – $881 million) decreases to a net unrealized gain of$1,048 million (2003 – $703 million) after the net fair value of
derivative instruments and other hedge amounts associated withthese securities is taken into account.
3. SecuritiesRemaining term to maturity 2004 2003
NoWithin Three to One to Over specific Carrying Carrying
As at October 31 ($ millions) 3 months 12 months 5 years 5 years maturity value value
Investment securities:Canadian federal government debt $ 1,382 $ 209 $ 54 $ 13 $ – $ 1,658 $ 2,662Canadian provincial and municipal debt 202 114 68 – – 384 474U.S. treasury and other U.S. agencies 33 9 1,081 263 – 1,386 2,415Other foreign governments 611 563 1,766 1,423 – 4,363 5,321Bonds of designated emerging markets – 17 86 605 – 708 716Other debt 334 695 2,205 1,119 – 4,353 5,413Preferred shares – – – – 760(1) 760 875Common shares – – – – 1,964 1,964 2,265Associated corporations – – – 5 136(2) 141 152Total 2,562 1,607 5,260 3,428 2,860 15,717 20,293
Trading securities(3):Canadian federal government debt 386 421 3,349 1,296 – 5,452 8,264Canadian provincial and municipal debt 278 228 632 1,785 – 2,923 3,661U.S. treasury and other U.S. agencies – – 386 325 – 711 2,057Other foreign governments 1,061 1,399 2,742 24 – 5,226 4,988Common shares – – – – 21,447 21,447 17,252Other 1,730 1,267 2,598 1,180 522 7,297 6,677Total 3,455 3,315 9,707 4,610 21,969 43,056 42,899
Total securities $ 6,017 $ 4,922 $ 14,967 $ 8,038 $ 24,829 $ 58,773 $ 63,192Total by currency (in Canadian equivalent):
Canadian dollar $ 3,126 $ 1,724 $ 4,863 $ 3,870 $ 20,617 $ 34,200 $ 36,661U.S. dollar 725 931 5,769 3,254 3,849 14,528 15,632Other currencies 2,166 2,267 4,335 914 363 10,045 10,899
Total securities $ 6,017 $ 4,922 $ 14,967 $ 8,038 $ 24,829 $ 58,773 $ 63,192
(1) Although these securities have no stated term, most provide the Bank with various means to retract or dispose of these shares on earlier dates.(2) Equity securities of associated corporations have no stated term, and as a result, have been classified in the “No specific maturity” column.(3) Trading securities are carried at market value.
An analysis of unrealized gains and losses on investment securities is as follows:
2004 2003Gross Gross Estimated Gross Gross Estimated
Carrying unrealized unrealized market Carrying unrealized unrealized marketAs at October 31 ($ millions) value gains losses value value gains losses value
Canadian federal government debt $ 1,658 $ – $ – $ 1,658 $ 2,662 $ 29 $ – $ 2,691Canadian provincial and municipal debt 384 1 – 385 474 4 – 478U.S. treasury and other U.S. agencies 1,386 8 1 1,393 2,415 5 3 2,417Other foreign governments 4,363 408 11 4,760 5,321 468 38 5,751Bonds of designated emerging markets 708 360 2 1,066 716 314 – 1,030Other debt 4,353 84 9 4,428 5,413 126 24 5,515Preferred shares 760 31 11 780 875 34 22 887Common shares 1,964 535 39 2,460 2,265 232 244 2,253Associated corporations 141 – – 141 152 – – 152Total investment securities $15,717 $ 1,427 $ 73 $17,071 $20,293 $ 1,212 $ 331 $21,174
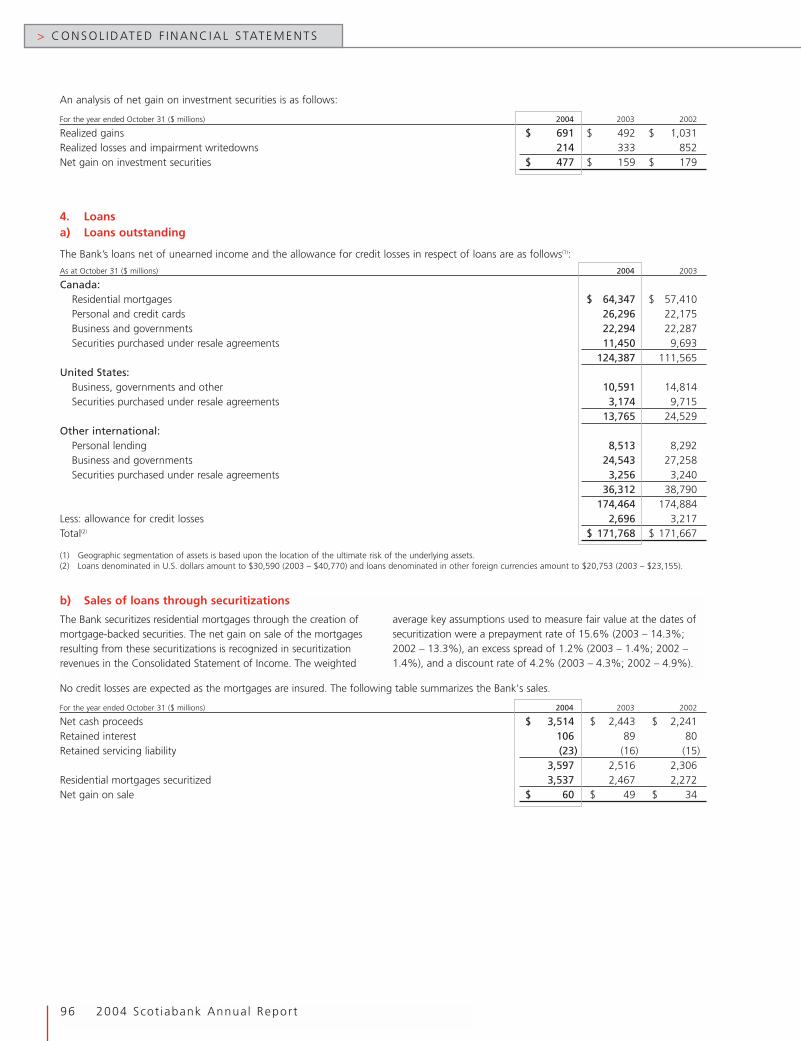
An analysis of net gain on investment securities is as follows:
For the year ended October 31 ($ millions) 2004 2003 2002
Realized gains $ 691 $ 492 $ 1,031Realized losses and impairment writedowns 214 333 852Net gain on investment securities $ 477 $ 159 $ 179
4. Loansa) Loans outstanding
The Bank’s loans net of unearned income and the allowance for credit losses in respect of loans are as follows(1):
As at October 31 ($ millions) 2004 2003
Canada:Residential mortgages $ 64,347 $ 57,410Personal and credit cards 26,296 22,175Business and governments 22,294 22,287Securities purchased under resale agreements 11,450 9,693
124,387 111,565United States:
Business, governments and other 10,591 14,814Securities purchased under resale agreements 3,174 9,715
13,765 24,529Other international:
Personal lending 8,513 8,292Business and governments 24,543 27,258Securities purchased under resale agreements 3,256 3,240
36,312 38,790174,464 174,884
Less: allowance for credit losses 2,696 3,217Total(2) $ 171,768 $ 171,667
(1) Geographic segmentation of assets is based upon the location of the ultimate risk of the underlying assets.(2) Loans denominated in U.S. dollars amount to $30,590 (2003 – $40,770) and loans denominated in other foreign currencies amount to $20,753 (2003 – $23,155).
> CONSOL IDATED F INANC IAL STATEMENTS
96 2004 Scot iabank Annual Report
b) Sales of loans through securitizations
The Bank securitizes residential mortgages through the creation ofmortgage-backed securities. The net gain on sale of the mortgagesresulting from these securitizations is recognized in securitizationrevenues in the Consolidated Statement of Income. The weighted
average key assumptions used to measure fair value at the dates ofsecuritization were a prepayment rate of 15.6% (2003 – 14.3%;2002 – 13.3%), an excess spread of 1.2% (2003 – 1.4%; 2002 –1.4%), and a discount rate of 4.2% (2003 – 4.3%; 2002 – 4.9%).
No credit losses are expected as the mortgages are insured. The following table summarizes the Bank's sales.
For the year ended October 31 ($ millions) 2004 2003 2002
Net cash proceeds $ 3,514 $ 2,443 $ 2,241Retained interest 106 89 80Retained servicing liability (23) (16) (15)
3,597 2,516 2,306Residential mortgages securitized 3,537 2,467 2,272Net gain on sale $ 60 $ 49 $ 34
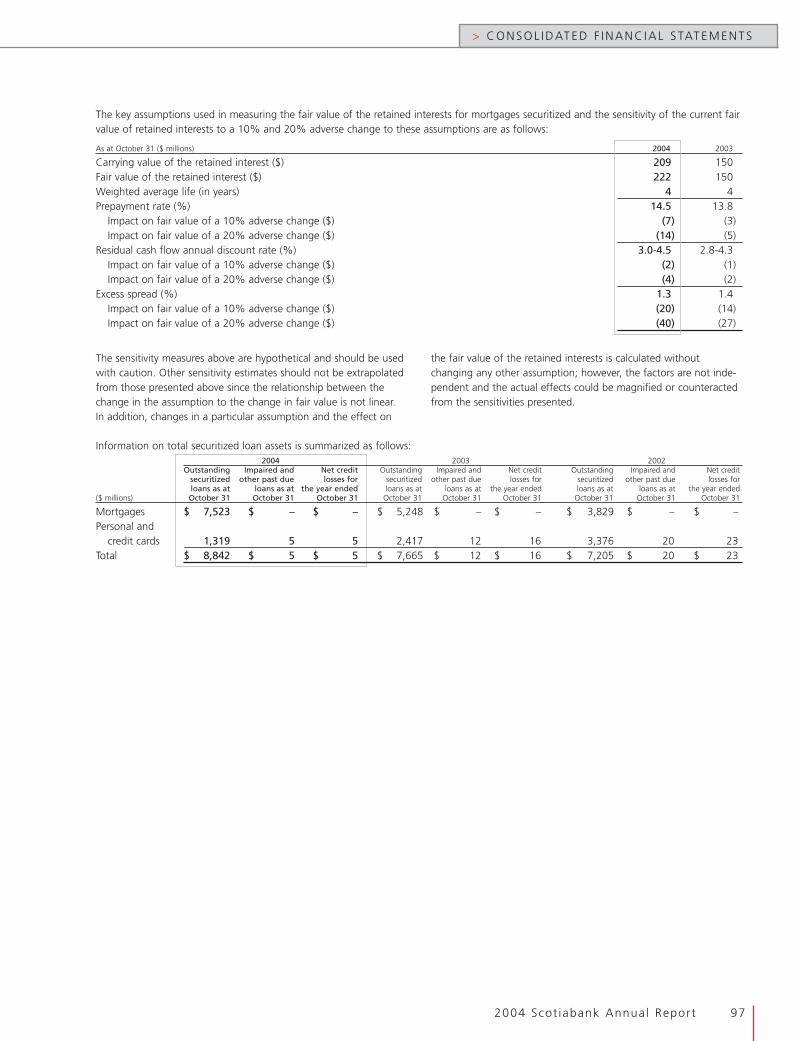
The key assumptions used in measuring the fair value of the retained interests for mortgages securitized and the sensitivity of the current fairvalue of retained interests to a 10% and 20% adverse change to these assumptions are as follows:
As at October 31 ($ millions) 2004 2003
Carrying value of the retained interest ($) 209 150Fair value of the retained interest ($) 222 150Weighted average life (in years) 4 4Prepayment rate (%) 14.5 13.8
Impact on fair value of a 10% adverse change ($) (7) (3)Impact on fair value of a 20% adverse change ($) (14) (5)
Residual cash flow annual discount rate (%) 3.0-4.5 2.8-4.3Impact on fair value of a 10% adverse change ($) (2) (1)Impact on fair value of a 20% adverse change ($) (4) (2)
Excess spread (%) 1.3 1.4Impact on fair value of a 10% adverse change ($) (20) (14)Impact on fair value of a 20% adverse change ($) (40) (27)
2004 Scot iabank Annual Report 97
> CONSOL IDATED F INANC IAL STATEMENTS
The sensitivity measures above are hypothetical and should be usedwith caution. Other sensitivity estimates should not be extrapolatedfrom those presented above since the relationship between thechange in the assumption to the change in fair value is not linear.In addition, changes in a particular assumption and the effect on
the fair value of the retained interests is calculated withoutchanging any other assumption; however, the factors are not inde-pendent and the actual effects could be magnified or counteractedfrom the sensitivities presented.
Information on total securitized loan assets is summarized as follows:2004 2003 2002
Outstanding Impaired and Net credit Outstanding Impaired and Net credit Outstanding Impaired and Net creditsecuritized other past due losses for securitized other past due losses for securitized other past due losses forloans as at loans as at the year ended loans as at loans as at the year ended loans as at loans as at the year ended
($ millions) October 31 October 31 October 31 October 31 October 31 October 31 October 31 October 31 October 31
Mortgages $ 7,523 $ – $ – $ 5,248 $ – $ – $ 3,829 $ – $ –
Personal andcredit cards 1,319 5 5 2,417 12 16 3,376 20 23
Total $ 8,842 $ 5 $ 5 $ 7,665 $ 12 $ 16 $ 7,205 $ 20 $ 23
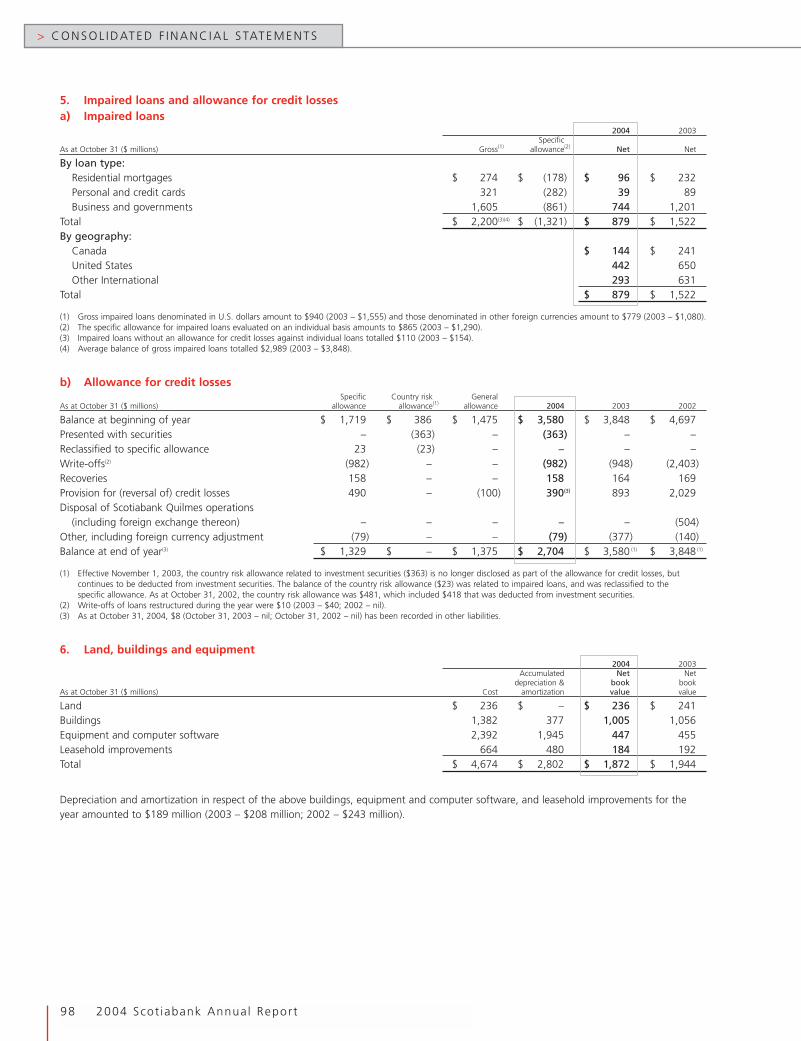
5. Impaired loans and allowance for credit lossesa) Impaired loans
2004 2003Specific
As at October 31 ($ millions) Gross(1) allowance(2) Net Net
By loan type:Residential mortgages $ 274 $ (178) $ 96 $ 232Personal and credit cards 321 (282) 39 89Business and governments 1,605 (861) 744 1,201
Total $ 2,200(3)(4) $ (1,321) $ 879 $ 1,522By geography:
Canada $ 144 $ 241United States 442 650Other International 293 631
Total $ 879 $ 1,522
(1) Gross impaired loans denominated in U.S. dollars amount to $940 (2003 – $1,555) and those denominated in other foreign currencies amount to $779 (2003 – $1,080).(2) The specific allowance for impaired loans evaluated on an individual basis amounts to $865 (2003 – $1,290).(3) Impaired loans without an allowance for credit losses against individual loans totalled $110 (2003 – $154).(4) Average balance of gross impaired loans totalled $2,989 (2003 – $3,848).
b) Allowance for credit lossesSpecific Country risk General
As at October 31 ($ millions) allowance allowance(1) allowance 2004 2003 2002
Balance at beginning of year $ 1,719 $ 386 $ 1,475 $ 3,580 $ 3,848 $ 4,697Presented with securities – (363) – (363) – –Reclassified to specific allowance 23 (23) – – – –Write-offs(2) (982) – – (982) (948) (2,403)Recoveries 158 – – 158 164 169Provision for (reversal of) credit losses 490 – (100) 390(3) 893 2,029Disposal of Scotiabank Quilmes operations
(including foreign exchange thereon) – – – – – (504)Other, including foreign currency adjustment (79) – – (79) (377) (140)Balance at end of year(3) $ 1,329 $ – $ 1,375 $ 2,704 $ 3,580 (1) $ 3,848(1)
(1) Effective November 1, 2003, the country risk allowance related to investment securities ($363) is no longer disclosed as part of the allowance for credit losses, butcontinues to be deducted from investment securities. The balance of the country risk allowance ($23) was related to impaired loans, and was reclassified to thespecific allowance. As at October 31, 2002, the country risk allowance was $481, which included $418 that was deducted from investment securities.
(2) Write-offs of loans restructured during the year were $10 (2003 – $40; 2002 – nil).(3) As at October 31, 2004, $8 (October 31, 2003 – nil; October 31, 2002 – nil) has been recorded in other liabilities.
6. Land, buildings and equipment2004 2003
Accumulated Net Netdepreciation & book book
As at October 31 ($ millions) Cost amortization value value
Land $ 236 $ – $ 236 $ 241Buildings 1,382 377 1,005 1,056Equipment and computer software 2,392 1,945 447 455Leasehold improvements 664 480 184 192Total $ 4,674 $ 2,802 $ 1,872 $ 1,944
Depreciation and amortization in respect of the above buildings, equipment and computer software, and leasehold improvements for theyear amounted to $189 million (2003 – $208 million; 2002 – $243 million).
> CONSOL IDATED F INANC IAL STATEMENTS
98 2004 Scot iabank Annual Report
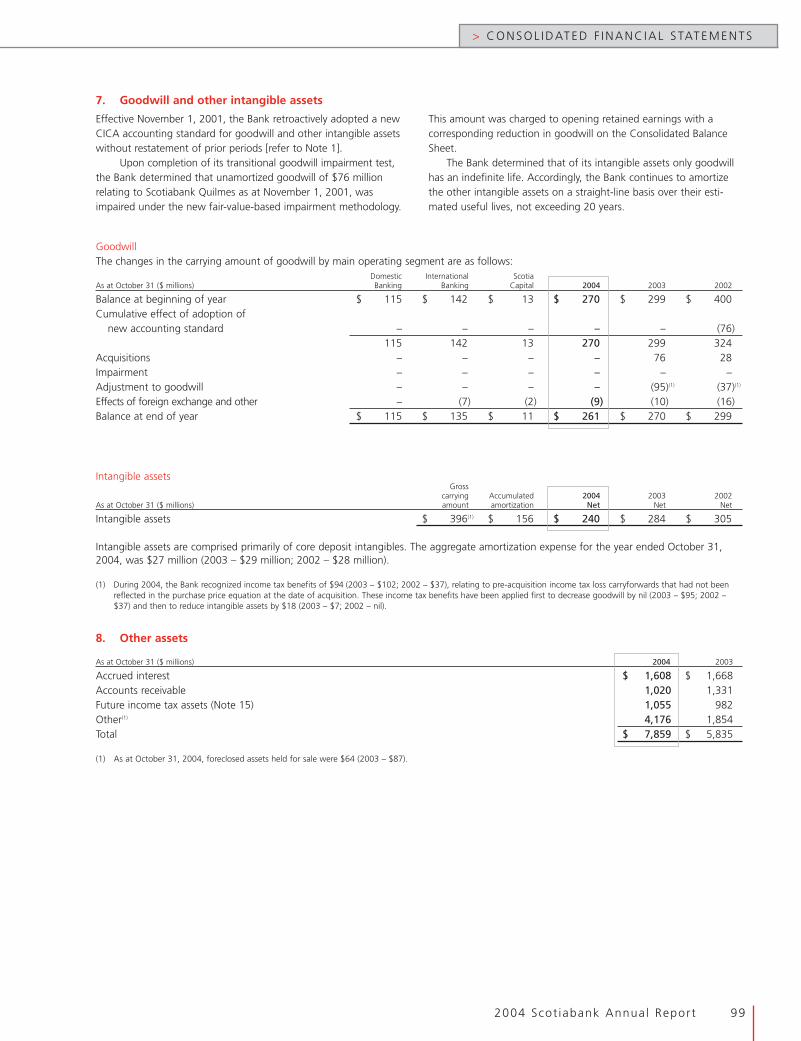
7. Goodwill and other intangible assets
2004 Scot iabank Annual Report 99
> CONSOL IDATED F INANC IAL STATEMENTS
GoodwillThe changes in the carrying amount of goodwill by main operating segment are as follows:
Domestic International ScotiaAs at October 31 ($ millions) Banking Banking Capital 2004 2003 2002
Balance at beginning of year $ 115 $ 142 $ 13 $ 270 $ 299 $ 400Cumulative effect of adoption of
new accounting standard – – – – – (76)115 142 13 270 299 324
Acquisitions – – – – 76 28Impairment – – – – – –Adjustment to goodwill – – – – (95)(1) (37)(1)
Effects of foreign exchange and other – (7) (2) (9) (10) (16)Balance at end of year $ 115 $ 135 $ 11 $ 261 $ 270 $ 299
Intangible assetsGross
carrying Accumulated 2004 2003 2002As at October 31 ($ millions) amount amortization Net Net Net
Intangible assets $ 396(1) $ 156 $ 240 $ 284 $ 305
Intangible assets are comprised primarily of core deposit intangibles. The aggregate amortization expense for the year ended October 31,2004, was $27 million (2003 – $29 million; 2002 – $28 million).
(1) During 2004, the Bank recognized income tax benefits of $94 (2003 – $102; 2002 – $37), relating to pre-acquisition income tax loss carryforwards that had not beenreflected in the purchase price equation at the date of acquisition. These income tax benefits have been applied first to decrease goodwill by nil (2003 – $95; 2002 –$37) and then to reduce intangible assets by $18 (2003 – $7; 2002 – nil).
Effective November 1, 2001, the Bank retroactively adopted a newCICA accounting standard for goodwill and other intangible assetswithout restatement of prior periods [refer to Note 1].
Upon completion of its transitional goodwill impairment test,the Bank determined that unamortized goodwill of $76 millionrelating to Scotiabank Quilmes as at November 1, 2001, wasimpaired under the new fair-value-based impairment methodology.
This amount was charged to opening retained earnings with acorresponding reduction in goodwill on the Consolidated BalanceSheet.
The Bank determined that of its intangible assets only goodwillhas an indefinite life. Accordingly, the Bank continues to amortizethe other intangible assets on a straight-line basis over their esti-mated useful lives, not exceeding 20 years.
8. Other assets
As at October 31 ($ millions) 2004 2003
Accrued interest $ 1,608 $ 1,668Accounts receivable 1,020 1,331Future income tax assets (Note 15) 1,055 982Other(1) 4,176 1,854Total $ 7,859 $ 5,835
(1) As at October 31, 2004, foreclosed assets held for sale were $64 (2003 – $87).

9. DepositsPayable Payable Payable on
on demand after notice a fixed date 2004 2003
As at October 31 ($ millions) Interest-bearing Non-interest-bearing
Personal $ 1,494 $ 1,272 $ 29,293 $ 46,961 $ 79,020 $ 76,431Business and governments 10,071 7,857 12,237 63,960 94,125 93,541Banks 79 397 451 21,124 22,051 22,700Total 11,644 9,526 41,981 132,045 195,196 192,672
Recorded in:Canada 136,949 127,058United States 9,592 12,199Other International 48,655 53,415
Total(1) $195,196 $192,672
(1) Deposits denominated in U.S. dollars amount to $49,923 (2003 – $53,556) and deposits denominated in other foreign currencies amount to $29,193 (2003 – $33,059).
10. Other liabilities
As at October 31 ($ millions) 2004 2003
Accrued interest $ 2,107 $ 2,241Accounts payable and accrued expenses 3,280 2,581Deferred income 341 496Liabilities of subsidiaries, other than deposits 919 1,134Gold and silver certificates 2,018 2,271Future income tax liabilities (Note 15) 56 70Other 7,012 5,352Total $ 15,733 $ 14,145
11. Non-controlling interest in subsidiaries
As at October 31 ($ millions) 2004 2003
Non-controlling interest in common equity of subsidiaries $ 280 $ 326Scotiabank Trust Securities – Series 2000-1 issued by BNS Capital Trust (Note 13 (6)) 500 500Scotiabank Trust Securities – Series 2002-1 issued by Scotiabank Capital Trust (Note 13 (7)) 750 750Scotiabank Trust Securities – Series 2003-1 issued by Scotiabank Capital Trust (Note 13 (8)) 750 750Total $ 2,280 $ 2,326
> CONSOL IDATED F INANC IAL STATEMENTS
100 2004 Scot iabank Annual Report
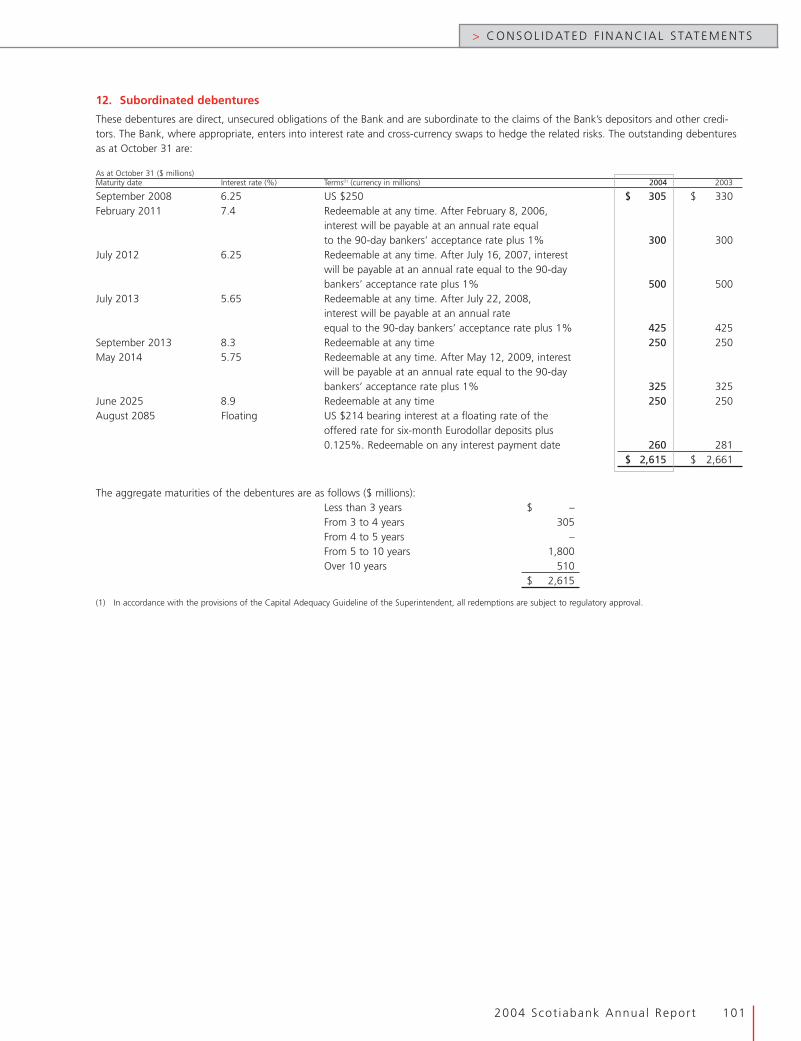
12. Subordinated debentures
These debentures are direct, unsecured obligations of the Bank and are subordinate to the claims of the Bank’s depositors and other credi-tors. The Bank, where appropriate, enters into interest rate and cross-currency swaps to hedge the related risks. The outstanding debenturesas at October 31 are:
As at October 31 ($ millions)Maturity date Interest rate (%) Terms(1) (currency in millions) 2004 2003
September 2008 6.25 US $250 $ 305 $ 330February 2011 7.4 Redeemable at any time. After February 8, 2006,
interest will be payable at an annual rate equalto the 90-day bankers’ acceptance rate plus 1% 300 300
July 2012 6.25 Redeemable at any time. After July 16, 2007, interestwill be payable at an annual rate equal to the 90-daybankers’ acceptance rate plus 1% 500 500
July 2013 5.65 Redeemable at any time. After July 22, 2008,interest will be payable at an annual rateequal to the 90-day bankers’ acceptance rate plus 1% 425 425
September 2013 8.3 Redeemable at any time 250 250May 2014 5.75 Redeemable at any time. After May 12, 2009, interest
will be payable at an annual rate equal to the 90-daybankers’ acceptance rate plus 1% 325 325
June 2025 8.9 Redeemable at any time 250 250August 2085 Floating US $214 bearing interest at a floating rate of the
offered rate for six-month Eurodollar deposits plus0.125%. Redeemable on any interest payment date 260 281
$ 2,615 $ 2,661
The aggregate maturities of the debentures are as follows ($ millions):Less than 3 years $ –From 3 to 4 years 305From 4 to 5 years –From 5 to 10 years 1,800Over 10 years 510
$ 2,615
(1) In accordance with the provisions of the Capital Adequacy Guideline of the Superintendent, all redemptions are subject to regulatory approval.
2004 Scot iabank Annual Report 101
> CONSOL IDATED F INANC IAL STATEMENTS
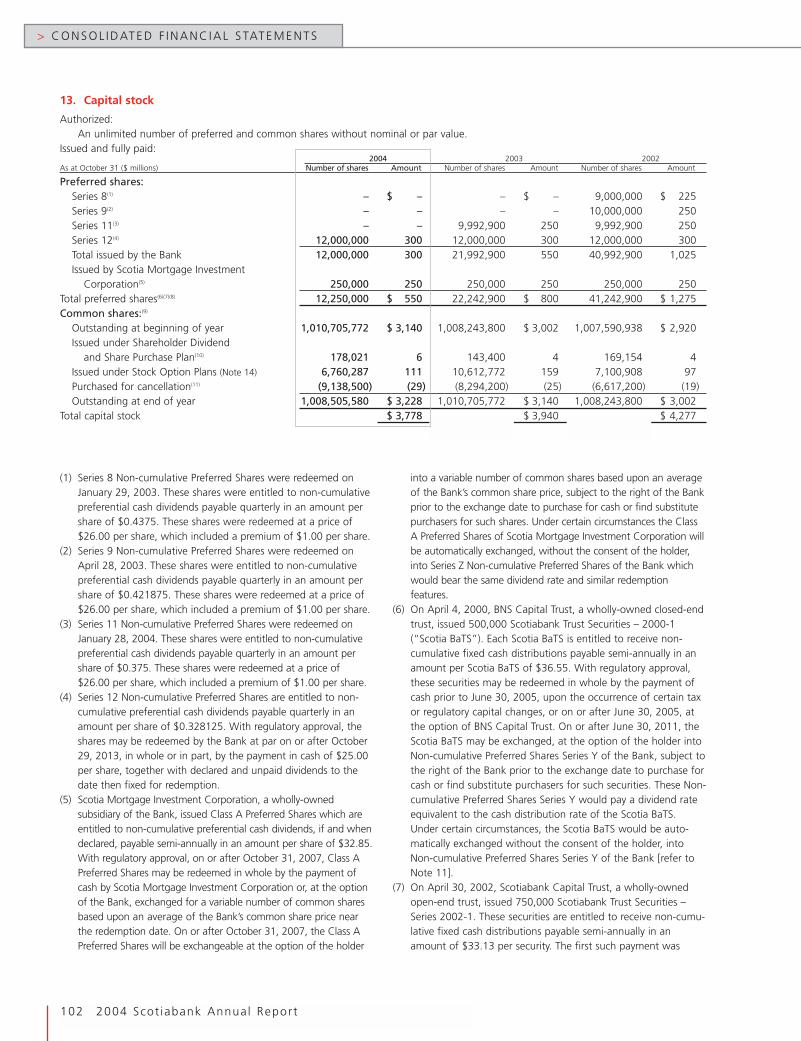
(1) Series 8 Non-cumulative Preferred Shares were redeemed onJanuary 29, 2003. These shares were entitled to non-cumulativepreferential cash dividends payable quarterly in an amount pershare of $0.4375. These shares were redeemed at a price of$26.00 per share, which included a premium of $1.00 per share.
(2) Series 9 Non-cumulative Preferred Shares were redeemed onApril 28, 2003. These shares were entitled to non-cumulativepreferential cash dividends payable quarterly in an amount pershare of $0.421875. These shares were redeemed at a price of$26.00 per share, which included a premium of $1.00 per share.
(3) Series 11 Non-cumulative Preferred Shares were redeemed onJanuary 28, 2004. These shares were entitled to non-cumulativepreferential cash dividends payable quarterly in an amount pershare of $0.375. These shares were redeemed at a price of$26.00 per share, which included a premium of $1.00 per share.
(4) Series 12 Non-cumulative Preferred Shares are entitled to non-cumulative preferential cash dividends payable quarterly in anamount per share of $0.328125. With regulatory approval, theshares may be redeemed by the Bank at par on or after October29, 2013, in whole or in part, by the payment in cash of $25.00per share, together with declared and unpaid dividends to thedate then fixed for redemption.
(5) Scotia Mortgage Investment Corporation, a wholly-ownedsubsidiary of the Bank, issued Class A Preferred Shares which areentitled to non-cumulative preferential cash dividends, if and whendeclared, payable semi-annually in an amount per share of $32.85.With regulatory approval, on or after October 31, 2007, Class APreferred Shares may be redeemed in whole by the payment ofcash by Scotia Mortgage Investment Corporation or, at the optionof the Bank, exchanged for a variable number of common sharesbased upon an average of the Bank’s common share price nearthe redemption date. On or after October 31, 2007, the Class APreferred Shares will be exchangeable at the option of the holder
into a variable number of common shares based upon an averageof the Bank’s common share price, subject to the right of the Bankprior to the exchange date to purchase for cash or find substitutepurchasers for such shares. Under certain circumstances the ClassA Preferred Shares of Scotia Mortgage Investment Corporation willbe automatically exchanged, without the consent of the holder,into Series Z Non-cumulative Preferred Shares of the Bank whichwould bear the same dividend rate and similar redemptionfeatures.
(6) On April 4, 2000, BNS Capital Trust, a wholly-owned closed-endtrust, issued 500,000 Scotiabank Trust Securities – 2000-1(“Scotia BaTS”). Each Scotia BaTS is entitled to receive non-cumulative fixed cash distributions payable semi-annually in anamount per Scotia BaTS of $36.55. With regulatory approval,these securities may be redeemed in whole by the payment ofcash prior to June 30, 2005, upon the occurrence of certain taxor regulatory capital changes, or on or after June 30, 2005, atthe option of BNS Capital Trust. On or after June 30, 2011, theScotia BaTS may be exchanged, at the option of the holder intoNon-cumulative Preferred Shares Series Y of the Bank, subject tothe right of the Bank prior to the exchange date to purchase forcash or find substitute purchasers for such securities. These Non-cumulative Preferred Shares Series Y would pay a dividend rateequivalent to the cash distribution rate of the Scotia BaTS.Under certain circumstances, the Scotia BaTS would be auto-matically exchanged without the consent of the holder, intoNon-cumulative Preferred Shares Series Y of the Bank [refer toNote 11].
(7) On April 30, 2002, Scotiabank Capital Trust, a wholly-ownedopen-end trust, issued 750,000 Scotiabank Trust Securities –Series 2002-1. These securities are entitled to receive non-cumu-lative fixed cash distributions payable semi-annually in anamount of $33.13 per security. The first such payment was
> CONSOL IDATED F INANC IAL STATEMENTS
102 2004 Scot iabank Annual Report
13. Capital stock
Authorized:An unlimited number of preferred and common shares without nominal or par value.
Issued and fully paid:2004 2003 2002
As at October 31 ($ millions) Number of shares Amount Number of shares Amount Number of shares Amount
Preferred shares:Series 8(1) – $ – – $ – 9,000,000 $ 225Series 9(2) – – – – 10,000,000 250Series 11(3) – – 9,992,900 250 9,992,900 250Series 12(4) 12,000,000 300 12,000,000 300 12,000,000 300Total issued by the Bank 12,000,000 300 21,992,900 550 40,992,900 1,025Issued by Scotia Mortgage Investment
Corporation(5) 250,000 250 250,000 250 250,000 250Total preferred shares(6)(7)(8) 12,250,000 $ 550 22,242,900 $ 800 41,242,900 $ 1,275Common shares:(9)
Outstanding at beginning of year 1,010,705,772 $ 3,140 1,008,243,800 $ 3,002 1,007,590,938 $ 2,920Issued under Shareholder Dividend
and Share Purchase Plan(10) 178,021 6 143,400 4 169,154 4Issued under Stock Option Plans (Note 14) 6,760,287 111 10,612,772 159 7,100,908 97Purchased for cancellation(11) (9,138,500) (29) (8,294,200) (25) (6,617,200) (19)Outstanding at end of year 1,008,505,580 $ 3,228 1,010,705,772 $ 3,140 1,008,243,800 $ 3,002
Total capital stock $ 3,778 $ 3,940 $ 4,277
made on June 30, 2002, in an amount of $11.07. With regula-tory approval, these securities may be redeemed in whole by thepayment of cash prior to June 30, 2007, upon the occurrence ofcertain tax or regulatory capital changes, or on or after June 30,2007, at the option of Scotiabank Capital Trust. The holder hasthe right at any time to exchange their security into Non-cumu-lative Preferred Shares Series W of the Bank. The Series Wshares will be entitled to cash dividends payable semi-annually inan amount of $0.53125 per $25.00 share. Under certaincircumstances, these trust securities would be automaticallyexchanged without the consent of the holder, into Non-cumula-tive Preferred Shares Series X of the Bank. The Series X shareswill be entitled to non-cumulative cash dividends payable semi-annually in an amount of $0.70 per $25.00 share [refer toNote 11].
(8) On February 13, 2003, Scotiabank Capital Trust issued 750,000Scotiabank Trust Securities – Series 2003-1. These securities areentitled to receive non-cumulative fixed cash distributionspayable semi-annually in an amount of $31.41 per security. Thefirst such payment was made on June 30, 2003, in an amountof $23.58. With regulatory approval, these securities may beredeemed in whole by the payment of cash prior to June 30,2008, upon the occurrence of certain tax or regulatory capitalchanges, or on or after June 30, 2008, at the option of Scotia-bank Capital Trust. The holder has the right at any time toexchange their security into Non-cumulative Preferred SharesSeries U of the Bank. The Series U shares will be entitled to cashdividends payable semi-annually in an amount of $0.50 per$25.00 share. Under certain circumstances, these trust securitieswould be automatically exchanged without the consent of theholder, into Non-cumulative Preferred Shares Series V of theBank. The Series V shares will be entitled to non-cumulativecash dividends payable semi-annually in an amount of $0.61250per $25.00 share [refer to Note 11].
(9) On April 28, 2004, the Bank paid a stock dividend of onecommon share for each of its issued and outstanding common
shares to common shareholders of record at the close of busi-ness on April 6, 2004. The effect is the same as a two-for-onestock split of its common shares. Amounts presented in theseconsolidated financial statements relating to the number ofcommon shares and options, as well as all per share amounts,have been retroactively adjusted.
(10)As at October 31, 2004, 22,288,657 common shares have beenreserved for future issue under the terms of the ShareholderDividend and Share Purchase Plan.
(11)In January 2004, the Bank initiated a new normal course issuerbid. Following the payment of the stock dividend, the numberof shares authorized for purchase was adjusted to 50 million.This represents approximately 5 per cent of the Bank’soutstanding common shares. The bid will terminate on theearlier of January 5, 2005, or the date the Bank completes itspurchases. During the year ended October 31, 2004, 9.1 millionshares (2003 – 8.3 million shares; 2002 – 6.6 million shares) werepurchased at an average price of $34.96 (2003– $27.31; 2002 –$24.95).
Restrictions on dividend paymentsUnder the Bank Act, the Bank is prohibited from declaring any divi-dends on its common or preferred shares when the Bank is, or wouldbe placed by such a declaration, in contravention of the capitaladequacy, liquidity or any other regulatory directives issued under theBank Act. In addition, common share dividends cannot be paidunless all dividends to which preferred shareholders are then entitledto have been paid or sufficient funds have been set aside to do so.
In the event that applicable cash distributions on any of theScotiabank Trust Securities are not paid on a regular distributiondate, the Bank has undertaken not to declare dividends of any kindon its preferred or common shares. Similarly, should the Bank fail todeclare regular dividends on any of its directly issued outstandingpreferred or common shares, cash distributions will also not bemade on any of the Scotiabank Trust Securities.
Currently, these limitations do not restrict the payment of divi-dends on preferred or common shares.
2004 Scot iabank Annual Report 103
> CONSOL IDATED F INANC IAL STATEMENTS
14. Stock-based compensationa) Stock option plans
Under the terms of the Employee Stock Option Plan, options topurchase common shares may be granted to selected employees atan exercise price not less than the closing price of the Bank’scommon shares on the Toronto Stock Exchange (TSX) on the dayprior to the date of the grant. Effective November 1, 2002, employeestock options granted also have Tandem Stock Appreciation Rights(Tandem SARs), which allow the employee to either exercise thestock option for shares, or to exercise the Tandem SAR and therebyreceive the intrinsic value of the stock option in cash. In addition, infiscal 2003, Tandem SARs were retroactively attached to the fiscal2002 employee stock options. All other terms and conditions relatingto these 2002 stock options remained unchanged. These 2002 stockoptions were out of the money at the date of attachment. As aresult, there was no impact on the Bank’s stock-based compensationexpense on the date of retroactive attachment of the Tandem SARs.
Options vest evenly over a four-year period and are exercisable nolater than 10 years after the date of the grant. Outstanding optionsexpire on dates ranging from June 2, 2005 to December 5, 2013.As approved by the shareholders, a total of 114 million commonshares have been reserved for issuance under this plan (including an
additional amount of 16 million approved in 2004) of which47.7 million common shares have been issued as a result of theexercise of options, 42.5 million common shares are committedunder outstanding options, leaving 23.8 million common sharesavailable for issuance as options.
In 2001, a Directors’ Stock Option Plan was approved by the share-holders. A total of 800,000 common shares have been reserved forissuance to non-officer directors under this plan. As of November 1,2002, director stock options are expensed using a fair-value-basedmethod. As these options are fully exercisable at the time of grant, thefair value of $0.5 million for the 2003 options was fully expensed inthe 2003 fiscal year in other non-interest expenses in the ConsolidatedStatement of Income. These options expire between March 2011 andDecember 2012. Currently, 257,150 (2003 – 282,000; 2002 –206,000) options are outstanding at a weighted average exercise priceof $23.13 (2003 – $22.94; 2002 – $22.40). In 2004, 24,850 of theseoptions (2003 – nil; 2002 – nil) were exercised at a weighted averageexercise price of $20.95. In 2003, 76,000 stock options were granted(2002 – 80,000). Commencing in fiscal 2004, the Bank no longergrants stock options to these directors.
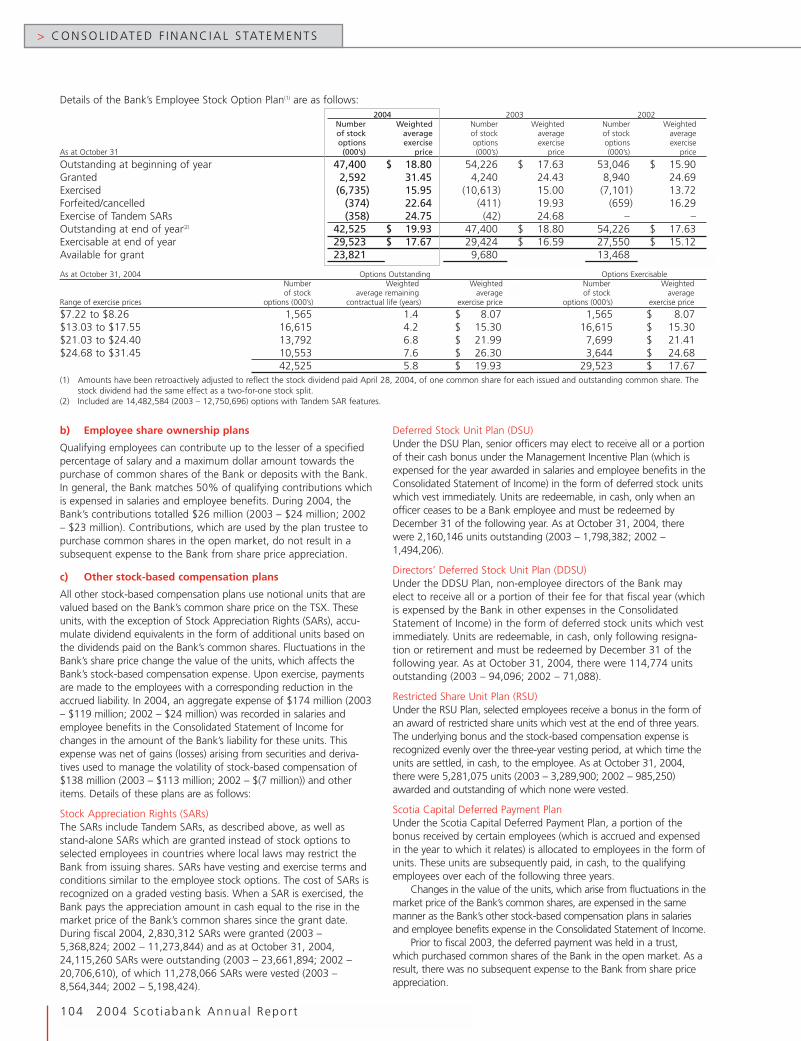
b) Employee share ownership plans
Qualifying employees can contribute up to the lesser of a specifiedpercentage of salary and a maximum dollar amount towards thepurchase of common shares of the Bank or deposits with the Bank.In general, the Bank matches 50% of qualifying contributions whichis expensed in salaries and employee benefits. During 2004, theBank’s contributions totalled $26 million (2003 – $24 million; 2002– $23 million). Contributions, which are used by the plan trustee topurchase common shares in the open market, do not result in asubsequent expense to the Bank from share price appreciation.
c) Other stock-based compensation plans
All other stock-based compensation plans use notional units that arevalued based on the Bank’s common share price on the TSX. Theseunits, with the exception of Stock Appreciation Rights (SARs), accu-mulate dividend equivalents in the form of additional units based onthe dividends paid on the Bank’s common shares. Fluctuations in theBank’s share price change the value of the units, which affects theBank’s stock-based compensation expense. Upon exercise, paymentsare made to the employees with a corresponding reduction in theaccrued liability. In 2004, an aggregate expense of $174 million (2003– $119 million; 2002 – $24 million) was recorded in salaries andemployee benefits in the Consolidated Statement of Income forchanges in the amount of the Bank’s liability for these units. Thisexpense was net of gains (losses) arising from securities and deriva-tives used to manage the volatility of stock-based compensation of$138 million (2003 – $113 million; 2002 – $(7 million)) and otheritems. Details of these plans are as follows:
Stock Appreciation Rights (SARs)The SARs include Tandem SARs, as described above, as well asstand-alone SARs which are granted instead of stock options toselected employees in countries where local laws may restrict theBank from issuing shares. SARs have vesting and exercise terms andconditions similar to the employee stock options. The cost of SARs isrecognized on a graded vesting basis. When a SAR is exercised, theBank pays the appreciation amount in cash equal to the rise in themarket price of the Bank’s common shares since the grant date.During fiscal 2004, 2,830,312 SARs were granted (2003 –5,368,824; 2002 – 11,273,844) and as at October 31, 2004,24,115,260 SARs were outstanding (2003 – 23,661,894; 2002 –20,706,610), of which 11,278,066 SARs were vested (2003 –8,564,344; 2002 – 5,198,424).
Deferred Stock Unit Plan (DSU)Under the DSU Plan, senior officers may elect to receive all or a portionof their cash bonus under the Management Incentive Plan (which isexpensed for the year awarded in salaries and employee benefits in theConsolidated Statement of Income) in the form of deferred stock unitswhich vest immediately. Units are redeemable, in cash, only when anofficer ceases to be a Bank employee and must be redeemed byDecember 31 of the following year. As at October 31, 2004, therewere 2,160,146 units outstanding (2003 – 1,798,382; 2002 –1,494,206).
Directors’ Deferred Stock Unit Plan (DDSU)Under the DDSU Plan, non-employee directors of the Bank mayelect to receive all or a portion of their fee for that fiscal year (whichis expensed by the Bank in other expenses in the ConsolidatedStatement of Income) in the form of deferred stock units which vestimmediately. Units are redeemable, in cash, only following resigna-tion or retirement and must be redeemed by December 31 of thefollowing year. As at October 31, 2004, there were 114,774 unitsoutstanding (2003 – 94,096; 2002 – 71,088).
Restricted Share Unit Plan (RSU)Under the RSU Plan, selected employees receive a bonus in the form ofan award of restricted share units which vest at the end of three years.The underlying bonus and the stock-based compensation expense isrecognized evenly over the three-year vesting period, at which time theunits are settled, in cash, to the employee. As at October 31, 2004,there were 5,281,075 units (2003 – 3,289,900; 2002 – 985,250)awarded and outstanding of which none were vested.
Scotia Capital Deferred Payment PlanUnder the Scotia Capital Deferred Payment Plan, a portion of thebonus received by certain employees (which is accrued and expensedin the year to which it relates) is allocated to employees in the form ofunits. These units are subsequently paid, in cash, to the qualifyingemployees over each of the following three years.
Changes in the value of the units, which arise from fluctuations in themarket price of the Bank’s common shares, are expensed in the samemanner as the Bank’s other stock-based compensation plans in salariesand employee benefits expense in the Consolidated Statement of Income.
Prior to fiscal 2003, the deferred payment was held in a trust,which purchased common shares of the Bank in the open market. As aresult, there was no subsequent expense to the Bank from share priceappreciation.
> CONSOL IDATED F INANC IAL STATEMENTS
104 2004 Scot iabank Annual Report
Details of the Bank’s Employee Stock Option Plan(1) are as follows:2004 2003 2002
Number Weighted Number Weighted Number Weightedof stock average of stock average of stock averageoptions exercise options exercise options exercise
As at October 31 (000’s) price (000’s) price (000’s) price
Outstanding at beginning of year 47,400 $ 18.80 54,226 $ 17.63 53,046 $ 15.90Granted 2,592 31.45 4,240 24.43 8,940 24.69Exercised (6,735) 15.95 (10,613) 15.00 (7,101) 13.72Forfeited/cancelled (374) 22.64 (411) 19.93 (659) 16.29Exercise of Tandem SARs (358) 24.75 (42) 24.68 – –Outstanding at end of year(2) 42,525 $ 19.93 47,400 $ 18.80 54,226 $ 17.63Exercisable at end of year 29,523 $ 17.67 29,424 $ 16.59 27,550 $ 15.12Available for grant 23,821 9,680 13,468
As at October 31, 2004 Options Outstanding Options ExercisableNumber Weighted Weighted Number Weightedof stock average remaining average of stock average
Range of exercise prices options (000’s) contractual life (years) exercise price options (000’s) exercise price
$7.22 to $8.26 1,565 1.4 $ 8.07 1,565 $ 8.07$13.03 to $17.55 16,615 4.2 $ 15.30 16,615 $ 15.30$21.03 to $24.40 13,792 6.8 $ 21.99 7,699 $ 21.41$24.68 to $31.45 10,553 7.6 $ 26.30 3,644 $ 24.68
42,525 5.8 $ 19.93 29,523 $ 17.67(1) Amounts have been retroactively adjusted to reflect the stock dividend paid April 28, 2004, of one common share for each issued and outstanding common share. The
stock dividend had the same effect as a two-for-one stock split.(2) Included are 14,482,584 (2003 – 12,750,696) options with Tandem SAR features.

2004 Scot iabank Annual Report 105
> CONSOL IDATED F INANC IAL STATEMENTS
Corporate income taxes recorded in the Bank’s consolidated financial statements for the years ended October 31 are as follows:
15. Corporate income taxes
a) Components of income tax provisionFor the year ended October 31 ($ millions) 2004 2003 2002
Provision for income taxes in the Consolidated Statement of Income:Current $ 880 $ 892 $ 497Future (87) (108) 104
793 784 601Provision for future income taxes in the Consolidated Statement of
Changes in Shareholders’ Equity (1) 26 4Total provision for income taxes $ 792 $ 810 $ 605
Current income taxes:Domestic:
Federal $ 214 $ 307 $ 148Provincial 185 209 70
Foreign 481 376 279880 892 497
Future income taxes:Domestic:
Federal (52) (48) 13Provincial (7) (52) 23
Foreign (29) 18 72(88) (82) 108
Total provision for income taxes $ 792 $ 810 $ 605
b) Reconciliation to statutory rateIncome taxes in the Consolidated Statement of Income vary from the amounts that would be computed by applying the composite federaland provincial statutory income tax rate for the following reasons:
2004 2003 2002Percent of Percent of Percent of
pre-tax pre-tax pre-taxFor the year ended October 31 ($ millions) Amount income Amount income Amount income
Income taxes at statutory rate $ 1,383 35.2% $ 1,289 36.4% $ 1,004 38.4%Increase (decrease) in income taxes resulting from:
Lower average tax rate applicable tosubsidiaries and foreign branches (338) (8.6) (309) (8.7) (308) (11.8)
Tax-exempt income from securities (235) (6.0) (197) (5.6) (128) (4.9)Future income tax effect of substantively
enacted tax rate changes (22) (0.6) 25 0.7 30 1.2Other, net 5 0.1 (24) (0.6) 3 0.1
Total income taxes and effective tax rate $ 793 20.1% $ 784 22.2% $ 601 23.0%
c) Future income taxesThe tax-effected temporary differences which result in future income tax assets and (liabilities) are as follows:
As at October 31 ($ millions) 2004 2003
Allowance for credit losses $ 604 $ 519Deferred compensation 219 132Deferred income 105 142Loss carryforwards(1) 96 106Loss on disposal of subsidiary operations 87 84Premises and equipment (73) (67)Securities (81) (49)Pension fund (165) (125)Other 207 170Net future income taxes(2) $ 999 $ 912
(1) Includes a gross future tax asset of $180 as at October 31, 2004 (2003 – $295), relating to subsidiaries’ unused income tax losses arising in prior years, which expiremostly by 2006. This future tax asset has been reduced by a valuation allowance of $84 (2003 – $189), resulting in a net future tax asset of $96 (2003 – $106).
(2) Net future income taxes of $999 (2003 – $912) are represented by future income tax assets of $1,055 (2003 – $982), net of future income tax liabilities of $56 (2003 – $70).
Earnings of certain international subsidiaries are subject to tax only upontheir repatriation to Canada. As repatriation is not currently planned inthe foreseeable future, the Bank has not recognized a future income tax
liability. If all international subsidiaries’ unremitted earnings were repatri-ated, taxes that would be payable as at October 31, 2004, are esti-mated to be $308 million (October 31, 2003 – $412 million).
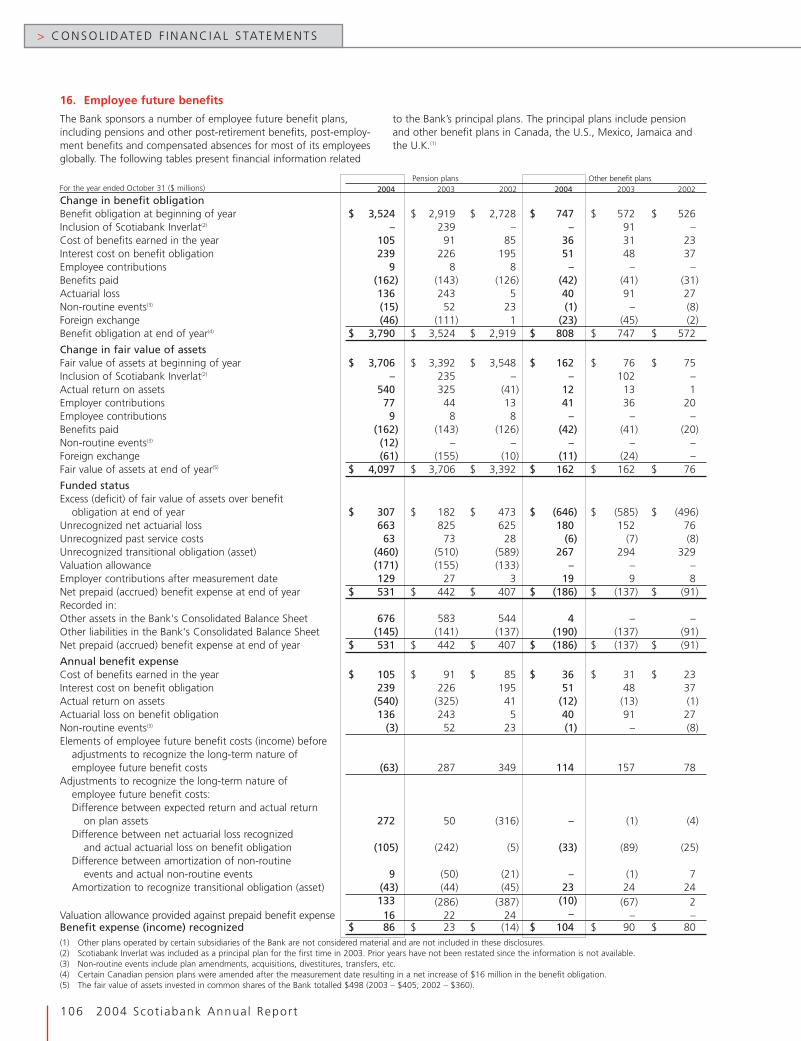
The Bank sponsors a number of employee future benefit plans,including pensions and other post-retirement benefits, post-employ-ment benefits and compensated absences for most of its employeesglobally. The following tables present financial information related
to the Bank’s principal plans. The principal plans include pensionand other benefit plans in Canada, the U.S., Mexico, Jamaica andthe U.K.(1)
> CONSOL IDATED F INANC IAL STATEMENTS
106 2004 Scot iabank Annual Report
16. Employee future benefits
Pension plans Other benefit plansFor the year ended October 31 ($ millions) 2004 2003 2002 2004 2003 2002
Change in benefit obligationBenefit obligation at beginning of year $ 3,524 $ 2,919 $ 2,728 $ 747 $ 572 $ 526Inclusion of Scotiabank Inverlat(2) – 239 – – 91 –Cost of benefits earned in the year 105 91 85 36 31 23Interest cost on benefit obligation 239 226 195 51 48 37Employee contributions 9 8 8 – – –Benefits paid (162) (143) (126) (42) (41) (31)Actuarial loss 136 243 5 40 91 27Non-routine events(3) (15) 52 23 (1) – (8)Foreign exchange (46) (111) 1 (23) (45) (2)Benefit obligation at end of year(4) $ 3,790 $ 3,524 $ 2,919 $ 808 $ 747 $ 572
Change in fair value of assetsFair value of assets at beginning of year $ 3,706 $ 3,392 $ 3,548 $ 162 $ 76 $ 75Inclusion of Scotiabank Inverlat(2) – 235 – – 102 –Actual return on assets 540 325 (41) 12 13 1Employer contributions 77 44 13 41 36 20Employee contributions 9 8 8 – – –Benefits paid (162) (143) (126) (42) (41) (20)Non-routine events(3) (12) – – – – –Foreign exchange (61) (155) (10) (11) (24) –Fair value of assets at end of year(5) $ 4,097 $ 3,706 $ 3,392 $ 162 $ 162 $ 76
Funded statusExcess (deficit) of fair value of assets over benefit
obligation at end of year $ 307 $ 182 $ 473 $ (646) $ (585) $ (496)Unrecognized net actuarial loss 663 825 625 180 152 76Unrecognized past service costs 63 73 28 (6) (7) (8)Unrecognized transitional obligation (asset) (460) (510) (589) 267 294 329Valuation allowance (171) (155) (133) – – –Employer contributions after measurement date 129 27 3 19 9 8Net prepaid (accrued) benefit expense at end of year $ 531 $ 442 $ 407 $ (186) $ (137) $ (91)Recorded in:Other assets in the Bank's Consolidated Balance Sheet 676 583 544 4 – –Other liabilities in the Bank's Consolidated Balance Sheet (145) (141) (137) (190) (137) (91)Net prepaid (accrued) benefit expense at end of year $ 531 $ 442 $ 407 $ (186) $ (137) $ (91)
Annual benefit expenseCost of benefits earned in the year $ 105 $ 91 $ 85 $ 36 $ 31 $ 23Interest cost on benefit obligation 239 226 195 51 48 37Actual return on assets (540) (325) 41 (12) (13) (1)Actuarial loss on benefit obligation 136 243 5 40 91 27Non-routine events(3) (3) 52 23 (1) – (8)Elements of employee future benefit costs (income) before
adjustments to recognize the long-term nature ofemployee future benefit costs (63) 287 349 114 157 78
Adjustments to recognize the long-term nature ofemployee future benefit costs:Difference between expected return and actual return
on plan assets 272 50 (316) – (1) (4)Difference between net actuarial loss recognized
and actual actuarial loss on benefit obligation (105) (242) (5) (33) (89) (25)Difference between amortization of non-routine
events and actual non-routine events 9 (50) (21) – (1) 7Amortization to recognize transitional obligation (asset) (43) (44) (45) 23 24 24
133 (286) (387) (10) (67) 2Valuation allowance provided against prepaid benefit expense 16 22 24 – – –Benefit expense (income) recognized $ 86 $ 23 $ (14) $ 104 $ 90 $ 80(1) Other plans operated by certain subsidiaries of the Bank are not considered material and are not included in these disclosures.(2) Scotiabank Inverlat was included as a principal plan for the first time in 2003. Prior years have not been restated since the information is not available.(3) Non-routine events include plan amendments, acquisitions, divestitures, transfers, etc.(4) Certain Canadian pension plans were amended after the measurement date resulting in a net increase of $16 million in the benefit obligation.(5) The fair value of assets invested in common shares of the Bank totalled $498 (2003 – $405; 2002 – $360).
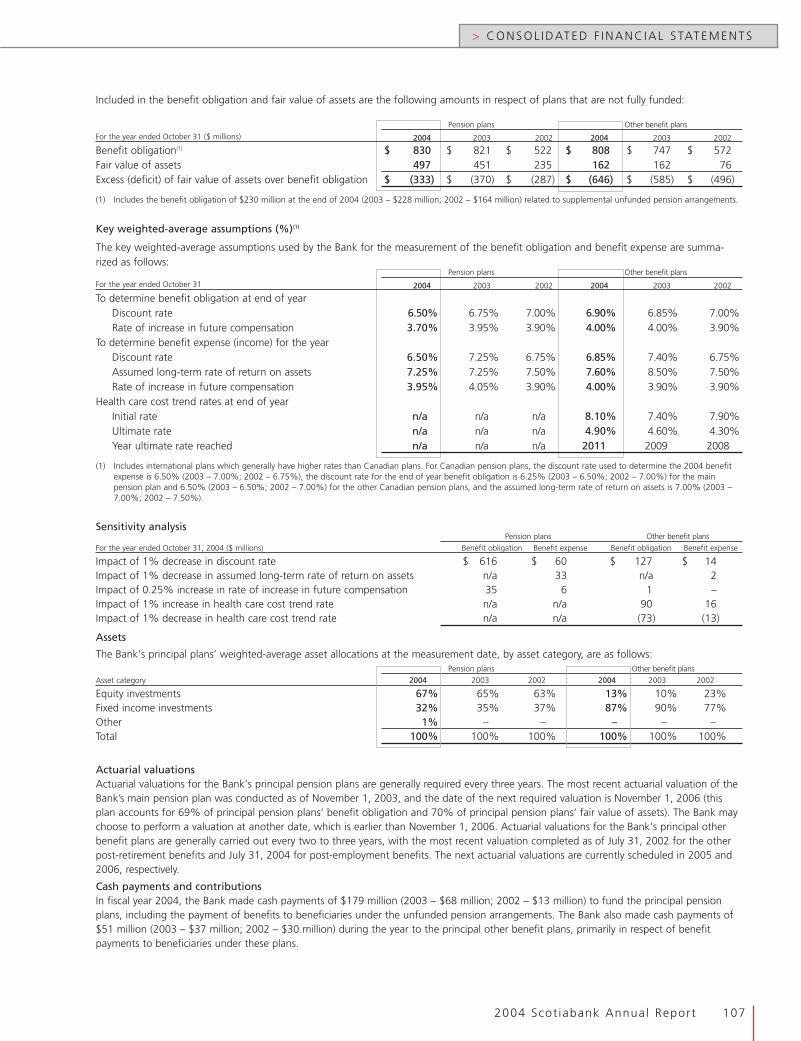
2004 Scot iabank Annual Report 107
> CONSOL IDATED F INANC IAL STATEMENTS
Included in the benefit obligation and fair value of assets are the following amounts in respect of plans that are not fully funded:
Pension plans Other benefit plans
For the year ended October 31 ($ millions) 2004 2003 2002 2004 2003 2002
Benefit obligation(1) $ 830 $ 821 $ 522 $ 808 $ 747 $ 572Fair value of assets 497 451 235 162 162 76Excess (deficit) of fair value of assets over benefit obligation $ (333) $ (370) $ (287) $ (646) $ (585) $ (496)
(1) Includes the benefit obligation of $230 million at the end of 2004 (2003 – $228 million; 2002 – $164 million) related to supplemental unfunded pension arrangements.
Key weighted-average assumptions (%)(1)
The key weighted-average assumptions used by the Bank for the measurement of the benefit obligation and benefit expense are summa-rized as follows:
Pension plans Other benefit plans
For the year ended October 31 2004 2003 2002 2004 2003 2002
To determine benefit obligation at end of yearDiscount rate 6.50% 6.75% 7.00% 6.90% 6.85% 7.00%Rate of increase in future compensation 3.70% 3.95% 3.90% 4.00% 4.00% 3.90%
To determine benefit expense (income) for the yearDiscount rate 6.50% 7.25% 6.75% 6.85% 7.40% 6.75%Assumed long-term rate of return on assets 7.25% 7.25% 7.50% 7.60% 8.50% 7.50%Rate of increase in future compensation 3.95% 4.05% 3.90% 4.00% 3.90% 3.90%
Health care cost trend rates at end of yearInitial rate n/a n/a n/a 8.10% 7.40% 7.90%Ultimate rate n/a n/a n/a 4.90% 4.60% 4.30%Year ultimate rate reached n/a n/a n/a 2011 2009 2008
(1) Includes international plans which generally have higher rates than Canadian plans. For Canadian pension plans, the discount rate used to determine the 2004 benefitexpense is 6.50% (2003 – 7.00%; 2002 – 6.75%), the discount rate for the end of year benefit obligation is 6.25% (2003 – 6.50%; 2002 – 7.00%) for the mainpension plan and 6.50% (2003 – 6.50%; 2002 – 7.00%) for the other Canadian pension plans, and the assumed long-term rate of return on assets is 7.00% (2003 –7.00%; 2002 – 7.50%).
Sensitivity analysisPension plans Other benefit plans
For the year ended October 31, 2004 ($ millions) Benefit obligation Benefit expense Benefit obligation Benefit expense
Impact of 1% decrease in discount rate $ 616 $ 60 $ 127 $ 14Impact of 1% decrease in assumed long-term rate of return on assets n/a 33 n/a 2Impact of 0.25% increase in rate of increase in future compensation 35 6 1 –Impact of 1% increase in health care cost trend rate n/a n/a 90 16Impact of 1% decrease in health care cost trend rate n/a n/a (73) (13)
Assets
The Bank's principal plans’ weighted-average asset allocations at the measurement date, by asset category, are as follows:Pension plans Other benefit plans
Asset category 2004 2003 2002 2004 2003 2002
Equity investments 67% 65% 63% 13% 10% 23%Fixed income investments 32% 35% 37% 87% 90% 77%Other 1% – – – – –Total 100% 100% 100% 100% 100% 100%
Actuarial valuationsActuarial valuations for the Bank's principal pension plans are generally required every three years. The most recent actuarial valuation of theBank’s main pension plan was conducted as of November 1, 2003, and the date of the next required valuation is November 1, 2006 (thisplan accounts for 69% of principal pension plans’ benefit obligation and 70% of principal pension plans’ fair value of assets). The Bank maychoose to perform a valuation at another date, which is earlier than November 1, 2006. Actuarial valuations for the Bank's principal otherbenefit plans are generally carried out every two to three years, with the most recent valuation completed as of July 31, 2002 for the otherpost-retirement benefits and July 31, 2004 for post-employment benefits. The next actuarial valuations are currently scheduled in 2005 and2006, respectively.
Cash payments and contributionsIn fiscal year 2004, the Bank made cash payments of $179 million (2003 – $68 million; 2002 – $13 million) to fund the principal pensionplans, including the payment of benefits to beneficiaries under the unfunded pension arrangements. The Bank also made cash payments of$51 million (2003 – $37 million; 2002 – $30 million) during the year to the principal other benefit plans, primarily in respect of benefitpayments to beneficiaries under these plans.
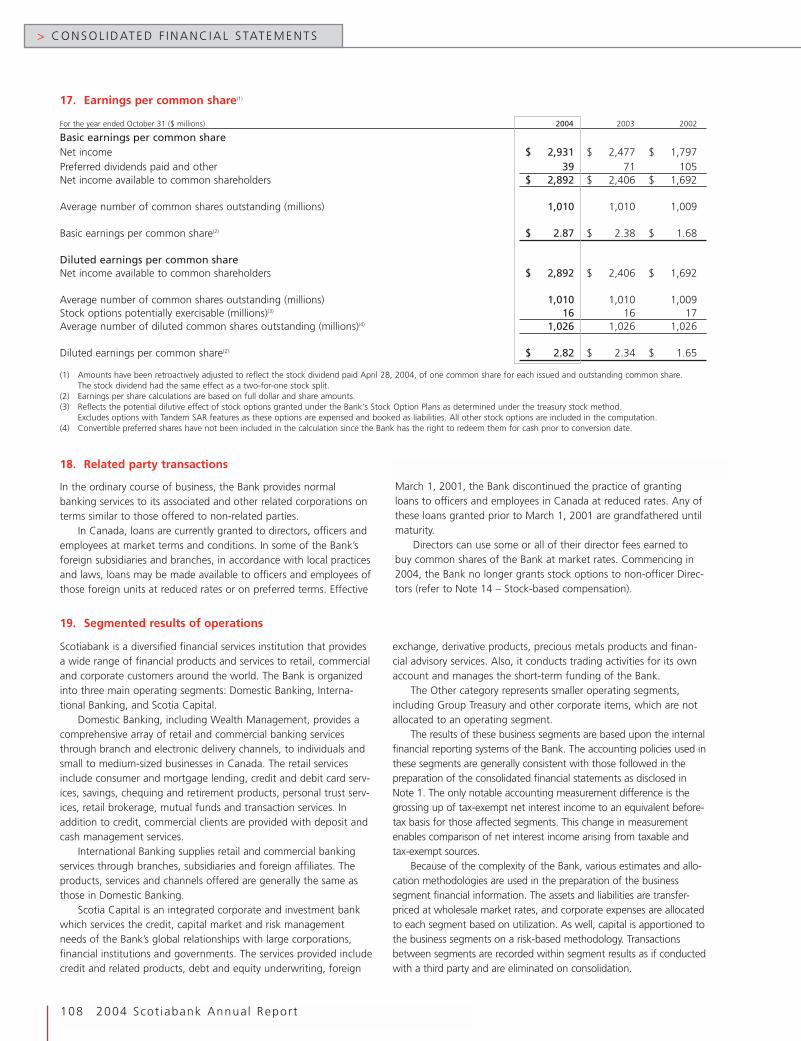
> CONSOL IDATED F INANC IAL STATEMENTS
108 2004 Scot iabank Annual Report
Scotiabank is a diversified financial services institution that providesa wide range of financial products and services to retail, commercialand corporate customers around the world. The Bank is organizedinto three main operating segments: Domestic Banking, Interna-tional Banking, and Scotia Capital.
Domestic Banking, including Wealth Management, provides acomprehensive array of retail and commercial banking servicesthrough branch and electronic delivery channels, to individuals andsmall to medium-sized businesses in Canada. The retail servicesinclude consumer and mortgage lending, credit and debit card serv-ices, savings, chequing and retirement products, personal trust serv-ices, retail brokerage, mutual funds and transaction services. Inaddition to credit, commercial clients are provided with deposit andcash management services.
International Banking supplies retail and commercial bankingservices through branches, subsidiaries and foreign affiliates. Theproducts, services and channels offered are generally the same asthose in Domestic Banking.
Scotia Capital is an integrated corporate and investment bankwhich services the credit, capital market and risk managementneeds of the Bank’s global relationships with large corporations,financial institutions and governments. The services provided includecredit and related products, debt and equity underwriting, foreign
exchange, derivative products, precious metals products and finan-cial advisory services. Also, it conducts trading activities for its ownaccount and manages the short-term funding of the Bank.
The Other category represents smaller operating segments,including Group Treasury and other corporate items, which are notallocated to an operating segment.
The results of these business segments are based upon the internalfinancial reporting systems of the Bank. The accounting policies used inthese segments are generally consistent with those followed in thepreparation of the consolidated financial statements as disclosed inNote 1. The only notable accounting measurement difference is thegrossing up of tax-exempt net interest income to an equivalent before-tax basis for those affected segments. This change in measurementenables comparison of net interest income arising from taxable andtax-exempt sources.
Because of the complexity of the Bank, various estimates and allo-cation methodologies are used in the preparation of the businesssegment financial information. The assets and liabilities are transfer-priced at wholesale market rates, and corporate expenses are allocatedto each segment based on utilization. As well, capital is apportioned tothe business segments on a risk-based methodology. Transactionsbetween segments are recorded within segment results as if conductedwith a third party and are eliminated on consolidation.
17. Earnings per common share(1)
For the year ended October 31 ($ millions) 2004 2003 2002
Basic earnings per common shareNet income $ 2,931 $ 2,477 $ 1,797Preferred dividends paid and other 39 71 105Net income available to common shareholders $ 2,892 $ 2,406 $ 1,692
Average number of common shares outstanding (millions) 1,010 1,010 1,009
Basic earnings per common share(2) $ 2.87 $ 2.38 $ 1.68
Diluted earnings per common shareNet income available to common shareholders $ 2,892 $ 2,406 $ 1,692
Average number of common shares outstanding (millions) 1,010 1,010 1,009Stock options potentially exercisable (millions)(3) 16 16 17Average number of diluted common shares outstanding (millions)(4) 1,026 1,026 1,026
Diluted earnings per common share(2) $ 2.82 $ 2.34 $ 1.65
(1) Amounts have been retroactively adjusted to reflect the stock dividend paid April 28, 2004, of one common share for each issued and outstanding common share.The stock dividend had the same effect as a two-for-one stock split.
(2) Earnings per share calculations are based on full dollar and share amounts.(3) Reflects the potential dilutive effect of stock options granted under the Bank's Stock Option Plans as determined under the treasury stock method.
Excludes options with Tandem SAR features as these options are expensed and booked as liabilities. All other stock options are included in the computation.(4) Convertible preferred shares have not been included in the calculation since the Bank has the right to redeem them for cash prior to conversion date.
18. Related party transactions
In the ordinary course of business, the Bank provides normalbanking services to its associated and other related corporations onterms similar to those offered to non-related parties.
In Canada, loans are currently granted to directors, officers andemployees at market terms and conditions. In some of the Bank’sforeign subsidiaries and branches, in accordance with local practicesand laws, loans may be made available to officers and employees ofthose foreign units at reduced rates or on preferred terms. Effective
March 1, 2001, the Bank discontinued the practice of grantingloans to officers and employees in Canada at reduced rates. Any ofthese loans granted prior to March 1, 2001 are grandfathered untilmaturity.
Directors can use some or all of their director fees earned tobuy common shares of the Bank at market rates. Commencing in2004, the Bank no longer grants stock options to non-officer Direc-tors (refer to Note 14 – Stock-based compensation).
19. Segmented results of operations
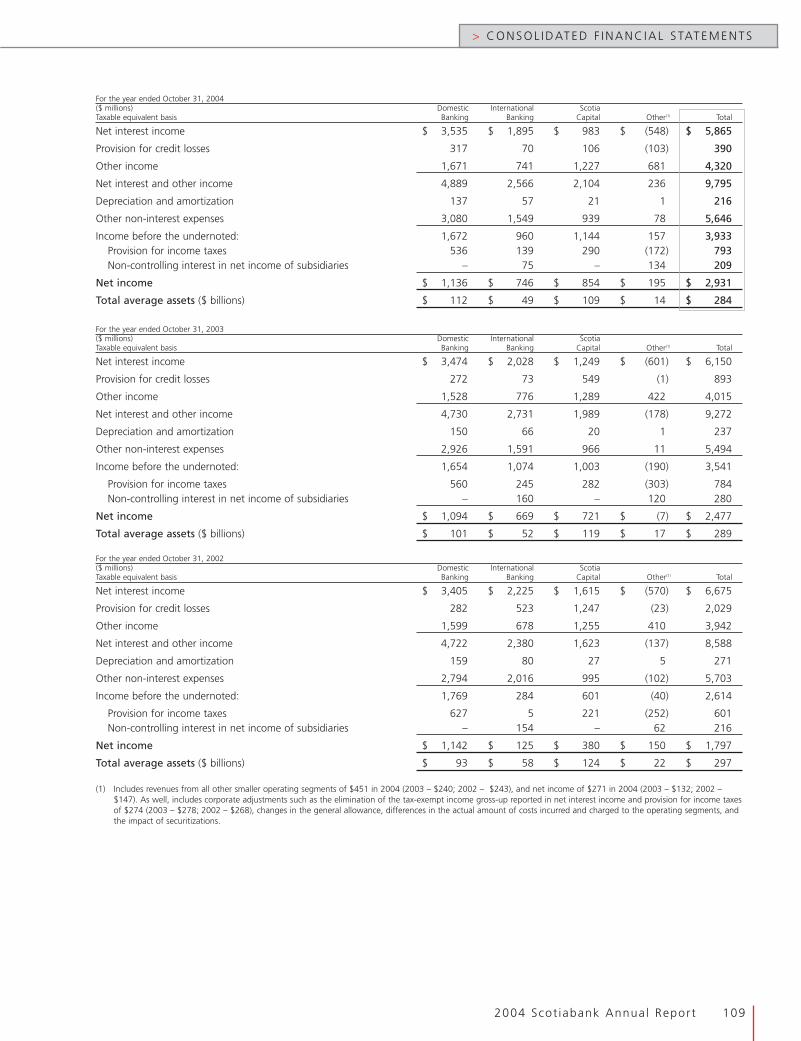
2004 Scot iabank Annual Report 109
> CONSOL IDATED F INANC IAL STATEMENTS
For the year ended October 31, 2004($ millions) Domestic International ScotiaTaxable equivalent basis Banking Banking Capital Other(1) Total
Net interest income $ 3,535 $ 1,895 $ 983 $ (548) $ 5,865
Provision for credit losses 317 70 106 (103) 390
Other income 1,671 741 1,227 681 4,320
Net interest and other income 4,889 2,566 2,104 236 9,795
Depreciation and amortization 137 57 21 1 216
Other non-interest expenses 3,080 1,549 939 78 5,646
Income before the undernoted: 1,672 960 1,144 157 3,933Provision for income taxes 536 139 290 (172) 793Non-controlling interest in net income of subsidiaries – 75 – 134 209
Net income $ 1,136 $ 746 $ 854 $ 195 $ 2,931
Total average assets ($ billions) $ 112 $ 49 $ 109 $ 14 $ 284
For the year ended October 31, 2003($ millions) Domestic International ScotiaTaxable equivalent basis Banking Banking Capital Other(1) Total
Net interest income $ 3,474 $ 2,028 $ 1,249 $ (601) $ 6,150
Provision for credit losses 272 73 549 (1) 893
Other income 1,528 776 1,289 422 4,015
Net interest and other income 4,730 2,731 1,989 (178) 9,272
Depreciation and amortization 150 66 20 1 237
Other non-interest expenses 2,926 1,591 966 11 5,494
Income before the undernoted: 1,654 1,074 1,003 (190) 3,541
Provision for income taxes 560 245 282 (303) 784Non-controlling interest in net income of subsidiaries – 160 – 120 280
Net income $ 1,094 $ 669 $ 721 $ (7) $ 2,477
Total average assets ($ billions) $ 101 $ 52 $ 119 $ 17 $ 289
For the year ended October 31, 2002($ millions) Domestic International ScotiaTaxable equivalent basis Banking Banking Capital Other(1) Total
Net interest income $ 3,405 $ 2,225 $ 1,615 $ (570) $ 6,675
Provision for credit losses 282 523 1,247 (23) 2,029
Other income 1,599 678 1,255 410 3,942
Net interest and other income 4,722 2,380 1,623 (137) 8,588
Depreciation and amortization 159 80 27 5 271
Other non-interest expenses 2,794 2,016 995 (102) 5,703
Income before the undernoted: 1,769 284 601 (40) 2,614
Provision for income taxes 627 5 221 (252) 601Non-controlling interest in net income of subsidiaries – 154 – 62 216
Net income $ 1,142 $ 125 $ 380 $ 150 $ 1,797
Total average assets ($ billions) $ 93 $ 58 $ 124 $ 22 $ 297
(1) Includes revenues from all other smaller operating segments of $451 in 2004 (2003 – $240; 2002 – $243), and net income of $271 in 2004 (2003 – $132; 2002 –$147). As well, includes corporate adjustments such as the elimination of the tax-exempt income gross-up reported in net interest income and provision for income taxesof $274 (2003 – $278; 2002 – $268), changes in the general allowance, differences in the actual amount of costs incurred and charged to the operating segments, andthe impact of securitizations.
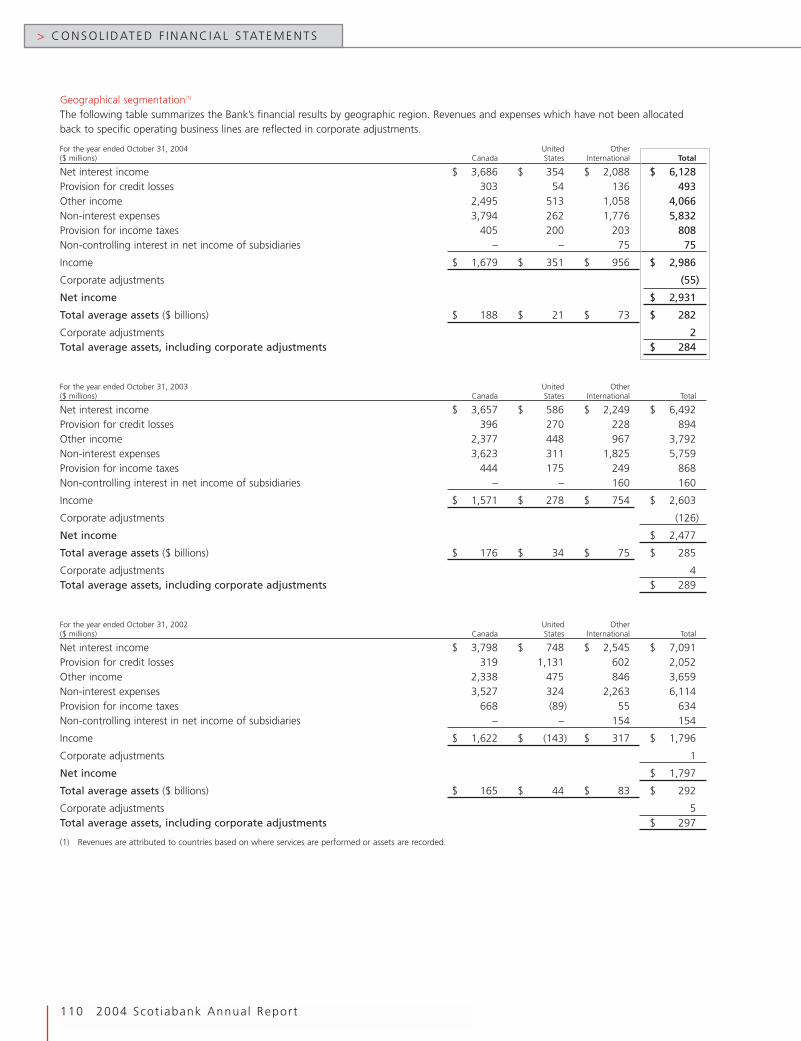
> CONSOL IDATED F INANC IAL STATEMENTS
110 2004 Scot iabank Annual Report
Geographical segmentation(1)
The following table summarizes the Bank’s financial results by geographic region. Revenues and expenses which have not been allocatedback to specific operating business lines are reflected in corporate adjustments.
For the year ended October 31, 2004 United Other($ millions) Canada States International Total
Net interest income $ 3,686 $ 354 $ 2,088 $ 6,128Provision for credit losses 303 54 136 493Other income 2,495 513 1,058 4,066Non-interest expenses 3,794 262 1,776 5,832Provision for income taxes 405 200 203 808Non-controlling interest in net income of subsidiaries – – 75 75
Income $ 1,679 $ 351 $ 956 $ 2,986
Corporate adjustments (55)
Net income $ 2,931
Total average assets ($ billions) $ 188 $ 21 $ 73 $ 282
Corporate adjustments 2Total average assets, including corporate adjustments $ 284
For the year ended October 31, 2003 United Other($ millions) Canada States International Total
Net interest income $ 3,657 $ 586 $ 2,249 $ 6,492Provision for credit losses 396 270 228 894Other income 2,377 448 967 3,792Non-interest expenses 3,623 311 1,825 5,759Provision for income taxes 444 175 249 868Non-controlling interest in net income of subsidiaries – – 160 160
Income $ 1,571 $ 278 $ 754 $ 2,603
Corporate adjustments (126)
Net income $ 2,477
Total average assets ($ billions) $ 176 $ 34 $ 75 $ 285
Corporate adjustments 4Total average assets, including corporate adjustments $ 289
For the year ended October 31, 2002 United Other($ millions) Canada States International Total
Net interest income $ 3,798 $ 748 $ 2,545 $ 7,091Provision for credit losses 319 1,131 602 2,052Other income 2,338 475 846 3,659Non-interest expenses 3,527 324 2,263 6,114Provision for income taxes 668 (89) 55 634Non-controlling interest in net income of subsidiaries – – 154 154
Income $ 1,622 $ (143) $ 317 $ 1,796
Corporate adjustments 1
Net income $ 1,797
Total average assets ($ billions) $ 165 $ 44 $ 83 $ 292
Corporate adjustments 5Total average assets, including corporate adjustments $ 297
(1) Revenues are attributed to countries based on where services are performed or assets are recorded.
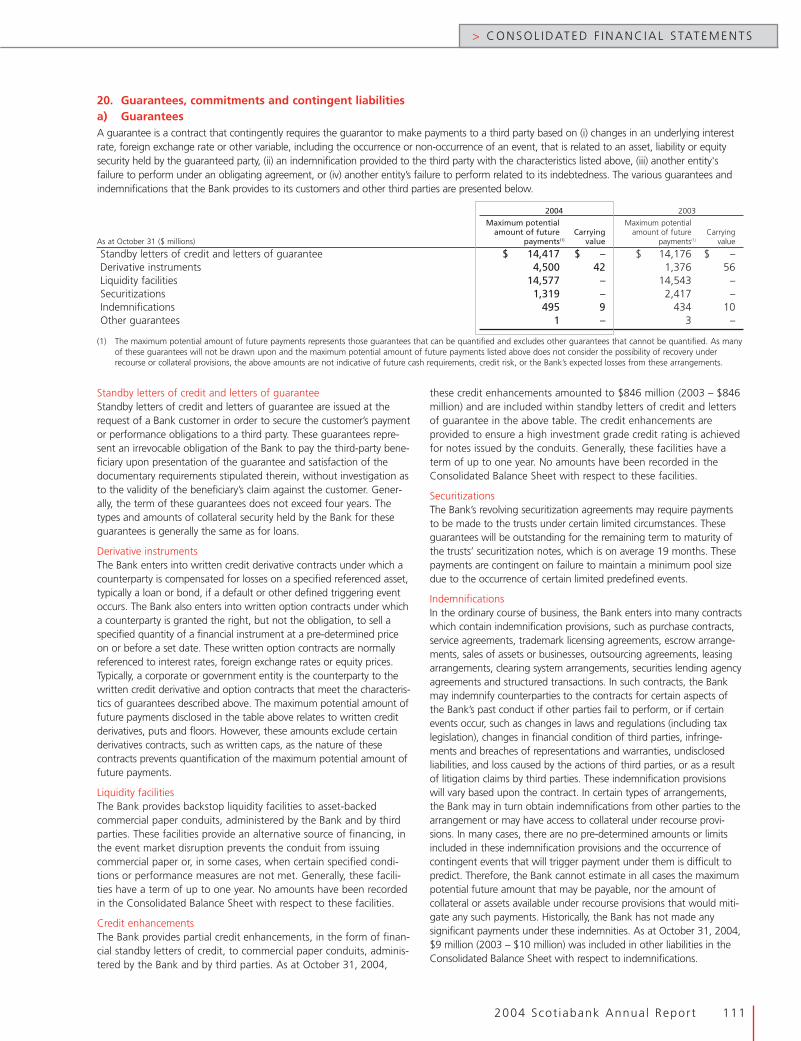
2004 Scot iabank Annual Report 111
> CONSOL IDATED F INANC IAL STATEMENTS
Standby letters of credit and letters of guaranteeStandby letters of credit and letters of guarantee are issued at therequest of a Bank customer in order to secure the customer’s paymentor performance obligations to a third party. These guarantees repre-sent an irrevocable obligation of the Bank to pay the third-party bene-ficiary upon presentation of the guarantee and satisfaction of thedocumentary requirements stipulated therein, without investigation asto the validity of the beneficiary’s claim against the customer. Gener-ally, the term of these guarantees does not exceed four years. Thetypes and amounts of collateral security held by the Bank for theseguarantees is generally the same as for loans.
Derivative instrumentsThe Bank enters into written credit derivative contracts under which acounterparty is compensated for losses on a specified referenced asset,typically a loan or bond, if a default or other defined triggering eventoccurs. The Bank also enters into written option contracts under whicha counterparty is granted the right, but not the obligation, to sell aspecified quantity of a financial instrument at a pre-determined priceon or before a set date. These written option contracts are normallyreferenced to interest rates, foreign exchange rates or equity prices.Typically, a corporate or government entity is the counterparty to thewritten credit derivative and option contracts that meet the characteris-tics of guarantees described above. The maximum potential amount offuture payments disclosed in the table above relates to written creditderivatives, puts and floors. However, these amounts exclude certainderivatives contracts, such as written caps, as the nature of thesecontracts prevents quantification of the maximum potential amount offuture payments.
Liquidity facilitiesThe Bank provides backstop liquidity facilities to asset-backedcommercial paper conduits, administered by the Bank and by thirdparties. These facilities provide an alternative source of financing, inthe event market disruption prevents the conduit from issuingcommercial paper or, in some cases, when certain specified condi-tions or performance measures are not met. Generally, these facili-ties have a term of up to one year. No amounts have been recordedin the Consolidated Balance Sheet with respect to these facilities.
Credit enhancementsThe Bank provides partial credit enhancements, in the form of finan-cial standby letters of credit, to commercial paper conduits, adminis-tered by the Bank and by third parties. As at October 31, 2004,
these credit enhancements amounted to $846 million (2003 – $846million) and are included within standby letters of credit and lettersof guarantee in the above table. The credit enhancements areprovided to ensure a high investment grade credit rating is achievedfor notes issued by the conduits. Generally, these facilities have aterm of up to one year. No amounts have been recorded in theConsolidated Balance Sheet with respect to these facilities.
SecuritizationsThe Bank’s revolving securitization agreements may require paymentsto be made to the trusts under certain limited circumstances. Theseguarantees will be outstanding for the remaining term to maturity ofthe trusts’ securitization notes, which is on average 19 months. Thesepayments are contingent on failure to maintain a minimum pool sizedue to the occurrence of certain limited predefined events.
IndemnificationsIn the ordinary course of business, the Bank enters into many contractswhich contain indemnification provisions, such as purchase contracts,service agreements, trademark licensing agreements, escrow arrange-ments, sales of assets or businesses, outsourcing agreements, leasingarrangements, clearing system arrangements, securities lending agencyagreements and structured transactions. In such contracts, the Bankmay indemnify counterparties to the contracts for certain aspects ofthe Bank’s past conduct if other parties fail to perform, or if certainevents occur, such as changes in laws and regulations (including taxlegislation), changes in financial condition of third parties, infringe-ments and breaches of representations and warranties, undisclosedliabilities, and loss caused by the actions of third parties, or as a resultof litigation claims by third parties. These indemnification provisionswill vary based upon the contract. In certain types of arrangements,the Bank may in turn obtain indemnifications from other parties to thearrangement or may have access to collateral under recourse provi-sions. In many cases, there are no pre-determined amounts or limitsincluded in these indemnification provisions and the occurrence ofcontingent events that will trigger payment under them is difficult topredict. Therefore, the Bank cannot estimate in all cases the maximumpotential future amount that may be payable, nor the amount ofcollateral or assets available under recourse provisions that would miti-gate any such payments. Historically, the Bank has not made anysignificant payments under these indemnities. As at October 31, 2004,$9 million (2003 – $10 million) was included in other liabilities in theConsolidated Balance Sheet with respect to indemnifications.
20. Guarantees, commitments and contingent liabilitiesa) GuaranteesA guarantee is a contract that contingently requires the guarantor to make payments to a third party based on (i) changes in an underlying interestrate, foreign exchange rate or other variable, including the occurrence or non-occurrence of an event, that is related to an asset, liability or equitysecurity held by the guaranteed party, (ii) an indemnification provided to the third party with the characteristics listed above, (iii) another entity'sfailure to perform under an obligating agreement, or (iv) another entity’s failure to perform related to its indebtedness. The various guarantees andindemnifications that the Bank provides to its customers and other third parties are presented below.
2004 2003
Maximum potential Maximum potentialamount of future Carrying amount of future Carrying
As at October 31 ($ millions) payments(1) value payments(1) value
Standby letters of credit and letters of guarantee $ 14,417 $ – $ 14,176 $ –Derivative instruments 4,500 42 1,376 56Liquidity facilities 14,577 – 14,543 –Securitizations 1,319 – 2,417 –Indemnifications 495 9 434 10Other guarantees 1 – 3 –
(1) The maximum potential amount of future payments represents those guarantees that can be quantified and excludes other guarantees that cannot be quantified. As manyof these guarantees will not be drawn upon and the maximum potential amount of future payments listed above does not consider the possibility of recovery underrecourse or collateral provisions, the above amounts are not indicative of future cash requirements, credit risk, or the Bank’s expected losses from these arrangements.
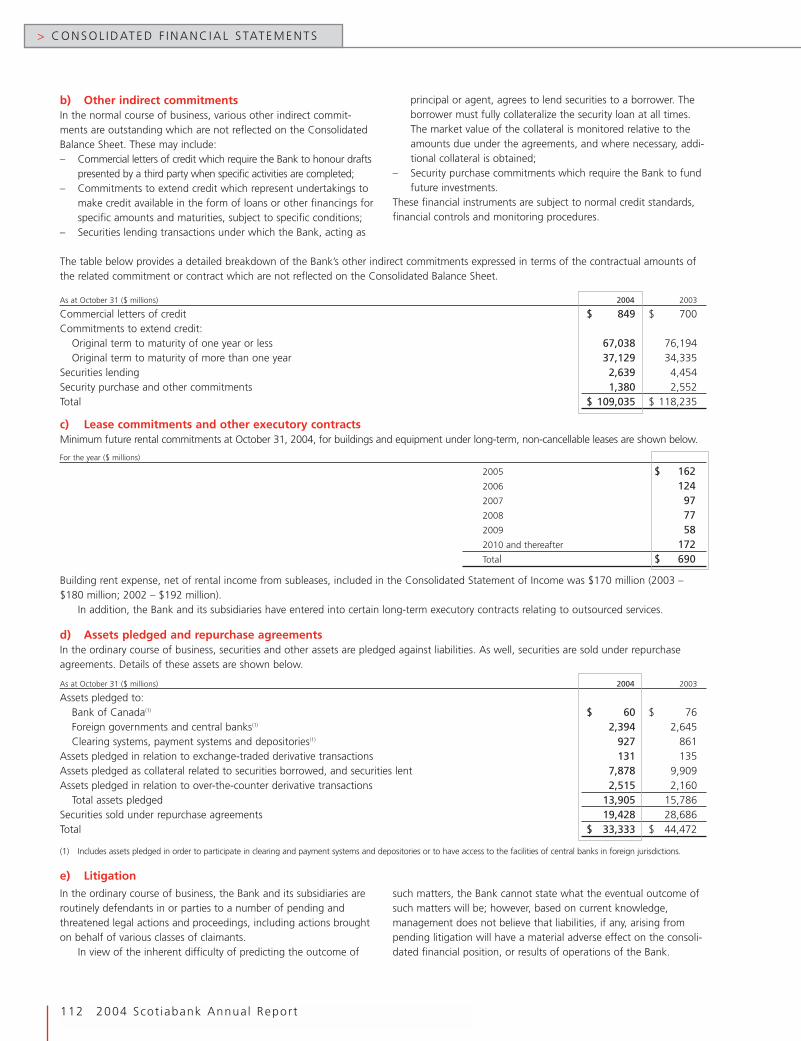
> CONSOL IDATED F INANC IAL STATEMENTS
112 2004 Scot iabank Annual Report
b) Other indirect commitmentsIn the normal course of business, various other indirect commit-ments are outstanding which are not reflected on the ConsolidatedBalance Sheet. These may include:– Commercial letters of credit which require the Bank to honour drafts
presented by a third party when specific activities are completed;– Commitments to extend credit which represent undertakings to
make credit available in the form of loans or other financings forspecific amounts and maturities, subject to specific conditions;
– Securities lending transactions under which the Bank, acting as
principal or agent, agrees to lend securities to a borrower. Theborrower must fully collateralize the security loan at all times.The market value of the collateral is monitored relative to theamounts due under the agreements, and where necessary, addi-tional collateral is obtained;
– Security purchase commitments which require the Bank to fundfuture investments.
These financial instruments are subject to normal credit standards,financial controls and monitoring procedures.
The table below provides a detailed breakdown of the Bank’s other indirect commitments expressed in terms of the contractual amounts ofthe related commitment or contract which are not reflected on the Consolidated Balance Sheet.
As at October 31 ($ millions) 2004 2003
Commercial letters of credit $ 849 $ 700Commitments to extend credit:
Original term to maturity of one year or less 67,038 76,194Original term to maturity of more than one year 37,129 34,335
Securities lending 2,639 4,454Security purchase and other commitments 1,380 2,552Total $ 109,035 $ 118,235
c) Lease commitments and other executory contractsMinimum future rental commitments at October 31, 2004, for buildings and equipment under long-term, non-cancellable leases are shown below.
For the year ($ millions)
2005 $ 1622006 1242007 972008 772009 582010 and thereafter 172Total $ 690
Building rent expense, net of rental income from subleases, included in the Consolidated Statement of Income was $170 million (2003 –$180 million; 2002 – $192 million).
In addition, the Bank and its subsidiaries have entered into certain long-term executory contracts relating to outsourced services.
d) Assets pledged and repurchase agreementsIn the ordinary course of business, securities and other assets are pledged against liabilities. As well, securities are sold under repurchaseagreements. Details of these assets are shown below.
As at October 31 ($ millions) 2004 2003
Assets pledged to:Bank of Canada(1) $ 60 $ 76Foreign governments and central banks(1) 2,394 2,645Clearing systems, payment systems and depositories(1) 927 861
Assets pledged in relation to exchange-traded derivative transactions 131 135Assets pledged as collateral related to securities borrowed, and securities lent 7,878 9,909Assets pledged in relation to over-the-counter derivative transactions 2,515 2,160
Total assets pledged 13,905 15,786Securities sold under repurchase agreements 19,428 28,686Total $ 33,333 $ 44,472
(1) Includes assets pledged in order to participate in clearing and payment systems and depositories or to have access to the facilities of central banks in foreign jurisdictions.
e) Litigation
In the ordinary course of business, the Bank and its subsidiaries areroutinely defendants in or parties to a number of pending andthreatened legal actions and proceedings, including actions broughton behalf of various classes of claimants.
In view of the inherent difficulty of predicting the outcome of
such matters, the Bank cannot state what the eventual outcome ofsuch matters will be; however, based on current knowledge,management does not believe that liabilities, if any, arising frompending litigation will have a material adverse effect on the consoli-dated financial position, or results of operations of the Bank.
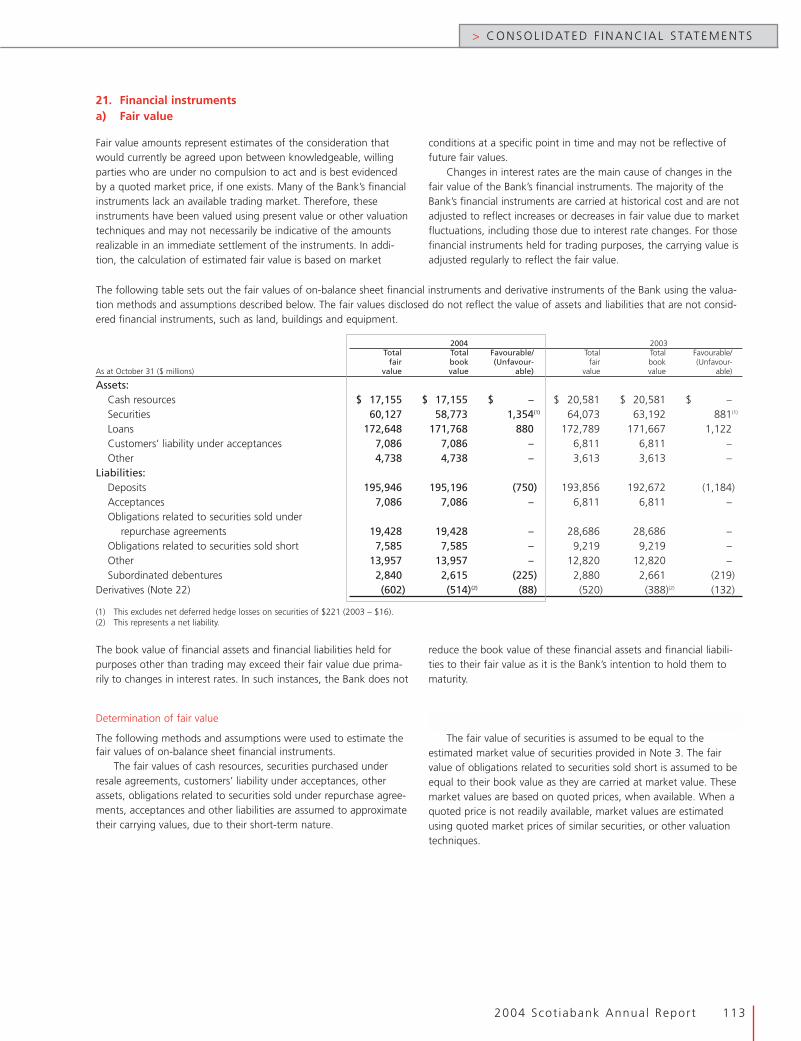
2004 Scot iabank Annual Report 113
> CONSOL IDATED F INANC IAL STATEMENTS
Fair value amounts represent estimates of the consideration thatwould currently be agreed upon between knowledgeable, willingparties who are under no compulsion to act and is best evidencedby a quoted market price, if one exists. Many of the Bank’s financialinstruments lack an available trading market. Therefore, theseinstruments have been valued using present value or other valuationtechniques and may not necessarily be indicative of the amountsrealizable in an immediate settlement of the instruments. In addi-tion, the calculation of estimated fair value is based on market
conditions at a specific point in time and may not be reflective offuture fair values.
Changes in interest rates are the main cause of changes in thefair value of the Bank’s financial instruments. The majority of theBank’s financial instruments are carried at historical cost and are notadjusted to reflect increases or decreases in fair value due to marketfluctuations, including those due to interest rate changes. For thosefinancial instruments held for trading purposes, the carrying value isadjusted regularly to reflect the fair value.
21. Financial instrumentsa) Fair value
The following table sets out the fair values of on-balance sheet financial instruments and derivative instruments of the Bank using the valua-tion methods and assumptions described below. The fair values disclosed do not reflect the value of assets and liabilities that are not consid-ered financial instruments, such as land, buildings and equipment.
2004 2003Total Total Favourable/ Total Total Favourable/
fair book (Unfavour- fair book (Unfavour-As at October 31 ($ millions) value value able) value value able)
Assets:Cash resources $ 17,155 $ 17,155 $ – $ 20,581 $ 20,581 $ –Securities 60,127 58,773 1,354(1) 64,073 63,192 881(1)
Loans 172,648 171,768 880 172,789 171,667 1,122Customers’ liability under acceptances 7,086 7,086 – 6,811 6,811 –Other 4,738 4,738 – 3,613 3,613 –
Liabilities:Deposits 195,946 195,196 (750) 193,856 192,672 (1,184)Acceptances 7,086 7,086 – 6,811 6,811 –Obligations related to securities sold under
repurchase agreements 19,428 19,428 – 28,686 28,686 –Obligations related to securities sold short 7,585 7,585 – 9,219 9,219 –Other 13,957 13,957 – 12,820 12,820 –Subordinated debentures 2,840 2,615 (225) 2,880 2,661 (219)
Derivatives (Note 22) (602) (514)(2) (88) (520) (388)(2) (132)
(1) This excludes net deferred hedge losses on securities of $221 (2003 – $16).(2) This represents a net liability.
Determination of fair value
The following methods and assumptions were used to estimate thefair values of on-balance sheet financial instruments.
The fair values of cash resources, securities purchased underresale agreements, customers’ liability under acceptances, otherassets, obligations related to securities sold under repurchase agree-ments, acceptances and other liabilities are assumed to approximatetheir carrying values, due to their short-term nature.
The fair value of securities is assumed to be equal to theestimated market value of securities provided in Note 3. The fairvalue of obligations related to securities sold short is assumed to beequal to their book value as they are carried at market value. Thesemarket values are based on quoted prices, when available. When aquoted price is not readily available, market values are estimatedusing quoted market prices of similar securities, or other valuationtechniques.
The book value of financial assets and financial liabilities held forpurposes other than trading may exceed their fair value due prima-rily to changes in interest rates. In such instances, the Bank does not
reduce the book value of these financial assets and financial liabili-ties to their fair value as it is the Bank’s intention to hold them tomaturity.
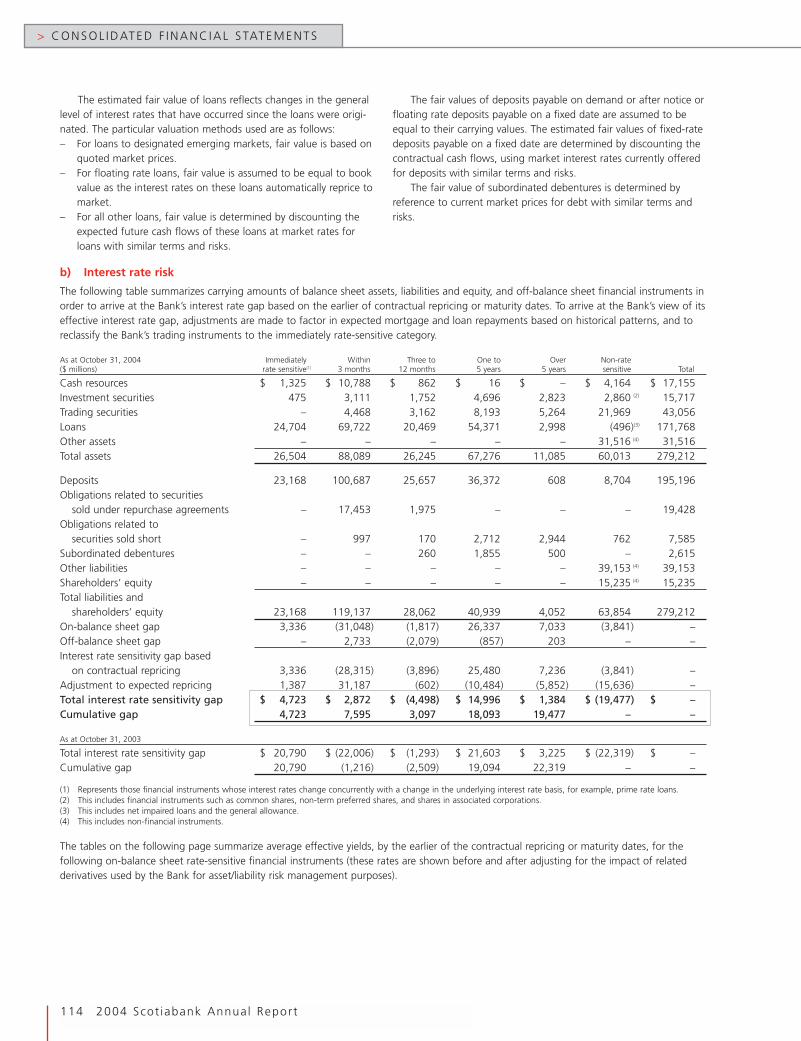
b) Interest rate risk
The following table summarizes carrying amounts of balance sheet assets, liabilities and equity, and off-balance sheet financial instruments inorder to arrive at the Bank’s interest rate gap based on the earlier of contractual repricing or maturity dates. To arrive at the Bank’s view of itseffective interest rate gap, adjustments are made to factor in expected mortgage and loan repayments based on historical patterns, and toreclassify the Bank’s trading instruments to the immediately rate-sensitive category.
As at October 31, 2004 Immediately Within Three to One to Over Non-rate($ millions) rate sensitive(1) 3 months 12 months 5 years 5 years sensitive Total
Cash resources $ 1,325 $ 10,788 $ 862 $ 16 $ – $ 4,164 $ 17,155Investment securities 475 3,111 1,752 4,696 2,823 2,860 (2) 15,717Trading securities – 4,468 3,162 8,193 5,264 21,969 43,056Loans 24,704 69,722 20,469 54,371 2,998 (496)(3) 171,768Other assets – – – – – 31,516 (4) 31,516Total assets 26,504 88,089 26,245 67,276 11,085 60,013 279,212
Deposits 23,168 100,687 25,657 36,372 608 8,704 195,196Obligations related to securities
sold under repurchase agreements – 17,453 1,975 – – – 19,428Obligations related to
securities sold short – 997 170 2,712 2,944 762 7,585Subordinated debentures – – 260 1,855 500 – 2,615Other liabilities – – – – – 39,153 (4) 39,153Shareholders’ equity – – – – – 15,235 (4) 15,235Total liabilities and
shareholders’ equity 23,168 119,137 28,062 40,939 4,052 63,854 279,212On-balance sheet gap 3,336 (31,048) (1,817) 26,337 7,033 (3,841) –Off-balance sheet gap – 2,733 (2,079) (857) 203 – –Interest rate sensitivity gap based
on contractual repricing 3,336 (28,315) (3,896) 25,480 7,236 (3,841) –Adjustment to expected repricing 1,387 31,187 (602) (10,484) (5,852) (15,636) –Total interest rate sensitivity gap $ 4,723 $ 2,872 $ (4,498) $ 14,996 $ 1,384 $ (19,477) $ –Cumulative gap 4,723 7,595 3,097 18,093 19,477 – –
As at October 31, 2003
Total interest rate sensitivity gap $ 20,790 $ (22,006) $ (1,293) $ 21,603 $ 3,225 $ (22,319) $ –Cumulative gap 20,790 (1,216) (2,509) 19,094 22,319 – –
(1) Represents those financial instruments whose interest rates change concurrently with a change in the underlying interest rate basis, for example, prime rate loans.(2) This includes financial instruments such as common shares, non-term preferred shares, and shares in associated corporations.(3) This includes net impaired loans and the general allowance.(4) This includes non-financial instruments.
The tables on the following page summarize average effective yields, by the earlier of the contractual repricing or maturity dates, for thefollowing on-balance sheet rate-sensitive financial instruments (these rates are shown before and after adjusting for the impact of relatedderivatives used by the Bank for asset/liability risk management purposes).
> CONSOL IDATED F INANC IAL STATEMENTS
114 2004 Scot iabank Annual Report
The estimated fair value of loans reflects changes in the generallevel of interest rates that have occurred since the loans were origi-nated. The particular valuation methods used are as follows:– For loans to designated emerging markets, fair value is based on
quoted market prices.– For floating rate loans, fair value is assumed to be equal to book
value as the interest rates on these loans automatically reprice tomarket.
– For all other loans, fair value is determined by discounting theexpected future cash flows of these loans at market rates forloans with similar terms and risks.
The fair values of deposits payable on demand or after notice orfloating rate deposits payable on a fixed date are assumed to beequal to their carrying values. The estimated fair values of fixed-ratedeposits payable on a fixed date are determined by discounting thecontractual cash flows, using market interest rates currently offeredfor deposits with similar terms and risks.
The fair value of subordinated debentures is determined byreference to current market prices for debt with similar terms andrisks.
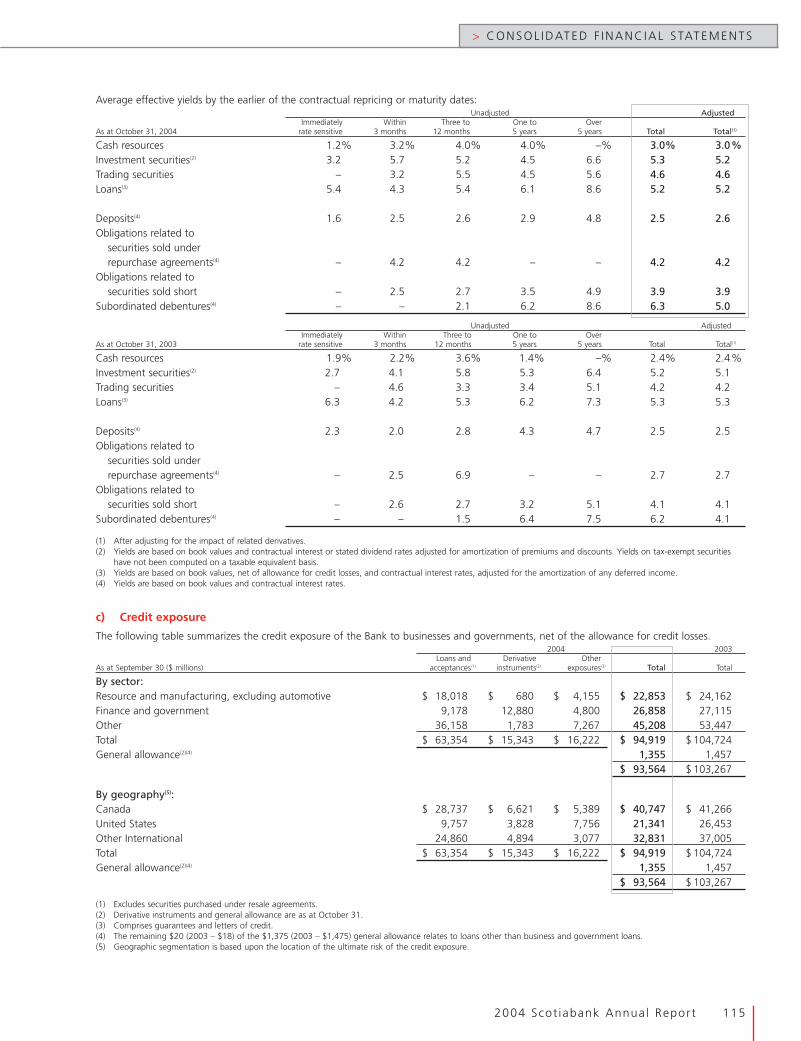
2004 Scot iabank Annual Report 115
> CONSOL IDATED F INANC IAL STATEMENTS
Average effective yields by the earlier of the contractual repricing or maturity dates:Unadjusted Adjusted
Immediately Within Three to One to OverAs at October 31, 2004 rate sensitive 3 months 12 months 5 years 5 years Total Total(1)
Cash resources 1.2% 3.2% 4.0% 4.0% –% 3.0% 3.0%Investment securities(2) 3.2 5.7 5.2 4.5 6.6 5.3 5.2Trading securities – 3.2 5.5 4.5 5.6 4.6 4.6Loans(3) 5.4 4.3 5.4 6.1 8.6 5.2 5.2
Deposits(4) 1.6 2.5 2.6 2.9 4.8 2.5 2.6Obligations related to
securities sold underrepurchase agreements(4) – 4.2 4.2 – – 4.2 4.2
Obligations related tosecurities sold short – 2.5 2.7 3.5 4.9 3.9 3.9
Subordinated debentures(4) – – 2.1 6.2 8.6 6.3 5.0
Unadjusted AdjustedImmediately Within Three to One to Over
As at October 31, 2003 rate sensitive 3 months 12 months 5 years 5 years Total Total(1)
Cash resources 1.9% 2.2% 3.6% 1.4% –% 2.4% 2.4%Investment securities(2) 2.7 4.1 5.8 5.3 6.4 5.2 5.1Trading securities – 4.6 3.3 3.4 5.1 4.2 4.2Loans(3) 6.3 4.2 5.3 6.2 7.3 5.3 5.3
Deposits(4) 2.3 2.0 2.8 4.3 4.7 2.5 2.5Obligations related to
securities sold underrepurchase agreements(4) – 2.5 6.9 – – 2.7 2.7
Obligations related tosecurities sold short – 2.6 2.7 3.2 5.1 4.1 4.1
Subordinated debentures(4) – – 1.5 6.4 7.5 6.2 4.1
(1) After adjusting for the impact of related derivatives.(2) Yields are based on book values and contractual interest or stated dividend rates adjusted for amortization of premiums and discounts. Yields on tax-exempt securities
have not been computed on a taxable equivalent basis.(3) Yields are based on book values, net of allowance for credit losses, and contractual interest rates, adjusted for the amortization of any deferred income.(4) Yields are based on book values and contractual interest rates.
c) Credit exposure
The following table summarizes the credit exposure of the Bank to businesses and governments, net of the allowance for credit losses.2004 2003
Loans and Derivative OtherAs at September 30 ($ millions) acceptances(1) instruments(2) exposures(3) Total Total
By sector:Resource and manufacturing, excluding automotive $ 18,018 $ 680 $ 4,155 $ 22,853 $ 24,162Finance and government 9,178 12,880 4,800 26,858 27,115Other 36,158 1,783 7,267 45,208 53,447Total $ 63,354 $ 15,343 $ 16,222 $ 94,919 $ 104,724General allowance(2)(4) 1,355 1,457
$ 93,564 $ 103,267
By geography(5):Canada $ 28,737 $ 6,621 $ 5,389 $ 40,747 $ 41,266United States 9,757 3,828 7,756 21,341 26,453Other International 24,860 4,894 3,077 32,831 37,005Total $ 63,354 $ 15,343 $ 16,222 $ 94,919 $ 104,724General allowance(2)(4) 1,355 1,457
$ 93,564 $ 103,267
(1) Excludes securities purchased under resale agreements.(2) Derivative instruments and general allowance are as at October 31.(3) Comprises guarantees and letters of credit.(4) The remaining $20 (2003 – $18) of the $1,375 (2003 – $1,475) general allowance relates to loans other than business and government loans.(5) Geographic segmentation is based upon the location of the ultimate risk of the credit exposure.

> CONSOL IDATED F INANC IAL STATEMENTS
116 2004 Scot iabank Annual Report
In its normal course of business, the Bank may decide to hedgeanticipatory transactions such as future foreign revenues and
expenses and planned deposit campaigns. As at October 31, 2004,and 2003, there were no material anticipatory hedges outstanding.
d) Anticipatory hedges
22. Derivative instrumentsa) Notional amounts
The following table provides the aggregate notional amounts of off-balance sheet derivative instruments outstanding by type and segregatedbetween those used by the Bank in its dealer capacity (Trading) and those used in the Bank’s asset/liability risk management process (ALM).The notional amounts of these contracts represent the derivatives volume outstanding and do not represent the potential gain or loss associ-ated with the market risk or credit risk of such instruments. The notional amounts represent the amount to which a rate or price is applied todetermine the amount of cash flows to be exchanged. Other derivative contracts – other includes precious metals other than gold, and basemetal derivatives.
2004 2003As at October 31 ($ millions) Trading ALM Total Trading ALM Total
Interest rate contractsExchange-traded:
Futures $ 45,226 $ 14,744 $ 59,970 $ 53,630 $ 29,335 $ 82,965Options purchased 14,838 – 14,838 15,561 – 15,561Options written 4,454 – 4,454 2,571 129 2,700
64,518 14,744 79,262 71,762 29,464 101,226Over-the-counter:
Forward rate agreements 45,628 14,440 60,068 67,250 23,343 90,593Swaps 388,839 83,436 472,275 410,343 73,739 484,082Options purchased 31,714 4,601 36,315 37,131 1,954 39,085Options written 39,317 914 40,231 46,668 1,387 48,055
505,498 103,391 608,889 561,392 100,423 661,815Total $ 570,016 $118,135 $ 688,151 $ 633,154 $ 129,887 $ 763,041Foreign exchange and gold contractsExchange-traded:
Futures $ 2,964 $ – $ 2,964 $ 2,684 $ – $ 2,684Options purchased 14 – 14 69 – 69Options written 3 – 3 145 – 145
2,981 – 2,981 2,898 – 2,898Over-the-counter:
Spot and forwards 177,699 5,391 183,090 177,165 10,067 187,232Swaps 41,217 11,429 52,646 40,529 11,728 52,257Options purchased 2,896 – 2,896 3,337 – 3,337Options written 2,831 – 2,831 3,018 – 3,018
224,643 16,820 241,463 224,049 21,795 245,844Total $ 227,624 $ 16,820 $ 244,444 $ 226,947 $ 21,795 $ 248,742Other derivative contracts
Equity: over-the-counter $ 20,471 $ 2,770 $ 23,241 $ 17,268 $ 3,330 $ 20,598Credit: over-the-counter 17,875 940 18,815 15,051 2,301 17,352Other 2,583 31 2,614 2,912 – 2,912
Total $ 40,929 $ 3,741 $ 44,670 $ 35,231 $ 5,631 $ 40,862Total notional amounts outstanding $ 838,569 $138,696 $ 977,265 $ 895,332 $ 157,313 $ 1,052,645
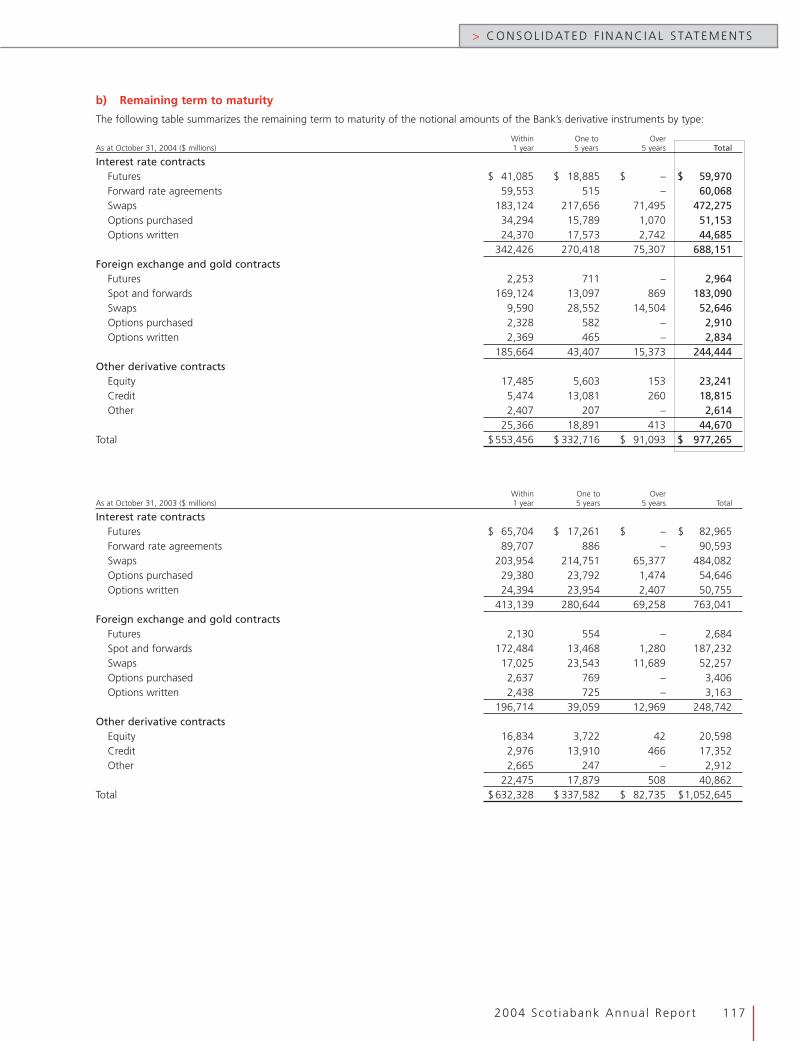
2004 Scot iabank Annual Report 117
> CONSOL IDATED F INANC IAL STATEMENTS
b) Remaining term to maturity
The following table summarizes the remaining term to maturity of the notional amounts of the Bank’s derivative instruments by type:
Within One to OverAs at October 31, 2004 ($ millions) 1 year 5 years 5 years Total
Interest rate contractsFutures $ 41,085 $ 18,885 $ – $ 59,970Forward rate agreements 59,553 515 – 60,068Swaps 183,124 217,656 71,495 472,275Options purchased 34,294 15,789 1,070 51,153Options written 24,370 17,573 2,742 44,685
342,426 270,418 75,307 688,151Foreign exchange and gold contracts
Futures 2,253 711 – 2,964Spot and forwards 169,124 13,097 869 183,090Swaps 9,590 28,552 14,504 52,646Options purchased 2,328 582 – 2,910Options written 2,369 465 – 2,834
185,664 43,407 15,373 244,444Other derivative contracts
Equity 17,485 5,603 153 23,241Credit 5,474 13,081 260 18,815Other 2,407 207 – 2,614
25,366 18,891 413 44,670Total $ 553,456 $ 332,716 $ 91,093 $ 977,265
Within One to OverAs at October 31, 2003 ($ millions) 1 year 5 years 5 years Total
Interest rate contractsFutures $ 65,704 $ 17,261 $ – $ 82,965Forward rate agreements 89,707 886 – 90,593Swaps 203,954 214,751 65,377 484,082Options purchased 29,380 23,792 1,474 54,646Options written 24,394 23,954 2,407 50,755
413,139 280,644 69,258 763,041Foreign exchange and gold contracts
Futures 2,130 554 – 2,684Spot and forwards 172,484 13,468 1,280 187,232Swaps 17,025 23,543 11,689 52,257Options purchased 2,637 769 – 3,406Options written 2,438 725 – 3,163
196,714 39,059 12,969 248,742Other derivative contracts
Equity 16,834 3,722 42 20,598Credit 2,976 13,910 466 17,352Other 2,665 247 – 2,912
22,475 17,879 508 40,862Total $ 632,328 $ 337,582 $ 82,735 $1,052,645

> CONSOL IDATED F INANC IAL STATEMENTS
118 2004 Scot iabank Annual Report
As with on-balance sheet assets, derivative instruments are subjectto credit risk. Credit risk arises from the possibility that counterpar-ties may default on their obligations to the Bank. However, whereasthe credit risk of on-balance sheet assets is represented by the prin-cipal amount net of any applicable allowance for credit losses, thecredit risk associated with derivatives is normally a small fraction ofthe notional amount of the derivative instrument. Derivativecontracts generally expose the Bank to credit loss if changes inmarket rates affect a counterparty’s position unfavourably and thecounterparty defaults on payment. Accordingly, credit risk of deriva-tives is represented by the positive fair value of the instrument.
Negotiated over-the-counter derivatives often present greatercredit exposure than exchange-traded contracts. The net change in
the exchange-traded contracts is normally settled daily in cash withthe exchange. Holders of these contracts look to the exchange forperformance under the contract.
The Bank strives to limit credit risk by dealing with counterpartiesthat it believes are creditworthy, and manages its credit risk for deriv-atives through the same credit risk process applied to on-balancesheet assets.
The Bank pursues opportunities to reduce its exposure to creditlosses on derivative instruments. These opportunities include enteringinto master netting arrangements with counterparties. The credit riskassociated with favourable contracts is eliminated by a masternetting arrangement to the extent that unfavourable contracts withthe same counterparty are not settled before favourable contracts.
c) Credit risk
The following table summarizes the credit exposure of the Bank’s derivatives. The credit risk amount (CRA) represents the estimated replace-ment cost, or positive fair value, for all contracts without taking into account any master netting or collateral arrangements that have beenmade. The CRA does not reflect actual or expected losses.
The credit equivalent amount (CEA) is the CRA plus an add-on for potential future exposure. The add-on amount is based on a formulaprescribed in the Capital Adequacy Guideline of the Superintendent. The risk-weighted balance is the CEA multiplied by counterparty risk factorsprescribed by this Guideline. Other derivative contracts – other includes precious metals other than gold, and base metal derivatives.
2004 2003Credit
Credit risk Potential equivalent Risk- Credit risk Risk-Notional amount future amount weighted amount weightedamount (CRA) exposure (CEA) balance (CRA) balance
As at October 31 ($ millions) (a) (b) (a) + (b)
Interest rate contractsFutures $ 59,970 $ – $ – $ – $ – $ – $ –Forward rate agreements 60,068 31 3 34 13 26 6Swaps 472,275 5,974 1,935 7,909 1,829 7,624 2,179Options purchased 51,153 366 94 460 108 530 167Options written 44,685 – – – – – –
688,151 6,371 2,032 8,403 1,950 8,180 2,352Foreign exchange and gold contracts
Futures 2,964 – – – – – –Spot and forwards 183,090 4,757 2,218 6,975 2,076 4,744 2,065Swaps 52,646 3,437 2,612 6,049 1,644 2,786 1,270Options purchased 2,910 93 52 145 52 126 71Options written 2,834 – – – – – –
244,444 8,287 4,882 13,169 3,772 7,656 3,406Other derivative contracts
Equity 23,241 408 1,420 1,828 564 258 477Credit 18,815 139 880 1,019 289 209 279Other 2,614 138 187 325 118 52 97
44,670 685 2,487 3,172 971 519 853Total derivatives $ 977,265 $ 15,343 $ 9,401 $ 24,744 $ 6,693 $ 16,355 $ 6,611
Less: impact of master nettingagreements 8,039 3,494 11,533 2,745 9,619 3,173
Total $ 7,304 $ 5,907 $ 13,211 $ 3,948 $ 6,736 $ 3,438
Fair values of exchange-traded derivatives are based on quoted marketprices. Fair values of over-the-counter (OTC) derivatives are determinedusing pricing models, which take into account current market andcontractual prices of the underlying instruments, as well as time value
and yield curve or volatility factors underlying the positions.Trading derivatives are subject to a further valuation adjustment,
determined on a portfolio basis, to cover future risks and relatedcosts.
d) Fair value
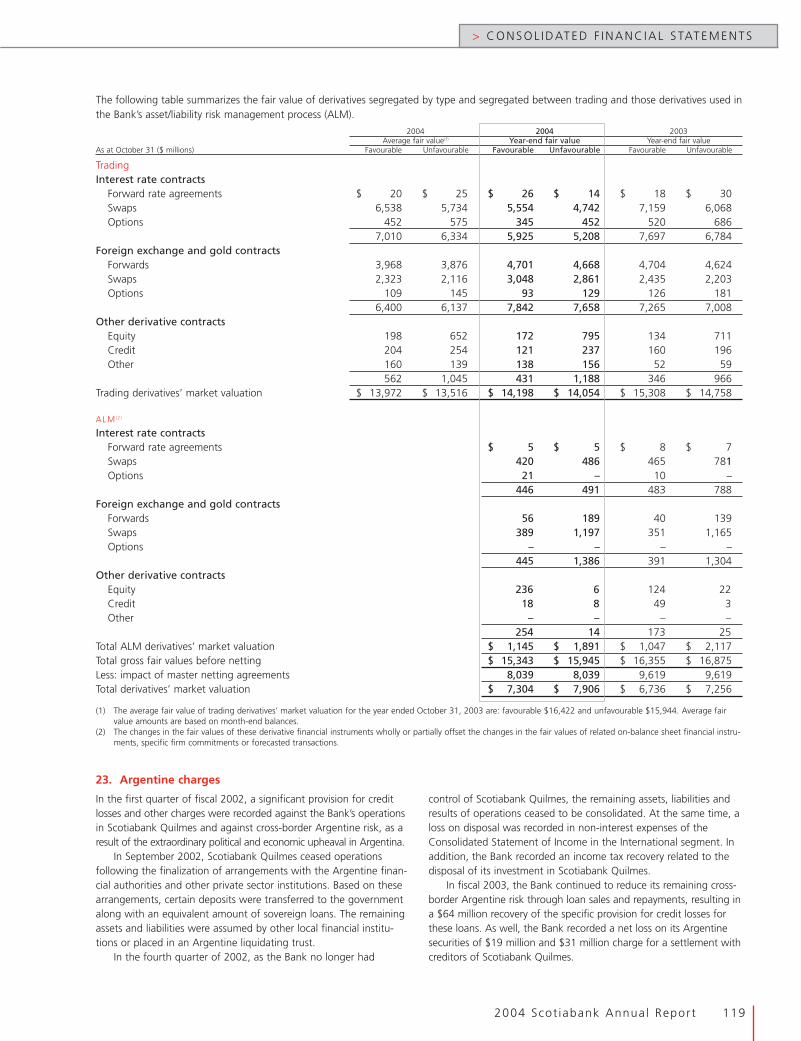
2004 Scot iabank Annual Report 119
> CONSOL IDATED F INANC IAL STATEMENTS
23. Argentine charges
In the first quarter of fiscal 2002, a significant provision for creditlosses and other charges were recorded against the Bank’s operationsin Scotiabank Quilmes and against cross-border Argentine risk, as aresult of the extraordinary political and economic upheaval in Argentina.
In September 2002, Scotiabank Quilmes ceased operationsfollowing the finalization of arrangements with the Argentine finan-cial authorities and other private sector institutions. Based on thesearrangements, certain deposits were transferred to the governmentalong with an equivalent amount of sovereign loans. The remainingassets and liabilities were assumed by other local financial institu-tions or placed in an Argentine liquidating trust.
In the fourth quarter of 2002, as the Bank no longer had
control of Scotiabank Quilmes, the remaining assets, liabilities andresults of operations ceased to be consolidated. At the same time, aloss on disposal was recorded in non-interest expenses of theConsolidated Statement of Income in the International segment. Inaddition, the Bank recorded an income tax recovery related to thedisposal of its investment in Scotiabank Quilmes.
In fiscal 2003, the Bank continued to reduce its remaining cross-border Argentine risk through loan sales and repayments, resulting ina $64 million recovery of the specific provision for credit losses forthese loans. As well, the Bank recorded a net loss on its Argentinesecurities of $19 million and $31 million charge for a settlement withcreditors of Scotiabank Quilmes.
The following table summarizes the fair value of derivatives segregated by type and segregated between trading and those derivatives used inthe Bank’s asset/liability risk management process (ALM).
2004 2004 2003Average fair value(1) Year-end fair value Year-end fair value
As at October 31 ($ millions) Favourable Unfavourable Favourable Unfavourable Favourable Unfavourable
TradingInterest rate contracts
Forward rate agreements $ 20 $ 25 $ 26 $ 14 $ 18 $ 30Swaps 6,538 5,734 5,554 4,742 7,159 6,068Options 452 575 345 452 520 686
7,010 6,334 5,925 5,208 7,697 6,784Foreign exchange and gold contracts
Forwards 3,968 3,876 4,701 4,668 4,704 4,624Swaps 2,323 2,116 3,048 2,861 2,435 2,203Options 109 145 93 129 126 181
6,400 6,137 7,842 7,658 7,265 7,008Other derivative contracts
Equity 198 652 172 795 134 711Credit 204 254 121 237 160 196Other 160 139 138 156 52 59
562 1,045 431 1,188 346 966Trading derivatives’ market valuation $ 13,972 $ 13,516 $ 14,198 $ 14,054 $ 15,308 $ 14,758
ALM (2)
Interest rate contractsForward rate agreements $ 5 $ 5 $ 8 $ 7Swaps 420 486 465 781Options 21 – 10 –
446 491 483 788Foreign exchange and gold contracts
Forwards 56 189 40 139Swaps 389 1,197 351 1,165Options – – – –
445 1,386 391 1,304Other derivative contracts
Equity 236 6 124 22Credit 18 8 49 3Other – – – –
254 14 173 25Total ALM derivatives’ market valuation $ 1,145 $ 1,891 $ 1,047 $ 2,117Total gross fair values before netting $ 15,343 $ 15,945 $ 16,355 $ 16,875Less: impact of master netting agreements 8,039 8,039 9,619 9,619Total derivatives’ market valuation $ 7,304 $ 7,906 $ 6,736 $ 7,256
(1) The average fair value of trading derivatives’ market valuation for the year ended October 31, 2003 are: favourable $16,422 and unfavourable $15,944. Average fairvalue amounts are based on month-end balances.
(2) The changes in the fair values of these derivative financial instruments wholly or partially offset the changes in the fair values of related on-balance sheet financial instru-ments, specific firm commitments or forecasted transactions.
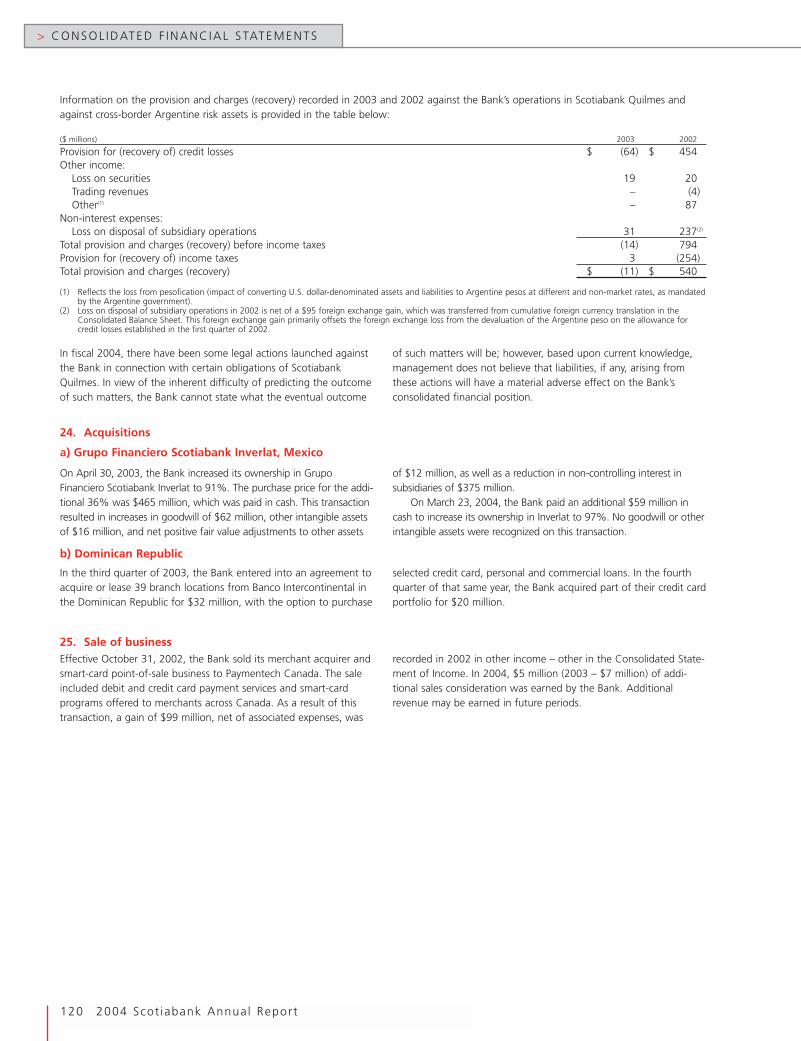
> CONSOL IDATED F INANC IAL STATEMENTS
120 2004 Scot iabank Annual Report
24. Acquisitions
a) Grupo Financiero Scotiabank Inverlat, Mexico
On April 30, 2003, the Bank increased its ownership in GrupoFinanciero Scotiabank Inverlat to 91%. The purchase price for the addi-tional 36% was $465 million, which was paid in cash. This transactionresulted in increases in goodwill of $62 million, other intangible assetsof $16 million, and net positive fair value adjustments to other assets
of $12 million, as well as a reduction in non-controlling interest insubsidiaries of $375 million.
On March 23, 2004, the Bank paid an additional $59 million incash to increase its ownership in Inverlat to 97%. No goodwill or otherintangible assets were recognized on this transaction.
In fiscal 2004, there have been some legal actions launched againstthe Bank in connection with certain obligations of ScotiabankQuilmes. In view of the inherent difficulty of predicting the outcomeof such matters, the Bank cannot state what the eventual outcome
of such matters will be; however, based upon current knowledge,management does not believe that liabilities, if any, arising fromthese actions will have a material adverse effect on the Bank’sconsolidated financial position.
Information on the provision and charges (recovery) recorded in 2003 and 2002 against the Bank’s operations in Scotiabank Quilmes andagainst cross-border Argentine risk assets is provided in the table below:
($ millions) 2003 2002
Provision for (recovery of) credit losses $ (64) $ 454Other income:
Loss on securities 19 20Trading revenues – (4)Other(1) – 87
Non-interest expenses:Loss on disposal of subsidiary operations 31 237(2)
Total provision and charges (recovery) before income taxes (14) 794Provision for (recovery of) income taxes 3 (254)Total provision and charges (recovery) $ (11) $ 540
(1) Reflects the loss from pesofication (impact of converting U.S. dollar-denominated assets and liabilities to Argentine pesos at different and non-market rates, as mandatedby the Argentine government).
(2) Loss on disposal of subsidiary operations in 2002 is net of a $95 foreign exchange gain, which was transferred from cumulative foreign currency translation in theConsolidated Balance Sheet. This foreign exchange gain primarily offsets the foreign exchange loss from the devaluation of the Argentine peso on the allowance forcredit losses established in the first quarter of 2002.
In the third quarter of 2003, the Bank entered into an agreement toacquire or lease 39 branch locations from Banco Intercontinental inthe Dominican Republic for $32 million, with the option to purchase
selected credit card, personal and commercial loans. In the fourthquarter of that same year, the Bank acquired part of their credit cardportfolio for $20 million.
b) Dominican Republic
25. Sale of businessEffective October 31, 2002, the Bank sold its merchant acquirer andsmart-card point-of-sale business to Paymentech Canada. The saleincluded debit and credit card payment services and smart-cardprograms offered to merchants across Canada. As a result of thistransaction, a gain of $99 million, net of associated expenses, was
recorded in 2002 in other income – other in the Consolidated State-ment of Income. In 2004, $5 million (2003 – $7 million) of addi-tional sales consideration was earned by the Bank. Additionalrevenue may be earned in future periods.

2004 Scot iabank Annual Report 121
> CONSOL IDATED F INANC IAL STATEMENTS
Reconciliation of net income and shareholders’ equityNet income Shareholders’ equity
For the year ended October 31($ millions) 2004 2003 2002 2004 2003 2002
Net income and shareholders’ equity basedon Canadian GAAP $ 2,931 $ 2,477 $ 1,797 $ 15,235 $ 14,614 $ 14,777
Employee future benefits (a) 1 31 3 5 (19) (25)Restructuring costs (b) (23) (4) (9) 3 26 30Transfers of loans (c) (21) (32) (55) 26 47 79Derivative instruments and hedging activities (d) 60 248 (347) (32) (88) (253)Unrealized gains (losses) on securities reclassified
as trading (d) 55 7 (24) 17 (21) (28)Conversion of loans into debt securities (e) 39 1 18 (39) (32) 14Available-for-sale securities (e) 81 95 (229) 1,278 925 151Computer software (f) (29) 14 22 81 110 96Non-controlling interest in net income of
subsidiaries (g) (16) (16) (16) (250) (250) (250)Goodwill and other intangibles (h) – – (76) – – –Other 10 (13) – (1) (11) –Tax effect of above differences (42) (74) 203 (462) (298) (13)Future income taxes (k) – 13 (13) – – (13)Net income and shareholders’ equity based
on U.S. GAAP $ 3,046 $ 2,747 $ 1,274 $ 15,861 $ 15,003 $ 14,565
Preferred dividends paid and other (30) (62) (96)Net income available to common shareholders
based on U.S. GAAP $ 3,016 $ 2,685 $ 1,178Earnings per common share based on
U.S. GAAP (in dollars)(1)(2):Basic $ 2.99 $ 2.66 $ 1.17Diluted $ 2.94 $ 2.62 $ 1.15
(1) Amounts have been retroactively adjusted to reflect the stock dividend paid April 28, 2004, of one common share for each issued and outstanding common share. Thestock dividend had the same effect as a two-for-one stock split.
(2) Earnings per share calculations are based on full dollar and share amounts.
(a) Employee future benefitsCanadian and U.S. accounting standards for employee future benefitsare substantially consistent; however, there continues to be a differ-ence in the charge to income between Canadian and U.S. GAAP,principally due to differences in the amortization of the transitionalamounts resulting from differing adoption dates of those standards,and differences in the treatment of the pension valuation allowance.
Canadian GAAP requires recognition of a pension valuationallowance for any excess of the prepaid benefit expense over theexpected future benefit. Changes in the pension valuation allowanceare recognized in the Consolidated Statement of Income. U.S. GAAPdoes not permit recognition of a pension valuation allowance.
U.S. GAAP requires the excess of any unfunded accumulatedbenefit obligation (with certain other adjustments) to be reflectedas an additional minimum pension liability in the U.S. GAAPConsolidated Balance Sheet with an offsetting adjustment tointangible assets to the extent of unrecognized prior service costs,with the remainder recorded in other comprehensive income.
(b) Restructuring costsUnder Canadian GAAP, restructuring costs incurred for activities initi-ated prior to April 1, 2003, were accrued as liabilities provided that arestructuring plan detailing all major actions to be taken had beenapproved by an appropriate level of management, and significant
changes to the plan were not likely. Under U.S. GAAP, for activitiesinitiated prior to January 1, 2003, additional criteria were required tohave been met prior to accrual, including that certain restructuringcosts be incurred within one year from the date of approval of therestructuring plan; the accruals recorded under Canadian GAAP forcertain planned restructuring costs not incurred within the one-yeartime limit are reversed under U.S. GAAP and the costs are expensedas incurred. For restructuring costs incurred for activities initiatedafter March 31, 2003, Canadian and U.S. GAAP are consistent.
(c) Transfers of loans through securitizationsEffective July 1, 2001, the Bank adopted a new Canadianaccounting guideline for transfers of loans on a prospective basis.This guideline is consistent with the U.S. standard for transfers ofloans adopted on April 1, 2001.
Prior to the adoption of the new Canadian guideline, transfers ofloans were treated as sales under Canadian GAAP when the significantrisks and rewards of ownership were transferred. Gains on transfers ofloans were recognized immediately, unless there was recourse to theBank in excess of expected losses, in which case the gains were consid-ered unrealized and deferred until they were collected in cash andthere was no recourse to that cash. Under U.S. GAAP, gains on trans-fers of loans that qualify as sales are recognized in income at the timeof sale. There will continue to be differences in Canadian and U.S.
26. Reconciliation of Canadian and United States generally accepted accounting principles (GAAP)The consolidated financial statements of the Bank have beenprepared in accordance with Canadian GAAP. The significant
measurement differences between Canadian and U.S. GAAPaffecting the consolidated financial statements are as follows:
> CONSOL IDATED F INANC IAL STATEMENTS
122 2004 Scot iabank Annual Report
GAAP income until the deferred gains related to assets securitized priorto July 1, 2001 have all been recognized in Canadian GAAP income.
Prior to the harmonization of Canadian and U.S. GAAP, sometransfers of assets did not qualify for sale accounting under U.S.GAAP. These transfers have been accounted for as secured lendingarrangements under U.S. GAAP. This results in the assets remainingon the U.S. GAAP Consolidated Balance Sheet and in the net spreadbeing recognized in U.S. GAAP income over the term of the loansrather than immediate recognition of a gain.
(d) Derivative instruments and hedging activitiesUnder Canadian GAAP, the Bank accounts for derivative instrumentsheld for asset/liability management purposes on an accrual basis ifthey qualify for hedge accounting. Derivative instruments held forasset/liability management purposes which do not meet hedgeaccounting criteria and those held for trading purposes are accountedfor at fair value with changes in fair value recognized in income.
The Bank adopted a new U.S. accounting standard on accountingfor derivative instruments and hedging activities effective November 1,2000. This standard requires all derivative instruments to be recognizedat fair value in the Consolidated Balance Sheet. U.S. GAAP restricts thetypes of transactions that qualify for hedge accounting and containsguidance on measuring hedge effectiveness. The change in fair value ofa derivative instrument designated as a fair value hedge is offset in U.S.GAAP income against the change in the fair value of the hedged itemrelating to the hedged risk. The change in fair value of a derivativeinstrument designated as a cash flow hedge is recorded in othercomprehensive income until the revenues or expenses relating to thehedged item are recorded in income. Hedge ineffectiveness andchanges in the fair value of derivative instruments that do not qualify ashedges are recognized in income as they arise. The Bank has recordedan after-tax loss of $17 million (2003 – after-tax loss of $19 million;2002 – after-tax loss of $7 million), which represents the ineffectiveportion of fair value hedges. Prior to 2004, certain foreign currencyfunding transactions that were designated as hedges for CanadianGAAP did not meet the strict U.S. GAAP hedge criteria. Therefore, thechange in the fair value of these transactions has been recognized inU.S. GAAP income.
U.S. GAAP also requires derivative instruments embedded in finan-cial instruments that are not clearly and closely related to their hostinstrument to be separated and recorded at their fair value. If anembedded derivative cannot be separated, the entire financial instru-ment is recorded at fair value. Certain securities with embedded deriva-tives were reclassified from available-for-sale to trading securities. UnderCanadian GAAP, these securities are classified as investment securities.
The Bank has fair value hedges of interest rate risk relating to itssubordinated debentures and available-for-sale securities in additionto cash flow hedges of its variable rate instruments. The Bankexpects to reclassify $10 million (2003 – $(11) million; 2002 –$(17) million) of after-tax gains/(losses) from accumulated othercomprehensive income to earnings as a result of its cash flow hedgeswithin the next twelve months. As at October 31, 2004, 2003 and2002, the maximum term of cash flow hedges was less than 10years, 10 years and 5 years, respectively.
On November 21, 2002, the Bank adopted new U.S. GAAP guid-ance on accounting for derivative contracts held for trading purposes.Under the new guidance, the unrealized gain or loss arising at theinception of a derivative transaction is recognized in U.S. GAAP incomeonly when the fair value of the derivative is obtained from a quotedmarket price, supported by comparison to other observable markettransactions, or based upon a valuation technique incorporatingobservable market data. The adoption of the new guidance did nothave a material impact on the U.S. GAAP results of the Bank.
(e) SecuritiesU.S. GAAP requires securities to be classified as either trading, held tomaturity or available for sale. The Bank has classified all investmentsecurities as available for sale under U.S. GAAP (other than thosereclassified to trading on adoption of the U.S. accounting standard onderivative instruments and hedging activities as discussed in (d) above),which are carried on the Consolidated Balance Sheet at their fair value.Other-than-temporary declines in the fair value of available-for-salesecurities are recognized in U.S. GAAP income based on market values;declines in fair values are generally presumed to be other than tempo-rary if they have persisted over several quarters. Both investment securi-ties and trading securities are required to be accounted for on a tradedate basis in the Consolidated Statement of Income and ConsolidatedBalance Sheet.
Under U.S. GAAP, unrealized gains and losses on available-for-sale securities, net of related income taxes, are recorded in othercomprehensive income until realized, except for the unrealized gainsand losses on hedged available-for-sale securities, which are recordedin U.S. GAAP income.
Under Canadian GAAP, securities are classified as either tradingor investment. The Bank carries investment securities at amortizedcost. Other-than-temporary declines in the value of investment secu-rities are recorded in income based on net realizable values; declinesin fair values are generally presumed to be other than temporary ifconditions indicating impairment have persisted for a moreprolonged period of time than under U.S. GAAP. Investment securi-ties and trading securities are accounted for on a settlement datebasis in the Consolidated Balance Sheet and on a trade date basis inthe Consolidated Statement of Income.
Under Canadian GAAP, debt securities acquired in a loan restruc-turing prior to May 1, 2003 were recorded at net book value. UnderU.S. GAAP, the debt securities are recorded at their fair value withthe difference between the carrying value of the loans and the fairvalue of the debt securities acquired recorded in income. For debtsecurities acquired in a loan restructuring after April 30, 2003, Cana-dian and U.S. GAAP are consistent.
(f) Computer softwareU.S. GAAP requires qualifying software costs to be capitalized anddepreciated over the useful life of the software. Prior to November 1,2003, these costs were expensed as incurred under Canadian GAAP.For software costs incurred after November 1, 2003, Canadian andU.S. GAAP are consistent.
(g) Non-controlling interest in net income of subsidiariesOn the U.S. GAAP Consolidated Balance Sheet, the preferred sharesissued by Scotia Mortgage Investment Corporation, a wholly-ownedsubsidiary of the Bank, are presented as non-controlling interests.The net income applicable to these non-controlling interests isreflected as a reduction of U.S. GAAP income. Under CanadianGAAP, the Bank includes these preferred shares within the totalpreferred shares of the Bank in the Consolidated Balance Sheet andthe related dividends are reflected as a reduction of net incomeavailable to common shareholders.
(h) Goodwill and other intangible assetsEffective November 1, 2001, the Bank adopted the new Canadianand U.S. accounting standards for goodwill and other intangibleassets without restatement of prior periods. These standards aresubstantially consistent except that any transitional impairmentcharge on the date of adoption is recognized as a charge toopening retained earnings under Canadian GAAP and as a cumula-tive adjustment to income under U.S. GAAP. On adoption of thenew standard, a charge to U.S. GAAP income of $76 million wasrecognized ($0.07 per share, basic and diluted).

2004 Scot iabank Annual Report 123
> CONSOL IDATED F INANC IAL STATEMENTS
(i) GuaranteesEffective February 2003, the Bank adopted a Canadian guideline ondisclosure of guarantees, as set out in Note 20. The U.S. standard isconsistent with this Canadian guideline, except that it also requiresrecognition of a liability for the fair value of the obligation assumed atthe inception of the arrangement for guarantees issued or modifiedafter December 31, 2002.
The fair value under U.S. GAAP for guarantees at October 31, 2004amounted to $93 million (2003 – $78 million). This amount excludesderivative instruments meeting the definition of guarantees, the fairvalues of which are included in the amounts disclosed in Note 22.
(j) Variable interest entities (VIEs)In January 2003, a new U.S. standard on the accounting for VIEs wasissued and revised in December 2003. This standard is substantiallyconsistent with the new Canadian guideline. Under U.S. GAAP, VIEscreated after January 31, 2003 are required to be consolidated wherethe Bank is the primary beneficiary; there is no material measurementdifference between Canadian and U.S. GAAP affecting the consoli-dated financial statements as a result of this requirement. For theremaining VIEs, the accounting on a U.S. GAAP basis is effectiveOctober 31, 2004. The impact on the Consolidated Balance Sheet ofadopting this U.S. GAAP standard is the same as the expected impactunder Canadian GAAP disclosed in Note 2. Under Canadian GAAP,VIEs are required to be consolidated effective November 1, 2004.
(k) Corporate income taxesCanadian and U.S. accounting standards for corporate income taxes aresubstantially consistent, except that the effect of changes in income tax
rates are recorded under U.S. GAAP when the rate changes are enactedin law, whereas under Canadian GAAP such amounts are recordedwhen the changes are considered to be substantively enacted.
(l) Non-cash collateralUnder Canadian GAAP, non-cash collateral received as part of secu-rities lending transactions is not recognized in the ConsolidatedBalance Sheet. Under U.S. GAAP, collateral received for transactionswhere the Bank lends securities as principal is accounted for as asecured borrowing in the Consolidated Balance Sheet.
(m) Comprehensive incomeU.S. GAAP requires a statement of comprehensive income to beincluded in the financial statements. Comprehensive incomeincludes net income and all changes in equity, net of taxes, for theperiod except those resulting from investments by and distributionsto shareholders. Comprehensive income also includes the foreigncurrency translation adjustments arising from the consolidation ofsubsidiaries where the functional currency is other than thereporting currency. Under Canadian GAAP, there is no currentrequirement to present a statement of comprehensive income andthe foreign currency translation adjustments pertaining to netinvestments in foreign subsidiaries are presented in cumulativeforeign currency translation in the Consolidated Balance Sheet.
Consolidated statement of comprehensive incomeFor the year ended October 31 ($ millions) 2004 2003 2002
Net income based on U.S. GAAP $ 3,046 $ 2,747 $ 1,274Other comprehensive income, net of income taxes:
Change in unrealized gains and losses on available-for-sale securities, net of hedging activities(1) 101 434 (229)Change in unrealized foreign currency translation gains and losses(2) (705) (1,295) (137)(3)
Change in gains and losses on derivative instruments designated as cash flow hedges(4) (8) 24 28Change in additional minimum pension liability(5) 16 (17) (11)
Total other comprehensive income $ (596) $ (854) $ (349)Total comprehensive income $ 2,450 $ 1,893 $ 925
Accumulated other comprehensive incomeFor the year ended October 31 ($ millions) 2004 2003 2002
Unrealized gains and losses on available-for-sale securities, net of hedging activities $ 1,071 $ 970 $ 536Unrealized foreign currency translation gains and losses (1,897) (1,192) 103Derivative instruments (26) (18) (42)Additional minimum pension liability (12) (28) (11)Total accumulated other comprehensive income $ (864) $ (268) $ 586
(1) Net of income tax expense of $115 (2003 – expense of $199; 2002 – benefit of $121).(2) Net of income tax benefit of $1 (2003 – expense of $25; 2002 – expense of $5).(3) Refer to footnotes (2) and (3) of the Consolidated Statement of Changes in Shareholders’ Equity.(4) Net of income tax expense of $1 (2003 – expense of $13; 2002 – expense of $20).(5) Net of income tax expense of $7 (2003 – benefit of $8; 2002 – benefit of $5).
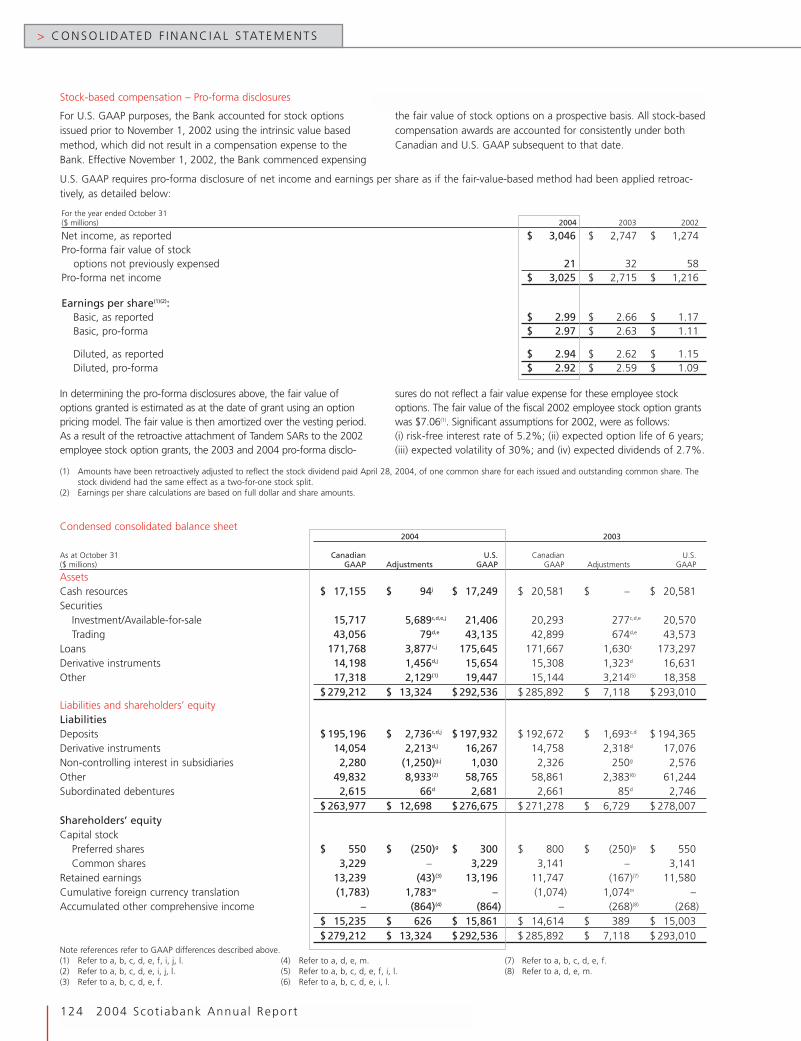
> CONSOL IDATED F INANC IAL STATEMENTS
124 2004 Scot iabank Annual Report
Stock-based compensation – Pro-forma disclosures
For U.S. GAAP purposes, the Bank accounted for stock optionsissued prior to November 1, 2002 using the intrinsic value basedmethod, which did not result in a compensation expense to theBank. Effective November 1, 2002, the Bank commenced expensing
the fair value of stock options on a prospective basis. All stock-basedcompensation awards are accounted for consistently under bothCanadian and U.S. GAAP subsequent to that date.
U.S. GAAP requires pro-forma disclosure of net income and earnings per share as if the fair-value-based method had been applied retroac-tively, as detailed below:
In determining the pro-forma disclosures above, the fair value ofoptions granted is estimated as at the date of grant using an optionpricing model. The fair value is then amortized over the vesting period.As a result of the retroactive attachment of Tandem SARs to the 2002employee stock option grants, the 2003 and 2004 pro-forma disclo-
sures do not reflect a fair value expense for these employee stockoptions. The fair value of the fiscal 2002 employee stock option grantswas $7.06(1). Significant assumptions for 2002, were as follows:(i) risk-free interest rate of 5.2%; (ii) expected option life of 6 years;(iii) expected volatility of 30%; and (iv) expected dividends of 2.7%.
For the year ended October 31($ millions) 2004 2003 2002
Net income, as reported $ 3,046 $ 2,747 $ 1,274Pro-forma fair value of stock
options not previously expensed 21 32 58Pro-forma net income $ 3,025 $ 2,715 $ 1,216
Earnings per share(1)(2):Basic, as reported $ 2.99 $ 2.66 $ 1.17Basic, pro-forma $ 2.97 $ 2.63 $ 1.11
Diluted, as reported $ 2.94 $ 2.62 $ 1.15Diluted, pro-forma $ 2.92 $ 2.59 $ 1.09
(1) Amounts have been retroactively adjusted to reflect the stock dividend paid April 28, 2004, of one common share for each issued and outstanding common share. Thestock dividend had the same effect as a two-for-one stock split.
(2) Earnings per share calculations are based on full dollar and share amounts.
Condensed consolidated balance sheet2004 2003
As at October 31 Canadian U.S. Canadian U.S.($ millions) GAAP Adjustments GAAP GAAP Adjustments GAAP
AssetsCash resources $ 17,155 $ 94j $ 17,249 $ 20,581 $ – $ 20,581Securities
Investment/Available-for-sale 15,717 5,689c,d,e,j 21,406 20,293 277c,d,e 20,570Trading 43,056 79d,e 43,135 42,899 674d,e 43,573
Loans 171,768 3,877c,j 175,645 171,667 1,630c 173,297Derivative instruments 14,198 1,456d,j 15,654 15,308 1,323d 16,631Other 17,318 2,129(1) 19,447 15,144 3,214(5) 18,358
$ 279,212 $ 13,324 $ 292,536 $ 285,892 $ 7,118 $ 293,010Liabilities and shareholders’ equityLiabilitiesDeposits $ 195,196 $ 2,736c,d,j $ 197,932 $ 192,672 $ 1,693c,d $ 194,365Derivative instruments 14,054 2,213d,j 16,267 14,758 2,318d 17,076Non-controlling interest in subsidiaries 2,280 (1,250)g,j 1,030 2,326 250g 2,576Other 49,832 8,933(2) 58,765 58,861 2,383(6) 61,244Subordinated debentures 2,615 66d 2,681 2,661 85d 2,746
$ 263,977 $ 12,698 $ 276,675 $ 271,278 $ 6,729 $ 278,007Shareholders’ equityCapital stock
Preferred shares $ 550 $ (250)g $ 300 $ 800 $ (250)g $ 550Common shares 3,229 – 3,229 3,141 – 3,141
Retained earnings 13,239 (43)(3) 13,196 11,747 (167)(7) 11,580Cumulative foreign currency translation (1,783) 1,783m – (1,074) 1,074m –Accumulated other comprehensive income – (864)(4) (864) – (268)(8) (268)
$ 15,235 $ 626 $ 15,861 $ 14,614 $ 389 $ 15,003$ 279,212 $ 13,324 $ 292,536 $ 285,892 $ 7,118 $ 293,010
Note references refer to GAAP differences described above.(1) Refer to a, b, c, d, e, f, i, j, l. (4) Refer to a, d, e, m. (7) Refer to a, b, c, d, e, f.(2) Refer to a, b, c, d, e, i, j, l. (5) Refer to a, b, c, d, e, f, i, l. (8) Refer to a, d, e, m.(3) Refer to a, b, c, d, e, f. (6) Refer to a, b, c, d, e, i, l.
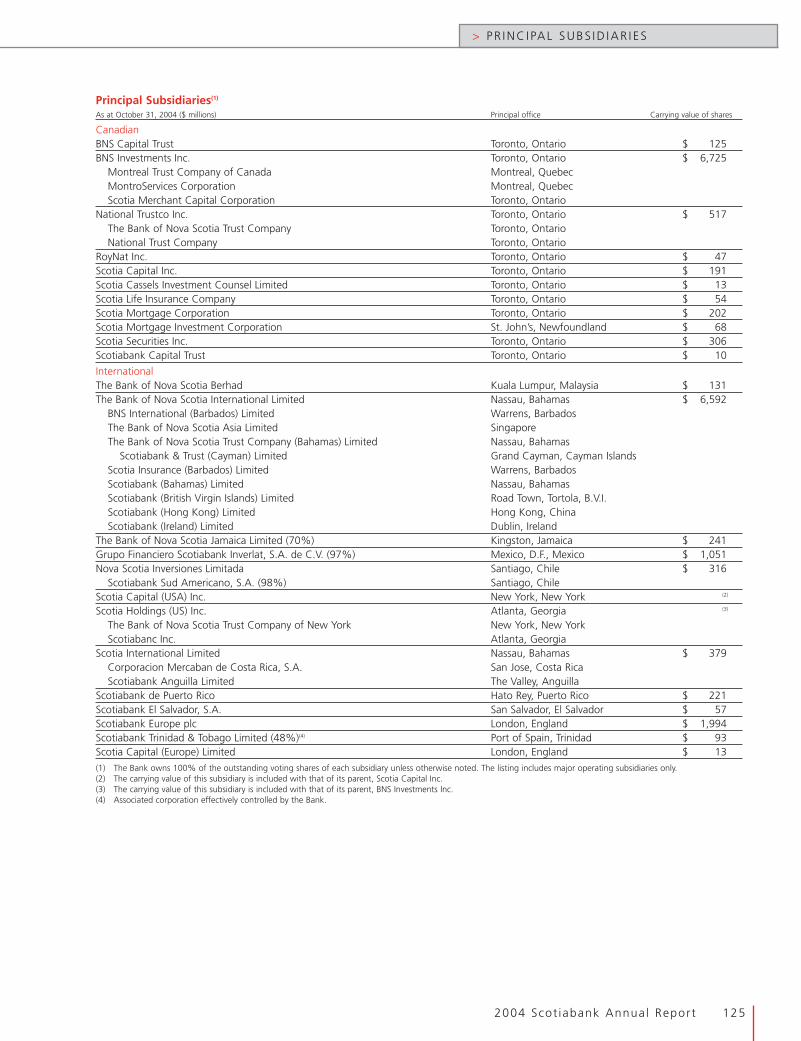
2004 Scot iabank Annual Report 125
> PR INC I PAL SUBS ID IAR I ES
Principal Subsidiaries(1)
As at October 31, 2004 ($ millions) Principal office Carrying value of shares
CanadianBNS Capital Trust Toronto, Ontario $ 125BNS Investments Inc. Toronto, Ontario $ 6,725
Montreal Trust Company of Canada Montreal, QuebecMontroServices Corporation Montreal, QuebecScotia Merchant Capital Corporation Toronto, Ontario
National Trustco Inc. Toronto, Ontario $ 517The Bank of Nova Scotia Trust Company Toronto, OntarioNational Trust Company Toronto, Ontario
RoyNat Inc. Toronto, Ontario $ 47Scotia Capital Inc. Toronto, Ontario $ 191Scotia Cassels Investment Counsel Limited Toronto, Ontario $ 13Scotia Life Insurance Company Toronto, Ontario $ 54Scotia Mortgage Corporation Toronto, Ontario $ 202Scotia Mortgage Investment Corporation St. John’s, Newfoundland $ 68Scotia Securities Inc. Toronto, Ontario $ 306Scotiabank Capital Trust Toronto, Ontario $ 10
InternationalThe Bank of Nova Scotia Berhad Kuala Lumpur, Malaysia $ 131The Bank of Nova Scotia International Limited Nassau, Bahamas $ 6,592
BNS International (Barbados) Limited Warrens, BarbadosThe Bank of Nova Scotia Asia Limited SingaporeThe Bank of Nova Scotia Trust Company (Bahamas) Limited Nassau, Bahamas
Scotiabank & Trust (Cayman) Limited Grand Cayman, Cayman IslandsScotia Insurance (Barbados) Limited Warrens, BarbadosScotiabank (Bahamas) Limited Nassau, BahamasScotiabank (British Virgin Islands) Limited Road Town, Tortola, B.V.I.Scotiabank (Hong Kong) Limited Hong Kong, ChinaScotiabank (Ireland) Limited Dublin, Ireland
The Bank of Nova Scotia Jamaica Limited (70%) Kingston, Jamaica $ 241Grupo Financiero Scotiabank Inverlat, S.A. de C.V. (97%) Mexico, D.F., Mexico $ 1,051Nova Scotia Inversiones Limitada Santiago, Chile $ 316
Scotiabank Sud Americano, S.A. (98%) Santiago, ChileScotia Capital (USA) Inc. New York, New York (2)
Scotia Holdings (US) Inc. Atlanta, Georgia (3)
The Bank of Nova Scotia Trust Company of New York New York, New YorkScotiabanc Inc. Atlanta, Georgia
Scotia International Limited Nassau, Bahamas $ 379Corporacion Mercaban de Costa Rica, S.A. San Jose, Costa RicaScotiabank Anguilla Limited The Valley, Anguilla
Scotiabank de Puerto Rico Hato Rey, Puerto Rico $ 221Scotiabank El Salvador, S.A. San Salvador, El Salvador $ 57Scotiabank Europe plc London, England $ 1,994Scotiabank Trinidad & Tobago Limited (48%)(4) Port of Spain, Trinidad $ 93Scotia Capital (Europe) Limited London, England $ 13(1) The Bank owns 100% of the outstanding voting shares of each subsidiary unless otherwise noted. The listing includes major operating subsidiaries only.(2) The carrying value of this subsidiary is included with that of its parent, Scotia Capital Inc.(3) The carrying value of this subsidiary is included with that of its parent, BNS Investments Inc.(4) Associated corporation effectively controlled by the Bank.

Annual MeetingShareholders are invited to attend the 173rd Annual Meetingof Holders of Common Shares, to be held on March 1, 2005,at the World Trade and Convention Centre, Port Royal Room,1800 Argyle Street, Halifax, Nova Scotia, Canada, beginningat 10:00 a.m. (Atlantic Time).
Shareholdings and DividendsInformation regarding your shareholdings and dividends maybe obtained by contacting the Transfer Agent.
Direct Deposit ServiceShareholders may have dividends deposited directly intoaccounts held at financial institutions which are members ofthe Canadian Payments Association. To arrange direct depositservice, please write to the Transfer Agent.
Dividend and Share Purchase PlanScotiabank’s dividend reinvestment and share purchase planallows common and preferred shareholders to purchase addi-tional common shares by reinvesting their cash dividendwithout incurring brokerage or administrative fees.
As well, eligible shareholders may invest up to $20,000each fiscal year to purchase additional common shares of theBank. Debenture holders may apply interest on fully registeredBank subordinated debentures to purchase additional commonshares. All administrative costs of the plan are paid by the Bank.
For more information on participation in the plan, pleasecontact the Transfer Agent.
Listing of SharesCommon shares of the Bank are listed for trading on theToronto and New York stock exchanges.
Series 12 preferred shares of the Bank are listed on theToronto Stock Exchange.
Stock Symbols
STOCK TICKER SYMBOL CUSIP NO.
Common shares BNS 064149 10 7
Series 12, Preferred BNS.PR.J 064149 81 8
Dividend Dates for 2005Record and payment dates for common and preferred shares,subject to approval by the Board of Directors.
RECORD DATE PAYMENT DATE
January 4 January 27
April 5 April 27
July 5 July 27
October 4 October 27
Quarterly Earnings ReportingFor 2005, Scotiabank’s quarterly earnings are anticipated to beannounced March 1, May 31, August 30 and November 29.
Future Annual MeetingThe Annual Meeting for the year 2006 is scheduled forTuesday, February 28, in Winnipeg, Manitoba, at 10:00 a.m.(Central Time).
Valuation Day PriceFor Canadian income tax purposes, The Bank of Nova Scotia’scommon stock was quoted at $31.13 per share on ValuationDay, December 22, 1971. This is equivalent to $1.297 afteradjustment for the two-for-one stock split in 1976, the three-for-one stock split in 1984, the two-for-one stock split in 1998,and the stock dividend (with the effect of a two-for-one stocksplit) in 2004.
Duplicated CommunicationSome registered holders of The Bank of Nova Scotia sharesmight receive more than one copy of shareholder mailings,such as this annual report. Every effort is made to avoidduplication; however, if you are registered with differentnames and/or addresses, multiple mailings may result.
If you receive, but do not require, more than one mailingfor the same ownership, please contact the Transfer Agent tocombine the accounts.
Credit Ratings
SENIOR LONG-TERM DEBT/DEPOSITS
DBRS AA(low)
FITCH AA-
Moody’s Aa3
Standard & Poor’s AA-
SHORT TERM DEPOSITS/COMMERCIAL PAPER
DBRS R-1(middle)
FITCH F1+
Moody’s P-1
Standard & Poor’s A-1+
SUBORDINATED DEBT
DBRS A(high)
Moody’s A1
Standard & Poor’s A+
NON-CUMULATIVE PREFERRED SHARES
DBRS Pfd-1(low)n
> SHAREHOLDER INFORMAT ION
126 2004 Scot iabank Annual Report


Corporate HeadquartersScotiabankScotia Plaza44 King Street WestToronto, OntarioCanada M5H 1H1Tel: (416) 866-6161Fax: (416) 866-3750E-mail: [email protected]
Shareholder ServicesTRANSFER AGENT AND REGISTRARMAIN AGENT
Computershare Trust Company of Canada100 University Avenue, 9th FloorToronto, OntarioCanada M5J 2Y1Tel: 1-877-982-8767Fax: 1-888-453-0330E-mail: [email protected]
CO-TRANSFER AGENT (U.S.A.)
Computershare Trust Company, Inc.350 Indiana StreetGolden, Colorado 80401U.S.A.Tel: 1-800-962-4284
SECRETARY’S DEPARTMENT
Scotiabank44 King Street WestToronto, OntarioCanada M5H 1H1Tel: (416) 866-4790Fax: (416) 866-4048E-mail: [email protected]
FINANCIAL ANALYSTS, PORTFOLIO MANAGERS AND
OTHER INSTITUTIONAL INVESTORS
Tel: (416) 866-5982Fax: (416) 866-7867E-mail: [email protected]
For further information
PUBLIC, CORPORATE AND GOVERNMENT AFFAIRS
Scotiabank44 King Street WestToronto, OntarioCanada M5H 1H1Tel: (416) 866-3925Fax: (416) 866-4988E-mail: [email protected]
CUSTOMER SERVICE CENTRE
1-800-4-SCOTIA
OnlineFor product, corporate, financial andshareholder information:www.scotiabank.com andwww.scotiacapital.com
The paper manufacturer follows the Sustainable Forestry Initiative® (SFITM) programfor the harvesting of its forests. SFITM is an exacting standard of environmentalprinciples, objectives and performance measures that integrates the perpetualgrowing and harvesting of trees with the protection of wildlife, plants, soil andwater quality and a wide range of other conservation goals. www.aboutsfi.org
The SFI logo and SFITM are trademarks of the American Forest & Paper Association. SustainableForestry Initiative® is a registered trademark of the American Forest & Paper Association.
™ Trademark of The Bank of Nova Scotia.