2 test of independence. hypothesis tests categorical data
TRANSCRIPT

2 Test of Independence2 Test of Independence

Hypothesis Tests Categorical DataHypothesis Tests Categorical Data
CategoricalData
Z TestZ Test
(Indep.)2 Test(Indep.)
Proportion Independence1 pop.
2 Test
2 or morepop.
2 pop.
CategoricalData
Z TestZ Test
(Indep.)2 Test(Indep.)
Proportion Independence1 pop.
2 Test
2 or morepop.
2 pop.

2 Test of Independence2 Test of Independence
• Shows if a relationship exists between 2 categorical variables– One sample is drawn– Does not show nature of relationship– Does not show causality
• Similar to testing p1 = p2 = … = pc
• Used widely in marketing • Uses contingency (XTAB) table

House LocationHouse Style Urban Rural Total
Split-Level 63 49 112Ranch 15 33 48
Total 78 82 160
House LocationHouse Style Urban Rural Total
Split-Level 63 49 112Ranch 15 33 48
Total 78 82 160
2 Test of Independence Contingency Table
2 Test of Independence Contingency Table
• Shows # observations from 1 sample jointly in 2 categorical variables
Levels of variable 2Levels of variable 2
Levels of variable 1Levels of variable 1

2 Test of Independence Hypotheses & Statistic
2 Test of Independence Hypotheses & Statistic
• Hypotheses– H0: Variables are independent
– H1: Variables are related (dependent)

2 Test of Independence Hypotheses & Statistic
2 Test of Independence Hypotheses & Statistic
• Hypotheses– H0: Variables are independent
– H1: Variables are related (dependent)
• Test statistic
cells all
22
e
eo
f
ff
cells all
22
e
eo
f
ff
Observed frequencyObserved frequency
Expected frequencyExpected frequency

2 Test of Independence Hypotheses & Statistic
2 Test of Independence Hypotheses & Statistic
• Hypotheses– H0: Variables are independent
– H1: Variables are related (dependent)
• Test statistic
• Degrees of freedom: (r - 1)(c - 1)
cells all
22
e
eo
f
ff
cells all
22
e
eo
f
ff
Observed frequencyObserved frequency
Expected frequencyExpected frequency
RowsRows Columns Columns
2 Test of Independence Expected Frequencies
2 Test of Independence Expected Frequencies
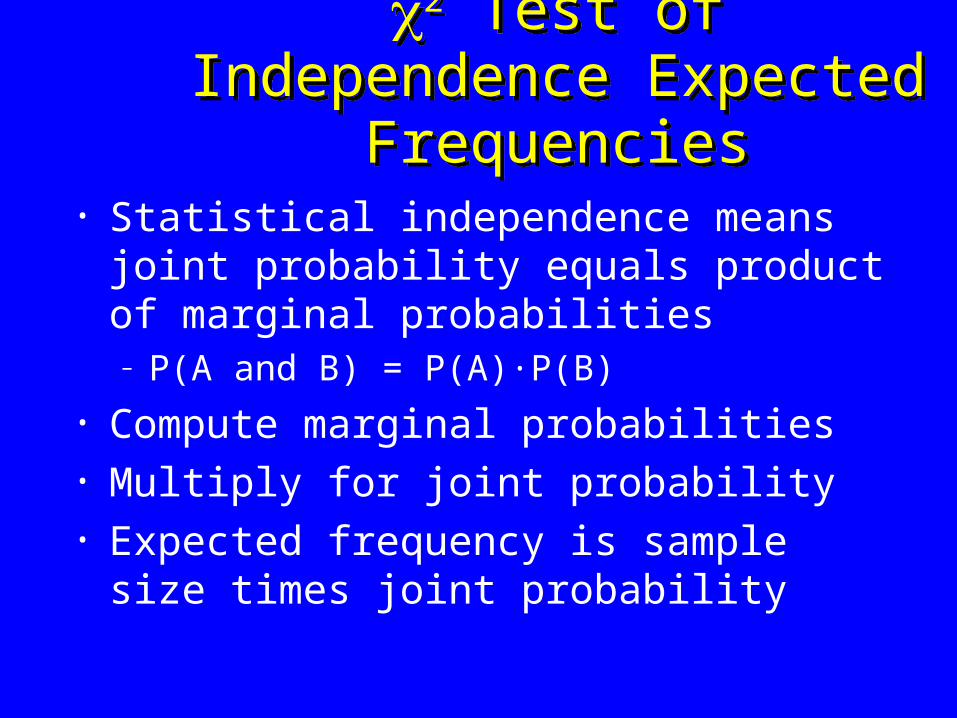
• Statistical independence means joint probability equals product of marginal probabilities– P(A and B) = P(A)·P(B)
• Compute marginal probabilities• Multiply for joint probability• Expected frequency is sample size times joint
probability
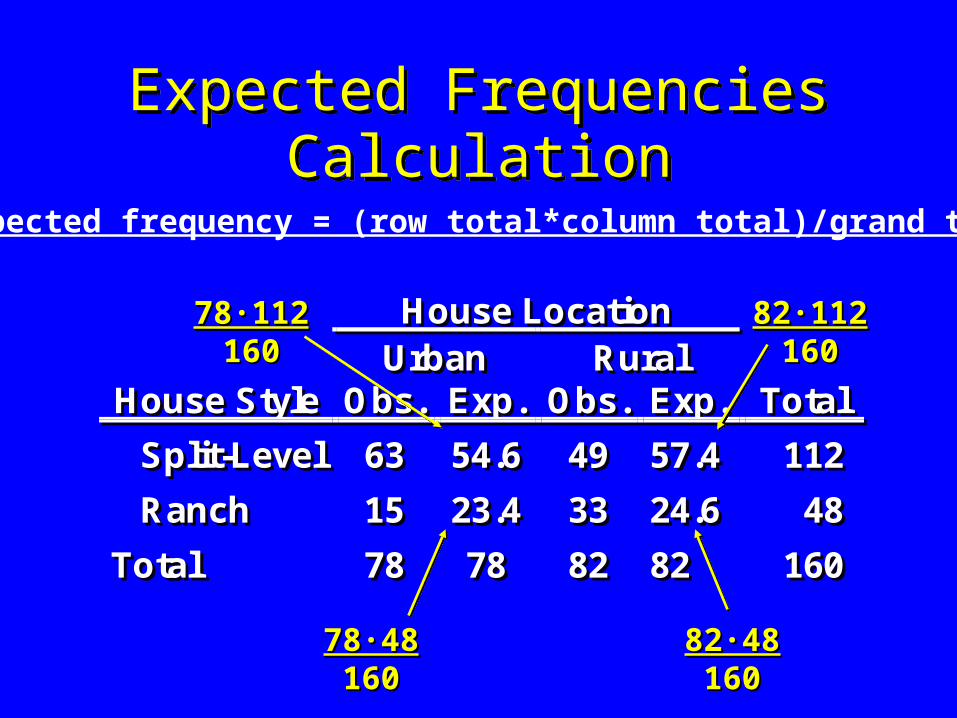
House LocationUrban Rural
House Style Obs. Exp. Obs. Exp. Total
Split-Level 63 54.6 49 57.4 112
Ranch 15 23.4 33 24.6 48
Total 78 78 82 82 160
House LocationUrban Rural
House Style Obs. Exp. Obs. Exp. Total
Split-Level 63 54.6 49 57.4 112
Ranch 15 23.4 33 24.6 48
Total 78 78 82 82 160
Expected Frequencies Calculation
Expected Frequencies Calculation
82·11282·112160160
78·4878·48160160
82·4882·48160160
78·11278·112160160
Expected frequency = (row total*column total)/grand total
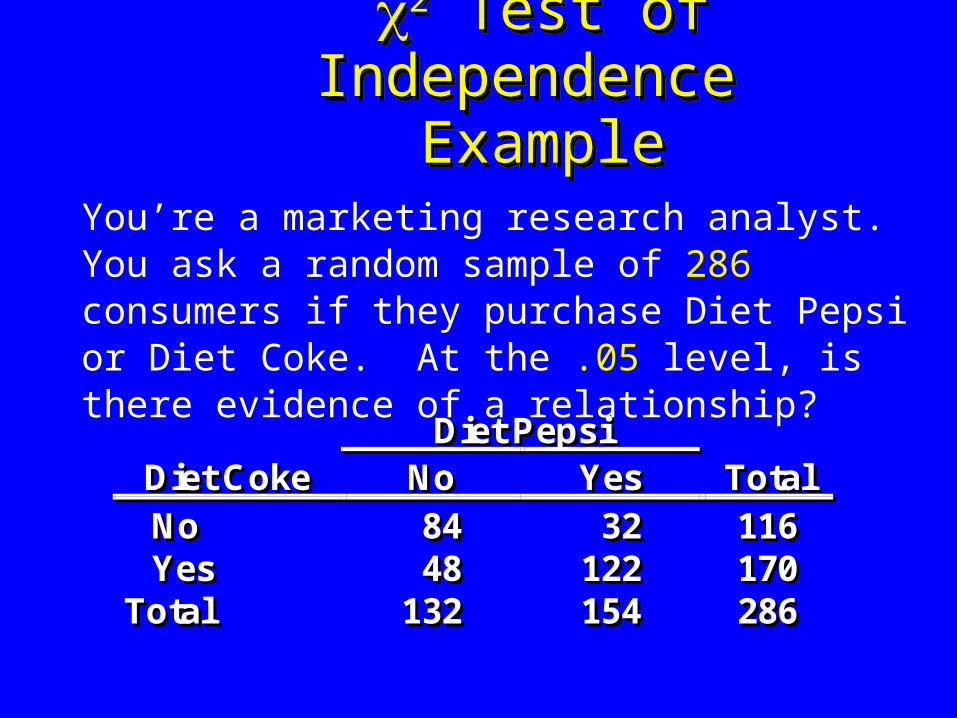
Diet PepsiDiet Coke No Yes TotalNo 84 32 116Yes 48 122 170
Total 132 154 286
Diet PepsiDiet Coke No Yes TotalNo 84 32 116Yes 48 122 170
Total 132 154 286
You’re a marketing research analyst. You ask a random sample of 286 consumers if they purchase Diet Pepsi or Diet Coke. At the .05 level, is there evidence of a relationship?
2 Test of Independence Example
2 Test of Independence Example

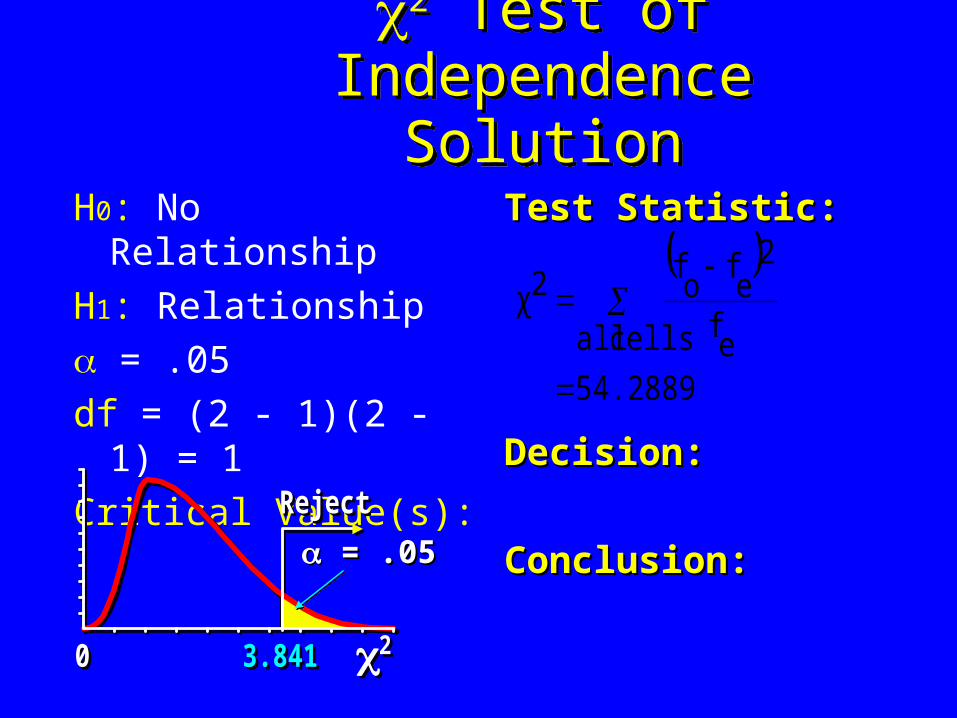
2 Test of Independence Solution
2 Test of Independence Solution
H0: No Relationship
H1: Relationship
= .05
df = (2 - 1)(2 - 1) = 1
Critical Value(s):
Test Statistic: Test Statistic:
Decision:Decision:
Conclusion:Conclusion:
20 3.841
Reject
20 3.841
Reject
= .05= .05
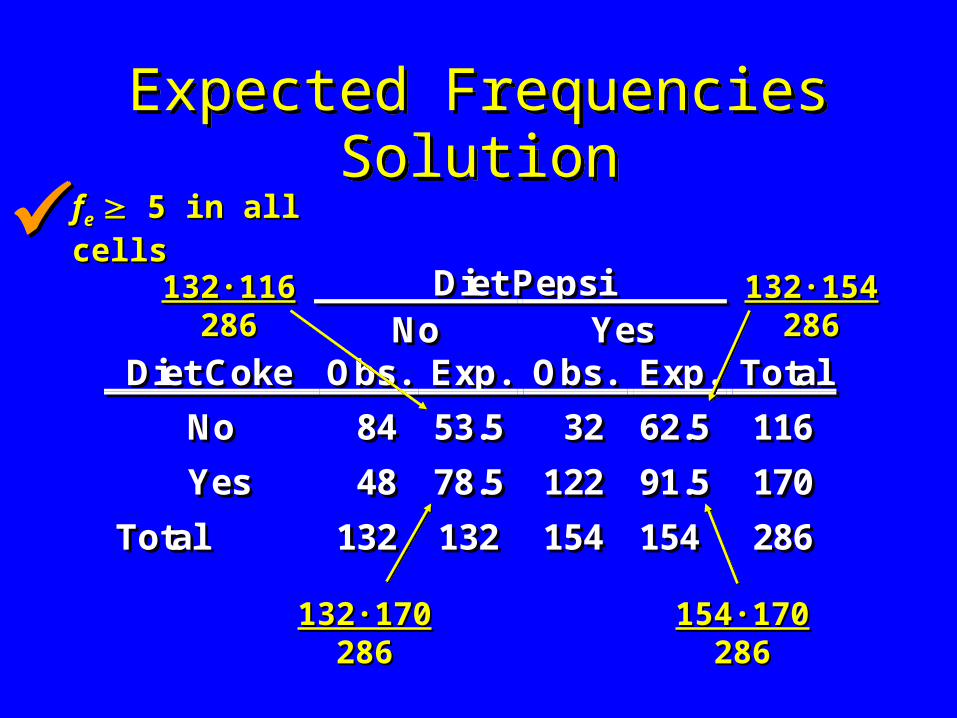
Diet PepsiNo Yes
Diet Coke Obs. Exp. Obs. Exp. Total
No 84 53.5 32 62.5 116
Yes 48 78.5 122 91.5 170
Total 132 132 154 154 286
Diet PepsiNo Yes
Diet Coke Obs. Exp. Obs. Exp. Total
No 84 53.5 32 62.5 116
Yes 48 78.5 122 91.5 170
Total 132 132 154 154 286
Expected Frequencies SolutionExpected Frequencies Solutionffee 5 in all cells 5 in all cells
132·170132·170286286
154·170154·170286286
132·116132·116286286
132·154132·154286286

2 Test of Independence Test Statistic Solution
2 Test of Independence Test Statistic Solution
Cell fo fe fo - fe (fo - fe)² (fo - fe)²/ fe
1,1 84 53.5 +30.5 930.25 17.3879
1,2 32 62.5 -30.5 930.25 14.8840
2,1 48 78.5 -30.5 930.25 11.8503
2,2 122 91.5 +30.5 930.25 10.1667
Total 286 286 54.2889
Cell fo fe fo - fe (fo - fe)² (fo - fe)²/ fe
1,1 84 53.5 +30.5 930.25 17.3879
1,2 32 62.5 -30.5 930.25 14.8840
2,1 48 78.5 -30.5 930.25 11.8503
2,2 122 91.5 +30.5 930.25 10.1667
Total 286 286 54.2889
2 Test of Independence Solution
2 Test of Independence Solution
H0: No Relationship
H1: Relationship
= .05
df = (2 - 1)(2 - 1) = 1
Critical Value(s):
Test Statistic: Test Statistic:
Decision:Decision:
Conclusion:Conclusion:
20 3.841
Reject
20 3.841
Reject
= .05= .05
54.2889
cells all ef
2e
fo
f2χ
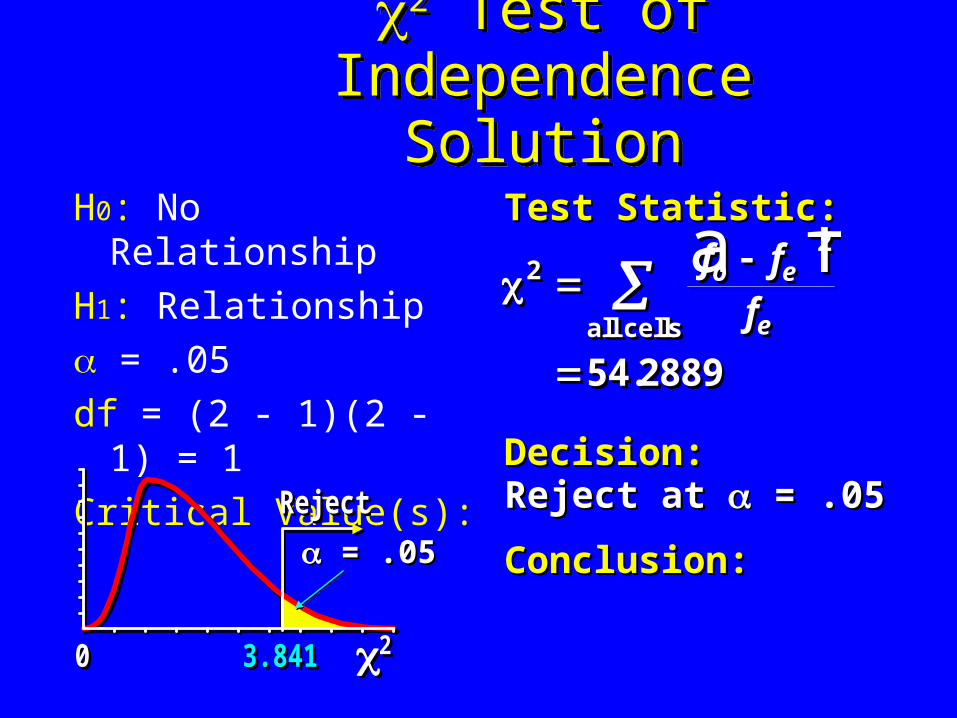
2 Test of Independence Solution
2 Test of Independence Solution
H0: No Relationship
H1: Relationship
= .05
df = (2 - 1)(2 - 1) = 1
Critical Value(s):
Test Statistic: Test Statistic:
Decision:Decision:
Conclusion:Conclusion:
Reject at Reject at = .05 = .05
20 3.841
Reject
20 3.841
Reject
= .05= .05
22
54 2889
f f
fo e
e
a fall cells
.
22
54 2889
f f
fo e
e
a fall cells
.
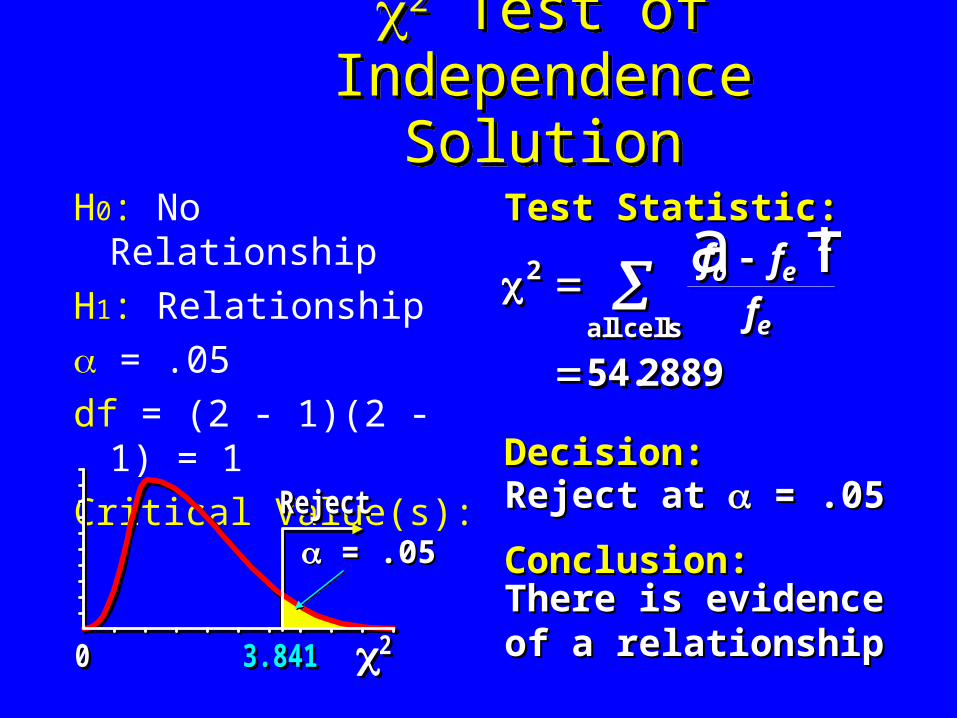
2 Test of Independence Solution
2 Test of Independence Solution
H0: No Relationship
H1: Relationship
= .05
df = (2 - 1)(2 - 1) = 1
Critical Value(s):
Test Statistic: Test Statistic:
Decision:Decision:
Conclusion:Conclusion:
Reject at Reject at = .05 = .05
There is evidence of a There is evidence of a relationshiprelationship20 3.841
Reject
20 3.841
Reject
= .05= .05
22
54 2889
f f
fo e
e
a fall cells
.
22
54 2889
f f
fo e
e
a fall cells
.
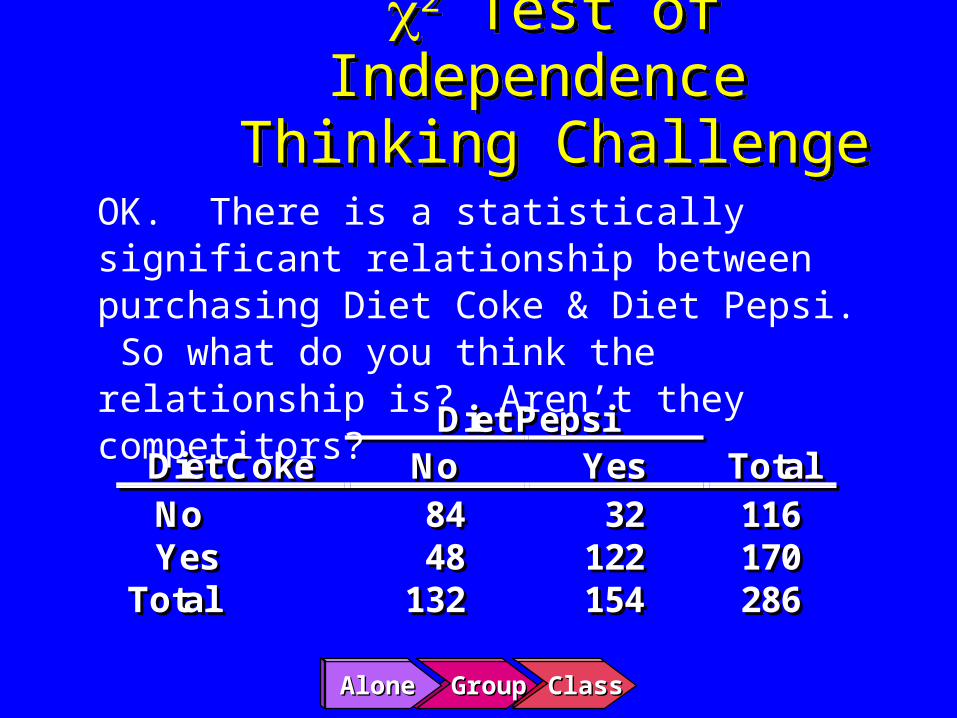
Diet PepsiDiet Coke No Yes TotalNo 84 32 116Yes 48 122 170
Total 132 154 286
Diet PepsiDiet Coke No Yes TotalNo 84 32 116Yes 48 122 170
Total 132 154 286
OK. There is a statistically significant relationship between purchasing Diet Coke & Diet Pepsi. So what do you think the relationship is? Aren’t they competitors?
2 Test of Independence Thinking Challenge
2 Test of Independence Thinking Challenge
AloneAlone GroupGroup Class Class

Diet PepsiDiet Coke No Yes TotalNo 80 2 82Yes 8 120 128
Total 88 122 210
Diet PepsiDiet Coke No Yes TotalNo 4 30 34Yes 40 2 42
Total 44 32 76
You Re-Analyze the DataYou Re-Analyze the Data
Low Low IncomeIncome
High High IncomeIncome
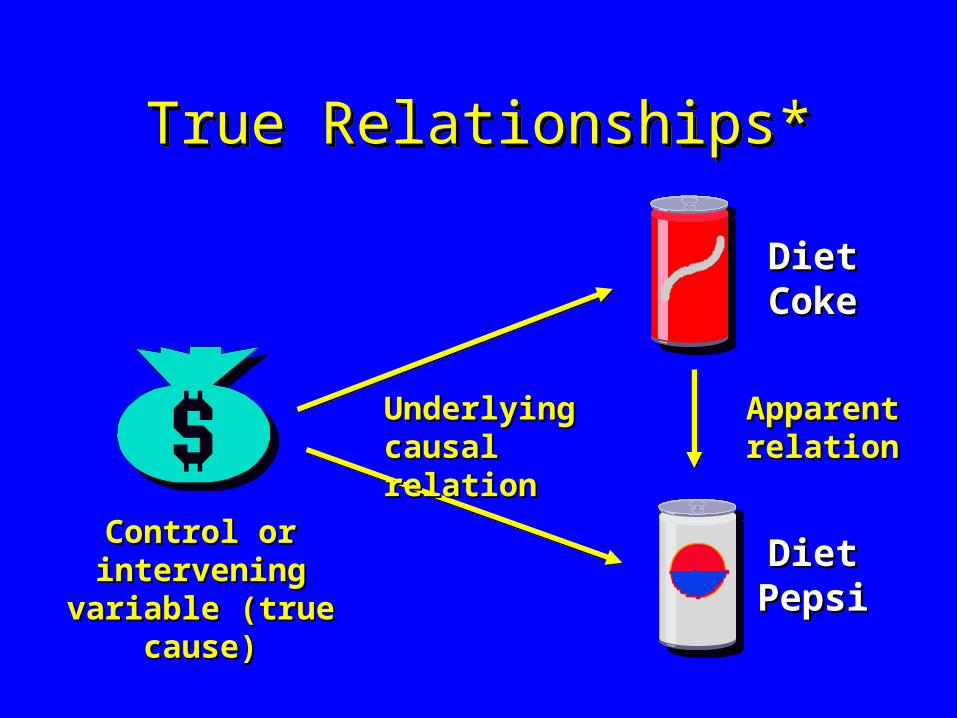
True Relationships*True Relationships*
Apparent Apparent relationrelation
Underlying Underlying causal relationcausal relation
Control or Control or intervening variable intervening variable
(true cause)(true cause)
Diet Diet CokeCoke
Diet Diet PepsiPepsi

Moral of the Story*Moral of the Story*
Numbers don’t think - People do!
© 1984-1994 T/Maker Co.

This Class...This Class...
• What was the most important thing you learned in class today?
• What do you still have questions about?
• How can today’s class be improved?
Please take a moment to answer the Please take a moment to answer the following questions in writing:following questions in writing: